 filings.tools
Item 5. MARKET FOR REGISTRANT'S COMMON EQUITY, RELATED STOCKHOLDER MATTERS AND ISSUER PURCHASES OF EQUITY SECURITIES
4K characters. Original on sec.gov · Markdown
Item 5. MARKET FOR REGISTRANT'S COMMON EQUITY, RELATED STOCKHOLDER MATTERS AND ISSUER PURCHASES OF EQUITY SECURITIES
**
**Market Information and Holders **
Our common shares are listed and traded on the NYSE under the symbol "TEL." The number of registered holders of our common shares at November 8, 2018 was 20,236.
**Performance Graph **
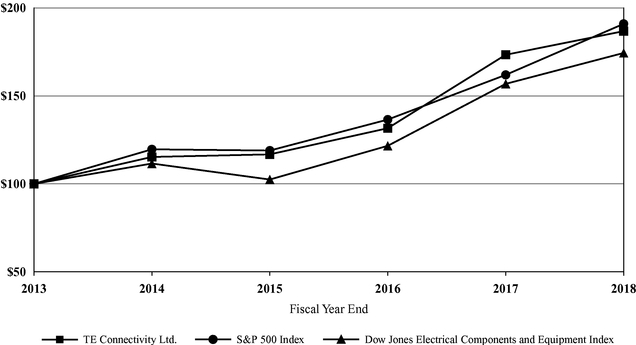
The following graph compares the cumulative total shareholder return on our common shares against the cumulative return on the S&P 500 Index and the Dow Jones Electrical Components and Equipment Index. The graph assumes the investment of $100 in our common shares and in each index at fiscal year end 2013 and assumes the reinvestment of all dividends and distributions. The graph shows the cumulative total return for the last five fiscal years. The comparisons in the graph are based upon historical data and are not indicative of, nor intended to forecast, future performance of our common shares.
**COMPARISON OF CUMULATIVE TOTAL RETURN AMONG TE CONNECTIVITY LTD., S&P 500 INDEX, AND DOW JONES ELECTRICAL COMPONENTS AND EQUIPMENT INDEX **
| Fiscal Year End | |||||||||||||||||||
| 2013(1) | 2014 | 2015 | 2016 | 2017 | 2018 | ||||||||||||||
| TE Connectivity Ltd. | $ | 100.00 | $ | 115.30 | $ | 116.76 | $ | 131.63 | $ | 173.37 | $ | 186.80 | |||||||
| S&P 500 Index | 100.00 | 119.64 | 118.93 | 136.54 | 161.95 | 190.95 | |||||||||||||
| Dow Jones Electrical Components and Equipment Index | 100.00 | 111.56 | 102.46 | 121.63 | 156.84 | 174.41 |
(1)
$100 invested on September 27, 2013 in TE Connectivity Ltd.'s common shares and in indexes. Indexes calculated on month-end basis.
**Issuer Purchases of Equity Securities **
The following table presents information about our purchases of our common shares during the quarter ended September 28, 2018:
| Period | Total Number of Shares Purchased(1) | Average Price Paid Per Share(1) | Total Number of Shares Purchased as Part of Publicly Announced Plans or Programs(2) | Maximum Approximate Dollar Value of Shares that May Yet Be Purchased Under the Plans or Programs(2) | |||||||||
| June 30–July 27, 2018 | 1,465 | $ | 93.28 | — | $ | 1,368,819,073 | |||||||
| July 28–August 31, 2018 | 2,217,725 | 92.90 | 2,213,500 | 1,163,190,015 | |||||||||
| September 1–September 28, 2018 | 1,655,395 | 90.63 | 1,635,400 | 1,014,947,770 | |||||||||
| | | | | | | | | | | | | | |
| Total | 3,874,585 | $ | 91.93 | 3,848,900 | |||||||||
| | | | | | | | | | | | | | |
| | | | | | | | | | | | | | |
| | | | | | | | | | | | | | |
(1)
These columns include the following transactions which occurred during the quarter ended September 28, 2018:
(i)
the acquisition of 25,685 common shares from individuals in order to satisfy tax withholding requirements in connection with the vesting of restricted share awards issued under equity compensation plans; and
(ii)
open market purchases totaling 3,848,900 common shares, summarized on a trade-date basis, in conjunction with the share repurchase program announced in September 2007.
(2)
Our share repurchase program authorizes us to purchase a portion of our outstanding common shares from time to time through open market or private transactions, depending on business and market conditions. The share repurchase program does not have an expiration date.
Previous: Item 3. LEGAL PROCEEDINGS · Next: Item 6. SELECTED FINANCIAL DATA