 filings.tools
Item 5. MARKET FOR REGISTRANT'S COMMON EQUITY, RELATED STOCKHOLDER MATTERS AND ISSUER PURCHASES OF EQUITY SECURITIES
12K characters. Original on sec.gov · Markdown
Item 5. MARKET FOR REGISTRANT'S COMMON EQUITY, RELATED STOCKHOLDER MATTERS AND ISSUER PURCHASES OF EQUITY SECURITIES
Truist’s common stock is traded on the NYSE under the symbol "TFC." As of December 31, 2021, Truist’s common stock was held by 87,467 registered shareholders.
Common Stock
Truist’s ability to pay dividends is primarily dependent on earnings from operations, the adequacy of capital and the availability of liquid assets for distribution and is subject to its capital plan meeting the SCB requirements from the FRB. Truist’s ability to generate liquid assets for distribution is dependent on the ability of Truist Bank to pay dividends to the Parent Company. The payment of cash dividends is an integral part of providing a competitive return on shareholders' investments and needs to be balanced with maintaining sufficient capital to support future growth and meet regulatory requirements.
Management’s target common dividend payout ratio (computed by dividing common stock dividends by net income available to common shareholders) is between 30% and 50% during normal economic conditions. Truist’s common dividend payout ratio was 41% in 2021 compared to 58% in 2020 and 43% in 2019. Truist expects common dividend declarations, if made, to occur in January, April, July, and October with payment dates on or about the first of March, June, September and December. A discussion of dividend restrictions is included in "Note 17. Regulatory Requirements and Other Restrictions" and in the "Regulatory Considerations" section.
Share Repurchases
Truist has periodically repurchased shares of its own common stock. Truist would expect to periodically repurchase shares in the future, to the extent the Company has excess capital and does not have sufficient investment opportunities in the form of organic growth and / or acquisitions. In accordance with North Carolina law, repurchased shares cannot be held as treasury stock, but revert to the status of authorized and unissued shares upon repurchase. Repurchases may be effected through open market purchases, privately negotiated transactions, trading plans established in accordance with SEC rules or other means. The timing and exact amount of repurchases are subject to various factors, including the Company’s capital position, liquidity, financial performance, alternative uses of capital, stock trading price and general market conditions, and may be suspended at any time. Shares repurchased constitute authorized but unissued shares of the Company and are therefore available for future issuances. During 2021, the Company repurchased 27.6 million shares of common stock totaling $1.6 billion through open market purchases and shares exchanged or surrendered in connection with the exercise of equity-based awards.
| Table 5: Share Repurchase Activity | |||||||||||||||||||||||
| (Dollars in millions, except per share data, shares in thousands) | Total Shares Repurchased (1) | Average Price Paid Per Share (2) | Total Shares Repurchased Pursuant to Publicly-Announced Plan (3) | Maximum Remaining Dollar Value of Shares Available for Repurchase Pursuant to Publicly-Announced Plan | |||||||||||||||||||
| October 2021 | 4,277 | $ | 63.56 | 4,277 | $ | 2,793 | |||||||||||||||||
| November 2021 | 3,545 | 64.37 | 3,545 | 2,565 | |||||||||||||||||||
| December 2021 | — | — | — | 2,565 | |||||||||||||||||||
| Total | 7,822 | 63.93 | 7,822 |
(1)Includes shares exchanged or surrendered in connection with the exercise of equity-based awards under equity-based compensation plans.
(2)Excludes commissions.
(3)Pursuant to the 2020 Repurchase Plan, announced in December 2020, authorizing up to $2.0 billion of share repurchases beginning in the first quarter of 2021. In June 2021, the Board of Directors increased, effective July 1, 2021, the previous repurchase authority to effectuate repurchases up to an additional $2.2 billion in shares of the Company’s common stock through September 30, 2022 (up to $4.2 billion in aggregate amount). With the additional authorization, the Company has $2.6 billion remaining for share repurchases.
36 Truist Financial Corporation
Preferred Stock
Issuances
During 2020, Truist issued $3.5 billion in series O, series P, series Q, and series R preferred stock, gross of issuance cost, to further strengthen its capital position. During 2019, the Company issued $1.7 billion of series N non-cumulative perpetual preferred stock.
Upon closing of the Merger, each outstanding share of SunTrust perpetual preferred stock was converted into the right to receive one share of an applicable newly issued series of Truist preferred stock having substantially the same terms as such share of SunTrust preferred stock. The Company issued series I, J, K, L and M non-cumulative perpetual preferred stock with a total par and fair value of $2.0 billion on the Merger closing date.
Redemptions
During 2021, the Company redeemed all 18,000 outstanding shares of its perpetual preferred stock series F and the corresponding depositary shares representing fractional interests in such series for $450 million, all 20,000 outstanding shares of its perpetual preferred stock series G and the corresponding depositary shares representing fractional interests in such series for $500 million, and all 18,600 outstanding shares of its perpetual preferred stock series H and the corresponding depositary shares representing fractional interests in such series for $465 million.
During 2020, the Company redeemed all 5,000 outstanding shares of its perpetual preferred stock series K and the corresponding depositary shares representing fractional interests in such series for $500 million plus any unpaid dividends. The preferred stock redemption was in accordance with the terms of the Company’s Articles of Amendment to its Articles of Incorporation, effective as of December 6, 2019.
During 2019, the Company redeemed all 23,000 outstanding shares of series D and 46,000 outstanding shares of series E non-cumulative perpetual preferred stock and the corresponding depositary shares representing fractional interests in each such series for $1.7 billion.
See "Note 12. Shareholders’ Equity" for information about preferred stock.
Equity Compensation Plan Information
The following table provides information concerning securities to be issued upon the exercise of outstanding equity-based awards as of December 31, 2021:
| Table 6: Equity Compensation Plan Information | ||||||||||||||||||||
| Plan Category | (a)(1)(2) Number of securities to be issued upon exercise of outstanding options, warrants and rights | (b)(3) Weighted-average exercise price of outstanding options, warrants and rights | (c)(4) Number of securities remaining available for future issuance under equity compensation plans (excluding securities reflected in (a)) | |||||||||||||||||
| Approved by security holders | 11,669,654 | $ | 32.89 | 4,884,430 | ||||||||||||||||
| Not approved by security holders | 6,472,392 | 22.42 | 8,261,255 | |||||||||||||||||
| Total | 18,142,046 | $ | 29.74 | 13,145,685 |
(1)Includes 10,913,889 RSUs and PSUs in plans approved by security holders.
(2)Plans not approved by security holders consists of 325,263 options outstanding with a weighted average exercise price of $22.42 and 6,147,129 RSUs for plans that were assumed in mergers and acquisitions.
(3)Excludes RSUs and PSUs because they do not have an exercise price.
(4)Plans not approved by security holders consists of shares of common stock issuable pursuant to the 2012 Incentive Plan, as amended, in respect of shares reserved for issuance under the SunTrust Banks, Inc. 2018 Omnibus Incentive Compensation Plan. Awards with respect to such shares may only be granted to heritage SunTrust teammates.
Truist Financial Corporation 37
Five-Year Common Stock Performance
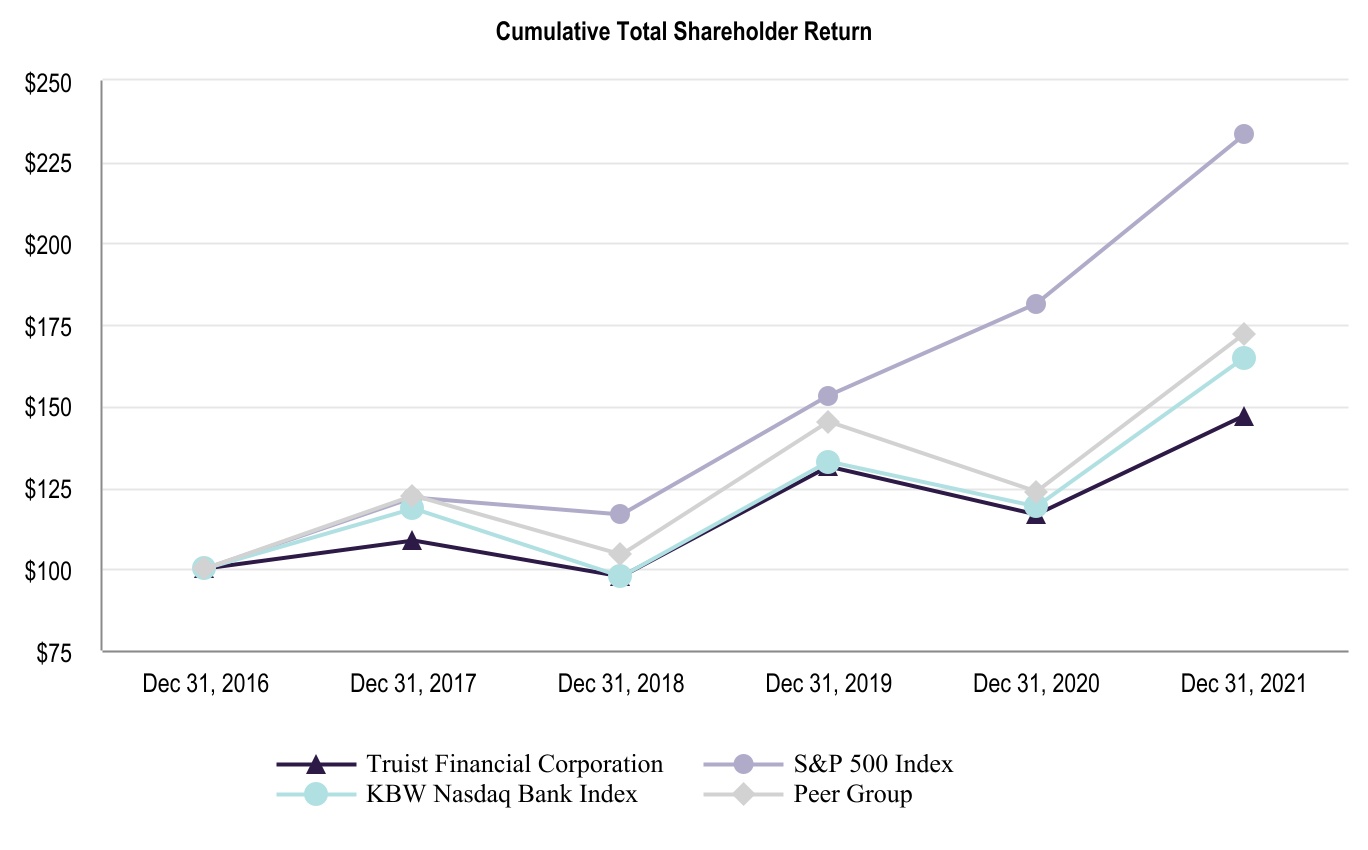
The following graph and table compare the cumulative total shareholder return of the Company’s common stock, the S&P 500 Index, the KBW Nasdaq Bank Index, and the Truist peer group for the five years ended December 31, 2021. The Company is a component of both indexes. The graph and table assume an initial investment of $100 was made on December 31, 2016 in each of the Company’s common stock, the indexes, and the peer group, as well as reinvestment of all dividends without commissions. The Truist peer group consists of Bank of America Corporation; Citizens Financial Group, Inc.; Fifth Third Bancorp; JPMorgan Chase & Co.; KeyCorp; M&T Bank Corporation; The PNC Financial Services Group, Inc.; Regions Financial Corporation; U.S. Bancorp; and Wells Fargo & Company.
| Table 7: Cumulative Total Shareholder Return | ||||||||||||||||||||||||||||||||||||||||||||
| Invested | Cumulative Total Return | |||||||||||||||||||||||||||||||||||||||||||
| As of / Through December 31, | 2016 | 2017 | 2018 | 2019 | 2020 | 2021 | ||||||||||||||||||||||||||||||||||||||
| Truist Financial Corporation | $ | 100.00 | $ | 108.67 | $ | 97.57 | $ | 131.25 | $ | 116.64 | $ | 147.05 | ||||||||||||||||||||||||||||||||
| S&P 500 Index | 100.00 | 121.82 | 116.47 | 153.13 | 181.29 | 233.28 | ||||||||||||||||||||||||||||||||||||||
| KBW Nasdaq Bank Index | 100.00 | 118.59 | 97.59 | 132.84 | 119.15 | 164.83 | ||||||||||||||||||||||||||||||||||||||
| Peer Group | 100.00 | 122.32 | 104.43 | 145.11 | 123.60 | 172.29 |
38 Truist Financial Corporation
Previous: Item 2. PROPERTIES · Next: Item 7. MANAGEMENT’S DISCUSSION AND ANALYSIS OF FINANCIAL CONDITION AND RESULTS OF OPERATIONS