 filings.tools
Item 2. MANAGEMENT’S DISCUSSION AND ANALYSIS OF FINANCIAL CONDITION AND RESULTS OF OPERATIONS
197K characters. Original on sec.gov · Markdown
Item 2. MANAGEMENT’S DISCUSSION AND ANALYSIS OF FINANCIAL CONDITION AND RESULTS OF OPERATIONS
MD&A is intended to assist readers in their analysis of the accompanying Consolidated Financial Statements and supplemental financial information. It should be read in conjunction with the Consolidated Financial Statements, the accompanying Notes to the Consolidated Financial Statements in this Form 10-Q, other information contained in this document, as well as with Truist’s Annual Report on Form 10-K for the year ended December 31, 2022.
A description of certain factors that may affect our future results and risk factors is set forth in Part I, Item 1A-Risk Factors in our Annual Report on Form 10-K for the year ended December 31, 2022.
Regulatory Considerations
The regulatory framework applicable to banking organizations is intended primarily for the protection of depositors and the stability of the financial system, rather than for the protection of shareholders and creditors. Truist is subject to banking laws and regulations, and various other laws and regulations, which affect the operations and management of Truist and its ability to make distributions to shareholders. Truist and its subsidiaries are also subject to supervision and examination by multiple regulators. The descriptions below summarize certain updates since the filing of the Annual Report on Form 10-K for the year ended December 31, 2022 to state and federal laws to which Truist is subject. These descriptions do not summarize all possible or proposed changes in current laws or regulations and are not intended to be a substitute for the related statues or regulatory provisions. Refer to Truist’s Annual Report on Form 10-K for the year ended December 31, 2022 for additional disclosures.
In March 2023, the FRB created the Bank Term Funding Program to support American businesses and households by making additional funding available to eligible depository institutions. This program offers loans up to one year in length to banks, savings associations, credit unions, and other eligible depository institutions pledging any collateral eligible for purchase by the FRB in open market operations, such as U.S. Treasuries, U.S. agency securities, and U.S. agency mortgage-backed securities. These assets are valued at par.
In July 2023, the SEC finalized rules requiring registrants to disclose material cybersecurity incidents that they experience on Form 8-K and to disclose on an annual basis material information regarding their cybersecurity risk management, strategy, and governance. Annual disclosures will be required in Truist’s Annual Report on Form 10-K for the year ended 2023. The Form 8-K disclosure requirements will become effective beginning on December 18, 2023.
Banking agencies have proposed certain actions described below. We continue to evaluate these proposals and the potential impacts, if adopted as proposed, on the Company and Truist Bank.
In July 2023, the U.S. banking regulators issued a proposal to revise the risk-based capital standards applicable to the Company and Truist Bank. This proposal would introduce new approaches for credit risk, operational risk, market risk and credit valuation adjustment risk that generally align with the approaches for these risks under the global Basel Accord adopted by the Basel Committee. The proposal would introduce a new measure of risk-weighted assets, which would reflect the proposed new standardized approaches for credit risk, operational risk and credit valuation adjustment risk, as well as a proposed new measure for market risk that would be based on both internal models and standardized supervisory models of market risk. The proposal includes a proposed effective date of July 1, 2025, subject to a three-year transition period ending July 1, 2028, over which the expanded total risk-weighted assets would be phased in.
In August 2023, the U.S. banking regulators proposed a rule that would require banking organizations with $100 billion or more in total assets to comply with long-term debt requirements and clean holding company requirements that currently apply only to global systemically important banking organizations. This proposal would also impose a long-term debt requirement on certain categories of insured depository institutions that are not consolidated subsidiaries of U.S. GSIBs, including insured depository institutions with $100 billion or more in total assets, such as Truist Bank. If adopted, this proposal would require the Company and Truist Bank to each maintain a minimum outstanding eligible long-term debt amount of no less than the greatest of (i) 6% of risk-weighted assets, (ii) 2.5% of total leverage exposure and (iii) 3.5% of average total consolidated assets. Truist Bank would be required to issue the minimum amount of eligible long-term debt to the Company, and the Company would be required to issue the minimum amount of eligible long-term debt externally. In addition, if adopted as proposed, the clean holding company requirement would limit or prohibit the Company from entering into certain transactions that could impede its orderly resolution, including, for example, prohibiting the Company from entering into transactions that could spread losses to subsidiaries and third parties, as well as limiting the amount of the Company’s liabilities that are not eligible long-term debt.
Truist Financial Corporation 45
In August 2023, the FDIC issued a proposal to amend its rules requiring covered insured depository institutions, including Truist Bank, to periodically submit resolution plans to the FDIC. If adopted as proposed, Truist Bank would be required to submit a full resolution plan to the FDIC every two years and submit an interim supplement in each year that it is not required to submit a full resolution plan. In addition, this proposal would increase the content requirements for plan submissions and introduce a new credibility standard for the FDIC’s evaluation of resolution plans, which would be enforceable against the covered insured depository institutions. Separately, the FRB and FDIC also proposed updated guidance on resolution planning requirements applicable to the Company under Section 165(d) of the Dodd-Frank Act.
In addition, the FDIC proposed a special assessment to repay losses to the FDIC’s Deposit Insurance Fund. If the final rule is adopted as proposed, the special assessment for Truist is estimated at approximately $460 million to be recognized at the time the rule is finalized and paid in eight quarterly installments beginning in the first quarter of 2024. Refer to the “Note 14. Commitments and Contingencies” for additional information related to the FDIC’s special assessments.
Executive Overview
The transformative work we announced in the third quarter to improve our financial performance is well underway. We are driving swift and meaningful actions to simplify our organization and reduce expenses. Our continued focus on core clients, paring back non-core and lower-return portfolios, and paying down higher-cost borrowings has made our balance sheet more efficient and helped drive a modest improvement in our net interest margin.
Noninterest expense was flat compared to the second quarter, and down 50 basis points on an adjusted basis, reflecting our expense discipline. Our $750 million gross cost saves program and efforts to simplify the organization are underway and we are focused on expense discipline while also investing in our core franchise and risk management systems.
Our cost save program includes:
- Reductions in force
◦Spans and layers
◦Consolidation of redundant/similar functions
◦Select business restructuring
◦Geographic simplification
- Organizational alignment and simplification
◦Consolidate businesses for operational efficiency
◦More efficient branch network and staffing structure
◦Simplified and streamlined compensation and benefits programs
◦Reallocate investments to core businesses
- Rationalize technology spend
◦Focus on opportunities in core businesses
We remain strongly committed to improving our capital position, which increased 29 basis points in the third quarter. Asset quality continues to normalize but remains in-line with our expectations and allowance coverage ratios.
As we continue to diligently execute on this critical work to capitalize on our competitive advantages and drive efficiencies, we are fundamentally changing how we operate to drive revenue growth, franchise value and increased benefit to our shareholders, now and into the future.
On October 2, 2023, Truist announced changes to its Board of Directors. On December 31, 2023, the retirements of directors Kelly S. King, Nido R. Qubein, David M. Ratcliffe and Thomas N. Thompson will occur due to these directors reaching Truist’s mandatory retirement age. In addition, Board members Anna R. Cablik, Paul D. Donahue, Easter A. Maynard and Frank P. Scruggs, Jr. notified Truist on September 26, 2023, that they have chosen to conclude their service as directors effective as of December 31, 2023. Their decisions are to address other professional and personal commitments and are not due to any disagreement with Truist on any matter relating to Truist’s operations, policies or practices. The Board and Truist’s management express their deep appreciation to these directors for their dedicated service and many significant contributions to Truist.
46 Truist Financial Corporation
Financial Results
Net income available to common shareholders for the third quarter of 2023 of $1.1 billion was down 30% compared with the third quarter of 2022. On a diluted per common share basis, earnings for the third quarter of 2023 were $0.80, a decrease of $0.35, or 30%, compared to the third quarter of 2022. Truist’s results of operations for the third quarter of 2023 produced an annualized return on average assets of 0.86% and an annualized return on average common shareholders’ equity of 7.5% compared to prior year returns of 1.19% and 10.7%, respectively.
-
Results for the third quarter of 2023 included merger-related and restructuring charges of $75 million ($58 million after-tax, or $0.04 per share).
-
Results for the third quarter of 2022 included $62 million ($48 million after-tax, or $0.04 per share) of merger-related and restructuring charges and $90 million ($69 million after-tax, or $0.05 per share) of incremental operating expenses related to the Merger.
Taxable-equivalent net interest income for the third quarter of 2023 was down $162 million, or 4.3%, compared to the third quarter of 2022 primarily due to higher funding costs and lower purchase accounting accretion, partially offset by higher market interest rates. Net interest margin was 2.95%, down 17 basis points.
-
The yield on the total loan portfolio was 6.25%, up 176 basis points, primarily reflecting higher market interest rates, partially offset by lower purchase accounting accretion. The yield on the average securities portfolio was 2.26%, up 31 basis points primarily due to the higher rate environment. Average deposits decreased $19.1 billion, or 4.5%, average short-term borrowings increased $7.5 billion, and average long-term debt increased $12.0 billion.
-
The average cost of total deposits was 1.81%, up 150 basis points. The average cost of short-term borrowings was 5.47%, up 313 basis points. The average cost of long-term debt was 4.51%, up 208 basis points. The increase in rates on deposits and other funding sources was largely attributable to the higher rate environment.
Noninterest income was relatively stable compared to the third quarter of 2022 due to higher other income and insurance income, partially offset by lower service charges on deposits and lower investment banking and trading income. Service charges on deposits include an $87 million reduction due to client refund accruals resulting from a revision in deposit service fee protocols.
Noninterest expense was up $134 million, or 3.7%, compared to the third quarter of 2022 due to higher personnel expense, other expense, and regulatory costs, partially offset by lower professional fees and outside processing, marketing and customer development, and equipment expenses. Merger-related costs, which included merger-related and restructuring charges, as well as incremental operating expenses related to the merger, decreased $77 million, primarily due to the completion of integration-related activities. Adjusted noninterest expenses, which exclude merger-related costs, the amortization of intangibles, and gains and losses on the early extinguishment of debt, increased $221 million, or 6.7%, and includes the impact of $70 million of higher other expenses due to costs associated with the change to the deposit service fee protocols and resolution of certain legal matters.
The effective tax rate decreased compared to the third quarter of 2022 primarily driven by decreases in the full year forecasted effective tax rate, partially offset by changes in discrete tax items.
An increase in the loan loss reserve reflects normalization of asset quality.
-
Nonperforming loans and leases held for investment were 0.46% of loans and leases held for investment at September 30, 2023, down one basis point compared to June 30, 2023.
-
The allowance for credit losses was $5.0 billion and includes $4.7 billion for the allowance for loan and lease losses and $277 million for the reserve for unfunded commitments. The ALLL ratio was 1.49%, up six basis points compared with June 30, 2023.
-
The provision for credit losses was $497 million compared to $234 million for the third quarter of 2022. The increase in the current quarter provision expense primarily reflects higher net charge-offs and an allowance build.
-
The net charge-off ratio was 51 basis points, up 24 basis points compared to the third quarter of 2022 due to higher charge-offs in the CRE, commercial and industrial, and indirect auto portfolios.
Capital strengthened during the third quarter of 2023.
-
Truist’s CET1 ratio was 9.9% as of September 30, 2023. The increase since June 30, 2023 resulted from organic capital generation and RWA optimization.
-
Truist declared common dividends of $0.52 per share during the third quarter of 2023. The dividend payout ratio for the third quarter of 2023 was 65%. Truist did not repurchase any shares in the third quarter of 2023.
-
Truist’s average consolidated LCR was 110% for the three months ended September 30, 2023, compared to the regulatory minimum of 100%.
Truist Financial Corporation 47
Analysis of Results of Operations
Net Interest Income and NIM
Taxable-equivalent net interest income for the third quarter of 2023 was down $162 million, or 4.3%, compared to the third quarter of 2022 primarily due to higher funding costs and lower purchase accounting accretion, partially offset by higher market interest rates. Net interest margin was 2.95%, down 17 basis points.
-
Average earning assets increased $6.4 billion, or 1.3%, primarily due to growth in average total loans of $8.0 billion, or 2.6%, and growth in other earning assets of $9.4 billion, or 48%, primarily due to an increase in balances held at the Federal Reserve to support liquidity, partially offset by a decrease in average securities of $9.9 billion, or 6.8%.
-
The yield on the total loan portfolio was 6.25%, up 176 basis points, primarily reflecting higher market interest rates, partially offset by lower purchase accounting accretion. The yield on the average securities portfolio was 2.26%, up 31 basis points primarily due to the higher rate environment.
-
Average deposits decreased $19.1 billion, or 4.5%, average short-term borrowings increased $7.5 billion, and average long-term debt increased $12.0 billion.
-
The average cost of total deposits was 1.81%, up 150 basis points. The average cost of short-term borrowings was 5.47%, up 313 basis points. The average cost of long-term debt was 4.51%, up 208 basis points. The increase in rates on deposits and other funding sources was largely attributable to the higher rate environment.
Taxable-equivalent net interest income for the nine months ended September 30, 2023 was up $792 million, or 7.6%, compared to the same period in 2022 primarily due to higher market interest rates and strong loan growth. These increases were partially offset by lower purchase accounting accretion. Net interest margin was 3.01% for the nine months ended September 30, 2023, up eight basis points compared to the prior period.
-
Average earning assets increased $21.9 billion, or 4.6%, compared to the prior period primarily due to growth in average total loans of $23.7 billion, or 7.9%, and growth in other earning assets of $9.9 billion, or 50%, primarily due to an increase in balances held at the Federal Reserve to support liquidity build, partially offset by a $10.8 billion, or 7.2%, decrease in average securities.
-
The yield on the total loan portfolio was 6.04% for the nine months ended September 30, 2023, up 200 basis points, compared to the prior period primarily reflecting higher market interest rates, partially offset by lower purchase accounting accretion. The yield on the average securities portfolio was 2.19% for the nine months ended September 30, 2023, up 37 basis points compared to the prior period primarily due to the higher rate environment.
-
Average deposits decreased $16.6 billion, or 4.0%, while average short-term borrowings increased $13.0 billion, or 114%, compared to the prior period and average long-term debt increased $20.0 billion, or 61%.
-
The average cost of total deposits was 1.48% for the nine months ended September 30, 2023, up 133 basis points compared to the prior period. The average cost of short-term borrowings was 5.13% for the nine months ended September 30, 2023, up 345 basis points compared to the prior period. The average cost on long-term debt was 4.41% for the nine months ended September 30, 2023, up 253 basis points compared to the prior period. The increases in rates on deposits and other funding sources was largely attributable to the higher rate environment.
As of September 30, 2023, the remaining unamortized fair value marks on the loan and lease portfolio and long-term debt were $528 million and $49 million, respectively. As of December 31, 2022, the remaining unamortized fair value marks on the loan and lease portfolio and long-term debt were $741 million and $81 million, respectively.
The remaining unamortized purchase accounting fair value mark on loans and leases consists of $367 million for consumer loans and leases, and $161 million for commercial loans and leases. These amounts will be recognized over the remaining contractual lives of the underlying instruments or as paydowns occur.
The major components of net interest income and the related annualized yields as well as the variances between the periods caused by changes in interest rates versus changes in volumes are summarized below.
48 Truist Financial Corporation
| Table 1-1: Taxable-Equivalent Net Interest Income and Rate / Volume Analysis | |||||||||||||||||||||||||||||||||||||||||||||||||||||
| Three Months Ended September 30, (Dollars in millions) | Average Balances**(1)** | Annualized Yield/Rate**(2)** | Income/Expense | Incr. (Decr.) | Change due to | ||||||||||||||||||||||||||||||||||||||||||||||||
| 2023 | 2022 | 2023 | 2022 | 2023 | 2022 | Rate | Volume | ||||||||||||||||||||||||||||||||||||||||||||||
| Assets | |||||||||||||||||||||||||||||||||||||||||||||||||||||
| AFS and HTM securities at amortized cost: | |||||||||||||||||||||||||||||||||||||||||||||||||||||
| U.S. Treasury | $ | 10,886 | $ | 10,925 | 1.27 | % | 0.93 | % | $ | 34 | $ | 26 | $ | 8 | $ | 8 | $ | — | |||||||||||||||||||||||||||||||||||
| GSE | 339 | 305 | 2.92 | 2.56 | 3 | 1 | 2 | 1 | 1 | ||||||||||||||||||||||||||||||||||||||||||||
| Agency MBS | 120,078 | 129,703 | 2.33 | 2.02 | 701 | 655 | 46 | 97 | (51) | ||||||||||||||||||||||||||||||||||||||||||||
| States and political subdivisions | 423 | 395 | 4.12 | 3.92 | 4 | 4 | — | — | — | ||||||||||||||||||||||||||||||||||||||||||||
| Non-agency MBS | 3,781 | 4,016 | 2.33 | 2.32 | 22 | 24 | (2) | — | (2) | ||||||||||||||||||||||||||||||||||||||||||||
| Other | 20 | 52 | 5.55 | 3.94 | 1 | — | 1 | — | 1 | ||||||||||||||||||||||||||||||||||||||||||||
| Total securities | 135,527 | 145,396 | 2.26 | 1.95 | 765 | 710 | 55 | 106 | (51) | ||||||||||||||||||||||||||||||||||||||||||||
| Interest earning trading assets | 4,380 | 5,446 | 6.91 | 4.49 | 76 | 62 | 14 | 28 | (14) | ||||||||||||||||||||||||||||||||||||||||||||
| Other earning assets(3) | 29,006 | 19,631 | 5.68 | 2.24 | 415 | 109 | 306 | 234 | 72 | ||||||||||||||||||||||||||||||||||||||||||||
| Loans and leases, net of unearned income: | |||||||||||||||||||||||||||||||||||||||||||||||||||||
| Commercial and industrial | 164,022 | 152,123 | 6.50 | 4.08 | 2,686 | 1,564 | 1,122 | 991 | 131 | ||||||||||||||||||||||||||||||||||||||||||||
| CRE | 22,812 | 22,245 | 6.85 | 4.32 | 396 | 245 | 151 | 145 | 6 | ||||||||||||||||||||||||||||||||||||||||||||
| Commercial Construction | 6,194 | 5,284 | 7.83 | 4.83 | 120 | 62 | 58 | 45 | 13 | ||||||||||||||||||||||||||||||||||||||||||||
| Residential mortgage | 56,135 | 53,271 | 3.79 | 3.59 | 532 | 478 | 54 | 27 | 27 | ||||||||||||||||||||||||||||||||||||||||||||
| Home equity | 10,243 | 10,767 | 7.61 | 5.17 | 196 | 142 | 54 | 61 | (7) | ||||||||||||||||||||||||||||||||||||||||||||
| Indirect auto | 24,872 | 28,057 | 6.16 | 5.40 | 386 | 382 | 4 | 50 | (46) | ||||||||||||||||||||||||||||||||||||||||||||
| Other consumer | 28,963 | 26,927 | 7.43 | 6.21 | 542 | 419 | 123 | 88 | 35 | ||||||||||||||||||||||||||||||||||||||||||||
| Student | — | 5,958 | — | 5.64 | 1 | 85 | (84) | — | (84) | ||||||||||||||||||||||||||||||||||||||||||||
| Credit card | 4,875 | 4,755 | 11.62 | 9.97 | 143 | 119 | 24 | 21 | 3 | ||||||||||||||||||||||||||||||||||||||||||||
| Total loans and leases HFI | 318,116 | 309,387 | 6.25 | 4.49 | 5,002 | 3,496 | 1,506 | 1,428 | 78 | ||||||||||||||||||||||||||||||||||||||||||||
| LHFS | 1,765 | 2,489 | 6.20 | 4.81 | 28 | 30 | (2) | 7 | (9) | ||||||||||||||||||||||||||||||||||||||||||||
| Total loans and leases | 319,881 | 311,876 | 6.25 | 4.49 | 5,030 | 3,526 | 1,504 | 1,435 | 69 | ||||||||||||||||||||||||||||||||||||||||||||
| Total earning assets | 488,794 | 482,349 | 5.11 | 3.63 | 6,286 | 4,407 | 1,879 | 1,803 | 76 | ||||||||||||||||||||||||||||||||||||||||||||
| Nonearning assets | 58,910 | 63,257 | |||||||||||||||||||||||||||||||||||||||||||||||||||
| Total assets | $ | 547,704 | $ | 545,606 | |||||||||||||||||||||||||||||||||||||||||||||||||
| Liabilities and Shareholders’ Equity | |||||||||||||||||||||||||||||||||||||||||||||||||||||
| Interest-bearing deposits: | |||||||||||||||||||||||||||||||||||||||||||||||||||||
| Interest-checking | $ | 101,252 | $ | 111,645 | 2.29 | 0.56 | 584 | 158 | 426 | 442 | (16) | ||||||||||||||||||||||||||||||||||||||||||
| Money market and savings | 139,961 | 147,659 | 2.35 | 0.43 | 829 | 159 | 670 | 679 | (9) | ||||||||||||||||||||||||||||||||||||||||||||
| Time deposits | 40,920 | 14,751 | 4.05 | 0.40 | 418 | 14 | 404 | 338 | 66 | ||||||||||||||||||||||||||||||||||||||||||||
| Total interest-bearing deposits | 282,133 | 274,055 | 2.57 | 0.48 | 1,831 | 331 | 1,500 | 1,459 | 41 | ||||||||||||||||||||||||||||||||||||||||||||
| Short-term borrowings | 24,894 | 17,392 | 5.47 | 2.34 | 343 | 103 | 240 | 181 | 59 | ||||||||||||||||||||||||||||||||||||||||||||
| Long-term debt | 43,353 | 31,381 | 4.51 | 2.43 | 491 | 190 | 301 | 208 | 93 | ||||||||||||||||||||||||||||||||||||||||||||
| Total interest-bearing liabilities | 350,380 | 322,828 | 3.02 | 0.77 | 2,665 | 624 | 2,041 | 1,848 | 193 | ||||||||||||||||||||||||||||||||||||||||||||
| Noninterest-bearing deposits | 118,905 | 146,041 | |||||||||||||||||||||||||||||||||||||||||||||||||||
| Other liabilities | 15,107 | 13,227 | |||||||||||||||||||||||||||||||||||||||||||||||||||
| Shareholders’ equity | 63,312 | 63,510 | |||||||||||||||||||||||||||||||||||||||||||||||||||
| Total liabilities and shareholders’ equity | $ | 547,704 | $ | 545,606 | |||||||||||||||||||||||||||||||||||||||||||||||||
| Average interest-rate spread | 2.09 | % | 2.86 | % | |||||||||||||||||||||||||||||||||||||||||||||||||
| NIM/net interest income - taxable equivalent | 2.95 | % | 3.12 | % | $ | 3,621 | $ | 3,783 | $ | (162) | $ | (45) | $ | (117) | |||||||||||||||||||||||||||||||||||||||
| Taxable-equivalent adjustment | $ | 57 | $ | 38 | |||||||||||||||||||||||||||||||||||||||||||||||||
| Memo: Total deposits | $ | 401,038 | $ | 420,096 | 1.81 | % | 0.31 | % | $ | 1,831 | $ | 331 | $ | 1,500 |
(1)Represents daily average balances. Excludes basis adjustments for fair value hedges.
(2)Yields are stated on a TE basis utilizing federal tax rate. The change in interest not solely due to changes in rate or volume has been allocated based on the pro-rata absolute dollar amount of each. Interest income includes certain fees, deferred costs, and dividends.
(3)Includes cash equivalents, interest-bearing deposits with banks, FHLB stock and other earning assets.
Truist Financial Corporation 49
| Table 1-2: Taxable-Equivalent Net Interest Income and Rate / Volume Analysis | |||||||||||||||||||||||||||||||||||||||||||||||||||||||||||||||||||||||||||||||||||||||||||||||
| Nine Months Ended September 30, (Dollars in millions) | Average Balances**(1)** | Annualized Yield/Rate**(2)** | Income/Expense | Incr. (Decr.) | Change due to | ||||||||||||||||||||||||||||||||||||||||||||||||||||||||||||||||||||||||||||||||||||||||||
| 2023 | 2022 | 2023 | 2022 | 2023 | 2022 | Rate | Volume | ||||||||||||||||||||||||||||||||||||||||||||||||||||||||||||||||||||||||||||||||||||||||
| Assets | |||||||||||||||||||||||||||||||||||||||||||||||||||||||||||||||||||||||||||||||||||||||||||||||
| AFS and HTM securities at amortized cost: | |||||||||||||||||||||||||||||||||||||||||||||||||||||||||||||||||||||||||||||||||||||||||||||||
| U.S. Treasury | $ | 11,039 | $ | 10,457 | 1.14 | % | 0.84 | % | $ | 94 | $ | 66 | $ | 28 | $ | 24 | $ | 4 | |||||||||||||||||||||||||||||||||||||||||||||||||||||||||||||||||||||||||||||
| GSE | 334 | 557 | 2.83 | 2.19 | 8 | 8 | — | 3 | (3) | ||||||||||||||||||||||||||||||||||||||||||||||||||||||||||||||||||||||||||||||||||||||
| Agency MBS | 122,473 | 133,338 | 2.27 | 1.87 | 2,085 | 1,870 | 215 | 376 | (161) | ||||||||||||||||||||||||||||||||||||||||||||||||||||||||||||||||||||||||||||||||||||||
| States and political subdivisions | 424 | 380 | 4.12 | 3.82 | 13 | 11 | 2 | 1 | 1 | ||||||||||||||||||||||||||||||||||||||||||||||||||||||||||||||||||||||||||||||||||||||
| Non-agency MBS | 3,846 | 4,112 | 2.33 | 2.29 | 67 | 71 | (4) | 1 | (5) | ||||||||||||||||||||||||||||||||||||||||||||||||||||||||||||||||||||||||||||||||||||||
| Other | 23 | 51 | 5.34 | 3.46 | 1 | 1 | — | 1 | (1) | ||||||||||||||||||||||||||||||||||||||||||||||||||||||||||||||||||||||||||||||||||||||
| Total securities | 138,139 | 148,895 | 2.19 | 1.82 | 2,268 | 2,027 | 241 | 406 | (165) | ||||||||||||||||||||||||||||||||||||||||||||||||||||||||||||||||||||||||||||||||||||||
| Interest earning trading assets | 4,759 | 5,784 | 6.54 | 3.67 | 234 | 160 | 74 | 106 | (32) | ||||||||||||||||||||||||||||||||||||||||||||||||||||||||||||||||||||||||||||||||||||||
| Other earning assets(3) | 29,872 | 19,924 | 5.13 | 1.24 | 1,147 | 184 | 963 | 831 | 132 | ||||||||||||||||||||||||||||||||||||||||||||||||||||||||||||||||||||||||||||||||||||||
| Loans and leases, net of unearned income: | |||||||||||||||||||||||||||||||||||||||||||||||||||||||||||||||||||||||||||||||||||||||||||||||
| Commercial and industrial | 165,231 | 145,566 | 6.26 | 3.42 | 7,732 | 3,725 | 4,007 | 3,447 | 560 | ||||||||||||||||||||||||||||||||||||||||||||||||||||||||||||||||||||||||||||||||||||||
| CRE | 22,736 | 22,765 | 6.64 | 3.52 | 1,135 | 606 | 529 | 530 | (1) | ||||||||||||||||||||||||||||||||||||||||||||||||||||||||||||||||||||||||||||||||||||||
| Commercial Construction | 5,994 | 5,196 | 7.54 | 3.80 | 332 | 140 | 192 | 166 | 26 | ||||||||||||||||||||||||||||||||||||||||||||||||||||||||||||||||||||||||||||||||||||||
| Residential mortgage | 56,291 | 50,180 | 3.76 | 3.58 | 1,589 | 1,346 | 243 | 71 | 172 | ||||||||||||||||||||||||||||||||||||||||||||||||||||||||||||||||||||||||||||||||||||||
| Home equity | 10,483 | 10,755 | 7.22 | 4.68 | 566 | 376 | 190 | 200 | (10) | ||||||||||||||||||||||||||||||||||||||||||||||||||||||||||||||||||||||||||||||||||||||
| Indirect auto | 26,381 | 26,888 | 5.99 | 5.47 | 1,182 | 1,101 | 81 | 102 | (21) | ||||||||||||||||||||||||||||||||||||||||||||||||||||||||||||||||||||||||||||||||||||||
| Other consumer | 28,242 | 25,930 | 7.10 | 6.15 | 1,500 | 1,193 | 307 | 195 | 112 | ||||||||||||||||||||||||||||||||||||||||||||||||||||||||||||||||||||||||||||||||||||||
| Student | 3,280 | 6,310 | 6.92 | 4.54 | 170 | 214 | (44) | 84 | (128) | ||||||||||||||||||||||||||||||||||||||||||||||||||||||||||||||||||||||||||||||||||||||
| Credit card | 4,836 | 4,721 | 11.51 | 9.29 | 416 | 328 | 88 | 80 | 8 | ||||||||||||||||||||||||||||||||||||||||||||||||||||||||||||||||||||||||||||||||||||||
| Total loans and leases HFI | 323,474 | 298,311 | 6.04 | 4.04 | 14,622 | 9,029 | 5,593 | 4,875 | 718 | ||||||||||||||||||||||||||||||||||||||||||||||||||||||||||||||||||||||||||||||||||||||
| LHFS | 1,727 | 3,167 | 6.25 | 3.82 | 81 | 91 | (10) | 42 | (52) | ||||||||||||||||||||||||||||||||||||||||||||||||||||||||||||||||||||||||||||||||||||||
| Total loans and leases | 325,201 | 301,478 | 6.04 | 4.04 | 14,703 | 9,120 | 5,583 | 4,917 | 666 | ||||||||||||||||||||||||||||||||||||||||||||||||||||||||||||||||||||||||||||||||||||||
| Total earning assets | 497,971 | 476,081 | 4.92 | 3.22 | 18,352 | 11,491 | 6,861 | 6,260 | 601 | ||||||||||||||||||||||||||||||||||||||||||||||||||||||||||||||||||||||||||||||||||||||
| Nonearning assets | 59,703 | 64,673 | |||||||||||||||||||||||||||||||||||||||||||||||||||||||||||||||||||||||||||||||||||||||||||||
| Total assets | $ | 557,674 | $ | 540,754 | |||||||||||||||||||||||||||||||||||||||||||||||||||||||||||||||||||||||||||||||||||||||||||
| Liabilities and Shareholders’ Equity | |||||||||||||||||||||||||||||||||||||||||||||||||||||||||||||||||||||||||||||||||||||||||||||||
| Interest-bearing deposits: | |||||||||||||||||||||||||||||||||||||||||||||||||||||||||||||||||||||||||||||||||||||||||||||||
| Interest-checking | $ | 104,053 | $ | 112,058 | 1.93 | 0.26 | 1,501 | 215 | 1,286 | 1,303 | (17) | ||||||||||||||||||||||||||||||||||||||||||||||||||||||||||||||||||||||||||||||||||||
| Money market and savings | 139,305 | 145,953 | 1.91 | 0.20 | 1,991 | 220 | 1,771 | 1,781 | (10) | ||||||||||||||||||||||||||||||||||||||||||||||||||||||||||||||||||||||||||||||||||||||
| Time deposits | 35,189 | 14,840 | 3.68 | 0.25 | 970 | 27 | 943 | 858 | 85 | ||||||||||||||||||||||||||||||||||||||||||||||||||||||||||||||||||||||||||||||||||||||
| Total interest-bearing deposits | 278,547 | 272,851 | 2.14 | 0.23 | 4,462 | 462 | 4,000 | 3,942 | 58 | ||||||||||||||||||||||||||||||||||||||||||||||||||||||||||||||||||||||||||||||||||||||
| Short-term borrowings | 24,317 | 11,356 | 5.13 | 1.68 | 932 | 143 | 789 | 507 | 282 | ||||||||||||||||||||||||||||||||||||||||||||||||||||||||||||||||||||||||||||||||||||||
| Long-term debt | 52,663 | 32,646 | 4.41 | 1.88 | 1,739 | 459 | 1,280 | 879 | 401 | ||||||||||||||||||||||||||||||||||||||||||||||||||||||||||||||||||||||||||||||||||||||
| Total interest-bearing liabilities | 355,527 | 316,853 | 2.68 | 0.45 | 7,133 | 1,064 | 6,069 | 5,328 | 741 | ||||||||||||||||||||||||||||||||||||||||||||||||||||||||||||||||||||||||||||||||||||||
| Noninterest-bearing deposits | 124,533 | 146,862 | |||||||||||||||||||||||||||||||||||||||||||||||||||||||||||||||||||||||||||||||||||||||||||||
| Other liabilities | 14,446 | 12,448 | |||||||||||||||||||||||||||||||||||||||||||||||||||||||||||||||||||||||||||||||||||||||||||||
| Shareholders’ equity | 63,168 | 64,591 | |||||||||||||||||||||||||||||||||||||||||||||||||||||||||||||||||||||||||||||||||||||||||||||
| Total liabilities and shareholders’ equity | $ | 557,674 | $ | 540,754 | |||||||||||||||||||||||||||||||||||||||||||||||||||||||||||||||||||||||||||||||||||||||||||
| Average interest-rate spread | 2.24 | % | 2.77 | % | |||||||||||||||||||||||||||||||||||||||||||||||||||||||||||||||||||||||||||||||||||||||||||
| NIM/net interest income - taxable equivalent | 3.01 | % | 2.93 | % | $ | 11,219 | $ | 10,427 | $ | 792 | $ | 932 | $ | (140) | |||||||||||||||||||||||||||||||||||||||||||||||||||||||||||||||||||||||||||||||||
| Taxable-equivalent adjustment | $ | 162 | $ | 92 | |||||||||||||||||||||||||||||||||||||||||||||||||||||||||||||||||||||||||||||||||||||||||||
| Memo: Total deposits | $ | 403,080 | $ | 419,713 | 1.48 | % | 0.15 | % | $ | 4,462 | $ | 462 | $ | 4,000 |
(1)Represents daily average balances. Excludes basis adjustments for fair value hedges.
(2)Yields are stated on a TE basis utilizing federal tax rate. The change in interest not solely due to changes in rate or volume has been allocated based on the pro-rata absolute dollar amount of each. Interest income includes certain fees, deferred costs, and dividends.
(3)Includes cash equivalents, interest-bearing deposits with banks, FHLB stock and other earning assets.
50 Truist Financial Corporation
Provision for Credit Losses
The provision for credit losses was $497 million compared to $234 million for the third quarter of 2022. The net charge-off ratio for the current quarter of 0.51% was up 24 basis points compared to the prior quarter.
-
The increase in the current quarter provision expense primarily reflects an allowance build and higher net charge-offs.
-
The net charge-off ratio was up compared to the third quarter of 2022 driven by higher charge-offs in the CRE, commercial and industrial, and indirect auto portfolios.
The provision for credit losses was $1.5 billion for the nine months ended September 30, 2023 compared to $310 million in the same period in 2022. The net charge-off ratio for the current period of 0.47% was up 22 basis points compared to the prior period.
- The increase in the current period provision expense primarily reflects an allowance build and higher net charge-offs.
*•*The net charge-off ratio was up compared to the prior period driven by higher charge-offs in the commercial and industrial, CRE, indirect auto, other consumer, and credit card portfolios as well as the sale of the student loan portfolio.
Refer to “Note 5. Loans and ACL” for additional discussion of the ACL.
Noninterest Income
Noninterest income is a significant contributor to Truist’s financial results. Management focuses on diversifying its sources of revenue to reduce Truist’s reliance on traditional spread-based interest income, as certain fee-based activities are a relatively stable revenue source during periods of changing interest rates. The following table provides a breakdown of Truist’s noninterest income:
| Table 2: Noninterest Income | ||||||||||||||||||||||||||||||||||||||||||||||||||
| Three Months Ended September 30, | % Change | Nine Months Ended September 30, | % Change | |||||||||||||||||||||||||||||||||||||||||||||||
| (Dollars in millions) | 2023 | 2022 | 2023 vs. 2022 | 2023 | 2022 | 2023 vs. 2022 | ||||||||||||||||||||||||||||||||||||||||||||
| Insurance income | $ | 793 | $ | 725 | 9.4 | % | $ | 2,541 | $ | 2,277 | 11.6 | % | ||||||||||||||||||||||||||||||||||||||
| Wealth management income | 343 | 334 | 2.7 | 1,012 | 1,014 | (0.2) | ||||||||||||||||||||||||||||||||||||||||||||
| Investment banking and trading income | 185 | 222 | (16.7) | 657 | 738 | (11.0) | ||||||||||||||||||||||||||||||||||||||||||||
| Service charges on deposits | 152 | 263 | (42.2) | 641 | 769 | (16.6) | ||||||||||||||||||||||||||||||||||||||||||||
| Card and payment related fees | 238 | 241 | (1.2) | 704 | 699 | 0.7 | ||||||||||||||||||||||||||||||||||||||||||||
| Mortgage banking income | 102 | 122 | (16.4) | 343 | 343 | — | ||||||||||||||||||||||||||||||||||||||||||||
| Lending related fees | 102 | 80 | 27.5 | 294 | 265 | 10.9 | ||||||||||||||||||||||||||||||||||||||||||||
| Operating lease income | 63 | 66 | (4.5) | 194 | 190 | 2.1 | ||||||||||||||||||||||||||||||||||||||||||||
| Securities gains (losses) | — | (1) | NM | — | (71) | NM | ||||||||||||||||||||||||||||||||||||||||||||
| Other income | 130 | 50 | 160.0 | 249 | 268 | (7.1) | ||||||||||||||||||||||||||||||||||||||||||||
| Total noninterest income | $ | 2,108 | $ | 2,102 | 0.3 | $ | 6,635 | $ | 6,492 | 2.2 | ||||||||||||||||||||||||||||||||||||||||
Noninterest income was relatively stable compared to the third quarter of 2022 due to higher other income and insurance income, partially offset by lower service charges on deposits and lower investment banking and trading income.
-
Other income increased primarily due to higher income on certain equity investments and higher income from investments held for certain post-retirement benefits (which is primarily offset by higher personnel expense).
-
Insurance income increased primarily due to 6.3% organic growth and acquisitions.
-
Service charges on deposits decreased primarily due to an $87 million reduction in deposit service charge fees due to client refund accruals resulting from a revision in deposit service fee protocols, as well as reduced overdraft fees.
-
Investment banking and trading income decreased due to lower structured real estate income, partially offset by higher merger and acquisition activity and equity originations.
Noninterest income was up $143 million, or 2.2%, for the nine months ended September 30, 2023 compared to the same period in 2022 due to higher insurance income, partially offset by lower service charges on deposits, investment banking and trading income, and other income. The prior period included $71 million of securities losses and a $74 million gain on the redemption of noncontrolling equity interest (included in other income).
-
Insurance income increased primarily due to 6.8% organic growth and acquisitions.
-
Service charges on deposits decreased primarily due to the aforementioned service fee protocol revision, as well as reduced overdraft fees.
-
Investment banking and trading income decreased due to lower structured real estate income, partially offset by higher merger and acquisition fees as well as higher equity and bond originations.
Truist Financial Corporation 51
- Other income decreased primarily due to higher derivative collateral related costs and the aforementioned gain on the redemption of noncontrolling equity in the prior period, partially offset by higher income from investments held for certain post-retirement benefits (which is primarily offset by higher personnel expense).
Noninterest Expense
The following table provides a breakdown of Truist’s noninterest expense:
| Table 3: Noninterest Expense | ||||||||||||||||||||||||||||||||||||||||||||||||||
| Three Months Ended September 30, | % Change | Nine Months Ended September 30, | % Change | |||||||||||||||||||||||||||||||||||||||||||||||
| (Dollars in millions) | 2023 | 2022 | 2023 vs. 2022 | 2023 | 2022 | 2023 vs. 2022 | ||||||||||||||||||||||||||||||||||||||||||||
| Personnel expense | $ | 2,200 | $ | 2,116 | 4.0 | % | $ | 6,637 | $ | 6,269 | 5.9 | % | ||||||||||||||||||||||||||||||||||||||
| Professional fees and outside processing | 317 | 352 | (9.9) | 983 | 1,064 | (7.6) | ||||||||||||||||||||||||||||||||||||||||||||
| Software expense | 238 | 225 | 5.8 | 689 | 691 | (0.3) | ||||||||||||||||||||||||||||||||||||||||||||
| Net occupancy expense | 180 | 176 | 2.3 | 543 | 565 | (3.9) | ||||||||||||||||||||||||||||||||||||||||||||
| Amortization of intangibles | 130 | 140 | (7.1) | 397 | 420 | (5.5) | ||||||||||||||||||||||||||||||||||||||||||||
| Equipment expense | 97 | 122 | (20.5) | 299 | 354 | (15.5) | ||||||||||||||||||||||||||||||||||||||||||||
| Marketing and customer development | 78 | 105 | (25.7) | 235 | 282 | (16.7) | ||||||||||||||||||||||||||||||||||||||||||||
| Operating lease depreciation | 43 | 45 | (4.4) | 133 | 140 | (5.0) | ||||||||||||||||||||||||||||||||||||||||||||
| Regulatory costs | 77 | 52 | 48.1 | 225 | 131 | 71.8 | ||||||||||||||||||||||||||||||||||||||||||||
| Merger-related and restructuring charges | 75 | 62 | 21.0 | 192 | 399 | (51.9) | ||||||||||||||||||||||||||||||||||||||||||||
| Other expense | 312 | 218 | 43.1 | 853 | 552 | 54.5 | ||||||||||||||||||||||||||||||||||||||||||||
| Total noninterest expense | $ | 3,747 | $ | 3,613 | 3.7 | $ | 11,186 | $ | 10,867 | 2.9 | ||||||||||||||||||||||||||||||||||||||||
Noninterest expense was up $134 million, or 3.7%, compared to the third quarter of 2022 due to higher personnel expense, other expense, and regulatory costs, partially offset by lower professional fees and outside processing and marketing and customer development. Merger-related costs, which included merger-related and restructuring charges, as well as incremental operating expenses related to the merger decreased $77 million, primarily due to the completion of integration-related activities. Adjusted noninterest expenses, which exclude merger-related costs, the amortization of intangibles, and gains and losses on the early extinguishment of debt increased $221 million, or 6.7%.
-
Personnel expense increased due to investments in teammates by increasing Truist’s minimum wage, the impact from acquisitions, and investments in revenue producing businesses and enterprise technology, as well as higher other post-retirement benefit expense (which is almost entirely offset by higher other income). These increases were partially offset by lower pension expenses and lower incentives.
-
Other expense increased primarily due to higher pension expense (driven primarily by lower plan assets) and includes $70 million of costs associated with a revision in deposit service fee protocols as well as settlement of certain litigation matters, including a settlement and patent licensing agreement that resolved the USAA remote deposit capture patent infringement lawsuit, partially offset by lower operating losses.
-
Regulatory costs increased primarily due to an increase in the FDIC’s deposit insurance assessment rate.
-
Professional fees and outside processing expenses decreased due to prior period incremental operating expenses related to the merger, partially offset by higher enterprise technology and other investments.
-
Marketing and customer development decreased due to reduced marketing compared to the prior year.
52 Truist Financial Corporation
Noninterest expense was up $319 million, or 2.9%, for the nine months ended September 30, 2023 compared to the same period in 2022 due to higher personnel expense, other expense, and regulatory costs, partially offset by lower merger-related and restructuring charges, professional fees and outside processing expenses, equipment expense, and marketing and customer development expense. Merger-related and restructuring charges and incremental operating expenses related to the merger decreased $207 million and $409 million, respectively, due to the completion of integration-related activities. The prior period also included a gain on the redemption of FHLB advances of $39 million. Adjusted noninterest expenses, which exclude merger-related costs, the amortization of intangibles, and gains and losses on the early extinguishment of debt, increased $915 million, or 9.5%.
-
Personnel expense increased due to investments in teammates by increasing Truist’s minimum wage, the impact from acquisitions, investments in revenue producing businesses and enterprise technology, and higher other post-retirement benefit expense (which is almost entirely offset by higher other income), partially offset by lower pension expenses.
-
Other expense increased primarily due to higher pension expense (driven primarily by lower plan assets) and includes $70 million of costs associated with a revision in deposit service fee protocols as well as settlement of certain litigation matters, including a settlement and patent licensing agreement that resolved the USAA remote deposit capture patent infringement lawsuit, partially offset by lower operating losses.
-
Regulatory costs increased primarily due to an increase in the FDIC’s deposit insurance assessment rate.
-
Professional fees and outside processing expense decreased due to prior period incremental operating expenses related to the merger, partially offset by higher enterprise technology and other investments.
-
Equipment expense decreased due to retirement of certain technology related equipment.
-
Marketing and customer development expense decreased due to reduced marketing compared to the prior year.
Merger-Related and Restructuring Charges
The following table presents a summary of merger-related and restructuring charges and the related accruals. The 2023 merger-related and restructuring costs predominately reflect various restructuring initiatives, including costs for severance and other benefits and costs related to exiting facilities.
| Table 4: Merger-Related and Restructuring Accrual Activity | |||||||||||||||||||||||||||||||||||||||||||||||||||||||||||||||||||||||||||||||||||
| Three Months Ended September 30, 2023 | Nine Months Ended September 30, 2023 | ||||||||||||||||||||||||||||||||||||||||||||||||||||||||||||||||||||||||||||||||||
| (Dollars in millions) | Accrual at Jul 1, 2023 | Expense | Utilized | Accrual at Sep 30, 2023 | Accrual at Jan 1, 2023 | Expense | Utilized | Accrual at Sep 30, 2023 | |||||||||||||||||||||||||||||||||||||||||||||||||||||||||||||||||||||||||||
| Severance and personnel-related | $ | 18 | $ | 60 | $ | (61) | $ | 17 | $ | 9 | $ | 139 | $ | (131) | $ | 17 | |||||||||||||||||||||||||||||||||||||||||||||||||||||||||||||||||||
| Occupancy and equipment | — | 5 | (5) | — | — | 35 | (35) | — | |||||||||||||||||||||||||||||||||||||||||||||||||||||||||||||||||||||||||||
| Professional services | — | 4 | (4) | — | 12 | 7 | (19) | — | |||||||||||||||||||||||||||||||||||||||||||||||||||||||||||||||||||||||||||
| Other | 2 | 6 | (6) | 2 | 5 | 11 | (14) | 2 | |||||||||||||||||||||||||||||||||||||||||||||||||||||||||||||||||||||||||||
| Total | $ | 20 | $ | 75 | $ | (76) | $ | 19 | $ | 26 | $ | 192 | $ | (199) | $ | 19 | |||||||||||||||||||||||||||||||||||||||||||||||||||||||||||||||||||
Provision for Income Taxes
The provision for income taxes was $245 million for the three months ended September 30, 2023, compared to $363 million for the same quarter in 2022. The effective tax rate for three months ended September 30, 2023 was 17.2% compared to 18.2% for the earlier quarter. The effective tax rate decreased compared to the third quarter of 2022 primarily driven by decreases in the full year forecasted effective tax rate, partially offset by changes in discrete tax items.
The provision for income taxes was $926 million for the nine months ended September 30, 2023, compared to $1.1 billion for the same period in 2022. The effective tax rate for nine months ended September 30, 2023 and 2022 was 18.6% and 18.8%, respectively.
Truist Financial Corporation 53
Segment Results
Truist operates and measures business activity across three segments: Consumer Banking and Wealth, Corporate and Commercial Banking, and Insurance Holdings, with functional activities included in Other, Treasury, and Corporate. The Company’s business segment structure is based on the manner in which financial information is evaluated by management as well as the products and services provided or the type of client served.
During the first quarter of 2023, Truist realigned Prime Rate Premium Finance Corporation, which includes AFCO Credit Corporation and CAFO Holding Company, into the C&CB segment from the IH segment. Prior period results have been revised to conform to the current presentation. During the second quarter of 2023, Truist updated its segment cost allocation methodology. Results for the first quarter of 2023 have been revised to conform to the current presentation. Management concluded the impact to 2022 was not material.
In conjunction with the Company’s April 3, 2023 sale of a 20% stake of the common equity in IH, IH issued $5 billion of 8.25% mandatorily redeemable preferred units to the Company, with the related interest expense, which is fully allocable to the Company, reported in Net intersegment interest income (expense).
Also related to the same transaction, IH was recapitalized from a corporate entity to an LLC, such that each member is allocated its share of IH’s income before taxes, and beginning in the second quarter of 2023 the Company recognizes its associated income tax provision through OT&C. The Company elected not to restate prior periods for this change based on IH’s previous status as a corporate entity. The Company recognized $30 million and $84 million for the three and nine months ended September 30, 2023, respectively, of tax provision related to IH in OT&C. In the third quarter of 2023, IH recognized $3 million of taxes for certain state jurisdictions that impose income taxes on partnerships and LLCs.
See “Note 18. Operating Segments” herein and “Note 21. Operating Segments” in Truist’s Annual Report on Form 10-K for the year ended December 31, 2022 for additional disclosures related to Truist’s reportable business segments, including additional details related to results of operations. Fluctuations in noninterest income and noninterest expense are more fully discussed in the Noninterest Income and Noninterest Expense sections above.
| Table 5: Net Income by Reportable Segment | |||||||||||||||||||||||||||||||||||||||||||||||||||||||||||||||||||||||||||||||||||||||||
| Three Months Ended September 30, | % Change | Nine Months Ended September 30, | % Change | ||||||||||||||||||||||||||||||||||||||||||||||||||||||||||||||||||||||||||||||||||||||
| (Dollars in millions) | 2023 | 2022 | 2023 vs. 2022 | 2023 | 2022 | 2023 vs. 2022 | |||||||||||||||||||||||||||||||||||||||||||||||||||||||||||||||||||||||||||||||||||
| Consumer Banking and Wealth | $ | 834 | $ | 996 | (16.3) | % | $ | 2,771 | $ | 2,641 | 4.9 | % | |||||||||||||||||||||||||||||||||||||||||||||||||||||||||||||||||||||||||||||
| Corporate and Commercial Banking | 892 | 1,186 | (24.8) | 2,773 | 3,183 | (12.9) | |||||||||||||||||||||||||||||||||||||||||||||||||||||||||||||||||||||||||||||||||||
| Insurance Holdings | 17 | 85 | (80.0) | 279 | 401 | (30.4) | |||||||||||||||||||||||||||||||||||||||||||||||||||||||||||||||||||||||||||||||||||
| Other, Treasury & Corporate | (560) | (630) | 11.1 | (1,780) | (1,640) | (8.5) | |||||||||||||||||||||||||||||||||||||||||||||||||||||||||||||||||||||||||||||||||||
| Truist Financial Corporation | $ | 1,183 | $ | 1,637 | (27.7) | $ | 4,043 | $ | 4,585 | (11.8) |
Consumer Banking and Wealth
CB&W net income was $834 million for the third quarter of 2023, a decrease of $162 million compared to the third quarter of 2022.
-
Segment net interest income decreased $25 million primarily driven by lower average deposit balances, decrease in loan spread and lower average loan balances, partially offset by higher funding credit on deposits.
-
The provision for credit losses decreased $35 million reflecting an allowance release whereas the earlier period included an allowance build, partially offset by higher charge offs in the indirect auto and other consumer portfolios.
-
Noninterest income decreased $80 million compared to earlier quarter primarily due to decreased service charge fees on deposits driven by client refund accruals resulting from a revision in deposit service fee protocols as well as reduced overdraft fees, partially offset by higher residential mortgage income and wealth brokerage fees and commissions.
-
Noninterest expense increased $135 million compared to the earlier quarter driven by higher corporate technology, risk, and operations support expenses along with higher pension cost and FDIC’s deposit insurance assessment rate, partially offset by lower marketing and customer development and professional fees and outside processing.
CB&W average loans and leases held for investment decreased $3.7 billion, or 2.6%, for the third quarter of 2023 compared to the third quarter of 2022, primarily driven by the sale of the student loan portfolio at the end of the second quarter of 2023 and a decrease in indirect auto balances, partially offset by increases in residential mortgage, Service Finance, and Sheffield balances.
CB&W average total deposits decreased $14.8 billion, or 5.9%, for the third quarter of 2023 compared to the third quarter of 2022, primarily driven by decreases in interest-bearing checking, money market and savings, and noninterest-bearing deposits, partially offset by an increase in time deposits.
54 Truist Financial Corporation
Corporate and Commercial Banking
C&CB net income was $892 million for the third quarter of 2023, a decrease of $294 million compared to the third quarter of 2022.
-
Segment net interest income was flat compared to the earlier quarter.
-
The provision for credit losses increased $302 million which reflects higher commercial and industrial loan charge offs, an allowance build, and loan growth in the current quarter as well as an allowance release in the earlier quarter.
-
Noninterest income decreased $61 million compared to the earlier quarter primarily due to lower structured real estate fees and commercial mortgage income, partially offset by higher income from lending related fees, merger and acquisition activity, and equity originations.
-
Noninterest expense increased $46 million compared to the earlier quarter primarily due to higher corporate technology expenses and merger-related and restructuring charges, partially offset by lower corporate marketing expense.
C&CB average loans held for investment increased $12.3 billion, or 7.3%, for the third quarter of 2023 compared to the third quarter of 2022, primarily due to increases in core commercial and industrial loans.
C&CB average total deposits decreased $16.2 billion, or 11%, for the third quarter of 2023 compared to the third quarter of 2022, primarily due to declines in average noninterest-bearing deposits, partially offset by increases in money market and savings.
Insurance Holdings
IH net income was $17 million for the third quarter of 2023, a decrease of $68 million compared to the third quarter of 2022.
-
Segment net interest income decreased $91 million driven primarily by interest expense accruals on new intercompany mandatorily redeemable preferred units resulting from the recapitalization of IH.
-
Noninterest income increased $70 million primarily due to continued organic growth and acquisitions.
-
Noninterest expense increased $73 million primarily due to the impact of acquisitions, investments in new hires and teammates, performance-driven incentive expense, and higher professional fees and outside processing.
Other, Treasury & Corporate
OT&C generated a net loss of $560 million in the third quarter of 2023, compared to a net loss of $630 million in the third quarter of 2022.
-
Segment net interest income decreased $71 million primarily due to higher rates on Treasury funding and funding credit on deposits to other segments, partially offset by funding charges to other segments and interest income on cash balances and securities resulting from the higher rate environment.
-
The provision for credit losses was flat compared to the earlier quarter.
-
Noninterest income increased $77 million primarily due to higher income from investments held for certain post-retirement benefits (which is primarily offset by higher personnel expense).
-
Noninterest expense decreased $120 million compared to the earlier quarter primarily due to a decrease in incremental operating expenses related to the merger as well as credit from other segments for corporate technology project support, partially offset by an increase in operating charge-offs due to costs associated with a revision in deposit service fee protocols as well as settlement of certain litigation matters, including a settlement and patent licensing agreement that resolved the USAA remote deposit capture patent infringement lawsuit, professional fees and outside processing and personnel expenses excluding merger related costs.
Nine Months of 2023 compared to Nine Months of 2022
Consumer Banking and Wealth
CB&W net income was $2.8 billion for the nine months ended September 30, 2023, an increase of $130 million, or 4.9%, compared to the prior year.
-
Segment net interest income increased $919 million driven by favorable funding credit on deposits attributable to the higher rate environment and higher average loans, partially offset by higher funding costs, lower average deposits, and lower purchase accounting accretion.
-
The provision for credit losses increased $190 million reflecting higher charge offs in the indirect auto and other consumer portfolios, an allowance build in the current period, and a reserve release in the earlier period. The impact of the student loan sale in the second quarter was net neutral to provision.
Truist Financial Corporation 55
-
Noninterest income decreased $121 million primarily due to decreased service charge fees on deposits driven by client refund accruals resulting from a revision in deposit service fee protocols and a gain on the redemption of noncontrolling equity interest in the earlier period, partially offset by higher mortgage banking income in the current period.
-
Noninterest expense increased $432 million primarily driven by higher corporate technology costs, salaries expense, pension cost, corporate risk and operations support expenses, and FDIC’s deposit insurance assessment rate, partially offset by lower marketing and customer development, professional fees and outside processing, operational losses, and amortization of intangibles.
CB&W average loans and leases held for investment increased $5.3 billion, or 3.9%, for the nine months ended September 30, 2023 compared to the prior year driven primarily by an increase in residential mortgage and Service Finance loans, partially offset by the sale of the student loan portfolio in second quarter 2023.
CB&W average total deposits decreased $16.8 billion, or 6.5%, for the nine months ended September 30, 2023 compared to the prior year primarily due to decreases in average interest-bearing checking, money market and savings, and noninterest-bearing deposits, partially offset by an increase in time deposits.
Truist Wealth had assets under management of $188 billion as of September 30, 2023, an increase of $14 billion, or 8.2%, compared to the prior year primarily due to higher markets and positive net asset flows.
Corporate and Commercial Banking
C&CB net income was $2.8 billion for the nine months ended September 30, 2023, a decrease of $410 million, or 12.9%, compared to the prior year.
-
Segment net interest income increased $819 million primarily due to higher funding credit on deposits and higher average loan balances, partially offset by lower purchase accounting accretion.
-
The provision for credit losses increased $1.0 billion which reflects an allowance build, higher charge offs, and loan growth in the current period as well as an allowance release in the earlier period.
-
Noninterest income decreased $198 million primarily due to lower structured real estate fees, higher derivative collateral related costs, and lower commercial mortgage income, partially offset by increases in merger and acquisition fees, lending related fees, and equity originations.
-
Noninterest expense increased $191 million primarily due to higher corporate technology expenses, merger-related and restructuring charges, personnel expenses, and FDIC insurance expense, partially offset by lower corporate marketing expense.
C&CB average loans and leases held for investment increased $19.7 billion, or 12%, for the nine months ended September 30, 2023 compared to the prior year driven by an increase in the commercial and industrial portfolio loans.
C&CB average total deposits decreased $14.0 billion, or 9.6%, for the nine months ended September 30, 2023 compared to the prior year primarily due to a decrease in average noninterest-bearing deposits, partially offset by an increase in money market and savings.
Insurance Holdings
IH net income was $279 million for the nine months ended September 30, 2023, a decrease of $122 million, or 30%, compared to the prior year.
-
Segment net interest income decreased $169 million driven primarily by interest expense accruals on new intercompany mandatorily redeemable preferred units resulting from the recapitalization of IH.
-
Noninterest income increased $267 million primarily due to continued organic growth and acquisitions.
-
Noninterest expense increased $312 million primarily due to the impact of acquisitions, investments in new hires and teammates, performance-driven incentive expense, and higher operational loss reserves.
Other, Treasury, and Corporate
OT&C generated a net loss of $1.8 billion for the nine months ended September 30, 2023, compared to a net loss of $1.6 billion in the prior year.
- Segment net interest income decreased $847 million due to higher funding credit on deposits to other segments and higher rates on Treasury funding, partially offset by higher funds transfer charges to other segments for loans and higher earnings on cash balances and in the securities portfolio driven by the higher rate environment.
56 Truist Financial Corporation
-
The provision for credit losses increased $11 million, which reflects a reserve release in the prior year as well as an allowance build in the current period.
-
Noninterest income increased $195 million primarily due to valuation changes from assets held for certain post-retirement benefits in the current period, which is primarily offset by higher personnel expense and losses on the sale of securities in the earlier period.
-
Noninterest expense decreased $616 million primarily due to a decrease in incremental operating expenses related to the merger and credit from other segments for corporate technology project support, partially offset by an increase in professional fees and outside processing, personnel expenses, operating charge-offs due to costs associated with a revision in deposit service fee protocols as well as settlement of certain litigation matters, including a settlement and patent licensing agreement that resolved the USAA remote deposit capture patent infringement lawsuit, and a gain on the redemption of FHLB advances in the prior year.
Analysis of Financial Condition
Investment Activities
The securities portfolio totaled $120.1 billion at September 30, 2023, compared to $129.5 billion at December 31, 2022. U.S. Treasury, GSE, and Agency MBS represents 97% of the total securities portfolio as of September 30, 2023 and December 31, 2022. While the overwhelming majority of the portfolio remains in agency MBS securities, the Company also holds AAA rated non-agency MBS as the risk adjusted returns for these securities are more attractive than agency MBS.
-
The decrease includes paydowns and maturities of $9.4 billion during 2023.
-
As of September 30, 2023, 41% of the investment securities portfolio was classified as held-to-maturity based on amortized cost.
-
As of September 30, 2023 and December 31, 2022, approximately 5.7% of the securities portfolio was variable rate, excluding the impact of swaps.
-
The effective duration of the AFS securities portfolio was 5.8 years at September 30, 2023 and 6.2 years at December 31, 2022, excluding the impact of swaps. The effective duration of the HTM securities portfolio was 7.0 years at September 30, 2023 and 7.3 years at December 31, 2022.
Lending Activities
The following table presents the composition of average loans and leases:
| Table 6: Average Loans and Leases | ||||||||||||||||||||||||||||||||
| Three Months Ended | ||||||||||||||||||||||||||||||||
| (Dollars in millions) | Sep 30, 2023 | Jun 30, 2023 | Mar 31, 2023 | Dec 31, 2022 | Sep 30, 2022 | |||||||||||||||||||||||||||
| Commercial: | ||||||||||||||||||||||||||||||||
| Commercial and industrial | $ | 164,022 | $ | 166,588 | $ | 165,095 | $ | 159,308 | $ | 152,123 | ||||||||||||||||||||||
| CRE | 22,812 | 22,706 | 22,689 | 22,497 | 22,245 | |||||||||||||||||||||||||||
| Commercial construction | 6,194 | 5,921 | 5,863 | 5,711 | 5,284 | |||||||||||||||||||||||||||
| Consumer: | ||||||||||||||||||||||||||||||||
| Residential mortgage | 56,135 | 56,320 | 56,422 | 56,292 | 53,271 | |||||||||||||||||||||||||||
| Home equity | 10,243 | 10,478 | 10,735 | 10,887 | 10,767 | |||||||||||||||||||||||||||
| Indirect auto | 24,872 | 26,558 | 27,743 | 28,117 | 28,057 | |||||||||||||||||||||||||||
| Other consumer | 28,963 | 28,189 | 27,559 | 27,479 | 26,927 | |||||||||||||||||||||||||||
| Student | — | 4,766 | 5,129 | 5,533 | 5,958 | |||||||||||||||||||||||||||
| Credit card | 4,875 | 4,846 | 4,785 | 4,842 | 4,755 | |||||||||||||||||||||||||||
| Total average loans and leases HFI | $ | 318,116 | $ | 326,372 | $ | 326,020 | $ | 320,666 | $ | 309,387 |
Average loans held for investment decreased $8.3 billion, or 2.5%, compared to the prior quarter, primarily due to the sale of the student loan portfolio at the end of the second quarter of 2023 and balance sheet optimization in lower return portfolios. Excluding the student loan sale, average loans held for investment declined 1.1% compared to the prior quarter.
-
Average commercial loans decreased 1.1% due to a decline in the commercial and industrial portfolio.
-
Average consumer loans decreased 4.8% due to the sale of the student loan portfolio and lower indirect auto production, partially offset by growth in higher-return point-of-sale lending in the other consumer portfolio (Service Finance and Sheffield).
At September 30, 2023 and December 31, 2022, 53% of loans and leases HFI were variable rate.
Truist Financial Corporation 57
Asset Quality
The following tables summarize asset quality information:
| Table 7: Asset Quality | |||||||||||||||||||||||||||||||||||
| (Dollars in millions) | Sep 30, 2023 | Jun 30, 2023 | Mar 31, 2023 | Dec 31, 2022 | Sep 30, 2022 | ||||||||||||||||||||||||||||||
| NPAs: | |||||||||||||||||||||||||||||||||||
| NPLs: | |||||||||||||||||||||||||||||||||||
| Commercial and industrial | $ | 561 | $ | 562 | $ | 394 | $ | 398 | $ | 443 | |||||||||||||||||||||||||
| CRE | 289 | 275 | 117 | 82 | 5 | ||||||||||||||||||||||||||||||
| Commercial construction | 29 | 16 | 1 | — | — | ||||||||||||||||||||||||||||||
| Residential mortgage | 132 | 221 | 233 | 240 | 227 | ||||||||||||||||||||||||||||||
| Home equity | 123 | 129 | 132 | 135 | 132 | ||||||||||||||||||||||||||||||
| Indirect auto | 266 | 262 | 270 | 289 | 260 | ||||||||||||||||||||||||||||||
| Other consumer | 52 | 46 | 45 | 44 | 39 | ||||||||||||||||||||||||||||||
| Total NPLs HFI | 1,452 | 1,511 | 1,192 | 1,188 | 1,106 | ||||||||||||||||||||||||||||||
| Loans held for sale | 75 | 13 | — | — | 72 | ||||||||||||||||||||||||||||||
| Total nonaccrual loans and leases | 1,527 | 1,524 | 1,192 | 1,188 | 1,178 | ||||||||||||||||||||||||||||||
| Foreclosed real estate | 3 | 3 | 3 | 4 | 4 | ||||||||||||||||||||||||||||||
| Other foreclosed property | 54 | 56 | 66 | 58 | 58 | ||||||||||||||||||||||||||||||
| Total nonperforming assets | $ | 1,584 | $ | 1,583 | $ | 1,261 | $ | 1,250 | $ | 1,240 | |||||||||||||||||||||||||
| Loans 90 days or more past due and still accruing: | |||||||||||||||||||||||||||||||||||
| Commercial and industrial | $ | 15 | $ | 36 | $ | 35 | $ | 49 | $ | 44 | |||||||||||||||||||||||||
| CRE | — | — | — | 1 | 1 | ||||||||||||||||||||||||||||||
| Commercial construction | — | 5 | — | — | — | ||||||||||||||||||||||||||||||
| Residential mortgage - government guaranteed | 456 | 541 | 649 | 759 | 808 | ||||||||||||||||||||||||||||||
| Residential mortgage - nonguaranteed | 30 | 23 | 25 | 27 | 26 | ||||||||||||||||||||||||||||||
| Home equity | 9 | 7 | 10 | 12 | 9 | ||||||||||||||||||||||||||||||
| Indirect auto | 1 | — | — | 1 | 1 | ||||||||||||||||||||||||||||||
| Other consumer | 16 | 12 | 10 | 13 | 9 | ||||||||||||||||||||||||||||||
| Student - government guaranteed | — | — | 590 | 702 | 770 | ||||||||||||||||||||||||||||||
| Student - nonguaranteed | — | — | 4 | 4 | 5 | ||||||||||||||||||||||||||||||
| Credit card | 47 | 38 | 38 | 37 | 36 | ||||||||||||||||||||||||||||||
| Total loans 90 days or more past due and still accruing | $ | 574 | $ | 662 | $ | 1,361 | $ | 1,605 | $ | 1,709 | |||||||||||||||||||||||||
| Loans 30-89 days past due and still accruing: | |||||||||||||||||||||||||||||||||||
| Commercial and industrial | $ | 98 | $ | 142 | $ | 125 | $ | 256 | $ | 162 | |||||||||||||||||||||||||
| CRE | 28 | 38 | 34 | 25 | 15 | ||||||||||||||||||||||||||||||
| Commercial construction | 1 | 6 | 3 | 5 | 3 | ||||||||||||||||||||||||||||||
| Residential mortgage - government guaranteed | 293 | 267 | 232 | 268 | 234 | ||||||||||||||||||||||||||||||
| Residential mortgage - nonguaranteed | 270 | 254 | 259 | 346 | 300 | ||||||||||||||||||||||||||||||
| Home equity | 61 | 56 | 65 | 68 | 67 | ||||||||||||||||||||||||||||||
| Indirect auto | 598 | 549 | 511 | 646 | 591 | ||||||||||||||||||||||||||||||
| Other consumer | 219 | 175 | 164 | 187 | 152 | ||||||||||||||||||||||||||||||
| Student - government guaranteed | — | — | 350 | 396 | 375 | ||||||||||||||||||||||||||||||
| Student - nonguaranteed | — | — | 6 | 6 | 6 | ||||||||||||||||||||||||||||||
| Credit card | 68 | 63 | 56 | 64 | 52 | ||||||||||||||||||||||||||||||
| Total loans 30-89 days past due and still accruing | $ | 1,636 | $ | 1,550 | $ | 1,805 | $ | 2,267 | $ | 1,957 |
Nonperforming assets totaled $1.6 billion at September 30, 2023, flat compared to June 30, 2023. Nonperforming loans and leases held for investment were 0.46% of loans and leases held for investment at September 30, 2023, down one basis point compared to June 30, 2023.
Loans 90 days or more past due and still accruing totaled $574 million at September 30, 2023, down $88 million, or three basis points as a percentage of loans and leases, compared with the prior quarter primarily due to a decline in government guaranteed residential mortgages. Excluding government guaranteed loans, the ratio of loans 90 days or more past due and still accruing as a percentage of loans and leases was 0.04% at September 30, 2023, unchanged from June 30, 2023.
Loans 30-89 days past due and still accruing of $1.6 billion at September 30, 2023 were up $86 million, or four basis points as a percentage of loans and leases, compared to the prior quarter primarily due to increases in the consumer portfolio, partially offset by decreases in the commercial portfolio.
58 Truist Financial Corporation
Problem loans include NPLs and loans that are 90 days or more past due and still accruing as disclosed in Table 7. In addition, for the commercial portfolio segment, loans that are rated special mention or substandard performing are closely monitored by management as potential problem loans. Refer to “Note 5. Loans and ACL” for the amortized cost basis of loans by origination year and credit quality indicator as well as additional disclosures related to NPLs.
| Table 8: Asset Quality Ratios | ||||||||||||||||||||||||||||||||||||||||||||||||||||||||
| Sep 30, 2023 | Jun 30, 2023 | Mar 31, 2023 | Dec 31, 2022 | Sep 30, 2022 | ||||||||||||||||||||||||||||||||||||||||||||||||||||
| Loans 30-89 days past due and still accruing as a percentage of loans and leases HFI | 0.52 | % | 0.48 | % | 0.55 | % | 0.70 | % | 0.62 | % | ||||||||||||||||||||||||||||||||||||||||||||||
| Loans 90 days or more past due and still accruing as a percentage of loans and leases HFI | 0.18 | 0.21 | 0.42 | 0.49 | 0.54 | |||||||||||||||||||||||||||||||||||||||||||||||||||
| NPLs as a percentage of loans and leases HFI | 0.46 | 0.47 | 0.36 | 0.36 | 0.35 | |||||||||||||||||||||||||||||||||||||||||||||||||||
| NPLs as a percentage of total loans and leases(1) | 0.48 | 0.47 | 0.36 | 0.36 | 0.37 | |||||||||||||||||||||||||||||||||||||||||||||||||||
| NPAs as a percentage of: | ||||||||||||||||||||||||||||||||||||||||||||||||||||||||
| Total assets(1) | 0.29 | 0.29 | 0.22 | 0.23 | 0.23 | |||||||||||||||||||||||||||||||||||||||||||||||||||
| Loans and leases HFI plus foreclosed property | 0.48 | 0.49 | 0.38 | 0.38 | 0.37 | |||||||||||||||||||||||||||||||||||||||||||||||||||
| ALLL as a percentage of loans and leases HFI | 1.49 | 1.43 | 1.37 | 1.34 | 1.34 | |||||||||||||||||||||||||||||||||||||||||||||||||||
| Ratio of ALLL to NPLs | 3.2x | 3.0x | 3.8x | 3.7x | 3.8x | |||||||||||||||||||||||||||||||||||||||||||||||||||
| Loans 90 days or more past due and still accruing as a percentage of loans and leases HFI, excluding government guaranteed(2) | 0.04 | % | 0.04 | % | 0.04 | % | 0.04 | % | 0.04 | % | ||||||||||||||||||||||||||||||||||||||||||||||
(1)Includes LHFS.
(2)This asset quality ratio has been adjusted to remove the impact of government guaranteed loans. Management believes the inclusion of such assets in this asset quality ratio results in distortion of this ratio because collection of principal and interest is reasonably assured, or the ratio might not be comparable to other periods presented or to other portfolios that do not have government guarantees.
| Table 9: Asset Quality Ratios (Continued) | |||||||||||||||||||||||||||||||||||||||||||||||||||||||||||||||||||||||
| As of/For the Year-to-Date | |||||||||||||||||||||||||||||||||||||||||||||||||||||||||||||||||||||||
| Three Months Ended | Period Ended Sept. 30 | ||||||||||||||||||||||||||||||||||||||||||||||||||||||||||||||||||||||
| Sep 30, 2023 | Jun 30, 2023 | Mar 31, 2023 | Dec 31, 2022 | Sep 30, 2022 | 2023 | 2022 | |||||||||||||||||||||||||||||||||||||||||||||||||||||||||||||||||
| Net charge-offs as a percentage of average loans and leases HFI: | |||||||||||||||||||||||||||||||||||||||||||||||||||||||||||||||||||||||
| Commercial: | |||||||||||||||||||||||||||||||||||||||||||||||||||||||||||||||||||||||
| Commercial and industrial | 0.17 | % | 0.23 | % | 0.15 | % | 0.08 | % | 0.02 | % | 0.18 | % | 0.02 | % | |||||||||||||||||||||||||||||||||||||||||||||||||||||||||
| CRE | 1.31 | 0.62 | 0.09 | 0.19 | (0.01) | 0.68 | (0.03) | ||||||||||||||||||||||||||||||||||||||||||||||||||||||||||||||||
| Commercial construction | (0.03) | (0.02) | (0.04) | (0.06) | (0.10) | (0.03) | (0.07) | ||||||||||||||||||||||||||||||||||||||||||||||||||||||||||||||||
| Consumer: | |||||||||||||||||||||||||||||||||||||||||||||||||||||||||||||||||||||||
| Residential mortgage | 0.05 | (0.01) | — | (0.02) | 0.01 | 0.01 | (0.01) | ||||||||||||||||||||||||||||||||||||||||||||||||||||||||||||||||
| Home equity | (0.10) | (0.12) | (0.15) | (0.01) | (0.13) | (0.13) | (0.14) | ||||||||||||||||||||||||||||||||||||||||||||||||||||||||||||||||
| Indirect auto | 1.75 | 1.28 | 1.47 | 1.52 | 1.15 | 1.50 | 1.05 | ||||||||||||||||||||||||||||||||||||||||||||||||||||||||||||||||
| Other consumer | 1.37 | 1.20 | 1.29 | 1.11 | 1.31 | 1.29 | 1.16 | ||||||||||||||||||||||||||||||||||||||||||||||||||||||||||||||||
| Student | — | 8.67 | 0.42 | 0.34 | 0.40 | 4.40 | 0.34 | ||||||||||||||||||||||||||||||||||||||||||||||||||||||||||||||||
| Credit card | 3.78 | 3.66 | 3.54 | 3.68 | 2.80 | 3.66 | 2.74 | ||||||||||||||||||||||||||||||||||||||||||||||||||||||||||||||||
| Total(1) | 0.51 | 0.54 | 0.37 | 0.34 | 0.27 | 0.47 | 0.25 | ||||||||||||||||||||||||||||||||||||||||||||||||||||||||||||||||
| Ratio of ALLL to net charge-offs(2) | 2.9x | 2.6x | 3.7x | 4.1x | 5.0x | 3.1x | 5.7x |
Ratios are annualized, as applicable.
(1)2Q23 includes 12 basis point impact from student loan portfolio sale.
(2)Excluding the impact from the student loan charge-offs, the ALLL to annualized net charge-offs was 3.4X at June 30, 2023.
Truist Financial Corporation 59
The following table presents activity related to NPAs:
| Table 10: Rollforward of NPAs | |||||||||||||||||
| (Dollars in millions) | 2023 | 2022 | |||||||||||||||
| Balance, January 1 | $ | 1,250 | $ | 1,163 | |||||||||||||
| New NPAs | 2,365 | 1,452 | |||||||||||||||
| Advances and principal increases | 648 | 307 | |||||||||||||||
| Disposals of foreclosed assets(1) | (449) | (331) | |||||||||||||||
| Disposals of NPLs(2) | (132) | (80) | |||||||||||||||
| Charge-offs and losses | (708) | (332) | |||||||||||||||
| Payments | (1,022) | (590) | |||||||||||||||
| Transfers to performing status | (359) | (364) | |||||||||||||||
| Other, net | (9) | 15 | |||||||||||||||
| Ending balance, September 30 | $ | 1,584 | $ | 1,240 |
(1)Includes charge-offs and losses recorded upon sale of $131 million and $87 million for the nine months ended September 30, 2023 and 2022, respectively.
(2)Includes charge-offs and losses recorded upon sale of $31 million and a net gain upon sale of $1 million for the nine months ended September 30, 2023 and 2022, respectively.
CRE and Commercial Construction
Truist has noted that the CRE and commercial construction portfolios have the potential for heightened risk in the current environment. Truist maintains a high-quality portfolio through disciplined risk management and prudent client selection. In addition, the Company’s exposure to large CRE tends to have more institutional sponsorship and the Company has reduced exposure to smaller CRE. Truist’s CRE and commercial construction portfolios were $29.1 billion as of September 30, 2023.
Our office portfolio, which makes up approximately 17% of total CRE and commercial construction loans, is weighted towards Class A properties as of September 30, 2023. Truist maintains rigorous credit risk management surveillance routines across all loan portfolios. During 2023, Truist performed multiple reviews of the CRE office portfolio. Nonperforming loans in this portfolio have increased in this period.
| Table 11: CRE and Commercial Construction by Type | |||||||||||||||||||||||
| September 30, 2023 | December 31, 2022 | ||||||||||||||||||||||
| (Dollars in millions) | LHFI | NPL | LHFI | NPL | |||||||||||||||||||
| CRE and commercial construction: | |||||||||||||||||||||||
| Multifamily | $ | 9,161 | $ | 30 | $ | 7,762 | $ | — | |||||||||||||||
| Office | 5,070 | 278 | 5,258 | 75 | |||||||||||||||||||
| Industrial | 4,846 | 3 | 4,329 | — | |||||||||||||||||||
| Retail | 4,345 | 5 | 4,668 | 2 | |||||||||||||||||||
| Hotel | 2,542 | — | 2,965 | — | |||||||||||||||||||
| Other | 3,115 | 2 | 3,543 | 5 | |||||||||||||||||||
| Total | $ | 29,079 | $ | 318 | $ | 28,525 | $ | 82 | |||||||||||||||
See additional information on the CRE and commercial construction portfolios in “Note 5. Loans and ACL,” including loans by origination year and credit quality indicator.
60 Truist Financial Corporation
ACL
Activity related to the ACL is presented in the following tables:
| Table 12: Activity in ACL | ||||||||||||||||||||||||||||||||||||||||||||||||||
| Three Months Ended | Nine Months Ended September 30, | |||||||||||||||||||||||||||||||||||||||||||||||||
| (Dollars in millions) | Sep 30, 2023 | Jun 30, 2023 | Mar 31, 2023 | Dec 31, 2022 | Sep 30, 2022 | 2023 | 2022 | |||||||||||||||||||||||||||||||||||||||||||
| Balance, beginning of period(1) | $ | 4,879 | $ | 4,761 | $ | 4,649 | $ | 4,455 | $ | 4,434 | $ | 4,649 | $ | 4,695 | ||||||||||||||||||||||||||||||||||||
| Provision for credit losses | 497 | 558 | 482 | 467 | 234 | 1,537 | 310 | |||||||||||||||||||||||||||||||||||||||||||
| Charge-offs: | ||||||||||||||||||||||||||||||||||||||||||||||||||
| Commercial and industrial | (98) | (107) | (75) | (44) | (51) | (280) | (99) | |||||||||||||||||||||||||||||||||||||||||||
| CRE | (77) | (35) | (6) | (11) | — | (118) | (2) | |||||||||||||||||||||||||||||||||||||||||||
| Commercial construction | — | — | — | — | — | — | (1) | |||||||||||||||||||||||||||||||||||||||||||
| Residential mortgage | (8) | (1) | (1) | (1) | (4) | (10) | (8) | |||||||||||||||||||||||||||||||||||||||||||
| Home equity | (4) | (2) | (2) | (6) | (3) | (8) | (7) | |||||||||||||||||||||||||||||||||||||||||||
| Indirect auto | (135) | (115) | (127) | (129) | (103) | (377) | (282) | |||||||||||||||||||||||||||||||||||||||||||
| Other consumer | (120) | (104) | (105) | (96) | (109) | (329) | (285) | |||||||||||||||||||||||||||||||||||||||||||
| Student | — | (103) | (5) | (5) | (7) | (108) | (17) | |||||||||||||||||||||||||||||||||||||||||||
| Credit card | (55) | (53) | (51) | (53) | (42) | (159) | (123) | |||||||||||||||||||||||||||||||||||||||||||
| Total charge-offs | (497) | (520) | (372) | (345) | (319) | (1,389) | (824) | |||||||||||||||||||||||||||||||||||||||||||
| Recoveries: | ||||||||||||||||||||||||||||||||||||||||||||||||||
| Commercial and industrial | 28 | 13 | 13 | 14 | 43 | 54 | 73 | |||||||||||||||||||||||||||||||||||||||||||
| CRE | 2 | — | 1 | 1 | — | 3 | 7 | |||||||||||||||||||||||||||||||||||||||||||
| Commercial construction | — | — | 1 | 1 | 2 | 1 | 4 | |||||||||||||||||||||||||||||||||||||||||||
| Residential mortgage | 1 | 2 | 2 | 3 | 3 | 5 | 13 | |||||||||||||||||||||||||||||||||||||||||||
| Home equity | 7 | 5 | 6 | 6 | 8 | 18 | 19 | |||||||||||||||||||||||||||||||||||||||||||
| Indirect auto | 25 | 31 | 26 | 21 | 21 | 82 | 70 | |||||||||||||||||||||||||||||||||||||||||||
| Other consumer | 20 | 20 | 17 | 17 | 21 | 57 | 62 | |||||||||||||||||||||||||||||||||||||||||||
| Student | — | — | — | 1 | — | — | — | |||||||||||||||||||||||||||||||||||||||||||
| Credit card | 9 | 9 | 9 | 8 | 8 | 27 | 26 | |||||||||||||||||||||||||||||||||||||||||||
| Total recoveries | 92 | 80 | 75 | 72 | 106 | 247 | 274 | |||||||||||||||||||||||||||||||||||||||||||
| Net charge-offs | (405) | (440) | (297) | (273) | (213) | (1,142) | (550) | |||||||||||||||||||||||||||||||||||||||||||
| Other(2) | (1) | — | (73) | — | — | (74) | — | |||||||||||||||||||||||||||||||||||||||||||
| Balance, end of period | $ | 4,970 | $ | 4,879 | $ | 4,761 | $ | 4,649 | $ | 4,455 | $ | 4,970 | $ | 4,455 | ||||||||||||||||||||||||||||||||||||
| ACL:(1) | ||||||||||||||||||||||||||||||||||||||||||||||||||
| ALLL | $ | 4,693 | $ | 4,606 | $ | 4,479 | $ | 4,377 | $ | 4,205 | ||||||||||||||||||||||||||||||||||||||||
| RUFC | 277 | 273 | 282 | 272 | 250 | |||||||||||||||||||||||||||||||||||||||||||||
| Total ACL | $ | 4,970 | $ | 4,879 | $ | 4,761 | $ | 4,649 | $ | 4,455 |
(1)Excludes provision for credit losses and allowances related to other financial assets at amortized cost.
(2)The first quarter of 2023 includes the impact from the adoption of the Troubled Debt Restructurings and Vintage Disclosures accounting standard.
The allowance for credit losses was $5.0 billion and includes $4.7 billion for the allowance for loan and lease losses and $277 million for the reserve for unfunded commitments. The ALLL ratio was 1.49%, up six basis points compared with June 30, 2023. The ALLL covered nonperforming loans and leases held for investment 3.2X compared to 3.0X at June 30, 2023. At September 30, 2023, the ALLL was 2.9X annualized net charge-offs, compared to 2.6X at June 30, 2023. The ALLL to annualized net charge-offs for the prior quarter was impacted by the charge-off related to the sale of the student loan portfolio. Excluding the impact from the student loan charge-offs, the ALLL to annualized net charge-offs was 3.4X at June 30, 2023.
Truist Financial Corporation 61
The following table presents an allocation of the ALLL. The entire amount of the allowance is available to absorb losses occurring in any category of loans and leases.
| Table 13: Allocation of ALLL by Category | |||||||||||||||||||||||||||||||||||
| September 30, 2023 | December 31, 2022 | ||||||||||||||||||||||||||||||||||
| (Dollars in millions) | Amount | % ALLL in Each Category | % Loans in Each Category | Amount | % ALLL in Each Category | % Loans in Each Category | |||||||||||||||||||||||||||||
| Commercial and industrial | $ | 1,351 | 28.8 | % | 51.5 | % | $ | 1,409 | 32.3 | % | 50.3 | % | |||||||||||||||||||||||
| CRE | 605 | 12.9 | 7.2 | 224 | 5.1 | 7.0 | |||||||||||||||||||||||||||||
| Commercial construction | 165 | 3.5 | 2.0 | 46 | 1.1 | 1.8 | |||||||||||||||||||||||||||||
| Residential mortgage | 301 | 6.4 | 17.7 | 399 | 9.1 | 17.4 | |||||||||||||||||||||||||||||
| Home equity | 86 | 1.8 | 3.2 | 90 | 2.0 | 3.3 | |||||||||||||||||||||||||||||
| Indirect auto | 945 | 20.1 | 7.6 | 981 | 22.4 | 8.6 | |||||||||||||||||||||||||||||
| Other consumer | 866 | 18.5 | 9.2 | 770 | 17.6 | 8.5 | |||||||||||||||||||||||||||||
| Student | — | — | — | 98 | 2.2 | 1.6 | |||||||||||||||||||||||||||||
| Credit card | 374 | 8.0 | 1.6 | 360 | 8.2 | 1.5 | |||||||||||||||||||||||||||||
| Total ALLL | 4,693 | 100.0 | % | 100.0 | % | 4,377 | 100.0 | % | 100.0 | % | |||||||||||||||||||||||||
| RUFC | 277 | 272 | |||||||||||||||||||||||||||||||||
| Total ACL | $ | 4,970 | $ | 4,649 |
Truist monitors the performance of its home equity loans and lines secured by second liens similarly to other consumer loans and utilizes assumptions specific to these loans in determining the necessary ALLL. Truist also receives notification when the first lien holder, whether Truist or another financial institution, has initiated foreclosure proceedings against the borrower. When notified that the first lien is in the process of foreclosure, Truist obtains valuations to determine if any additional charge-offs or reserves are warranted. These valuations are updated at least annually thereafter.
Truist has limited ability to monitor the delinquency status of the first lien, unless the first lien is held or serviced by Truist. Truist estimates credit losses on second lien loans where the first lien is delinquent based on historical experience; the increased risk of loss on these credits is reflected in the ALLL. As of September 30, 2023, Truist held or serviced the first lien on 32% of its second lien positions.
Other Assets
The components of other assets are presented in the following table:
| Table 14: Other Assets as of Period End | ||||||||||||||
| (Dollars in millions) | Sep 30, 2023 | Dec 31, 2022 | ||||||||||||
| Bank-owned life insurance | $ | 7,694 | $ | 7,618 | ||||||||||
| Tax credit and other private equity investments | 7,449 | 6,825 | ||||||||||||
| Prepaid pension assets | 5,964 | 4,539 | ||||||||||||
| DTAs | 3,545 | 3,027 | ||||||||||||
| Accounts receivable | 2,659 | 2,682 | ||||||||||||
| Accrued income | 2,335 | 2,265 | ||||||||||||
| Leased assets and related assets | 1,914 | 2,082 | ||||||||||||
| FHLB stock | 1,284 | 1,279 | ||||||||||||
| ROU assets | 1,112 | 1,193 | ||||||||||||
| Prepaid expenses | 1,143 | 1,162 | ||||||||||||
| Equity securities at fair value | 330 | 898 | ||||||||||||
| Derivative assets | 749 | 684 | ||||||||||||
| Other | 615 | 874 | ||||||||||||
| Total other assets | $ | 36,793 | $ | 35,128 | ||||||||||
62 Truist Financial Corporation
Funding Activities
Deposits
The following table presents average deposits:
| Table 15: Average Deposits | ||||||||||||||||||||||||||||||||
| Three Months Ended | ||||||||||||||||||||||||||||||||
| (Dollars in millions) | Sep 30, 2023 | Jun 30, 2023 | Mar 31, 2023 | Dec 31, 2022 | Sep 30, 2022 | |||||||||||||||||||||||||||
| Noninterest-bearing deposits | $ | 118,905 | $ | 123,728 | $ | 131,099 | $ | 141,032 | $ | 146,041 | ||||||||||||||||||||||
| Interest checking | 101,252 | 102,105 | 108,886 | 110,001 | 111,645 | |||||||||||||||||||||||||||
| Money market and savings | 139,961 | 138,149 | 139,802 | 144,730 | 147,659 | |||||||||||||||||||||||||||
| Time deposits | 40,920 | 35,844 | 28,671 | 17,513 | 14,751 | |||||||||||||||||||||||||||
| Total average deposits | $ | 401,038 | $ | 399,826 | $ | 408,458 | $ | 413,276 | $ | 420,096 |
Average deposits for the third quarter of 2023 were $401.0 billion, an increase of $1.2 billion, or 0.3%, compared to the prior quarter.
Average noninterest-bearing deposits decreased 3.9% compared to the prior quarter and represented 29.6% of total deposits for the third quarter of 2023 compared to 30.9% for the second quarter of 2023 and 34.8% compared to the year ago quarter. Average time deposits increased 14% due to increases in retail client time deposits, primarily due to migration from other deposit products, and brokered time deposits. Average brokered deposits were $33.0 billion, up $6.8 billion compared to the prior quarter.
Truist has a very granular and relationship-based deposit franchise. Approximately 64% of deposits are insured or collateralized. Truist deposit accounts are typically based on long-term relationships and include multiple products and services.
The estimated amount of deposits that are uninsured was $164.5 billion, $171.8 billion, $175.9 billion, and $189.6 billion as of September 30, 2023, June 30, 2023, March 31, 2023, and December 31, 2022, respectively, calculated using the same methodology as the Call Report for Truist Bank. The decrease in uninsured deposits from December 31, 2022 to June 30, 2023 was largely due to commercial clients that chose to diversify into money market mutual funds or across multiple banks late in the first quarter. These outflows were primarily higher-cost, non-operational deposits. The decrease in uninsured deposits during the third quarter of 2023 was primarily due to the maturity of large denominated negotiable certificates of deposit.
Borrowings
At September 30, 2023, short-term borrowings totaled $23.5 billion, an increase of $63 million compared to December 31, 2022. Average short-term borrowings were $24.3 billion, or 5.1% of total funding, for the nine months ended September 30, 2023, as compared to $11.4 billion, or 2.4%, for the same period in the prior year.
Long-term debt provides funding and, to a lesser extent, regulatory capital, and primarily consists of senior and subordinated notes issued by Truist and Truist Bank. Long-term debt totaled $41.2 billion at September 30, 2023, a decrease of $2.0 billion compared to December 31, 2022. During the nine months ended September 30, 2023, the Company had:
-
Maturities and redemptions of $4.5 billion of senior notes.
-
Issued $6.3 billion fixed-to-floating rate senior notes with interest rates between 4.87% and 6.05% due from June 8, 2027 to June 8, 2034.
-
Net redemptions of $3.2 billion of FHLB floating rate advances as issuances in the first quarter of 2023 were more than offset by redemptions in the second and third quarters.
Truist Financial Corporation 63
Shareholders’ Equity
Truist’s book value per common share and TBVPS are presented in the following table:
| Table 16: Book Value per Common Share | ||||||||||||||
| (Dollars in millions, except per share data, shares in thousands) | Sep 30, 2023 | Dec 31, 2022 | ||||||||||||
| Common equity per common share | $ | 41.37 | $ | 40.58 | ||||||||||
| Non-GAAP capital measure:(1) | ||||||||||||||
| Tangible common equity per common share | $ | 19.25 | $ | 18.04 | ||||||||||
| Calculation of tangible common equity:(1) | ||||||||||||||
| Total shareholders’ equity | $ | 62,007 | $ | 60,537 | ||||||||||
| Less: | ||||||||||||||
| Preferred stock | 6,673 | 6,673 | ||||||||||||
| Noncontrolling interests | 167 | 23 | ||||||||||||
| Goodwill and intangible assets, net of deferred taxes | 29,491 | 29,908 | ||||||||||||
| Tangible common equity | $ | 25,676 | $ | 23,933 | ||||||||||
| Common shares outstanding at end of period | 1,333,668 | 1,326,829 | ||||||||||||
(1)Tangible common equity and related measures are non-GAAP measures that exclude the impact of intangible assets, net of deferred taxes, and their related amortization. These measures are useful for evaluating the performance of a business consistently, whether acquired or developed internally. Truist’s management uses these measures to assess profitability, returns relative to balance sheet risk, and shareholder value.
Total shareholders’ equity was $62.0 billion at September 30, 2023, an increase of $1.5 billion from December 31, 2022. This increase includes $4.0 billion in net income and $1.4 billion received in connection with the IH minority stake sale, net of tax, partially offset by $2.4 billion in common and preferred dividends and a $2.0 billion decrease in AOCI. Truist’s book value per common share at September 30, 2023 was $41.37, compared to $40.58 at December 31, 2022. Truist TBVPS of $19.25 at September 30, 2023, increased 6.7% compared to December 31, 2022.
Risk Management
Truist maintains a comprehensive risk management framework supported by people, processes, and systems to identify, measure, monitor, manage, and report significant risks arising from its exposures and business activities. Effective risk management involves optimizing risk and return while operating in a safe and sound manner, and promoting compliance with applicable laws and regulations. The Company’s risk management framework promotes the execution of business strategies and objectives in alignment with its risk appetite.
Truist has developed and employs a risk framework that further guides business functions in identifying, measuring, responding to, monitoring, and reporting on possible exposures to the organization. The risk taxonomy drives internal risk measurement and monitoring and enables Truist to clearly and transparently communicate to stakeholders the level of potential risk the Company faces and the Company’s position on managing risk to acceptable levels.
Truist is committed to fostering a culture that supports identification and escalation of risks across the organization. All teammates are responsible for upholding the Company’s purpose, mission, and values, and are encouraged to speak up if there is any activity or behavior that is inconsistent with the Company’s culture. The Truist code of ethics guides the Company’s decision making and informs teammates on how to act in the absence of specific guidance.
Truist seeks an appropriate return for the risk taken in its business operations. Risk-taking activities are evaluated and prioritized to identify those that present attractive risk-adjusted returns, while preserving asset value and capital.
Truist’s compensation plans are designed to consider teammate’s adherence to and successful implementation of Truist’s risk values and associated policies and procedures. The Company’s compensation structure supports its core values and sound risk management practices in an effort to promote judicious risk-taking behavior.
Refer to Truist’s Annual Report on Form 10-K for the year ended December 31, 2022 for additional disclosures under the section titled “Risk Management.”
Market Risk
Market risk is the risk to current or anticipated earnings, capital, or economic value arising from changes in the market value of portfolios, securities, or other financial instruments. Market risk results from changes in the level, volatility, or correlations among financial market risk factors or prices, including interest rates, credit spreads, foreign exchange rates, equity, and commodity prices.
64 Truist Financial Corporation
Effective management of market risk is essential to achieving Truist’s strategic financial objectives. Truist’s most significant market risk exposure is to interest rate risk in its balance sheet; however, market risk also results from underlying product liquidity risk, price risk, and volatility risk in Truist’s business units. Interest rate risk results from differences between the timing of rate changes and the timing of cash flows associated with assets and liabilities (re-pricing risk); from changing rate relationships among different yield curves affecting bank activities (basis risk); from changing rate relationships across the spectrum of maturities (yield curve risk); and from interest-related options inherently embedded in bank products (options risk).
The primary objectives of effective market risk management are to minimize adverse effects from changes in market risk factors on net interest income, net income, and capital, and to offset the risk of price changes for certain assets and liabilities recorded at fair value. At Truist, market risk management also includes the enterprise-wide IPV function.
Interest Rate Market Risk
As a financial institution, Truist is exposed to interest rate risk from assets, liabilities, and off-balance sheet positions. To keep net interest margin as stable as possible, Truist actively manages its interest rate risk exposure through the strategic repricing of its assets and liabilities, taking into account the volumes, maturities, and mix. Truist primarily uses two methods to measure and monitor its interest rate risk: (i) simulations of possible changes to net interest income based on instantaneous and gradual changes in interest rates and (ii) analysis of economic value of equity based on changes in interest rates.
The Company’s simulation model takes into account assumptions related to prepayment trends, using a combination of market data and internal historical experiences for deposits and loans, as well as scheduled maturities and payments, and the expected outlook for the economy and interest rates. These assumptions are reviewed and adjusted monthly to reflect changes in current interest rates compared to the rates applicable to Truist’s assets and liabilities. The model also considers Truist’s current and prospective liquidity position, current balance sheet volumes, projected growth and/or contractions, accessibility of funds for short-term needs and capital maintenance.
Deposit betas (the sensitivity of deposit rate changes relative to market rate changes) are an important assumption in the interest rate risk modeling process. Truist applies deposit beta assumptions to non-maturity interest-bearing deposit accounts when determining its interest rate sensitivity. Non-maturity, interest-bearing deposit accounts include interest checking accounts, savings accounts, and money market accounts that do not have a contractual maturity. Truist applies an average deposit beta of approximately 50% to its interest-bearing accounts when determining its interest rate sensitivity, which is consistent with Truist’s long-term expectations. Truist also regularly conducts sensitivity analyses on other key variables, including noninterest-bearing deposits, to determine the impact these variables could have on the Company’s interest rate risk position. The predictive value of the simulation model depends upon the accuracy of the assumptions, but management believes that it provides helpful information for the management of interest rate risk.
The following table shows the effect that the indicated changes in interest rates would have on net interest income as projected for the next 12 months assuming a gradual change in interest rates as described below.
| Table 17: Interest Sensitivity Simulation Analysis | ||||||||||||||||||||||||||
| Interest Rate Scenario | Annualized Hypothetical Percentage Change in Net Interest Income | |||||||||||||||||||||||||
| Gradual Change in Prime Rate (bps) | Prime Rate | |||||||||||||||||||||||||
| Sep 30, 2023 | Sep 30, 2022 | Sep 30, 2023 | Sep 30, 2022 | |||||||||||||||||||||||
| Up 100 | 9.50 | % | 7.25 | % | (1.03) | % | 0.37 | % | ||||||||||||||||||
| Up 50 | 9.00 | 6.75 | (0.67) | 0.39 | ||||||||||||||||||||||
| No Change | 8.50 | 6.25 | — | — | ||||||||||||||||||||||
| Down 50 | 8.00 | 5.75 | 0.11 | (1.77) | ||||||||||||||||||||||
| Down 100 | 7.50 | 5.25 | 0.29 | (2.43) |
Net interest income is liability sensitive as elevated rates and quantitative tightening have led to a reduction in deposits, rotation into interest bearing deposits, and higher deposit betas.
Interest rate scenarios in table 17 assume no change in deposit mix. Further rotation from non-interest bearing into interest bearing deposits would increase the liability sensitivity of Truist’s balance sheet.
Management considers how the interest rate risk position could be impacted by changes in balance sheet mix.
The following table shows the results of Truist’s interest-rate sensitivity position assuming the loss of additional demand deposits and an associated increase in managed rate deposits versus current projections under various interest rate scenarios. For purposes of this analysis, Truist modeled the incremental beta of managed rate deposits for the replacement of the demand deposits at 100%
Truist Financial Corporation 65
.
| Table 18: Deposit Mix Sensitivity Analysis | ||||||||||||||||||||
| Gradual Change in Rates (bps) | Base Scenario at September 30, 2023**(1)** | Results Assuming a Decrease in Noninterest-Bearing Demand Deposits | ||||||||||||||||||
| $20 Billion | $40 Billion | |||||||||||||||||||
| Up 100 | (1.03) | % | (1.81) | % | (2.58) | % | ||||||||||||||
| Up 50 | (0.67) | (1.23) | (1.80) |
(1)The base scenario is equal to the annualized hypothetical percentage change in net interest income at September 30, 2023 as presented in the preceding table.
Truist uses financial instruments including derivatives to manage interest rate risk related to securities, commercial loans, MSRs, mortgage banking operations, long-term debt, and other funding sources. Truist has utilized derivatives to facilitate transactions on behalf of its clients and as part of associated hedging activities. As of September 30, 2023, Truist had derivative financial instruments outstanding with notional amounts totaling $379.8 billion. See “Note 16. Derivative Financial Instruments” for additional disclosures. In the third quarter of 2023, there was a $125 billion decrease in notional amounts on derivatives with central clearing parties as a result of conversion from LIBOR to SOFR. The decline in notional is due to the maturity of short-term LIBOR swaps entered into in the second quarter of 2023 to maintain LIBOR cashflows until the phase out of the LIBOR reference rate on June 30th, 2023. All remaining short-term impacts of the conversion are expected to mature in the fourth quarter of 2023.
LIBOR Transition
The remaining tenors of U.S. dollar LIBOR ceased publication on June 30, 2023. Truist provided timely notices and information to impacted clients about the transition to new interest rates post cessation. Most contracts were transitioned to new rates in July and August 2023. A small number of contracts utilize longer tenor LIBOR rates and will transition by late 2023 (3-month LIBOR) or early 2024 (6-month and 12-month LIBOR) based on contractual agreements. Truist has materially completed LIBOR transition efforts, primarily utilizing SOFR replacement rates, and closed formal project efforts as of September 2023.
Fallback language used to remediate loan agreements was generally consistent with ARRC recommendations and included use of “hardwired fallback” language, which transitioned loans to a SOFR based rate after June 30, 2023. For contracts remaining without fallback language, Truist leveraged the LIBOR Act and corresponding safe harbor provision to transition these loans to SOFR. Truist’s adjustable-rate mortgage products had consistent and adequate fallback language to transition to SOFR, based on lender discretion and as supported by the LIBOR Act; therefore, these contracts did not require remediation. For many consumer lending portfolios, LIBOR transitioned to the SOFR rate specified in the LIBOR Act and the rules promulgated thereunder by the FRB and benefit from the safe harbor provisions of the LIBOR Act.
Derivatives that reference LIBOR transitioned to a SOFR-based replacement rate as set forth in the ISDA protocol addressing LIBOR fallbacks between the Company and its counterparties which have adhered to the protocol, through bilateral amendments between the Company and each of its counterparties, or as established under the LIBOR Act and rules promulgated thereunder by the FRB. Fallback language used to remediate LIBOR based derivatives was generally consistent with ISDA publications.
The Company’s preferred securities and the Company’s and Truist Bank’s floating rate notes that reference LIBOR transitioned to a SOFR based rate utilizing application of the LIBOR Act and the rules promulgated thereunder by the FRB. Truist announced that these securities would move to a 3-month adjusted Term SOFR in accordance with the LIBOR Act. See “Note 12. Shareholders’ Equity” in Truist’s Annual Report on Form 10-K for information about preferred stock using LIBOR.
66 Truist Financial Corporation
Market Risk from Trading Activities
As a financial intermediary, Truist provides its clients access to derivatives, foreign exchange and securities markets, which generate market risks. Trading market risk is managed using a comprehensive risk management approach, which includes measuring risk using VaR, stress testing, and sensitivity analysis. Risk metrics are monitored against a suite of limits on a daily basis at both the trading desk level and at the aggregate portfolio level, which is intended to ensure that exposures are in line with Truist’s risk appetite.
Truist is also subject to risk-based capital guidelines for market risk under the Market Risk Rule.
Covered Trading Positions
Covered positions subject to the Market Risk Rule include trading assets and liabilities, specifically those held for the purpose of short-term resale or with the intent of benefiting from actual or expected short-term price movements or to lock in arbitrage profits. Truist’s trading portfolio of covered positions results primarily from market making and underwriting services for the Company’s clients, as well as associated risk mitigating hedging activity. The trading portfolio, measured in terms of VaR, consists primarily of four sub-portfolios of covered positions: (i) credit trading, (ii) fixed income securities, (iii) interest rate derivatives, and (iv) equity derivatives. As a market maker across different asset classes, Truist’s trading portfolio also contains other sub-portfolios, including foreign exchange, loan trading, and commodity derivatives; however, these portfolios do not generate material trading risk exposures.
Valuation policies and methodologies exist for all trading positions. Additionally, these positions are subject to independent price verification. See “Note 16. Derivative Financial Instruments,” “Note 15. Fair Value Disclosures,” and “Critical Accounting Policies” herein for discussion of valuation policies and methodologies.
Securitizations
As of September 30, 2023, the aggregate market value of on-balance sheet securitization positions subject to the Market Risk Rule was $91 million, all of which were non-agency asset backed securities positions. Consistent with the Market Risk Rule requirements, the Company performs pre-purchase due diligence on each securitization position to identify the characteristics including, but not limited to, deal structure and the asset quality of the underlying assets, that materially affect valuation and performance. Securitization positions are subject to Truist’s comprehensive risk management framework, which includes daily monitoring against a suite of limits. There were no off-balance sheet securitization positions during the reporting period.
Correlation Trading Positions
The trading portfolio of covered positions did not contain any correlation trading positions as of September 30, 2023.
VaR-Based Measures
VaR measures the potential loss of a given position or portfolio of positions at a specified confidence level and time horizon. Truist utilizes a historical VaR methodology to measure and aggregate risks across its covered trading positions. For risk management purposes, the VaR calculation is based on a historical simulation approach and measures the potential trading losses using a one-day holding period at a one-tail, 99% confidence level. For Market Risk Rule purposes, the Company calculates VaR using a 10-day holding period and a 99% confidence level. Due to inherent limitations of the VaR methodology, such as the assumption that past market behavior is indicative of future market performance, VaR is only one of several tools used to measure and manage market risk. Other tools used to actively manage market risk include stress testing, scenario analysis, and stop loss limits.
The trading portfolio’s VaR profile is influenced by a variety of factors, including the size and composition of the portfolio, market volatility, and the correlation between different positions. A portfolio of trading positions is typically less risky than the sum of the risk from each of the individual sub-portfolios, because, under normal market conditions, risk within each category partially offsets the exposure to other risk categories. The following table summarizes certain VaR-based measures for the three months and nine months ended September 30, 2023 and 2022. Average one and ten-day VaR measures for the three months ended September 30, 2023 increased from the same period of last year, primarily driven by higher market making inventory.
Truist Financial Corporation 67
| Table 19: VaR-based Measures | |||||||||||||||||||||||||||||||||||||||||||||||
| Three Months Ended September 30, | Nine Months Ended September 30, | ||||||||||||||||||||||||||||||||||||||||||||||
| 2023 | 2022 | 2023 | 2022 | ||||||||||||||||||||||||||||||||||||||||||||
| (Dollars in millions) | 10-Day Holding Period | 1-Day Holding Period | 10-Day Holding Period | 1-Day Holding Period | 10-Day Holding Period | 1-Day Holding Period | 10-Day Holding Period | 1-Day Holding Period | |||||||||||||||||||||||||||||||||||||||
| VaR-based Measures: | |||||||||||||||||||||||||||||||||||||||||||||||
| Maximum | $ | 22 | $ | 9 | $ | 27 | $ | 7 | $ | 24 | $ | 9 | $ | 38 | $ | 14 | |||||||||||||||||||||||||||||||
| Average | 18 | 7 | 18 | 5 | 17 | 6 | 17 | 5 | |||||||||||||||||||||||||||||||||||||||
| Minimum | 15 | 5 | 13 | 4 | 10 | 4 | 6 | 3 | |||||||||||||||||||||||||||||||||||||||
| Period-end | 17 | 7 | 20 | 6 | 17 | 7 | 20 | 6 | |||||||||||||||||||||||||||||||||||||||
| VaR by Risk Class: | |||||||||||||||||||||||||||||||||||||||||||||||
| Interest Rate Risk | 6 | 8 | 6 | 8 | |||||||||||||||||||||||||||||||||||||||||||
| Credit Spread Risk | 6 | 7 | 6 | 7 | |||||||||||||||||||||||||||||||||||||||||||
| Equity Price Risk | 4 | 2 | 4 | 2 | |||||||||||||||||||||||||||||||||||||||||||
| Foreign Exchange Risk | — | — | — | — | |||||||||||||||||||||||||||||||||||||||||||
| Portfolio Diversification | (10) | (11) | (10) | (11) | |||||||||||||||||||||||||||||||||||||||||||
| Period-end | 6 | 6 | 6 | 6 |
Stressed VaR-based measures
Stressed VaR, another component of market risk capital, is calculated using the same internal models as used for the VaR-based measure. Stressed VaR is calculated over a ten-day holding period at a one-tail, 99% confidence level and employs a historical simulation approach based on a continuous twelve-month historical window selected to reflect a period of significant financial stress for the Company’s trading portfolio. The following table summarizes Stressed VaR-based measures:
| Table 20: Stressed VaR-based Measures - 10 Day Holding Period | |||||||||||||||||||||||
| Three Months Ended September 30, | Nine Months Ended September 30, | ||||||||||||||||||||||
| (Dollars in millions) | 2023 | 2022 | 2023 | 2022 | |||||||||||||||||||
| Maximum | $ | 130 | $ | 91 | $ | 130 | $ | 109 | |||||||||||||||
| Average | 85 | 65 | 61 | 69 | |||||||||||||||||||
| Minimum | 44 | 48 | 25 | 40 | |||||||||||||||||||
| Period-end | 119 | 65 | 119 | 65 |
Compared to the prior year, Stressed VaR measures decreased over the nine months ended September 30 this year, primarily due to higher diversification benefits in 2023.
Specific Risk Measures
Specific risk is a measure of idiosyncratic risk that could result from risk factors other than broad market movements (e.g., default or event risks). The Market Risk Rule provides fixed risk weights under a standardized measurement method while also allowing a model-based approach, subject to regulatory approval. Truist utilizes the standardized measurement method to calculate the specific risk component of market risk regulatory capital. As such, incremental risk capital requirements do not apply.
VaR Model Backtesting
In accordance with the Market Risk Rule, the Company evaluates the accuracy of its VaR model through daily backtesting by comparing aggregate daily trading gains and losses (excluding fees, commissions, reserves, net interest income, and intraday trading) from covered positions with the corresponding daily VaR-based measures generated by the model. As illustrated in the following graph, there were no Company-wide VaR backtesting exceptions during the twelve months ended September 30, 2023. The total number of Company-wide VaR backtesting exceptions over the preceding twelve months is used to determine the multiplication factor for the VaR-based capital requirement under the Market Risk Rule. The capital multiplication factor increases from a minimum of three to a maximum of four, depending on the number of exceptions. All Company-wide VaR backtesting exceptions are thoroughly reviewed in the context of VaR model use and performance. There was no change in the capital multiplication factor over the preceding twelve months.
68 Truist Financial Corporation
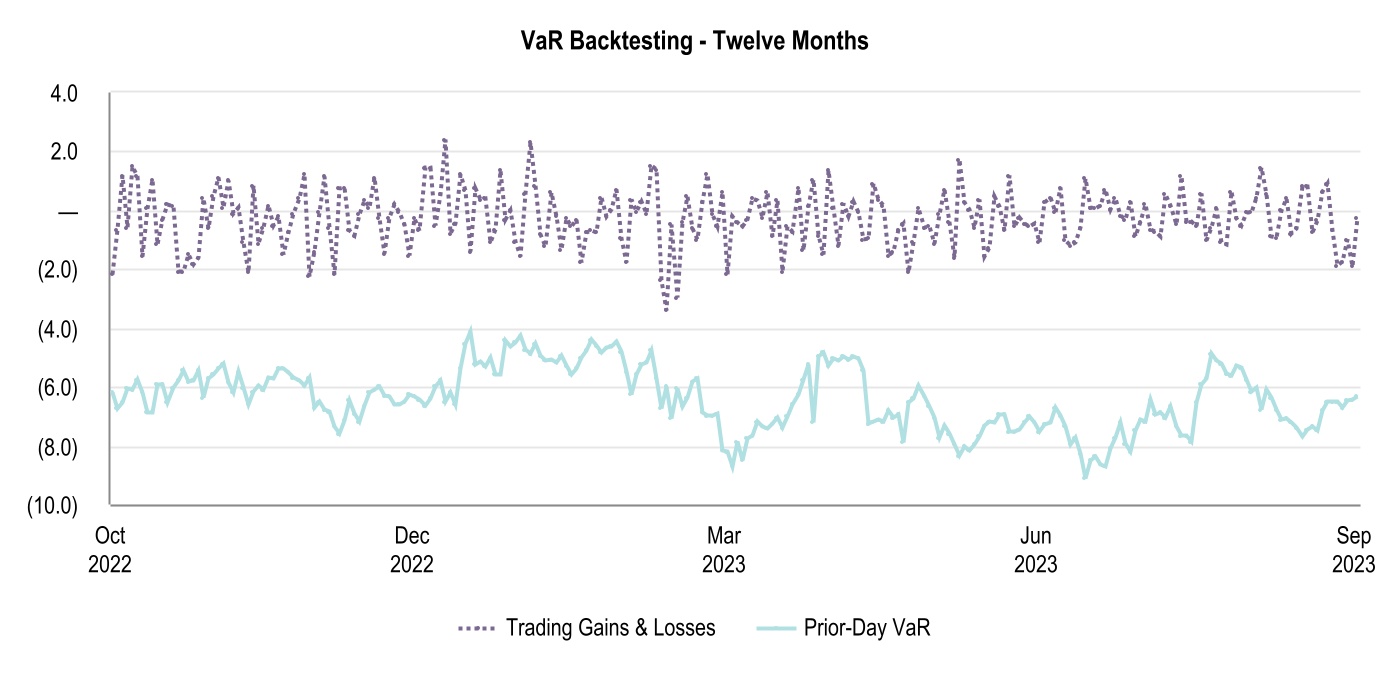
Model Risk Oversight
MRO is responsible for the independent model validation of all decision tools and models including trading market risk models. The validation activities are conducted in accordance with MRO policy, which incorporates regulatory guidance related to the evaluation of model conceptual soundness, ongoing monitoring, and outcomes analysis. As part of ongoing monitoring efforts, the performance of all trading risk models are reviewed regularly to preemptively address emerging developments in financial markets, assess evolving modeling approaches, and identify potential model enhancement.
Stress Testing
The Company uses a comprehensive range of stress testing techniques to help monitor risks across trading desks and to augment standard daily VaR and other risk limits reporting. The stress testing framework is designed to quantify the impact of extreme, but plausible, stress scenarios that could lead to large, unexpected losses. Stress tests include simulations for historical repeats and hypothetical risk factor shocks. All trading positions within each applicable market risk category (interest rate risk, equity risk, foreign exchange rate risk, credit spread risk, and commodity price risk) are included in the Company’s comprehensive stress testing framework. Management reviews stress testing scenarios on an ongoing basis and makes updates, as necessary, which is intended to ensure that both current and emerging risks are captured appropriately. Management also utilizes stress analyses to support the Company’s capital adequacy assessment standards. See the “Capital” section of MD&A for additional discussion of capital adequacy.
Liquidity
Liquidity represents the continuing ability to meet funding needs, including deposit withdrawals, repayment of borrowings and other liabilities, and funding of loan commitments. In addition to the level of liquid assets, such as cash, cash equivalents, and AFS securities, other factors affect the ability to meet liquidity needs, including access to a variety of funding sources, maintaining borrowing capacity, growing core deposits, loan repayment, and the ability to securitize or package loans for sale.
Truist monitors the ability to meet client demand for funds under both normal and stressed market conditions. In considering its liquidity position, management evaluates Truist’s funding mix based on client core funding, client rate-sensitive funding, and national markets funding. In addition, management evaluates exposure to rate-sensitive funding sources that mature in one year or less. Management also measures liquidity needs against 30 days of stressed cash outflows for Truist and Truist Bank. To ensure a strong liquidity position and compliance with regulatory requirements, management maintains a liquid asset buffer of cash on hand and highly liquid unencumbered securities.
Truist Financial Corporation 69
Internal Liquidity Stress Testing
Liquidity stress testing is designed to ensure that Truist and Truist Bank have sufficient liquidity for a variety of institution-specific and market-wide adverse scenarios. Each liquidity stress test scenario applies defined assumptions to execute sources and uses of liquidity over varying planning horizons. The types of expected liquidity uses during a stressed event may include deposit attrition, contractual maturities, reductions in unsecured and secured funding, and increased draws on unfunded commitments. To mitigate liquidity outflows, Truist has identified sources of liquidity; however, access to these sources of liquidity could be affected within a stressed environment.
Truist maintains a liquidity buffer of cash on hand and highly liquid unencumbered securities that is sufficient to meet the projected net stressed cash-flow needs and maintain compliance with regulatory requirements. The liquidity buffer consists of unencumbered highly liquid assets and Truist’s liquidity buffer is substantially the same in composition to what qualifies as HQLA under the LCR Rule.
Contingency Funding Plan
Truist has a contingency funding plan designed to ensure that liquidity sources are sufficient to meet ongoing obligations and commitments, particularly in the event of a liquidity contraction. This plan is designed to examine and quantify the organization’s liquidity under the various internal liquidity stress scenarios and is periodically tested to assess the plan’s reliability. Additionally, the plan provides a framework for management and other teammates to follow in the event of a liquidity contraction or in anticipation of such an event. The plan addresses authority for activation and decision making, liquidity options, and the responsibilities of key departments in the event of a liquidity contraction.
LCR and HQLA
The LCR rule requires that Truist and Truist Bank maintain an amount of eligible HQLA that is sufficient to meet its estimated total net cash outflows over a prospective 30 calendar-day period of stress. Eligible HQLA, for purposes of calculating the LCR, is the amount of unencumbered HQLA that satisfy operational requirements of the LCR rule. Truist and Truist Bank are subject to the Category III reduced LCR requirements. Truist held average weighted eligible HQLA of $83.8 billion and Truist’s average LCR was 110% for the three months ended September 30, 2023.
Effective July 2021, Truist became subject to final rules implementing the NSFR, which are designed to ensure that banking organizations maintain a stable, long-term funding profile in relation to their asset composition and off-balance sheet activities. At September 30, 2023, Truist was compliant with this requirement.
Sources of Funds
Management believes current sources of liquidity are sufficient to meet Truist’s on- and off-balance sheet obligations. Truist funds its balance sheet through diverse sources of funding including client deposits, secured and unsecured capital markets funding, and shareholders’ equity. Truist Bank’s primary source of funding is client deposits. Continued access to client deposits is highly dependent on public confidence in the stability of Truist Bank and its ability to return funds to clients when requested.
Truist Bank maintains a number of diverse funding sources to meet its liquidity requirements. These sources include unsecured borrowings from the capital markets through the issuance of senior or subordinated bank notes, institutional CDs, overnight and term Federal funds markets, and retail brokered CDs. Truist Bank also maintains access to secured borrowing sources including FHLB advances, repurchase agreements, and the FRB discount window. Available investment securities could be pledged to create additional secured borrowing capacity. The following table presents a summary of Truist Bank’s available secured borrowing capacity and eligible cash at the FRB:
| Table 21: Selected Liquidity Sources | |||||||||||
| (Dollars in millions) | Sep 30, 2023 | Dec 31, 2022 | |||||||||
| Unused borrowing capacity: | |||||||||||
| FRB | $ | 54,633 | $ | 49,250 | |||||||
| FHLB | 23,615 | 20,770 | |||||||||
| Available investment securities (after haircuts) | 73,010 | 85,401 | |||||||||
| Available secured borrowing capacity | 151,258 | 155,421 | |||||||||
| Eligible cash at the FRB | 24,177 | 15,556 | |||||||||
| Total | $ | 175,435 | $ | 170,977 |
At September 30, 2023, Truist Bank’s available secured borrowing capacity represented approximately 3.5 times the amount of wholesale funding maturities in one-year or less. Truist additionally has the ability to increase sources of funding by pledging available investment securities to receive the par value of the collateral under the FRB Bank Term Funding Program.
70 Truist Financial Corporation
Parent Company
The Parent Company serves as the primary source of capital for the operating subsidiaries. The Parent Company’s assets consist primarily of cash on deposit with Truist Bank, equity investments in subsidiaries, advances to subsidiaries, and notes receivable from subsidiaries. The principal obligations of the Parent Company are payments on long-term debt. The main sources of funds for the Parent Company are dividends and management fees from subsidiaries, repayments of advances to subsidiaries, and proceeds from the issuance of equity and long-term debt. The primary uses of funds by the Parent Company are investments in subsidiaries, advances to subsidiaries, dividend payments to common and preferred shareholders, repurchases of common stock, and payments on and, from time-to-time, potential repurchases or redemptions of a portion of an outstanding tranche of the long-term debt of the Parent Company or the Bank (as may be permitted by the terms of each respective series). See “Note 22. Parent Company Financial Information” in Truist’s Annual Report on Form 10-K for the year ended December 31, 2022 for additional information regarding dividends from subsidiaries and debt transactions.
Access to funding at the Parent Company is more sensitive to market disruptions. Therefore, Truist prudently manages cash levels at the Parent Company to cover a minimum of one year of projected cash outflows which includes unfunded external commitments, debt service, common and preferred dividends and scheduled debt maturities, without the benefit of any new cash inflows. Truist maintains a significant buffer above the projected one year of cash outflows. In determining the buffer, Truist considers cash requirements for common and preferred dividends, unfunded commitments to affiliates, serving as a source of strength to Truist Bank, and being able to withstand sustained market disruptions that could limit access to the capital markets. At September 30, 2023 and December 31, 2022, the Parent Company had 42 months and 37 months, respectively, of cash on hand to satisfy projected cash outflows, and 25 months and 22 months, respectively, when including the payment of common stock dividends.
Credit Ratings
Credit ratings are forward-looking opinions of rating agencies as to the Company’s ability to meet its financial commitments and repay its securities and obligations in accordance with their terms of issuance. Credit ratings influence both borrowing costs and access to the capital markets. The Company’s credit ratings are continuously monitored by the rating agencies and are subject to change at any time. As Truist seeks to maintain high-quality credit ratings, management meets with the major rating agencies on a regular basis to provide financial and business updates and to discuss current outlooks and trends. See Item 1A, “Risk Factors” in Truist’s Annual Report on Form 10-K for the year ended December 31, 2022 for additional information regarding factors that influence credit ratings and potential risks that could materialize in the event of downgrade in the Company’s credit ratings: Recent changes in the Company’s credit ratings and outlooks include:
-
On March 31, 2023, S&P Global Ratings affirmed the ratings of Truist and Truist Bank and revised the outlook on those ratings to “stable” from “positive,” citing heightened market volatility in the wake of recent bank failures and, with inflation still elevated, higher uncertainty, and greater downside risk in the economic outlook. The change in outlook was part of a broader action by S&P Global Ratings whereby the “positive” outlook on three other large U.S. banks was revised to “stable.”
-
On August 7, 2023, Moody’s Investors Service placed the long-term ratings and certain short-term ratings of Truist and Truist Bank “under review for downgrade,” citing Truist’s comparatively low, though improving, level of capitalization, along with weaknesses in asset-liability management. The review also reflects Moody’s Investor Service view that the stability of U.S. banks’ deposit funding has declined, as reflected in the agency’s decision to lower the U.S. macro profile.
-
On August 11, 2023, DBRS, Inc. affirmed the ratings of Truist and Truist Bank and maintained a “stable” ratings outlook, citing Truist’s highly scaled and diversified regional banking franchise, conservative risk profile, and sound liquidity management and capital levels. In affirming the ratings, DBRS, Inc. also noted the ratings take into account the more challenging operating environment and the expectation that funding costs and asset quality metrics could worsen from current levels, providing some pressure to earnings, and that credit deterioration associated with normalization of the credit cycle would be manageable.
-
On August 21, 2023, S&P Global Ratings affirmed the ratings of Truist and Truist Bank and maintained a “stable” ratings outlook, citing Truist’s strong market position and diversified business model as a substantial offset to deposit and margin pressures. S&P Global Ratings viewed Truist’s capital ratios unfavorably after considering unrealized losses on securities but also wrote that Truist has the earnings capacity to build its capital ratios and support franchise growth over time.
-
After the end of the third quarter, on October 16, 2023, Fitch Ratings affirmed the ratings of Truist and Truist Bank and revised the ratings outlook to “negative” from “stable.” In affirming Truist’s ratings, Fitch Ratings cited the company’s diverse revenue model, solid asset quality, and expected capital build over the rating horizon; however, “negative” ratings outlook reflects the view of Fitch Ratings that Truist currently has less “headroom” to face increasing earnings pressures than similarly-rated peers.
Truist Financial Corporation 71
Capital
The maintenance of appropriate levels of capital is a management priority and is monitored on a regular basis. Truist’s principal goals related to the maintenance of capital are to provide adequate capital to support Truist’s risk profile consistent with the Board-approved risk appetite, provide financial flexibility to support future growth and client needs, comply with relevant laws, regulations, and supervisory guidance, achieve optimal credit ratings for Truist and its subsidiaries, remain a source of strength for its subsidiaries, and provide a competitive return to shareholders. Risk-based capital ratios, which include CET1 capital, Tier 1 capital, and Total capital are calculated based on regulatory guidance related to the measurement of capital and risk-weighted assets.
Truist regularly performs stress testing on its capital levels and is required to periodically submit the Company’s capital plans and stress testing results to the banking regulators. Management regularly monitors the capital position of Truist on both a consolidated and bank-level basis. In this regard, management’s objective is to maintain capital at levels that are in excess of internal capital limits, which are above the regulatory “well capitalized” minimums. Management has implemented internal stress capital ratio minimums to evaluate whether capital ratios calculated after the effect of alternative capital actions are likely to remain above internal minimums. Breaches of internal stressed minimums prompt a review of the planned capital actions included in Truist’s capital plan.
| Table 22: Capital Requirements | |||||||||||||||||||||||||||||||||||
| Minimum Capital | Well Capitalized | Minimum Capital Plus Stress Capital Buffer**(1)** | |||||||||||||||||||||||||||||||||
| Truist | Truist Bank | ||||||||||||||||||||||||||||||||||
| CET1 | 4.5 | % | NA | 6.5 | % | 7.0 | % | ||||||||||||||||||||||||||||
| Tier 1 capital | 6.0 | 6.0 | % | 8.0 | 8.5 | ||||||||||||||||||||||||||||||
| Total capital | 8.0 | 10.0 | 10.0 | 10.5 | |||||||||||||||||||||||||||||||
| Leverage ratio | 4.0 | NA | 5.0 | NA | |||||||||||||||||||||||||||||||
| Supplementary leverage ratio | 3.0 | NA | NA | NA | |||||||||||||||||||||||||||||||
(1)Reflects Truist’s SCB requirement, received in the CCAR 2022 process, of 2.5% applicable from October 1, 2022 through September 30, 2023. Beginning on October 1, 2023, through September 30, 2024, Truist will be subject to a 2.9% SCB received in the CCAR 2023 process.
Truist’s capital ratios are presented in the following table:
| Table 23: Capital Ratios - Truist Financial Corporation | ||||||||||||||
| (Dollars in millions) | Sep 30, 2023 | Dec 31, 2022 | ||||||||||||
| Risk-based: | (preliminary) | |||||||||||||
| CET1 | 9.9 | % | 9.0 | % | ||||||||||
| Tier 1 capital | 11.4 | 10.5 | ||||||||||||
| Total capital | 13.5 | 12.4 | ||||||||||||
| Leverage ratio | 9.2 | 8.5 | ||||||||||||
| Supplementary leverage ratio | 7.8 | 7.3 | ||||||||||||
| Risk-weighted assets | $ | 428,682 | $ | 434,413 |
Capital ratios remained strong compared to the regulatory requirements for well capitalized banks. Truist declared common dividends of $0.52 per share during the third quarter of 2023. The dividend payout ratio for the third quarter of 2023 was 65%. Truist did not repurchase any shares in the third quarter of 2023.
Truist’s CET1 ratio was 9.9% as of September 30, 2023. The increase since June 30, 2023 resulted from organic capital generation and RWA optimization.
Truist completed the 2023 CCAR process and received the SCB requirement of 2.9% for the period October 1, 2023 to September 30, 2024.
72 Truist Financial Corporation
Share Repurchase Activity
| Table 24: Share Repurchase Activity | |||||||||||||||||||||||
| (Dollars in millions, except per share data, shares in thousands) | Total Number of Shares Purchased**(1)** | Average Price Paid Per Share**(2)** | Total Number of Shares Purchased as part of Publicly Announced Plans**(3)** | Approximate Dollar Value of Shares that may yet be Purchased Under the Plans**(3)** | |||||||||||||||||||
| July 1, 2023 to July 31, 2023 | — | $ | — | — | $ | 4,100 | |||||||||||||||||
| August 1, 2023 to August 31, 2023 | — | — | — | 4,100 | |||||||||||||||||||
| September 1, 2023 to September 30, 2023 | — | — | — | — | |||||||||||||||||||
| Total | — | $ | — | — |
(1)Includes shares exchanged or surrendered in connection with the exercise of equity-based awards under equity-based compensation plans.
(2)Excludes commissions.
(3)The repurchase authority previously approved by the Board of Directors expired on September 30, 2023.
Critical Accounting Policies
The accounting and reporting policies of Truist are in accordance with GAAP and conform to the accounting and reporting guidelines prescribed by bank regulatory authorities. Truist’s financial position and results of operations are affected by management’s application of accounting policies, including estimates, assumptions, and judgments made to arrive at the carrying value of assets and liabilities, and amounts reported for revenues and expenses. Different assumptions in the application of these policies could result in material changes in the consolidated financial position and/or consolidated results of operations, and related disclosures. Material estimates that are particularly susceptible to significant change include the determination of the ACL; determination of fair value for securities, MSRs, LHFS, trading loans, and derivative assets and liabilities; goodwill and other intangible assets; income taxes; and pension and postretirement benefit obligations. Understanding Truist’s accounting policies is fundamental to understanding the consolidated financial position and consolidated results of operations. The critical accounting policies are discussed in MD&A in Truist’s Annual Report on Form 10-K for the year ended December 31, 2022. Significant accounting policies and changes in accounting principles and effects of new accounting pronouncements are discussed in “Note 1. Basis of Presentation” in Form 10-K for the year ended December 31, 2022. Disclosures regarding the effects of new accounting pronouncements are included in “Note 1. Basis of Presentation” in this report. There have been no changes to the significant accounting policies during 2023.
Goodwill and Other Intangible Assets
The Company performs goodwill impairment analysis annually as of October 1 or more often if events or circumstances indicate that it is more-likely-than-not that the fair value of a reporting unit is below its carrying value. During the third quarter of 2023, the Company observed continuing declines in its financial forecasts for its CB&W and C&CB reporting units. The Company considered such declines in the context of industry related factors, including a decline in bank share prices, concluding that a triggering event had occurred for its CB&W and C&CB reporting units, and therefore Truist performed a quantitative test for these reporting units as of August 1, 2023. Truist also elected to perform a quantitative test for the IH reporting unit concurrent with the other units. The quantitative impairment test estimates the fair value of the reporting units using the income approach (weighted 50%) and two market based approaches: the guideline public company (weighted 30%) and guideline transaction (weighted 20%) methods. The income approach utilizes a discounted cash flow analysis. The guideline public company approach utilizes comparable public company information, key valuation multiples, and considers a market control premium associated with cost synergies and other cash flow benefits that arise from obtaining control over a reporting unit, and guideline transactions, when applicable. The guideline transaction method uses market observable transaction multiples for non-regulatory assisted transactions occurring within the past 12 months, which inherently incorporate a premium associated with the benefits of obtaining control.
The inputs and assumptions specific to each reporting unit are incorporated in the valuations, including projections of future cash flows, discount rates, applicable valuation multiples based on the comparable public company information, and guideline transaction information. Truist also assesses the reasonableness of the aggregate estimated fair value of the reporting units by comparison to its market capitalization over a reasonable period of time, including consideration of expected acquirer expense synergies, historic bank control premiums, and the current market.
Multi-year financial forecasts are developed for each reporting unit by considering several inputs and assumptions such as net interest margin, expected credit losses, noninterest income, noninterest expense, and required capital. The projection of net interest margin and noninterest expense are the most significant inputs to the financial projections of the CB&W and C&CB reporting units. The long-term growth rate used in determining the terminal value of each reporting unit was 3% as of August 1, 2023, based on management’s assessment of the minimum expected terminal growth rate of each reporting unit. Discount rates are estimated based on the Capital Asset Pricing Model, which considers the risk-free interest rate, market risk premium, beta, and unsystematic risk adjustments specific to a particular reporting unit. The discount rates are also calibrated based on risks related to the projected cash flows of each reporting unit. The discount rates utilized for the CB&W, C&CB, and IH reporting units as of August 1, 2023 were 12.5%, 11.5%, and 10.0%, respectively.
Truist Financial Corporation 73
Based on the Company’s interim impairment test of goodwill, it was determined for the CB&W, C&CB, and IH reporting units that the respective reporting units’ fair value was in excess of its respective carrying value as of August 1, 2023; however, for the CB&W and C&CB reporting units the fair value of the reporting unit exceeded its carrying value by less than 10%, indicating that the goodwill of these reporting units may be at risk of impairment. Circumstances that could negatively impact the fair value for the CB&W and C&CB reporting units in the future include sustained decrease in Truist stock price, continued decline in industry peer multiples, an increase in the applicable discount rate and further deterioration in the reporting units’ forecasts.
The estimated fair value of a reporting unit is highly sensitive to changes in management’s estimates and assumptions; therefore, in some instances, changes in these assumptions could impact whether the fair value of a reporting unit is greater than its carrying value. The Company performs sensitivity analyses around these assumptions in order to assess the reasonableness of the assumptions, and the resulting estimated fair values. The analysis of the CB&W and C&CB reporting unit at August 1, 2023, indicated that if the discount rates were increased 120 basis points and 100 basis points, respectively, the reporting unit’s fair value would be less than its carrying value, resulting in goodwill impairment. Ultimately, future potential changes in these assumptions may impact the estimated fair value of a reporting unit and cause the fair value of the reporting unit to be below its carrying value. Additionally, a reporting unit’s carrying value could change based on market conditions, change in the underlying makeup of the reporting unit, or the risk profile of those reporting units, which could impact whether the fair value of a reporting unit is less than carrying value.
The Company monitored events and circumstances during the period from August 1, 2023 through September 30, 2023, including macroeconomic and market factors, industry and banking sector events, Truist specific performance indicators, a comparison of management’s forecast and assumptions to those used in its August 1, 2023 quantitative impairment test, and the sensitivity of the August 1, 2023 quantitative test results to changes in assumptions through September 30, 2023. Based on these considerations, management concluded that it was not more-likely-than-not that the fair value of one or more of its reporting units is below its respective carrying amount as of September 30, 2023.
Previous: Item 1. FINANCIAL STATEMENTS · Next: Item 4. CONTROLS AND PROCEDURES