 filings.tools
Tapestry 10-K 2020-06-27
Filed 2020-08-13. 21 sections, 480K characters. Original on sec.gov · Markdown · JSON
Cover and table of contents
UNITED STATES
SECURITIES AND EXCHANGE COMMISSION
Washington, D.C. 20549
FORM 10-K
| ☑ | ANNUAL REPORT PURSUANT TO SECTION 13 OR 15(d) OF THE SECURITIES EXCHANGE ACT OF 1934 |
For the Fiscal Year Ended June 27, 2020
OR
| ☐ | TRANSITION REPORT PURSUANT TO SECTION 13 OR 15(d) OF THE SECURITIES EXCHANGE ACT OF 1934 |
Commission file number: 1-16153
Tapestry, Inc.
(Exact name of registrant as specified in its charter)
| Maryland | 52-2242751 | |
| (State or other jurisdiction of incorporation or organization) | (I.R.S. Employer Identification No.) |
10 Hudson Yards**,** New York**,** NY 10001
(Address of principal executive offices); (Zip Code)
(212) 946-8400
(Registrant’s telephone number, including area code)
Securities Registered Pursuant to Section 12(b) of the Act:
| Title of Each Class | Trading Symbol | Name of Each Exchange on which Registered | ||
| Common Stock, par value $.01 per share | TPR | New York Stock Exchange |
Securities Registered Pursuant to Section 12(g) of the Act: None
Indicate by check mark if the registrant is a well-known seasoned issuer, as defined in Rule 405 of the Securities Act. Yes ☑ No ☐
Indicate by check mark if the registrant is not required to file reports pursuant to Section 13 or Section 15(d) of the Act. Yes ☐ No ☑
Indicate by check mark whether the registrant (1) has filed all reports required to be filed by Section 13 or 15(d) of the Securities Exchange Act of 1934 during the preceding 12 months (or for such shorter period that the registrant was required to file such reports), and (2) has been subject to such filing requirements for the past 90 days. Yes ☑ No ☐
Indicate by check mark whether the registrant has submitted electronically every Interactive Data File required to be submitted and posted pursuant to Rule 405 of Regulation S-T (§232.405 of this chapter) during the preceding 12 months (or for such shorter period that the registrant was required to submit and post such files). Yes ☑ No ☐
Indicate by check mark whether the registrant is a large accelerated filer, an accelerated filer, a non-accelerated filer, a smaller reporting company, or an emerging growth company. See the definitions of “large accelerated filer”, “accelerated filer,” “smaller reporting company,” and "emerging growth company" in Rule 12b-2 of the Exchange Act.
| Large accelerated filer | ☑ | Accelerated filer | ☐ | Non-accelerated filer | ☐ | Smaller reporting company | ☐ | |||
| Emerging growth company | ☐ |
If an emerging growth company, indicate by check mark if the registrant has elected not to use the extended transition period for complying with any new or revised financial accounting standards provided pursuant to Section 13(a) of the Exchange Act. ☐
Indicate by check mark whether the registrant has filed a report on and attestation to its management’s assessment of the effectiveness of its internal control over financial reporting under Section 404(b) of the Sarbanes-Oxley Act (15 U.S.C. 7262(b)) by the registered public accounting firm that prepared or issued its audit report. ☑
Indicate by check mark whether the registrant is a shell Company (as defined in Rule 12b-2 of the Act).Yes ☐ No ☑
The aggregate market value of Tapestry, Inc. common stock held by non-affiliates as of December 28, 2019 (the last business day of the most recently completed second fiscal quarter) was approximately $7.3 billion. For purposes of determining this amount only, the registrant has excluded shares of common stock held by directors and officers. Exclusion of shares held by any person should not be construed to indicate that such person possesses the power, direct or indirect, to cause the direction of the management or policies of the registrant, or that such person is controlled by or under common control with the registrant.
On July 31, 2020, the Registrant had 276,241,174 shares of common stock outstanding.
DOCUMENTS INCORPORATED BY REFERENCE
| Documents | Form 10-K Reference | |
| Proxy Statement for the 2020 Annual Meeting of Stockholders | Part III, Items 10 – 14 |
TAPESTRY, INC.
TABLE OF CONTENTS
i
SPECIAL NOTE ON FORWARD-LOOKING INFORMATION
This document, and the documents incorporated by reference in this document, our press releases and oral statements made from time to time by us or on our behalf, may contain certain "forward-looking statements" within the meaning of the federal securities laws, including Section 27A of the Securities Act of 1933, as amended, and Section 21E of the Securities Exchange Act of 1934, as amended, and are based on management's current expectations, that involve risks and uncertainties that could cause our actual results to differ materially from our current expectations. In this context, forward-looking statements often address expected future business and financial performance and financial condition, and often contain words such as "may," "can," "continue," "project," "should," "expect," "confidence," "trends," "anticipate," "intend," "estimate," "on track," "well positioned to," "plan," "potential," "position," "believe," "seek," "see," "will," "would," "target," similar expressions, and variations or negatives of these words. Forward-looking statements by their nature address matters that are, to different degrees, uncertain. Such statements involve risks, uncertainties and assumptions. If such risks or uncertainties materialize or such assumptions prove incorrect, the results of Tapestry, Inc. and its consolidated subsidiaries could differ materially from those expressed or implied by such forward-looking statements and assumptions. All statements other than statements of historical fact are statements that could be deemed forward-looking statements. Tapestry, Inc. assumes no obligation to revise or update any such forward-looking statements for any reason, except as required by law.
Tapestry, Inc.’s actual results could differ materially from the results contemplated by these forward-looking statements and are subject to a number of risks, uncertainties, estimates and assumptions that may cause actual results to differ materially from current expectations due to a number of factors, including those discussed in the sections of this Form 10-K filing entitled “Risk Factors” and “Management’s Discussion and Analysis of Financial Condition and Results of Operations.” These factors include, but are not limited to: (i) the impact of the novel coronavirus ("Covid-19") global pandemic on our business and financial results; (ii) our ability to successfully execute our multi-year growth agenda under our Acceleration Program; (iii) the impact of economic conditions; (iv) our ability to control costs; (v) our exposure to international risks, including currency fluctuations and changes in economic or political conditions in the markets where we sell or source our products; (vi) the risk of cyber security threats and privacy or data security breaches; (vii) the effect of existing and new competition in the marketplace; (viii) our ability to retain the value of our brands and to respond to changing fashion and retail trends in a timely manner; (ix) the effect of seasonal and quarterly fluctuations on our sales or operating results; (x) our ability to protect against infringement of our trademarks and other proprietary rights; (xi) the impact of tax and other legislation; (xii) our ability to achieve intended benefits, cost savings and synergies from acquisitions; (xiii) the risks associated with potential changes to international trade agreements and the imposition of additional duties on importing our products; and (xiv) the risks associated with climate change and other corporate responsibility issues. These factors are not necessarily all of the factors that could cause actual results to differ materially from those expressed in any of our forward-looking statements.
In this Form 10-K, references to “we,” “our,” “us,” "Tapestry" and the “Company” refer to Tapestry, Inc., including consolidated subsidiaries as of June 27, 2020 ("fiscal 2020*"). References to "Coach," "Kate Spade," "kate spade new york" or "Stuart Weitzman" refer only to the referenced brand. The fiscal years ended* June 27, 2020 ("fiscal 2020*"),* June 29, 2019 ("fiscal 2019*") and* June 30, 2018 ("fiscal 2018*") were 52-week periods.*
PART I
Item 1. BUSINESS
Tapestry, Inc. (the "Company") is a leading New York-based house of modern luxury accessories and lifestyle brands. Tapestry is powered by optimism, innovation and inclusivity. Our brands convey our belief that true luxury is a freedom of expression that ignites confidence and authenticity. Our brands are approachable and inviting and create joy every day for people around the world. Defined by quality, craftsmanship and creativity, the brands that make up our house give global audiences the opportunity for exploration and self-expression. Tapestry is comprised of the Coach, Kate Spade and Stuart Weitzman brands, all of which have been part of the American fashion landscape for over 25 years.
GENERAL DEVELOPMENT OF BUSINESS
Founded in 1941, Coach, Inc., the predecessor company to Tapestry, Inc., was acquired by Sara Lee Corporation (“Sara Lee”) in 1985. In June 2000, Coach, Inc. was incorporated in the state of Maryland. In October 2000, Coach, Inc. was listed on the New York Stock Exchange and sold approximately 19.5% of the then outstanding shares. In April 2001, Sara Lee completed a distribution of its remaining ownership in Coach, Inc. via an exchange offer, which allowed Sara Lee stockholders to tender Sara Lee common stock for Coach, Inc. common stock. During fiscal 2015, the Company acquired Stuart Weitzman Holdings LLC, a luxury women's footwear company. During the first quarter of fiscal 2018, the Company acquired Kate Spade & Company, a lifestyle accessories and ready-to-wear company.
During fiscal 2018, the Company changed its name to Tapestry, Inc., a leading luxury lifestyle company with a diverse multi-brand portfolio supported by significant expertise in handbag design, merchandising, supply chain and retail operations as well as solid financial acumen.
The Company's international expansion strategy has been to enter into joint ventures and establish distributor relationships to build market presence and capability. To further accelerate brand awareness, aggressively grow market share and to exercise greater control of our brands, the Company has historically acquired its joint venture partner’s interests or distribution rights in these international regions.
OUR BRANDS
The Company has three reportable segments:
| • | Coach includes global sales of Coach products to customers through Coach operated stores, including the Internet and concession shop-in-shops, and sales to wholesale customers and through independent third party distributors. This segment represented 71.1% of total net sales in fiscal 2020. |
| • | Kate Spade includes global sales primarily of kate spade new york brand products to customers through Kate Spade operated stores, including the Internet, sales to wholesale customers, through concession shop-in-shops and through independent third party distributors. This segment represented 23.2% of total net sales in fiscal 2020. |
| • | Stuart Weitzman includes global sales of Stuart Weitzman brand products primarily through Stuart Weitzman operated stores, including the Internet, sales to wholesale customers and through independent third party distributors. This segment represented 5.7% of total net sales in fiscal 2020. |
Corporate, which is not a reportable segment, represents certain costs that are not directly attributable to a brand. These costs primarily include administrative and information systems expense.
Acceleration Program
The Company is undergoing a review of its business under its multi-year growth agenda (the "Acceleration Program"). The guiding principle of the Company’s multi-year growth agenda is to better meet the needs of each of its brands' unique customers by:
| • | Sharpening our Focus on the Consumer: Operating with a clearly defined purpose and strategy for each brand and an unwavering focus on the consumer at the core of everything we do |
| • | Leveraging Data and Leading with a Digital-First Mindset: Building significant data and analytics capabilities to drive decision-making and increase efficiency; Offering immersive customer experiences across our e-commerce and |
social channels to meet the needs of consumers who are increasingly utilizing digital platforms to engage with brands; Rethinking the role of stores with an intent to optimize our fleet
| • | Transforming into a Leaner and More Responsive Organization: Moving with greater agility, simplifying internal processes and empowering teams to act quickly to meet the rapidly changing needs of the consumer |
This multi-faceted, multi-year strategic growth plan reflects: (i) actions to streamline the Company's organization; (ii) select store closures as the Company optimizes its fleet (including store closure costs incurred as the Company exits certain regions in which it currently operates); and (iii) professional fees and compensation costs incurred as a result of the development and execution of the Company's comprehensive strategic initiatives aimed at increasing profitability. The Company incurred $87.0 million under the plan for fiscal 2020. Including charges taken in the fourth quarter of fiscal year 2020, the Company expects to incur total pre-tax charges under the plan of $185 - $200 million. The Company estimates that it will realize approximately $300 million in gross run rate expense savings from these initiatives, including $200 million projected for fiscal 2021.
Covid-19 Impact
Tapestry began fiscal 2020 with a focus on profitable growth through innovation, global expansion, investing in digital capabilities, and harnessing the power of a multi-brand model. However, in December 2019, a novel strain of coronavirus ("Covid-19") surfaced and was officially declared a global pandemic by the World Health Organization on March 11, 2020. The virus has had significant impacts on our business globally. As a result, while the Company remains confident in its long-term strategy and executing against its multi-year growth agenda, its short-term focus includes adapting to the challenges resulting from Covid-19.
Coach
Coach is a leading design house of modern luxury accessories and lifestyle collections, with a long-standing reputation built on quality craftsmanship. As a pioneer in the leather goods and accessories space, the brand established itself as the original American house of leather. Coach remains inspired by its rich heritage, with the spirit of innovation it has had for more than 75 years. Defined by a free-spirited, all-American attitude, the brand approaches design with a modern vision, reimagining luxury for today with an authenticity that is uniquely Coach. All over the world, the Coach name is synonymous with effortless New York style. We present a sophisticated, modern and inviting environment, both in bricks & mortar stores and online, to showcase our product assortment and reinforce a consistent brand positioning.
Stores — Coach operates freestanding flagship, retail and outlet stores as well as concession shop-in-shop locations. These stores are located in regional shopping centers, metropolitan areas throughout the world and established outlet centers.
Coach flagship stores, which offer the fullest expression of the Coach brand, are located in tourist-heavy, densely populated cities globally. Retail stores carry an assortment of products depending on their size, location and customer preferences. Coach outlet stores serve as an efficient means to sell manufactured-for-outlet product and discontinued retail inventory outside the retail channel. The outlet store design, visual presentations and customer service levels support and reinforce the brand's image. Through these outlet stores, we target value-oriented customers in established outlet centers that are close to major markets.
The following table shows the number of Coach directly-operated locations and their total and average square footage:
| Coach | |||||||||
| North America | International**(1)** | Total | |||||||
| Store Count | |||||||||
| Fiscal 2020 | 375 | 583 | 958 | ||||||
| Net change vs. prior year | (16 | ) | (12 | ) | (28 | ) | |||
| % change vs. prior year | (4.1 | )% | (2.0 | )% | (2.8 | )% | |||
| Fiscal 2019 | 391 | 595 | 986 | ||||||
| Net change vs. prior year | (11 | ) | 10 | (1 | ) | ||||
| % change vs. prior year | (2.7 | )% | 1.7 | % | (0.1 | )% | |||
| Fiscal 2018 | 402 | 585 | 987 | ||||||
| Net change vs. prior year | (17 | ) | 42 | 25 | |||||
| % change vs. prior year | (4.1 | )% | 7.7 | % | 2.6 | % | |||
| Square Footage | |||||||||
| Fiscal 2020 | 1,758,668 | 1,285,329 | 3,043,997 | ||||||
| Net change vs. prior year | (43,742 | ) | (19,289 | ) | (63,031 | ) | |||
| % change vs. prior year | (2.4 | )% | (1.5 | )% | (2.0 | )% | |||
| Fiscal 2019 | 1,802,410 | 1,304,618 | 3,107,028 | ||||||
| Net change vs. prior year | (33,133 | ) | 48,093 | 14,960 | |||||
| % change vs. prior year | (1.8 | )% | 3.8 | % | 0.5 | % | |||
| Fiscal 2018 | 1,835,543 | 1,256,525 | 3,092,068 | ||||||
| Net change vs. prior year | (48,661 | ) | 89,605 | 40,944 | |||||
| % change vs. prior year | (2.6 | )% | 7.7 | % | 1.3 | % | |||
| Average Square Footage | |||||||||
| Fiscal 2020 | 4,690 | 2,205 | 3,177 | ||||||
| Fiscal 2019 | 4,610 | 2,193 | 3,151 | ||||||
| Fiscal 2018 | 4,566 | 2,148 | 3,133 |
| (1) | Fiscal 2018 includes the addition of 21 stores acquired as a result of the Coach distributor acquisition in Australia and New Zealand completed during the third quarter of fiscal 2018. |
In fiscal 2021, we expect a modest reduction in overall store count as the Company looks to drive increased profitability under the Acceleration Program and shifts our focus with greater emphasis on digital channels.
Internet — We view our digital platforms as instruments to deliver Coach brand products to customers directly, with the benefit of added accessibility, so that consumers can purchase Coach brand products wherever they choose. Consumers also have the ability to place e-commerce orders through point-of-sale mobile devices located within our retail stores. Our digital channel provides a showcase environment where consumers can browse through a selected offering of the latest styles and colors.
Wholesale — We work closely with our wholesale partners to ensure a clear and consistent product presentation. We enhance our presentation through the creation of shop-in-shops with proprietary Coach brand fixtures within the department store environment. We custom tailor our assortments through wholesale product planning and allocation processes to match the attributes of our department store consumers in each local market. We continue to closely manage inventories in this channel given the current highly promotional environment at point-of-sale. We utilize automatic replenishment with major accounts in an effort to optimize inventory levels across wholesale doors. The wholesale business for Coach brand comprised approximately 6% of total segment net sales for fiscal 2020. As of June 27, 2020, Coach's products are sold in over approximately 1,700 wholesale and distributor locations globally. Coach has developed relationships with a select group of distributors who sell Coach products through travel retail locations and in certain international countries where Coach does not have directly operated retail locations. As of June 27, 2020 and June 29, 2019, Coach did not have any customers who individually accounted for more than 10% of the segment's total net sales.
Kate Spade
Since its launch in 1993 with a collection of six essential handbags, Kate Spade has always stood for optimistic femininity. Today, the brand is a global life and style house with handbags, ready-to-wear, jewelry, footwear, gifts, home décor and more. Polished ease, thoughtful details and a modern, sophisticated use of color—Kate Spade’s founding principles define a unique style synonymous with joy. The brand continues to celebrate confident women with a youthful spirit.
Stores — Kate Spade operates freestanding flagship, specialty retail and outlet stores as well as concession shop-in-shops. These stores are located in regional shopping centers, metropolitan areas throughout the world and established outlet centers.
Kate Spade flagship locations, which offer the fullest expression of the Kate Spade brand, are located in key strategic markets including tourist-heavy, densely populated cities globally. Retail stores carry an assortment of products depending on their size, location and customer preferences. Kate Spade outlet stores serve as an efficient means to sell manufactured-for-outlet product and discontinued retail inventory outside the retail channel. Through these outlet stores, we target value-oriented customers in established outlet centers that are close to major markets.
The following table shows the number of Kate Spade directly-operated locations and their total and average square footage:
| Kate Spade**(1)** | |||||||||
| North America | International**(2)** | Total | |||||||
| Store Count | |||||||||
| Fiscal 2020 | 213 | 207 | 420 | ||||||
| Net change vs. prior year | — | 13 | 13 | ||||||
| % change vs. prior year | — | % | 7 | % | 3 | % | |||
| Fiscal 2019 | 213 | 194 | 407 | ||||||
| Net change vs. prior year | 13 | 52 | 65 | ||||||
| % change vs. prior year | 6.5 | % | 36.6 | % | 19.0 | % | |||
| Fiscal 2018 | 200 | 142 | 342 | ||||||
| Square Footage | |||||||||
| Fiscal 2020 | 603,487 | 291,322 | 894,809 | ||||||
| Net change vs. prior year | 24,838 | 23,973 | 48,811 | ||||||
| % change vs. prior year | 4 | % | 9 | % | 6 | % | |||
| Fiscal 2019 | 578,649 | 267,349 | 845,998 | ||||||
| Net change vs. prior year | 83,528 | 95,595 | 179,123 | ||||||
| % change vs. prior year | 16.9 | % | 55.7 | % | 26.9 | % | |||
| Fiscal 2018 | 495,121 | 171,754 | 666,875 | ||||||
| Average Square Footage | |||||||||
| Fiscal 2020 | 2,833 | 1,407 | 2,130 | ||||||
| Fiscal 2019 | 2,717 | 1,378 | 2,079 | ||||||
| Fiscal 2018 | 2,476 | 1,210 | 1,950 |
| (1) | The Kate Spade business was acquired in the first quarter of fiscal 2018 which included the addition of 180 stores in North America and 95 international stores. |
| (2) | Fiscal 2019 includes the addition of 21 stores acquired as a result of the Kate Spade distributor acquisitions in Australia, Malaysia and Singapore during fiscal 2019. Fiscal 2018 includes the addition of 50 stores related to taking operational control of the Kate Spade Joint Ventures that operate in Greater China. |
We expect to modestly reduce our store count in the next fiscal year as the Company looks to drive increased profitability under the Acceleration Program and shift our focus with greater emphasis on digital channels.
Internet — We view our digital platforms as instruments to deliver Kate Spade brand products to customers directly with the benefit of added accessibility as consumers can purchase Kate Spade brand products wherever they choose. Consumers also have the ability to place e-commerce orders through point-of-sale mobile devices located within our retail stores. Our digital channel provides a showcase environment where consumers can browse through a selected offering of the latest styles and colors.
Wholesale — As of June 27, 2020, Kate Spade brand's products are sold in approximately 1,000 wholesale and distributor locations, primarily in the U.S, Canada and Europe. The most significant wholesale partnerships primarily include sales of kate spade new york products. Kate Spade products are also available on these customers' websites. The wholesale business for Kate Spade brand comprised approximately 12% of total segment net sales for fiscal 2020. Kate Spade has developed relationships with a select group of distributors who sell Kate Spade products through travel retail locations and in certain international countries where Kate Spade does not have directly operated retail locations. As of June 27, 2020 and June 29, 2019, Kate Spade did not have any customers who individually accounted for more than 10% of the segment's total net sales.
Stuart Weitzman
Stuart Weitzman is a leading footwear brand that is synonymous with strength in femininity. Defined by an energetic, bold and purpose-driven attitude, Stuart Weitzman is known for its unique approach to melding fashion, function and fit in every silhouette. The brand's focus on creating effortless shoes - each engineered to empower women with both confidence and comfort - has resonated around the world and continues to inspire women to conquer every day, one step at a time.
Stores — Stuart Weitzman products are primarily sold in freestanding flagship, retail and outlet stores. Stuart Weitzman flagship locations, which offer the fullest expression of the brand, are located in key strategic markets including tourist-heavy, densely populated cities globally. Retail stores carry an assortment of products depending on their size, location and customer preferences. Through outlet stores, we target value-oriented customers in established outlet centers that are close to major markets.
The following table shows the number of Stuart Weitzman directly-operated locations and their total and average square footage:
| Stuart Weitzman | |||||||||
| North America | International**(1)** | Total | |||||||
| Store Count | |||||||||
| Fiscal 2020 | 58 | 73 | 131 | ||||||
| Net change vs. prior year | (13 | ) | (3 | ) | (16 | ) | |||
| % change vs. prior year | (18.3 | )% | (3.9 | )% | (10.9 | )% | |||
| Fiscal 2019 | 71 | 76 | 147 | ||||||
| Net change vs. prior year | 3 | 41 | 44 | ||||||
| % change vs. prior year | 4.4 | % | 117.1 | % | 42.7 | % | |||
| Fiscal 2018 | 68 | 35 | 103 | ||||||
| Net change vs. prior year | (1 | ) | 23 | 22 | |||||
| % change vs. prior year | (1.4 | )% | 191.7 | % | 27.2 | % | |||
| Square Footage | |||||||||
| Fiscal 2020 | 102,784 | 89,182 | 191,966 | ||||||
| Net change vs. prior year | (22,552 | ) | (1,118 | ) | (23,670 | ) | |||
| % change vs. prior year | (18.0 | )% | (1.2 | )% | (11.0 | )% | |||
| Fiscal 2019 | 125,336 | 90,300 | 215,636 | ||||||
| Net change vs. prior year | 7,467 | 42,802 | 50,269 | ||||||
| % change vs. prior year | 6.3 | % | 90.1 | % | 30.4 | % | |||
| Fiscal 2018 | 117,869 | 47,498 | 165,367 | ||||||
| Net change vs. prior year | (75 | ) | 28,690 | 28,615 | |||||
| % change vs. prior year | (0.1 | )% | 152.5 | % | 20.9 | % | |||
| Average Square Footage | |||||||||
| Fiscal 2020 | 1,772 | 1,222 | 1,465 | ||||||
| Fiscal 2019 | 1,765 | 1,188 | 1,467 | ||||||
| Fiscal 2018 | 1,733 | 1,357 | 1,606 |
| (1) | Fiscal 2019 includes the addition of 18 stores acquired as a result of the distributor acquisitions in Southern China and Australia during fiscal 2019. Fiscal 2018 includes the addition of 20 stores acquired as a result of the Stuart Weitzman distributor acquisition in Northern China during fiscal 2018. |
In fiscal 2021, we expect a reduction in store count and square footage globally as we exit certain locations and regions to increase profitability under the Acceleration Program.
Internet — We view our digital platform as an instrument to deliver Stuart Weitzman brand products to customers directly with the benefit of added accessibility as consumers can purchase Stuart Weitzman brand products wherever they choose. The website also acts as a communications vehicle to build brand awareness. Our digital channel provides a showcase environment where consumers can browse through a selected offering of the latest styles and colors.
Wholesale — Stuart Weitzman brand products are primarily sold through approximately 900 wholesale and distributor locations globally, which include multi-brand boutiques as of fiscal 2020. The wholesale business for Stuart Weitzman brand comprised approximately 27% of total segment net sales for fiscal 2020. Stuart Weitzman has developed relationships with a select group of distributors who sell Stuart Weitzman products through travel retail locations and in certain international countries where Stuart Weitzman does not have directly operated retail locations. As of June 27, 2020 and June 29, 2019, Stuart Weitzman did not have any customers who individually accounted for more than 10% of the segment's total net sales.
Refer to Note 18, "Segment Information," for further information about the Company's segments.
LICENSING
Our brands take an active role in the design process and control the marketing and distribution of products in our worldwide licensing relationships. Licensing revenue for the Company was $46.7 million and $53.3 million in fiscal 2020 and fiscal 2019, respectively. Our key licensing relationships and their calendar year expirations as of June 27, 2020 are as follows:
| Brand | Category | Partner | Expiration | |||
| Coach | Eyewear | Luxottica | 2021 | |||
| Coach | Tech Accessories | Incipio | 2023 | |||
| Coach | Watches | Movado | 2025 | |||
| Coach | Fragrance | Interparfums | 2026 | |||
| Kate Spade | Tableware | Lenox | 2020 | |||
| Kate Spade | Tech Accessories | Incipio | 2021 | |||
| Kate Spade | Fashion Bedding | HTA | 2021 | |||
| Kate Spade | Watches | Fossil | 2025 | |||
| Kate Spade | Eyewear | Safilo | 2026 | |||
| Kate Spade | Stationery and Gift | Lifeguard Press | 2026 |
Products made under license are, in most cases, sold through stores and wholesale channels and, with the Company's approval, the licensees have the right to distribute products selectively through other venues, which provide additional, yet controlled, exposure of our brands. Our licensing partners generally pay royalties on their net sales of our branded products. Such royalties currently comprise approximately 1% of Tapestry's total net sales. The licensing agreements generally give our brands the right to terminate the license if specified sales targets are not achieved.
PRODUCTS
The following table shows net sales for each of our product categories by segment:
| Fiscal Year Ended | ||||||||||||||||||||
| June 27, 2020 | June 29, 2019 | June 30, 2018(1) | ||||||||||||||||||
| (millions) | ||||||||||||||||||||
| Amount | % of total net sales | Amount | % of total net sales | Amount | % of total net sales | |||||||||||||||
| Coach | ||||||||||||||||||||
| Women's Handbags | $ | 1,852.0 | 37 | % | $ | 2,261.3 | 38 | % | $ | 2,298.2 | 39 | % | ||||||||
| Men's | 688.0 | 14 | 862.0 | 14 | 844.6 | 14 | ||||||||||||||
| Women's Accessories | 645.4 | 13 | 766.5 | 13 | 747.1 | 13 | ||||||||||||||
| Other Products | 340.3 | 7 | 381.1 | 6 | 331.6 | 6 | ||||||||||||||
| Total Coach | $ | 3,525.7 | 71 | % | $ | 4,270.9 | 71 | % | $ | 4,221.5 | 72 | % | ||||||||
| Kate Spade | ||||||||||||||||||||
| Women's Handbags | $ | 648.9 | 13 | % | $ | 763.7 | 13 | % | $ | 703.4 | 12 | % | ||||||||
| Other Products | 260.0 | 5 | 315.2 | 5 | 311.6 | 5 | ||||||||||||||
| Women's Accessories | 240.6 | 5 | 287.9 | 5 | 269.7 | 5 | ||||||||||||||
| Total Kate Spade | $ | 1,149.5 | 23 | % | $ | 1,366.8 | 23 | % | $ | 1,284.7 | 22 | % | ||||||||
| Stuart Weitzman(2) | $ | 286.2 | 6 | % | $ | 389.4 | 6 | % | $ | 373.8 | 6 | % | ||||||||
| Total Net sales | $ | 4,961.4 | 100 | % | $ | 6,027.1 | 100 | % | $ | 5,880.0 | 100 | % |
| (1) | The Company completed its acquisition of Kate Spade and Company in fiscal 2018. The operating results of the Kate Spade brand have been consolidated in the Company's operating results commencing on July 11, 2017. |
| (2) | The significant majority of sales for Stuart Weitzman is attributable to women's footwear. |
Women’s Handbags — Women’s handbag collections feature classically inspired designs as well as fashion designs. These collections are designed to meet the fashion and functional requirements of our broad and diverse consumer base.
Women’s Accessories — Women’s accessories include small leather goods, which complement our handbags, including wallets, money pieces, wristlets and cosmetic cases. Also included in this category are novelty accessories (including address books, time management accessories, travel accessories, sketchbooks and portfolios), key rings and charms.
Men’s — Men’s includes bag collections (including business cases, computer bags, messenger-style bags, backpacks and totes), small leather goods (including wallets, card cases, travel organizers and belts), footwear, watches, sunglasses, novelty accessories and ready-to-wear.
Other Products — These products primarily include women's footwear, eyewear (such as sunglasses), jewelry (including bracelets, necklaces, rings and earrings), fragrances, watches, certain women's seasonal lifestyle apparel collections, including outerwear, ready-to-wear and cold weather accessories, such as gloves, scarves and hats. In addition, Kate Spade brand kids ready-to-wear and footwear items, housewares and home accessories, such as fashion bedding and tableware, and stationery and gifts are included in this category.
DESIGN AND MERCHANDISING
Our creative leaders are responsible for conceptualizing and implementing the design direction for our brands across the consumer touchpoints of product, stores and marketing. At Tapestry, each brand has a dedicated design and merchandising team; this ensures that Coach, Kate Spade and Stuart Weitzman speak to their customers with a voice and positioning unique to their brand. Designers have access to the brands' extensive archives of product designs, which are a valuable resource for new product concepts. Our designers are also supported by strong merchandising teams that analyze sales, market trends and consumer preferences to identify market opportunities that help guide each season's design process and create a globally relevant product assortment. Merchandisers also manage the product life cycle to maximize sales and profitability across all channels. The product category teams, each comprised of design, merchandising, product development and sourcing specialists help each brand execute design concepts that are consistent with the brand's strategic direction.
Our design and merchandising teams also work in close collaboration with all of our licensing partners to ensure that the licensed products are conceptualized and designed to address the intended market opportunity and convey the distinctive perspective and lifestyle associated with our brands.
MARKETING
We use a 360-degree approach to marketing for each of our brands, synchronizing our efforts across all channels to ensure consistency at every touchpoint. Our global marketing strategy is to deliver a consistent, relevant and multi-layered message every time the consumer comes in contact with our brands through our communications and visual merchandising. Each brand's distinctive positioning is communicated by our creative marketing, visual merchandising and public relations teams, as well as outside creative agencies. We also have a sophisticated consumer and market research capability, which helps us assess consumer attitudes and trends.
We engage in several consumer communication initiatives globally, including direct marketing activities at a national, regional and local level. Total expenses attributable to the Company's marketing-related activities in fiscal 2020 were $238.0 million, or approximately 5% of net sales, compared to $247.1 million in fiscal 2019, or approximately 4% of net sales.
Our wide range of marketing activities include direct mail tiered to our database of best, new, lapsed and prospective customers. In addition, to drive engagement and build awareness, we utilize a variety of media, including print, digital, social and out-of-home. Our respective brand websites serve as effective communication vehicles by providing an immersive brand experience, showcasing the fullest expression across all product categories.
As part of our direct marketing strategy, we use databases of consumers to generate personalized communications. Email contacts and direct mail pieces are an important part of our communication and are sent to selected consumers to stimulate consumer purchases and build brand awareness. Visitors to our e-commerce sites provide an opportunity to increase the size of these databases, as well as point of transactions globally, except where restricted. For Coach, we have e-commerce sites in the U.S., Canada, Japan, mainland China, several throughout Europe, Australia and South Korea. For Kate Spade, we have e-commerce sites in the U.S., Canada, mainland China, Japan and throughout Europe. For Stuart Weitzman, we have e-commerce sites in the U.S, Canada, Europe, and mainland China. The Company also leverages Tmall as an additional platform to sell our products to customers.
In fiscal 2020, Coach had informational websites in Hong Kong SAR, China, Korea, Malaysia, Singapore and Taiwan, China, as well as a global informational website where other customers are directed. In fiscal 2020, Kate Spade had an informational website in mainland China. The Company utilizes and continues to explore digital technologies such as social media websites, including Twitter, Facebook, Instagram, Pinterest, WeChat and Sina Weibo, as a cost effective consumer communication opportunity to increase on-line and store sales, acquire new customers and build brand awareness.
MANUFACTURING
Tapestry carefully balances its commitments to a limited number of “better brand” partners that have demonstrated integrity, quality and reliable delivery. The Company continues to evaluate new manufacturing sources and geographies to deliver the finest quality products at the best cost and to mitigate the impact of manufacturing in inflationary markets.
Before partnering with a new vendor, the Company evaluates each facility by conducting a quality and business practice standards audit. Periodic evaluations of existing, previously approved facilities are conducted on a recurring basis. We believe that our manufacturing partners are in material compliance with the Company’s integrity standards.
These independent manufacturers each or in aggregate support a broad mix of product types, materials and a seasonal influx of new, fashion-oriented styles, which allows us to meet shifts in marketplace demand and changes in consumer preferences.
Our raw material suppliers, independent manufacturers and licensing partners must achieve and maintain high quality standards, which are an integral part of our brands' identity. One of our keys to success lies in the rigorous selection of raw materials. We have longstanding relationships with purveyors of fine leathers and hardware. Although our products are manufactured by independent manufacturers, we maintain a strong level of oversight in the selection of the raw materials that are used in all of our products. Compliance with quality control standards is monitored through on-site quality inspections at independent manufacturing facilities.
We maintain strong oversight of the supply chain process for each of our brands from design through manufacture. We are able to do this by maintaining sourcing management offices in Vietnam, mainland China, the Philippines, Cambodia and Spain that work closely with our independent manufacturers. This broad-based, global manufacturing strategy is designed to optimize the mix of cost, lead times and construction capabilities.
During fiscal 2020, manufacturers of Coach products were primarily located in Vietnam, Cambodia, the Philippines and mainland China. During fiscal 2020, Coach did not have any vendors who individually provided approximately 10% of the brand's total purchases. During fiscal 2020, Kate Spade products were manufactured primarily in Vietnam, mainland China and Cambodia. Kate Spade had two vendors, one located in Vietnam and one located in Cambodia, who individually provided over 10% of the
brand's total purchases (or approximately 35% in the aggregate). The Company expects that the level of products manufactured in each country will change during fiscal 2021 as it continues to further diversify the brand’s supply chain globally. Stuart Weitzman products were primarily manufactured in Spain. During fiscal 2020, Stuart Weitzman had two vendors, one located in Spain and one located in mainland China, who individually provided over 10% of the brand's total units (or approximately 20% in the aggregate).
DISTRIBUTION
Each brand's products are shipped from manufacturers to distribution centers around the world for inspection, storage, order processing and shipment. These facilities use bar code scanning warehouse management systems. Our distribution center employees use handheld scanners to read product bar codes, which allow accurate storage and order processing, and generally provide excellent service to our customers. Each brand's products are primarily shipped to the retail stores and wholesale customers. Some facilities also ship direct to consumer orders in markets where we have an e-commerce presence.
North America product fulfillment for Coach is facilitated at our U.S. distribution center by our automated warehouse management system and electronic data interchange system, while the unique requirements of the direct to consumer business are supported by Coach's order management and e-commerce sites. Outside of North America, the Company has established regional distribution centers through third-parties for each brand. For Coach products, these centers are located in the Netherlands, Japan, Greater China (mainland China, Hong Kong SAR, Macao SAR and Taiwan), South Korea, Malaysia, Australia and Singapore to support directly operated local markets.
The Company distributes Kate Spade products through facilities that are operated by third parties in the United States, Europe and Asia. For Kate Spade, product fulfillment in North America is facilitated by our automated warehouse management system and electronic data interchange system, while the unique requirements of the direct to consumer business are supported by selective warehouse and distribution systems operated by a third-party. The Company also operates local distribution centers through third-parties in the U.K., Japan, mainland China, Hong Kong SAR, China, Australia, Singapore and Malaysia for Kate Spade product.
The Company distributes Stuart Weitzman products through facilities located in the United States, Canada, Spain, Italy and mainland China that are operated by third parties.
INFORMATION SYSTEMS
In fiscal 2020, the Company completed its multi-year Enterprise Resource Planning ("ERP") implementation. Key milestones were achieved as follows:
| • | Fiscal 2018: Implementation of a global consolidation system which provided a common platform for financial reporting. |
| • | Fiscal 2019: Deployment of global finance and accounting systems for Corporate, Coach and Stuart Weitzman and global finance, accounting, supply chain and human resource information systems for Kate Spade. |
| • | Fiscal 2020: Supply chain functions for Coach and Stuart Weitzman were implemented at the beginning of fiscal 2020. |
The Company is also implementing a point-of-sale system which supports all in-store transactions, distributes management reporting for each store, and collects sales and payroll information on a daily basis. This daily collection of store sales and inventory information results in early identification of business trends and provides a detailed baseline for store inventory replenishment. The implementation is complete for Coach stores in North America and Europe and expected to be implemented for Stuart Weitzman stores in North America in fiscal 2021 and Kate Spade North America in fiscal 2022.
Refer to Item 1A. "Risk Factors," for further information as it relates to the Company's ERP system implementation efforts.
CORPORATE RESPONSIBILITY
Tapestry’s corporate responsibility strategy, Our Social Fabric, unites teams across our business to work to meet our 2025 Corporate Responsibility Goals and a shared objective: to create the modern luxury company of the future that balances true fashion authority with meaningful, positive change. The Company is a signatory to the United Nations ("UN") Global Compact, and as such, our corporate responsibility strategy is aligned with the UN Sustainable Development Goals. Tapestry’s goals cover three strategic pillars: Our People, Our Planet and Our Communities.
| • | Our People: Goals focus on diversity, inclusion, progression and wellness initiatives across our workforce. |
| • | Our Planet: Goals include sourcing and environmental initiatives to increase traceability of our products and reduce our impact. |
| • | Our Communities: Goals include focus on volunteerism programs, philanthropic initiatives and supply chain empowerment programs. |
Additional information on our corporate responsibility strategy and 2025 Corporate Responsibility Goals can be found at www.tapestry.com/responsibility. The content on this website and the content in our Corporate Responsibility Reports are not incorporated by reference into this Annual Report on Form 10-K or in any other report or document we file with the SEC.
TRADEMARKS AND PATENTS
Tapestry owns all of the material trademark rights around the world used in connection with the production, marketing, distribution and sale of all branded products for Coach, Stuart Weitzman and Kate Spade. In addition, it licenses trademarks and copyrights used in connection with the production, marketing and distribution of certain categories of goods and limited edition collaborative special projects. Tapestry also owns and maintains registrations in countries around the world for trademarks in relevant classes of products. Major trademarks include TAPESTRY, COACH, STUART WEITZMAN, KATE SPADE and kate spade new york. It also owns brand-specific trademarks such as COACH and Horse & Carriage Design, COACH and Story Patch Design, COACH and Lozenge Design, COACH and Tag Design, Signature C Design, COACH EST. 1941 and Design for the COACH brand; kate spade new york and Spade Design, live colorfully, Walk on Air and In Full Bloom for the kate spade new york brand; and the SW Logo for the Stuart Weitzman brand. Tapestry is not dependent on any one particular trademark or design patent although Tapestry believes that the Coach, Stuart Weitzman and Kate Spade names are important for its business. In addition, Tapestry owns a number of design patents and utility patents for its brands' products. Tapestry aggressively polices its trademarks and trade dress, and pursues infringers both domestically and internationally. It also pursues counterfeiters domestically and internationally through leads generated internally, as well as through its network of investigators, the respective online reporting form for each brand, the Tapestry hotline and business partners around the world.
The Company expects that its material trademarks will remain in full force and effect for as long as we continue to use and renew them.
SEASONALITY
The Company's results are typically affected by seasonal trends. During the first fiscal quarter, we build inventory for the winter and holiday season. In the second fiscal quarter, working capital requirements are reduced substantially as we generate higher net sales and operating income, especially during the holiday season.
Fluctuations in net sales, operating income and operating cash flows of the Company in any fiscal quarter may be affected by the timing of wholesale shipments and other events affecting retail sales, including adverse weather conditions or other macroeconomic events, including pandemics such as Covid-19.
GOVERNMENT REGULATION
Most of the Company's imported products are subject to duties, indirect taxes, quotas and non-tariff trade barriers that may limit the quantity of products that we may import into the U.S. and other countries or may impact the cost of such products. The Company is not materially restricted by quotas or other government restrictions in the operation of its business, however customs duties do represent a component of total product cost. To maximize opportunities, the Company operates complex supply chains through foreign trade zones, bonded logistic parks and other strategic initiatives such as free trade agreements. Additionally, the Company operates a direct import business in many countries worldwide. As a result, the Company is subject to stringent government regulations and restrictions with respect to its cross-border activity either by the various customs and border protection agencies or by other government agencies which control the quality and safety of the Company’s products. The Company maintains an internal global trade, customs and product compliance organization to help manage its import/export and regulatory affairs activity.
COMPETITION
The global premium women's and men's handbag, accessories and footwear categories are highly competitive. The Company competes primarily with European and American luxury and accessible luxury brands as well as private label retailers. Over the last several years these industries have grown, encouraging the entry of new competitors as well as increasing the competition from existing competitors. This increased competition drives interest in these brand loyal categories.
EMPLOYEES
As of June 27, 2020, the Company employed approximately 17,300 globally, including both full and part time employees, but excluding seasonal and temporary employees. Of these employees, approximately 9,200 and 4,900 were full time and part time employees, respectively, in the global retail field.
The Company believes that its relations with its employees are good, and has never encountered a strike or work stoppage.
FINANCIAL INFORMATION ABOUT GEOGRAPHIC AREAS
Refer to Note 5, "Revenue," and Note 18, "Segment Information," presented in the Notes to the Consolidated Financial Statements for geographic information.
AVAILABLE INFORMATION
Our Annual Reports on Form 10-K, Quarterly Reports on Form 10-Q, Current Reports on Form 8-K and all amendments to these reports filed or furnished pursuant to Section 13(a) or 15(d) of the Securities Exchange Act of 1934 are available free of charge on our investor website, located at www.tapestry.com/investors under the caption “SEC Filings,” as soon as reasonably practicable after they are filed with or furnished to the Securities and Exchange Commission. These reports are also available on the Securities and Exchange Commission’s website at www.sec.gov. No information contained on any of our websites is intended to be included as part of, or incorporated by reference into, this Annual Report on Form 10-K.
The Company has included the Chief Executive Officer (“CEO”) and Chief Financial Officer certifications regarding its public disclosure required by Section 302 of the Sarbanes-Oxley Act of 2002 as Exhibit 31.1 to this Form 10-K.
Item 1A. RISK FACTORS
You should consider carefully all of the information set forth or incorporated by reference in this document and, in particular, the following risk factors associated with the business of the Company and forward-looking information in this document. Please also see “Special Note on Forward-Looking Information” at the beginning of this report. The risks described below are not the only ones we face. Additional risks not presently known to us or that we currently deem immaterial may also have an adverse effect on us. If any of the risks below actually occur, our business, results of operations, cash flows or financial condition could suffer.
The Covid-19 pandemic and resulting adverse economic conditions are and may continue to have a material adverse impact on our business, financial condition, results of operations and cash flows.
The Covid-19 pandemic has impacted a significant majority of the regions in which we operate, disrupting operations, consumer spending and global supply chains and creating significant disruption and volatility of financial markets. The impacts of Covid-19 have and may continue to materially adversely impact our operations, cash flow and liquidity. In March 2020, the outbreak was labeled a global pandemic by the World Health Organization. National, state and local governments have responded to the Covid-19 pandemic in a variety of ways, including, but not limited to, by declaring states of emergency, restricting people from gathering in groups or interacting within a certain physical distance (i.e., social distancing), requiring individuals to stay at home, and in most cases, ordering non-essential businesses to close or limit operations. The Company had temporarily closed the majority of its directly operated stores globally for some period of time to help reduce the spread of Covid-19. As of the end of the fiscal year, the vast majority of the Company’s stores had been re-opened for either in-store or curb-side service. Many of the Company’s wholesale partners also closed their bricks and mortar stores as required by government orders during the third and fourth fiscal quarter.
The global Covid-19 pandemic is continuing to evolve rapidly and the extent to which the pandemic ultimately impacts our results and our business - including unforeseen increased costs to our business - will depend on future developments, which are highly uncertain and cannot be predicted, including the ultimate duration, severity and sustained geographic spread of the virus, such as the possibility of a "second wave" of increased infections, and the success of actions to contain the virus or treat its impact, among others. While the full magnitude of the effects on our business is difficult to predict at this time, the Covid-19 pandemic has and is expected to continue to have a material adverse impact on our business, financial condition, and results of operations. Although the ultimate severity and impact of the Covid-19 pandemic is uncertain at this time and depends on future events outside of our control, our business is expected to continue to be adversely impacted by several factors, including, but not limited to:
| • | The potential economic effects of the pandemic, including a possible recession, increased unemployment and decreased consumer credit availability, may result in lower consumer confidence and decreased disposable income and discretionary spending levels, which may lead to reduced sales of our products. Unfavorable economic conditions, fears of becoming ill and sustained travel restrictions may also reduce consumers’ willingness and ability to travel to major cities and vacation destinations in which the Company’s stores are located. Furthermore, reduced discretionary spending may result in an excess of inventory throughout the industry, which could lead to increased pressure on our gross margin in the near term if the Company has to increase promotional activity above its normal levels to sell through its existing product. |
| • | Social distancing measures and general consumer behaviors due to the Covid-19 pandemic may continue to impact mall and store traffic even after stores return to normal operations, which may have a further negative impact on our business. Furthermore, declines in traffic beyond our current exceptions could result in additional impairment charges if expected future cash flows of the related asset group do not exceed the carrying value. |
| • | The Covid-19 pandemic has resulted in disruption to the financial markets and caused significant volatility and adverse impact on the value of our common stock. On March 30, 2020, we borrowed $700 million under our $900 million Revolving Credit Facility. If a significant number of our stores are required to close again or sales are lower than expected for an extended period of time, our liquidity may continue to be negatively impacted and we may need to draw additional funds from our Revolving Credit Facility or seek additional sources of financing, which may or may not be available. The Company is subject to additional requirements under the terms of the Revolving Credit Facility and its Senior Notes as described in "We have incurred a substantial amount of indebtedness, which could restrict our ability to engage in additional transactions or incur additional indebtedness" below. |
| • | While we are making significant efforts to reduce our non-essential SG&A expenses, including but not limited to, through discussions with our landlords and other vendors to obtain rent and other relief, we may not be successful in these endeavors and may be subject to continued expenses and potential litigation or claims from such landlords and vendors. |
| • | We continue to sell products through our stores that have re-opened and through our e-commerce sites. The majority of our distribution centers remain open and operational through the date of this report; however, such distribution centers may be forced to close or limit operations due to governmental mandates, health and safety concerns, or illness or absence of a substantial number of distribution center employees. Our third party logistics providers may also experience delays in fulfilling our orders to our customers. |
| • | We source and manufacture our products on a global scale and may experience material temporary or long-term disruption in our supply chain, given the global reach of the Covid-19 pandemic. Travel restrictions, closures or disruptions of business and facilities or social, economic, political or labor instability in the affected areas may impact the operations of our raw material suppliers or manufacturing partners. |
The successful execution of our Acceleration Program is key to the long-term success of our business.
The Company is undergoing a review of its business under the Acceleration Program. The guiding principle of this multi-year growth agenda is to better meet the needs of each of its brands' unique customers by (i) Sharpening our Focus on the Customer (ii) Leveraging Data and Leading with a Digital-First Mindset and (iii) Transforming into a Leaner and More Responsive Organization. The Company believes the successful execution of these priorities will fuel desire for the Coach, Kate Spade and Stuart Weitzman brands, driving accelerated revenue growth, higher gross margins and substantial operating leverage across Tapestry’s portfolio.
The Acceleration Program reflects: (i) actions to streamline the Company's organization; (ii) select store closures as the Company optimizes its fleet (including store closure costs incurred as the Company exits certain regions in which it currently operates); and (iii) professional fees and compensation costs incurred as a result of the development and execution of the Company's comprehensive strategic
Showing the first 8K of 68K characters. Open the full section
Item 1B. UNRESOLVED STAFF COMMENTS
None.
Item 2. PROPERTIES
The following table sets forth the location, use and size of the Company's key distribution, corporate and product development facilities as of June 27, 2020. The majority of the properties are leased, with the leases expiring at various times through fiscal 2037, subject to renewal options.
| Location | Use | Approximate Square Footage | |||
| Jacksonville, Florida | Coach North America distribution and customer service | 850,000 | |||
| New York, New York | Corporate, design, sourcing and product development | 546,000(1) | |||
| Westchester, Ohio | Kate Spade North America distribution | 601,000 | |||
| Chiba, Japan | Japan regional distribution | 244,000 | |||
| Shanghai, China | Asia regional distribution | 179,000 | |||
| New York, New York | Kate Spade corporate management | 135,000 | |||
| North Bergen, New Jersey | Corporate office and customer service | 106,000 | |||
| Carlstadt, New Jersey | Corporate office | 65,000 | |||
| Tokyo, Japan | Corporate and regional management | 24,900 | |||
| Shanghai, China | Coach Greater China regional management | 23,000 | |||
| Elda, Spain | Stuart Weitzman regional management, sourcing and quality control | 19,000 | |||
| Seoul, South Korea | Corporate regional management | 18,000 | |||
| Hong Kong SAR, China | Coach sourcing and quality control | 17,000(2) | |||
| Dongguan, China | Corporate sourcing, quality control and product development | 16,700 | |||
| London, England | International regional management | 16,500 | |||
| Shanghai, China | Asia regional management | 16,200 | |||
| Singapore | Coach Singapore regional management, sourcing and quality control | 12,600 | |||
| Ho Chi Minh City, Vietnam | Coach sourcing and quality control | 12,600 | |||
| Tokyo, Japan | Kate Spade Japan regional management | 11,000 | |||
| Montreal, Canada | Stuart Weitzman Canada regional management and distribution | 9,100 | |||
| Shanghai, China | Kate Spade Joint Venture regional management | 7,000 |
| (1) | The Company has subleased approximately 148,800 square feet in its global headquarters. |
| (2) | Represents a Company-owned location. |
In addition to the above properties, the Company occupies leased retail and outlet store locations located in North America and internationally for each of our brands. These leases expire at various times through fiscal 2036. The Company considers these properties to be in generally good condition, and believes that its facilities are adequate for its operations and provide sufficient capacity to meet its anticipated requirements. Refer to Item 1. "Business," and Item 6. "Selected Financial Data," for further information.
Item 3. LEGAL PROCEEDINGS
The Company is involved in various routine legal proceedings as both plaintiff and defendant incident to the ordinary course of its business, including proceedings to protect Tapestry, Inc.'s intellectual property rights, litigation instituted by persons alleged to have been injured by advertising claims or upon premises within the Company's control, and litigation with present or former employees.
As part of Tapestry’s policing program for its intellectual property rights, from time to time, the Company files lawsuits in the U.S. and abroad alleging acts of trademark counterfeiting, trademark infringement, patent infringement, trade dress infringement, copyright infringement, unfair competition, trademark dilution and/or state or foreign law claims. At any given point in time, Tapestry may have a number of such actions pending. These actions often result in seizure of counterfeit merchandise and/or out of court settlements with defendants. From time to time, defendants will raise, either as affirmative defenses or as counterclaims, the invalidity or unenforceability of certain of Tapestry’s intellectual properties.
Although the Company's litigation as a defendant is routine and incidental to the conduct of Tapestry’s business, as well as for any business of its size, such litigation can result in large monetary awards, such as when a civil jury is allowed to determine compensatory and/or punitive damages.
The Company believes that the outcome of all pending legal proceedings in the aggregate will not have a material effect on the Company's business or consolidated financial statements.
Tapestry has not entered into any transactions that have been identified by the IRS as abusive or that have a significant tax avoidance purpose. Accordingly, we have not been required to pay a penalty to the IRS for failing to make disclosures required with respect to certain transactions that have been identified by the IRS as abusive or that have a significant tax avoidance purpose.
Item 4. MINE SAFETY DISCLOSURES
Not applicable.
PART II
Item 5. MARKET FOR REGISTRANT’S COMMON EQUITY, RELATED STOCKHOLDER MATTERS AND ISSUER PURCHASES OF EQUITY SECURITIES
Market and Dividend Information
Tapestry, Inc.’s common stock is listed on the New York Stock Exchange and is traded under the symbol “TPR.”
As of July 31, 2020, there were 2,123 holders of record of Tapestry’s common stock.
Any future determination to pay cash dividends will be at the discretion of Tapestry’s Board and will be dependent upon Tapestry’s financial condition, operating results, capital requirements and such other factors as the Board deems relevant.
The information under the principal heading “Securities Authorized For Issuance Under Equity Compensation Plans” in the Company’s definitive Proxy Statement for the Annual Meeting of Stockholders to be held on November 5, 2020, to be filed with the Securities and Exchange Commission (the “Proxy Statement”), is incorporated herein by reference.
Performance Graph
The following graph compares the cumulative total stockholder return (assuming reinvestment of dividends) of the Company's common stock with the cumulative total return of the Standard & Poor's ("S&P") 500 Stock Index and the “peer set" companies listed below over the five-fiscal-year period ending June 27, 2020, the last day of Tapestry’s most recent fiscal year. The graph assumes that $100 was invested on June 26, 2015 at the per share closing price in each of Tapestry’s common stock, the S&P 500 Stock Index and a peer set index tracking the peer group companies listed below, and that all dividends were reinvested. The stock performance shown in the graph is not intended to forecast or be indicative of future performance.
During fiscal 2020, the Company established a new peer group consisting of:
| • | L Brands, Inc. |
| • | PVH Corp., |
| • | Ralph Lauren Corporation, |
| • | V.F. Corporation, |
| • | Estee Lauder, Inc., |
| • | Capri Holdings Limited |
The Company's old peer group consisted of:
| • | L Brands, Inc., |
| • | PVH Corp., |
| • | Ralph Lauren Corporation, |
| • | Tiffany & Co., |
| • | V.F. Corporation, |
| • | Estee Lauder, Inc., |
| • | Capri Holdings Limited |
The Company removed Tiffany & Co. from the peer set due to recent business updates associated with the company. Furthermore, Tapestry management selected the "revised peer set" on an industry/line-of-business basis and believes this updated set of companies represent good faith comparables based on their history, size, and business models in relation to Tapestry, Inc.
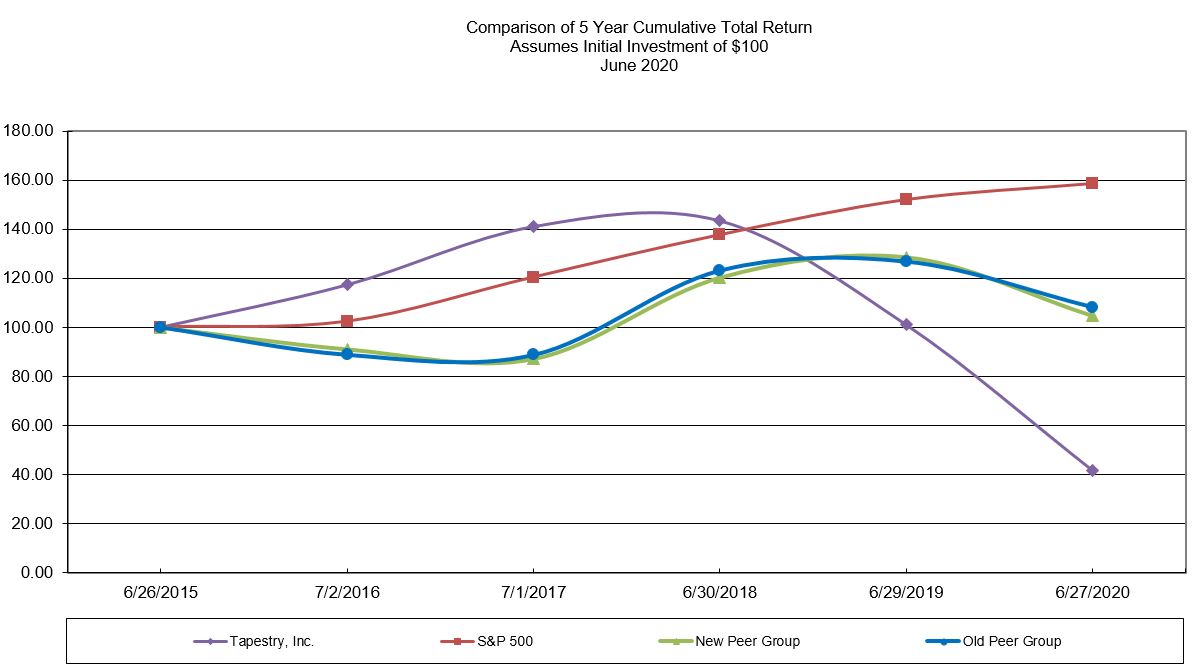
| Fiscal 2015 | Fiscal 2016 | Fiscal 2017 | Fiscal 2018 | Fiscal 2019 | Fiscal 2020 | |||||||
| TPR | $100.00 | $117.28 | $140.99 | $143.36 | $101.04 | $41.71 | ||||||
| Revised Peer Set | $100.00 | $91.12 | $87.19 | $120.36 | $128.62 | $104.69 | ||||||
| Former Set | $100.00 | $88.85 | $88.80 | $123.07 | $126.73 | $108.16 | ||||||
| S&P 500 | $100.00 | $102.33 | $120.38 | $137.69 | $152.03 | $158.60 |
Stock Repurchase Program
The Company did not repurchase any shares of common stock during the fourth quarter of fiscal 2020. As of June 27, 2020, the Company had $600 million availability remaining in the stock repurchase program. The Company may terminate or limit the share repurchase program at any time. The Company is restricted from engaging in share buybacks during the Covenant Relief Period under Amendment No.1 to its Credit Facility.
Item 6. SELECTED FINANCIAL DATA
The selected historical financial data presented below as of and for each of the fiscal years in the five-year period ended June 27, 2020 has been derived from the Company’s audited Consolidated Financial Statements. The financial data should be read in conjunction with Item 7, “Management’s Discussion and Analysis of Financial Condition and Results of Operations,” the Consolidated Financial Statements and Notes thereto and other financial data included elsewhere herein.
| Fiscal Year Ended**(3)** | |||||||||||||||||||
| June 27, 2020 | June 29, 2019 | June 30, 2018 | July 1, 2017 | July 2, 2016 | |||||||||||||||
| (millions, except per share data) | |||||||||||||||||||
| Consolidated Statements of Operations: | |||||||||||||||||||
| Net sales | $ | 4,961.4 | $ | 6,027.1 | $ | 5,880.0 | $ | 4,488.3 | $ | 4,491.8 | |||||||||
| Gross profit | 3,239.3 | 4,053.7 | 3,848.5 | 3,081.1 | 3,051.3 | ||||||||||||||
| Selling, general and administrative ("SG&A") expenses | 3,790.1 | 3,234.0 | 3,176.5 | 2,283.5 | 2,395.5 | ||||||||||||||
| Operating income (loss) | (550.8 | ) | 819.7 | 672.0 | 797.6 | 655.8 | |||||||||||||
| Net income (loss) | $ | (652.1 | ) | 643.4 | 397.5 | 591.0 | 460.5 | ||||||||||||
| Net income (loss) per share: | |||||||||||||||||||
| Basic | $ | (2.34 | ) | $ | 2.22 | $ | 1.39 | $ | 2.11 | $ | 1.66 | ||||||||
| Diluted | $ | (2.34 | ) | $ | 2.21 | $ | 1.38 | $ | 2.09 | $ | 1.65 | ||||||||
| Weighted-average basic shares outstanding | 278.6 | 289.4 | 285.4 | 280.6 | 277.6 | ||||||||||||||
| Weighted-average diluted shares outstanding | 278.6 | 290.8 | 288.6 | 282.8 | 279.3 | ||||||||||||||
| Dividends declared per common share | $ | 1.013 | $ | 1.350 | $ | 1.350 | $ | 1.350 | $ | 1.350 | |||||||||
| Consolidated Percentage of Net Sales Data: | |||||||||||||||||||
| Gross margin | 65.3 | % | 67.3 | % | 65.5 | % | 68.6 | % | 67.9 | % | |||||||||
| SG&A expenses | 76.4 | 53.7 | 54.0 | 50.9 | 53.3 | ||||||||||||||
| Operating margin | (11.1 | ) | 13.6 | 11.4 | 17.8 | 14.6 | |||||||||||||
| Net income (loss) | (13.1 | ) | 10.7 | 6.8 | 13.2 | 10.3 | |||||||||||||
| Consolidated Balance Sheet Data: | |||||||||||||||||||
| Working capital | $ | 811.0 | $ | 1,638.8 | $ | 1,494.4 | $ | 3,199.5 | $ | 1,346.2 | |||||||||
| Total assets | 7,924.2 | 6,877.3 | 6,678.3 | 5,831.6 | 4,892.7 | ||||||||||||||
| Cash, cash equivalents and investments | 1,434.5 | 1,233.9 | 1,250.0 | 3,158.7 | 1,878.0 | ||||||||||||||
| Inventory | 736.9 | 778.3 | 673.8 | 469.7 | 459.2 | ||||||||||||||
| Total debt | 2,299.4 | 1,602.7 | 1,600.6 | 1,579.5 | 876.2 | ||||||||||||||
| Stockholders' equity | 2,276.4 | 3,513.4 | 3,244.6 | 3,001.9 | 2,682.9 |
| Fiscal Year Ended | ||||||||||||||
| June 27, 2020 | June 29, 2019(1) | June 30, 2018(1) | July 1, 2017 | July 2, 2016(2) | ||||||||||
| Store Data: | ||||||||||||||
| Stores open at fiscal year-end: | ||||||||||||||
| Coach North America stores | 375 | 391 | 402 | 419 | 432 | |||||||||
| Coach International stores | 583 | 595 | 585 | 543 | 522 | |||||||||
| Kate Spade North America stores | 213 | 213 | 200 | — | — | |||||||||
| Kate Spade International stores | 207 | 194 | 142 | — | — | |||||||||
| Stuart Weitzman North America stores | 58 | 71 | 68 | 69 | 64 | |||||||||
| Stuart Weitzman International stores | 73 | 76 | 35 | 12 | 11 | |||||||||
| Total stores open at fiscal year-end | 1,509 | 1,540 | 1,432 | 1,043 | 1,029 | |||||||||
| Store square footage at fiscal year-end: | ||||||||||||||
| Coach North America stores | 1,758,668 | 1,802,410 | 1,835,543 | 1,884,204 | 1,892,146 | |||||||||
| Coach International stores | 1,285,329 | 1,304,618 | 1,256,525 | 1,166,920 | 1,086,315 | |||||||||
| Kate Spade North America stores | 603,487 | 578,649 | 495,121 | — | — | |||||||||
| Kate Spade International stores | 291,322 | 267,349 | 171,754 | — | — | |||||||||
| Stuart Weitzman North America stores | 102,784 | 125,336 | 117,869 | 117,944 | 105,264 | |||||||||
| Stuart Weitzman International stores | 89,182 | 90,300 | 47,498 | 18,808 | 12,556 | |||||||||
| Total store square footage at fiscal year-end | 4,130,772 | 4,168,662 | 3,924,310 | 3,187,876 | 3,096,281 | |||||||||
| Average store square footage at fiscal year-end: | ||||||||||||||
| Coach North America stores | 4,690 | 4,610 | 4,566 | 4,497 | 4,380 | |||||||||
| Coach International stores | 2,205 | 2,193 | 2,148 | 2,149 | 2,081 | |||||||||
| Kate Spade North America stores | 2,833 | 2,717 | 2,476 | — | — | |||||||||
| Kate Spade International stores | 1,407 | 1,378 | 1,210 | — | — | |||||||||
| Stuart Weitzman North America stores | 1,772 | 1,765 | 1,733 | 1,709 | 1,645 | |||||||||
| Stuart Weitzman International stores | 1,222 | 1,188 | 1,357 | 1,567 | 1,141 |
| (1) | Refer to Part I, Item 1, "Business" for the number of stores acquired during the respective fiscal year for each brand. |
| (2) | The Company acquired the Stuart Weitzman Canada distributor in the fourth quarter of fiscal 2016 (which included the impact of an additional 14 retail stores in North America). |
| (3) | The Company recorded certain items which affect the comparability of our results. See Item 7, “Management’s Discussion and Analysis of Financial Condition and Results of Operations,” for further information on the items related to fiscal 2020 and fiscal 2019. During fiscal 2018, the Company recorded adjustments in cost of sales and SG&A expenses of $116.4 million and $204.7 million, respectively, related to the Operational Efficiency plan and its Integration and Acquisition costs. During fiscal 2017, the Company recorded adjustments in cost of sales and SG&A expenses of $2.9 million and $22.3 million, respectively, related to the Operational Efficiency plan and its Integration and Acquisition efforts. During fiscal 2016, the Company recorded adjustments in cost of sales and SG&A expenses of $1.1 million and $122.0 million related to the Company's multi-year strategic plan to transform the Coach brand, announced in fiscal 2014, the Operational Efficiency Plan and Stuart Weitzman acquisition-related costs. The following table reconciles the Company's reported results presented in accordance with accounting principles generally accepted in the United States of America ("GAAP") to our adjusted results that exclude these items: |
| Net Income (Loss) | |||||||||||||||||||
| Fiscal 2020 | Gross Profit | SG&A Expenses | Operating Income | Amount | Per Diluted Share | ||||||||||||||
| As Reported: (GAAP Basis) | $ | 3,239.3 | $ | 3,790.1 | $ | (550.8 | ) | $ | (652.1 | ) | $ | (2.34 | ) | ||||||
| Excluding items affecting comparability | 118.0 | (871.2 | ) | 989.2 | 923.3 | 3.31 | |||||||||||||
| Adjusted: (Non-GAAP Basis) | $ | 3,357.3 | $ | 2,918.9 | $ | 438.4 | $ | 271.2 | $ | 0.97 | |||||||||
| Net Income | |||||||||||||||||||
| Fiscal 2019 | Gross Profit | SG&A Expenses | Operating Income | Amount | Per Diluted Share | ||||||||||||||
| As Reported: (GAAP Basis) | $ | 4,053.7 | $ | 3,234.0 | $ | 819.7 | $ | 643.4 | $ | 2.21 | |||||||||
| Excluding items affecting comparability | 27.8 | (103.5 | ) | 131.3 | 105.3 | 0.36 | |||||||||||||
| Adjusted: (Non-GAAP Basis) | $ | 4,081.5 | $ | 3,130.5 | $ | 951.0 | $ | 748.7 | $ | 2.57 | |||||||||
| Net Income | |||||||||||||||||||
| Fiscal 2018 | Gross Profit | SG&A Expenses | Operating Income | Amount | Per Diluted Share | ||||||||||||||
| As Reported: (GAAP Basis) | $ | 3,848.5 | $ | 3,176.5 | $ | 672.0 | $ | 397.5 | $ | 1.38 | |||||||||
| Excluding items affecting comparability | 116.4 | (204.7 | ) | 321.1 | 362.4 | 1.25 | |||||||||||||
| Adjusted: (Non-GAAP Basis) | $ | 3,964.9 | $ | 2,971.8 | $ | 993.1 | $ | 759.9 | $ | 2.63 | |||||||||
| Net Income | |||||||||||||||||||
| Fiscal 2017 | Gross Profit | SG&A Expenses | Operating Income | Amount | Per Diluted Share | ||||||||||||||
| As Reported: (GAAP Basis) | $ | 3,081.1 | $ | 2,283.5 | $ | 797.6 | $ | 591.0 | $ | 2.09 | |||||||||
| Excluding items affecting comparability | 2.9 | (22.3 | ) | 25.2 | 18.3 | 0.06 | |||||||||||||
| Adjusted: (Non-GAAP Basis) | $ | 3,084.0 | $ | 2,261.2 | $ | 822.8 | $ | 609.3 | $ | 2.15 | |||||||||
| Net Income | |||||||||||||||||||
| Fiscal 2016 | Gross Profit | SG&A Expenses | Operating Income | Amount | Per Diluted Share | ||||||||||||||
| As Reported: (GAAP Basis) | $ | 3,051.3 | $ | 2,395.5 | $ | 655.8 | $ | 460.5 | $ | 1.65 | |||||||||
| Excluding items affecting comparability | 1.1 | (122.0 | ) | 123.1 | 91.2 | 0.33 | |||||||||||||
| Adjusted: (Non-GAAP Basis) | $ | 3,052.4 | $ | 2,273.5 | $ | 778.9 | $ | 551.7 | $ | 1.98 |
Item 7. MANAGEMENT’S DISCUSSION AND ANALYSIS OF FINANCIAL CONDITION AND RESULTS OF OPERATIONS
The following discussion of the Company's financial condition and results of operations should be read together with the Company’s consolidated financial statements and notes to those financial statements included elsewhere in this document. When used herein, the terms “the Company,” "Tapestry," “we,” “us” and “our” refer to Tapestry, Inc., including consolidated subsidiaries. References to "Coach," "Stuart Weitzman," "Kate Spade" or "kate spade new york" refer only to the referenced brand.
EXECUTIVE OVERVIEW
The fiscal years ended June 27, 2020, June 29, 2019 and June 30, 2018 were each 52-week periods.
Tapestry is a leading New York-based house of modern luxury accessories and lifestyle brands. Tapestry is powered by optimism, innovation and inclusivity. Our brands are approachable and inviting and create joy every day for people around the world. Defined by quality, craftsmanship and creativity, our house of brands give global audiences the opportunity for exploration and self-expression. Tapestry is comprised of the Coach, Kate Spade and Stuart Weitzman brands, all of which have been part of the American landscape for over 25 years.
The Company has three reportable segments:
| • | Coach - Includes global sales of Coach products to customers through Coach operated stores, including the Internet and concession shop-in-shops, and sales to wholesale customers and through independent third party distributors. |
| • | Kate Spade - Includes global sales primarily of kate spade new york brand products to customers through Kate Spade operated stores, including the Internet, sales to wholesale customers, through concession shop-in-shops and through independent third party distributors. |
| • | Stuart Weitzman - Includes global sales of Stuart Weitzman brand products primarily through Stuart Weitzman operated stores, including the Internet, sales to wholesale customers and through numerous independent third party distributors. |
Each of our brands is unique and independent, while sharing a commitment to innovation and authenticity defined by distinctive products and differentiated customer experiences across channels and geographies. Our success does not depend solely on the performance of a single channel, geographic area or brand.
Acceleration Program
The guiding principle of the Company’s multi-year growth agenda under the Acceleration Program is to better meet the needs of each of its brands' unique customers by:
| • | Sharpening our Focus on the Consumer: Operating with a clearly defined purpose and strategy for each brand and an unwavering focus on the consumer at the core of everything we do |
| • | Leveraging Data and Leading with a Digital-First Mindset: Building significant data and analytics capabilities to drive decision-making and increase efficiency; Offering immersive customer experiences across our e-commerce and social channels to meet the needs of consumers who are increasingly utilizing digital platforms to engage with brands; Rethinking the role of stores with an intent to optimize our fleet |
| • | Transforming into a Leaner and More Responsive Organization: Moving with greater agility, simplifying internal processes and empowering teams to act quickly to meet the rapidly changing needs of the consumer |
The Company believes the successful execution of these priorities will fuel desire for the Coach, Kate Spade and Stuart Weitzman brands, driving accelerated revenue growth, higher gross margins and substantial operating leverage across Tapestry’s portfolio. Key strategies by brand include:
Coach
| • | Deepening Engagement with Consumers through enhanced brand and cultural relevance, united by our values and purpose to be authentic, inclusive and embody the courageous spirit of New York City |
| • | Creating Innovative and Compelling Product to exceed the expectations of our target consumers by geography and customer segments |
| • | Driving Digital Sales and New Customer Recruitment by offering a true omnichannel experience |
| • | Accelerating Growth in China through tailored and optimized assortments, enhanced marketing and expanded reach across direct channels and third party online distribution |
| • | Enhancing Profitability through more focused assortments and a disciplined approach to promotions, resulting in continued Average Unit Retail ("AUR") improvements and higher gross margin. In addition, achieving operational excellence by right-sizing SG&A cost structure and store fleet |
Kate Spade
| • | Crystallizing the Brand’s Purpose and Returning to a Position of Strength by fulfilling our promise as a lifestyle brand representing joy, optimism and color, amplified through unique, best-in-class storytelling on a multi-category lifestyle platform |
| • | Instilling a Laser Focus on the Customer across all touchpoints, and fostering a community of women emotionally connected to and inspired by the Kate Spade brand story and values |
| • | Reenergizing and Growing Handbags and Leathergoods by reintroducing non-negotiable brand elements, rebuilding the core offering, and capitalizing on a new Signature platform |
| • | Leaning into Digital Strength by modernizing and creating engaging brand experiences across all of our digital platforms, fully unleashing the power of Kate Spade community and brand |
| • | Capturing Market Share and Improving Profitability by acquiring, re-engaging, and retaining customers, driving top and bottom line growth |
Stuart Weitzman
| • | Renewing the Brand’s Reputation for Fit, Comfort and Quality, listening and responding to our customer’s needs in order to design beautiful and on-trend shoes |
| • | Growing Key Categories by building a leading presence in boots, booties and sandals and expanding the casual assortment, while dramatically simplifying the product offering |
| • | Restoring Profitability by focusing distribution on those markets and channels of greatest opportunity, notably China where the brand has strong momentum and high margins |
| • | Strengthening Relationship with Wholesale Partners by providing relevant products and faster, more consistent execution |
| • | Establishing a Robust Digital Presence which supports best-in-class multi-media content and depth of assortment |
Recent Developments
Covid-19 Pandemic
Tapestry began fiscal 2020 with a focus on profitable growth through innovation, global expansion, investing in digital capabilities, and harnessing the power of a multi-brand model. However, the Covid-19 pandemic has had significant impacts on our business globally. As a result, while the Company remains confident in its long-term strategy, its short-term focus has pivoted towards adapting to these challenges.
The Covid-19 virus has impacted regions all around the world, resulting in restrictions and shutdowns implemented by national, state, and local authorities. Consequently, the spread of Covid-19 has caused significant global business disruptions, including full and partial store closures. As a result of the widespread impact of Covid-19, Tapestry had temporarily closed the majority of its directly operated stores in globally for some period of time to help reduce the spread of Covid-19. As of the end of the fiscal year, the vast majority of the Company's stores have reopened for either in-store or curb-side service. Many of our wholesale and licensing partners have a
Showing the first 8K of 92K characters. Open the full section
Item 7A. QUANTITATIVE AND QUALITATIVE DISCLOSURES ABOUT MARKET RISK
Market Risk
The market risk inherent in our financial instruments represents the potential loss in fair value, earnings or cash flows, arising from adverse changes in foreign currency exchange rates or interest rates. The Company manages these exposures through operating and financing activities and, when appropriate, through the use of derivative financial instruments. The use of derivative financial instruments is in accordance with the Company's risk management policies, and we do not enter into derivative transactions for speculative or trading purposes.
The quantitative disclosures in the following discussion are based on quoted market prices obtained through independent pricing sources for the same or similar types of financial instruments, taking into consideration the underlying terms and maturities and theoretical pricing models. These quantitative disclosures do not represent the maximum possible loss or any expected loss that may occur, since actual results may differ from those estimates.
Foreign Currency Exchange Rate Risk
Foreign currency exposures arise from transactions, including firm commitments and anticipated contracts, denominated in a currency other than the entity’s functional currency, and from foreign-denominated revenues and expenses translated into U.S. dollars. The majority of the Company's purchases and sales involving international parties, excluding international consumer sales, are denominated in U.S. dollars and, therefore, our foreign currency exchange risk is limited. The Company is exposed to risk from foreign currency exchange rate fluctuations resulting from its operating subsidiaries’ transactions denominated in foreign currencies. To mitigate such risk, certain subsidiaries enter into forward currency contracts. As of June 27, 2020 and June 29, 2019, forward currency contracts designated as cash flow hedges with a notional amount of $586.2 million and $398.4 million, respectively, were outstanding. As a result of the use of derivative instruments, we are exposed to the risk that counterparties to the derivative instruments will fail to meet their contractual obligations. To mitigate the counterparty credit risk, we only enter into derivative contracts with carefully selected financial institutions. The Company also reviews the creditworthiness of our counterparties on a regular basis. As a result of the above considerations, we do not believe that we are exposed to any undue concentration of counterparty credit risk associated with our derivative contracts as of June 27, 2020.
The Company is also exposed to transaction risk from foreign currency exchange rate fluctuations with respect to various cross-currency intercompany loans. This primarily includes exposure to exchange rate fluctuations in the Chinese Renminbi, the British Pound Sterling and the Euro. To manage the exchange rate risk related to these loans, the Company enters into forward currency contracts. As of June 27, 2020 and June 29, 2019, the total notional values of outstanding forward foreign currency contracts related to these loans were $76.9 million and $14.5 million, respectively.
The fair value of outstanding forward currency contracts included in current assets at June 27, 2020 and June 29, 2019 was $2.9 million and $1.1 million, respectively. The fair value of outstanding foreign currency contracts included in current liabilities at June 27, 2020 and June 29, 2019 was $1.7 million and $4.9 million, respectively. The fair value of these contracts is sensitive to changes in foreign currency exchange rates. A sensitivity analysis of the effects of foreign exchange rate fluctuations on the fair values of our derivative contracts was performed to assess the risk of loss. As of June 27, 2020, a 10% devaluation of the U.S. Dollar against the exchange rates for foreign currencies under contract would result in an immaterial impact on derivative contract fair values.
Interest Rate Risk
The Company is exposed to interest rate risk in relation to its Revolving Credit Facility entered into under the credit agreement dated October 24, 2019 as amended May 19, 2020, the 2025 Senior Notes, 2022 Senior Notes, 2027 Senior Notes (collectively the "Senior Notes") and investments.
Our exposure to changes in interest rates is primarily attributable to debt outstanding under the Revolving Credit Facility. Borrowings under the Facility bear interest at a rate per annum equal to, at the Company’s option, either (a) an alternate base rate (which is a rate equal to the greatest of (i) the Prime Rate in effect on such day, (ii) the Federal Funds Effective Rate in effect on such day plus ½ of 1% or (iii) the Adjusted LIBO Rate for a one month Interest Period on such day plus 1%) or (b) a rate based on the rates applicable for deposits in the interbank market for U.S. dollars or the applicable currency in which the loans are made plus, in each case, an applicable margin. The applicable margin will be determined by reference to a grid, as defined in the Credit Agreement, based on the ratio of (a) consolidated debt plus operating lease liability to (b) consolidated EBITDAR. A hypothetical 10% change in the credit agreement interest rate would have resulted in an immaterial change in interest expense in fiscal 2020. Furthermore, a prolonged disruption on our business resulting from the Covid-19 pandemic may impact our ability to satisfy the terms of our Revolving Credit Facility, including our liquidity covenant.
The Company is exposed to changes in interest rates related to the fair value of the Senior Notes. At June 27, 2020, the fair value of the 2025 Senior Notes, 2022 Senior Notes and 2027 Senior Notes was approximately $577 million, $393 million and $565 million, respectively. At June 29, 2019, the fair value of the 2025 Senior Notes, 2022 Senior Notes and 2027 Senior Notes
was approximately $630 million, $399 million and $606 million, respectively. These fair values are based on external pricing data, including available quoted market prices of these instruments, and consideration of comparable debt instruments with similar interest rates and trading frequency, among other factors, and are classified as Level 2 measurements within the fair value hierarchy. The interest rate payable on the 2022 and 2027 Senior Notes will be subject to adjustments from time to time if either Moody’s or S&P or a substitute rating agency (as defined in the Prospectus Supplement furnished with the SEC on June 7, 2017) downgrades (or downgrades and subsequently upgrades) the credit rating assigned to the respective Senior Notes of such series.
The Company’s investment portfolio is maintained in accordance with the Company’s investment policy, which defines our investment principles including credit quality standards and limits the credit exposure of any single issuer. The primary objective of our investment activities is the preservation of principal while maximizing interest income and minimizing risk. We do not hold any investments for trading purposes.
Item 8. FINANCIAL STATEMENTS AND SUPPLEMENTARY DATA
Refer to “Index to Financial Statements,” appearing at the end of this Annual Report on Form 10-K.
Item 9. CHANGES IN AND DISAGREEMENTS WITH ACCOUNTANTS ON ACCOUNTING AND FINANCIAL DISCLOSURE
None.
Item 9A. CONTROLS AND PROCEDURES
Disclosure Controls and Procedures
Based on the evaluation of the Company’s disclosure controls and procedures, as that term is defined in Rule 13a-15(e) under the Securities Exchange Act of 1934, as amended, the Chief Executive Officer of the Company and the Chief Financial Officer of the Company, have concluded that the Company’s disclosure controls and procedures are effective as of June 27, 2020.
Management’s Report on Internal Control over Financial Reporting
The Company’s management is responsible for establishing and maintaining adequate internal controls over financial reporting as defined in Rule 13a-15(f). The Company’s internal control system was designed to provide reasonable assurance to the Company’s management and Board regarding the preparation and fair presentation of published financial statements. Management evaluated the effectiveness of the Company’s internal control over financial reporting using the criteria set forth by the Committee of Sponsoring Organizations (COSO) of the Treadway Commission in Internal Control — Integrated Framework in 2013. Management, under the supervision and with the participation of the Company’s Chief Executive Officer and Chief Financial Officer, assessed the effectiveness of the Company’s internal control over financial reporting as of June 27, 2020 and concluded that it is effective.
The Company’s independent auditors have issued an audit report on the Company's internal control over financial reporting as of June 27, 2020 as included elsewhere herein.
Changes in Internal Control over Financial Reporting
During the first quarter of fiscal 2020, the Company adopted ASU 2016-02. As such, the Company implemented new controls and modifications to existing accounting processes related to lease accounting. These changes include the upgrade to a new lease accounting system and introduction of processes to evaluate and account for lease contracts under the new accounting standard.
During the second quarter of fiscal 2019, the Company completed the first phase of its ERP implementation, SAP’s S4/HANA, migrating the global finance functions for Corporate, Coach and Stuart Weitzman. The second phase of this implementation which was the finance and supply chain functions were implemented for Kate Spade during the third quarter of fiscal 2019. Furthermore, the supply chain functions for Coach and Stuart Weitzman followed during fiscal 2020. As a result of the implementations, there were certain changes to processes and procedures, which resulted in changes to the Company’s internal control over financial reporting. The implementation of SAP’s S4/HANA is expected to strengthen the financial controls by automating certain manual processes and standardizing business processes and reporting across the organization. The Company will continue to evaluate and monitor the internal controls over financial reporting during this period of change and will continue to evaluate the operating effectiveness of related key controls. For a discussion of risks related to the implementation of new systems, see Part I, Item 1A, Risk Factors herein.
Other than the lease accounting standards adoption and ERP system implementation noted above, there were no other changes in our internal control over financial reporting during the fiscal year ended June 27, 2020 that have materially affected, or are reasonably likely to materially affect, our internal control over financial reporting. We have not experienced any material impact to our internal controls over financial reporting despite the fact that most of our employees are working remotely due to the Covid-19 pandemic. We are continually monitoring and assessing Covid-19 as it relates to our internal controls.
Item 9B. OTHER INFORMATION
None.
PART III
Item 10. DIRECTORS, EXECUTIVE OFFICERS AND CORPORATE GOVERNANCE
The information required to be included by Item 10 of Form 10-K will be included in the Proxy Statement for the 2020 Annual Meeting of Stockholders and such information is incorporated by reference herein. The Proxy Statement will be filed with the Commission within 120 days after the end of the fiscal year covered by this Form 10-K pursuant to Regulation 14A under the Securities Exchange Act of 1934, as amended.
Item 11. EXECUTIVE COMPENSATION
The information regarding executive and director compensation set forth in the Proxy Statement for the 2020 Annual Meeting of Stockholders is incorporated herein by reference.
Item 12. SECURITY OWNERSHIP OF CERTAIN BENEFICIAL OWNERS AND MANAGEMENT AND RELATED STOCKHOLDER MATTERS
The information under the headings “Securities Authorized for Issuance Under Equity Compensation Plans” and “Tapestry Stock Ownership by Certain Beneficial Owners and Management” in the Company’s Proxy Statement for the 2020 Annual Meeting of Stockholders is incorporated herein by reference.
There are no arrangements known to the registrant that may at a subsequent date result in a change in control of the registrant.
Item 13. CERTAIN RELATIONSHIPS AND RELATED TRANSACTIONS, AND DIRECTOR INDEPENDENCE
The information required to be included by Item 13 of Form 10-K will be included in the Proxy Statement for the 2020 Annual Meeting of Stockholders and such information is incorporated by reference herein.
Item 14. PRINCIPAL ACCOUNTING FEES AND SERVICES
The information required by this item is incorporated herein by reference to the sections entitled “Fees For Audit and Other Services” and “Audit Committee Pre-Approval Policy” in the Proxy Statement for the 2020 Annual Meeting of Stockholders.
PART IV
Item 15. EXHIBITS, FINANCIAL STATEMENT SCHEDULES
| (a) | Financial Statements and Financial Statement Schedules. Refer to “Index to Financial Statements” appearing herein. |
| (b) | Exhibits. Refer to the exhibit index which is included herein. |
SIGNATURES
Pursuant to the requirements of Section 13 or 15(d) of the Securities Exchange Act of 1934, the Registrant has duly caused this report to be signed on its behalf by the undersigned, thereunto duly authorized.
TAPESTRY, INC.
| Date: August 13, 2020 | By: | /s/ Joanne C. Crevoiserat |
| Name: Joanne C. Crevoiserat Title: Interim Chief Executive Officer |
Pursuant to the requirements of the Securities Exchange Act of 1934, this report has been signed below by the following persons on behalf of the Registrant and in the capacities indicated below on August 13, 2020.
| Signature | Title | |
| /s/ Joanne C. Crevoiserat | Interim Chief Executive Officer | |
| Joanne C. Crevoiserat | (Principal Executive Officer) | |
| /s/ Andrea Shaw Resnick | Interim Chief Financial Officer | |
| Andrea Shaw Resnick | (Principal Financial Officer) | |
| /s/ Manesh B. Dadlani | Corporate Controller | |
| Manesh B. Dadlani | (Principal Accounting Officer) | |
| /s/ Susan Kropf | Chair, Board of Directors | |
| Susan Kropf | ||
| /s/ John P. Bilbrey | Director | |
| John P. Bilbrey | ||
| /s/ Darrell Cavens | Director | |
| Darrell Cavens | ||
| /s/ David Denton | Director | |
| David Denton | ||
| /s/ Anne Gates | Director | |
| Anne Gates | ||
| /s/ Annabelle Yu Long | Director | |
| Annabelle Yu Long | ||
| /s/ Ivan Menezes | Director | |
| Ivan Menezes | ||
TAPESTRY, INC.
INDEX TO CONSOLIDATED FINANCIAL STATEMENTS AND SUPPLEMENTARY INFORMATION
All other schedules are omitted because they are not applicable or the required information is shown in the Consolidated Financial Statements or Notes thereto.
REPORT OF INDEPENDENT REGISTERED PUBLIC ACCOUNTING FIRM
To the stockholders and the Board of Directors of Tapestry, Inc.
Opinion on the Financial Statements
We have audited the accompanying consolidated balance sheets of Tapestry, Inc. and subsidiaries (the "Company") as of June 27, 2020 and June 29, 2019, the related consolidated statements of operations, comprehensive income, stockholders' equity, and cash flows, for each of the three years in the period ended June 27, 2020, and the related notes and the financial statement Schedule II listed in the Index to the Consolidated Financial Statements (collectively referred to as the "financial statements"). In our opinion, the financial statements present fairly, in all material respects, the financial position of the Company as of June 27, 2020 and June 29, 2019, and the results of its operations and its cash flows for each of the three years in the period ended June 27, 2020, in conformity with accounting principles generally accepted in the United States of America.
We have also audited, in accordance with the standards of the Public Company Accounting Oversight Board (United States) (PCAOB), the Company's internal control over financial reporting as of June 27, 2020, based on criteria established in Internal Control - Integrated Framework (2013) issued by the Committee of Sponsoring Organizations of the Treadway Commission and our report dated August 13, 2020, expressed an unqualified opinion on the Company's internal control over financial reporting.
Change in Accounting Principle
As discussed in Note 3 to the financial statements, effective June 30, 2019, the Company adopted Accounting Standards Update ("ASU") No. 2016-02, "Leases (Topic 842)" (“ASC 842”), using the modified retrospective approach. Recently adopted accounting standards - ASC 842 is also communicated as a critical audit matter below.
Basis for Opinion
These financial statements are the responsibility of the Company's management. Our responsibility is to express an opinion on the Company's financial statements based on our audits. We are a public accounting firm registered with the PCAOB and are required to be independent with respect to the Company in accordance with the U.S. federal securities laws and the applicable rules and regulations of the Securities and Exchange Commission and the PCAOB.
We conducted our audits in accordance with the standards of the PCAOB. Those standards require that we plan and perform the audit to obtain reasonable assurance about whether the financial statements are free of material misstatement, whether due to error or fraud. Our audits included performing procedures to assess the risks of material misstatement of the financial statements, whether due to error or fraud, and performing procedures that respond to those risks. Such procedures included examining, on a test basis, evidence regarding the amounts and disclosures in the financial statements. Our audits also included evaluating the accounting principles used and significant estimates made by management, as well as evaluating the overall presentation of the financial statements. We believe that our audits provide a reasonable basis for our opinion.
Critical Audit Matters
The critical audit matters communicated below are matters arising from the current-period audit of the financial statements that were communicated or required to be communicated to the audit committee and that (1) relate to accounts or disclosures that are material to the financial statements and (2) involved our especially challenging, subjective, or complex judgments. The communication of critical audit matters does not alter in any way our opinion on the financial statements, taken as a whole, and we are not, by communicating the critical audit matters below, providing separate opinions on the critical audit matters or on the accounts or disclosures to which they relate.
Goodwill and Other Intangible Assets - Kate Spade - Refer to Notes 3 and 15 to the financial statements
Critical Audit Matter Description
The Company’s evaluation of goodwill and indefinite-lived brand intangible assets for impairment involves the comparison of carrying value to their respective fair values. The determination of the fair values requires management to make significant estimates and assumptions related to forecasts of future revenue growth rates and profit margins, as well as discount rates. Changes in these assumptions could have a significant impact on either the fair values, the amount of any impairment ch
Showing the first 8K of 227K characters. Open the full section