 filings.tools
Tractor Supply (TSCO) 10-K risk factor changes: FY2016 vs FY2015
The 2016-12-31 10-K against the 2015-12-26 one, compared heading by heading and sentence by sentence. One of these filings carries no fiscal year tag, so its year is the calendar year of the period end.
Item 1A30 rewritten21 added8 removed135 unchanged
All filing items703 rewritten578 added239 removed1,305 unchanged
Summary
counted, not written
- Item 1A headings could not be compared: only 0 carried over between the two years, which usually means one filing was read wrongly, so none is reported as new or removed.
- Sentence by sentence, 578 added, 239 removed, 703 rewritten and 1,305 unchanged across 18 items that differ.
Sentences by item
21 items, with every count and a link to each item that changed
Underlined words on a shaded ground are new in FY2016; struck-through words were in FY2015. Sentences that are wholly new or wholly gone are labelled rather than marked.
Item 1A. Risk Factors
30 rewritten, 21 added, 8 removed, 135 unchanged
A general reduction in the level of discretionary spending, shifts in consumer discretionary spending to our competitors or shifts in discretionary spending to less profitable products sold by [added: us could result in lower net sales, slower inventory turnover, greater markdowns on inventory, and a reduction in profitability due to lower margins.]
Failure to comply or accusation of failure to comply with ethical, social, product, [removed: labor] [added: labor, data privacy,] and environmental standards could also jeopardize our reputation and potentially lead to various adverse consumer actions.
Various factors affect comparable store sales, including the general retail sales environment, our ability to efficiently source and distribute products, changes in our merchandise assortment, competition, proximity of our locations to one another or to the locations of other retailers, [added: increased presence of online retailers,] current economic conditions, customer satisfaction with our products, the timing of promotional events, the release of new merchandise, the success of marketing programs and weather conditions.
Past comparable store sales are not [removed: necessarily] an indication of future results, and there can be no assurance that our comparable store sales will not decrease in the future.
In addition, extreme weather conditions, including snow and ice storms, flood and wind damage, hurricanes, tornadoes, extreme rain and droughts, have impacted operating [removed: results both negatively and positively, depending on the severity and length of these conditions.][added: results.]
Our merchandising [removed: initiatives] and marketing [removed: emphasis] [added: initiatives] may not provide expected results.
If we misjudge the market or our marketing programs are not successful, we may overstock unpopular products and be forced to take inventory price reductions that have a material adverse [removed: influence] [added: effect] on our profitability.
Capital required for growth may not be [removed: available.][added: available]
[added: Our access to funds under our senior credit facility] (as discussed in Note [removed: 3] [added: 5] to the Consolidated Financial Statements) is dependent on the ability of the banks that are parties to the facility to meet their funding commitments.
In addition, tight lending practices may make it difficult for our real estate developers to obtain financing under acceptable [removed: loan terms and conditions.]
New stores build their sales volumes and refine their merchandise selection over time and, as a result, generally have lower gross margins and higher operating expenses as a percentage of [added: net] sales than our more mature stores.
The success of an acquisition is based on our ability to make accurate assumptions regarding the valuation, operations, growth potential, integration and other factors relating to the [removed: respective] [added: target] business.
These competitors include general merchandise retailers, home center retailers, [removed: other] specialty [removed: retailers, internet] [added: and discount] retailers, independently owned [added: retail] farm and ranch stores, [added: numerous privately-held] regional farm store chains and farm [removed: cooperatives.][added: cooperatives, as well as internet-based retailers.]
We have agreements with our vendors in which the vendors agree to comply with applicable laws, including labor and environmental laws, and to indemnify us against [added: certain liabilities and costs.]
As an importer, our business is subject to the risks generally associated with doing business internationally, such as [added: domestic and] foreign governmental regulations, economic disruptions, delays in shipments, transportation capacity and costs, currency exchange rates and changes in political or economic conditions in countries from which we purchase products.
We maintain general liability and [removed: workers] [added: workers’] compensation insurance with a self-insured retention for each policy type and a deductible for each occurrence.
An internal control system, no matter how well designed and operated, can provide only reasonable, not absolute, assurance that [removed: the objectives of the control system are met.]
[added: Any failure to maintain an] effective system of internal control over financial reporting could limit our ability to report our financial results accurately and timely or to detect and prevent fraud, and could expose us to litigation or adversely affect the market price of our common stock.
We receive certain personal [added: and other confidential] information about our customers, employees and vendors.
In addition, our online operations at TractorSupply.com depend upon the secure transmission of confidential information over public networks, [added: including information permitting cashless payments.]
While we maintain substantial security measures to protect and to prevent unauthorized access to such information, it is possible that unauthorized parties (through cyberattacks, which are rapidly evolving and becoming increasingly sophisticated, or by other means) might compromise our security measures and obtain [added: and misuse] the personal information of customers, employees and vendors that we hold or other confidential Company data.
Such an occurrence could [added: materially] adversely affect our reputation with our customers, employees, and vendors, as well as our operations, results of operations, financial condition and liquidity, and could result in significant legal and financial exposure beyond the scope or limits of insurance coverage.
[removed: Any disruption, unanticipated expense or operational] failure related to this process could affect store operations negatively.
For example, unexpected delivery delays (including delays due to weather, fuel shortages or other reasons) or increases in transportation costs (including increased fuel costs or a decrease in transportation capacity for overseas shipments) could significantly decrease our ability to provide adequate product for sale, [added: resulting in lower sales and profitability.]
In addition, distribution-related construction or expansion projects entail risks which could cause delays and cost overruns, such as: shortages of materials; shortages of skilled labor or work stoppages; unforeseen construction, scheduling, [added: engineering, environmental or geological problems; weather interference; fires or other casualty losses; and unanticipated cost increases.]
Furthermore, although our Board of Directors has authorized a share repurchase program of [removed: $2] [added: up to $3] billion through December [removed: 2017,] [added: 2020,] we may discontinue this program at any time.
We are also subject to the Foreign Corrupt Practices Act (the “FCPA”), which prohibits [removed: U.S.] [added: United States] companies and their intermediaries from making improper payments to foreign officials for the purposes of obtaining or retaining business, and the anti-bribery laws of other jurisdictions.
[removed: Failure to comply with the FCPA and similar laws could subject us to, among other things,] penalties and legal expenses that could harm our reputation and have a material adverse effect on our business, financial condition and results of operations.
[removed: Our] [added: Additionally, our] future effective tax rates could be adversely affected by the earnings mix being lower than historical results in states where we have lower statutory rates and higher than historical results in states where we have higher statutory [removed: rates,] [added: rates or] by changes in the measurement of our deferred tax assets and [removed: liabilities, or by changes in tax laws or interpretations thereof.][added: liabilities.]
[removed: In addition, we] [added: We] are subject to periodic audits and examinations by the Internal Revenue Service [removed: (“IRS”)] [added: (“IRS”),] as well as state and local taxing authorities.
[Index](#s280A637900D555ED970FF69A42C39D1F)
While extreme weather conditions can positively impact our operating results by increasing demand in affected locations for products needed to cope with the weather condition and its effects, they can also negatively affect our business depending on the severity and length of these conditions as a result of store closings or the inability of customers to shop at our stores due to weather conditions.
[Index](#s280A637900D555ED970FF69A42C39D1F)
loan terms and conditions.
[Index](#s280A637900D555ED970FF69A42C39D1F)
The results of the November 2016 elections in the United States have introduced greater uncertainty with respect to tax and trade policies, tariffs and regulations affecting trade between the United States and other countries.
We source a significant portion of our merchandise from manufacturers located outside the United States, primarily in Asia and Central America.
Major developments in tax policy or trade relations, such as the disallowance of tax deductions for imported merchandise or the imposition of tariffs on imported products, could have a material adverse effect on our business, results of operations and liquidity.
[Index](#s280A637900D555ED970FF69A42C39D1F)
the objectives of the control system are met.
It is possible that such a compromise could go undetected by us.
Any disruption, unanticipated expense or operational
[Index](#s280A637900D555ED970FF69A42C39D1F)
Failure to comply with the FCPA and similar laws could subject us to, among other things,
[Index](#s280A637900D555ED970FF69A42C39D1F)
Potential noncompliance with environmental regulations could materially impact our results of operations or financial condition.
Our business is subject to various federal, state and local laws, regulations and other requirements pertaining to protection of the environment and public health, including, for example, regulations governing the management of waste materials and waste waters.
Governmental agencies on the federal, state and local levels have, in recent years, increasingly focused on the retail sector’s compliance with such laws and regulations, and have at times pursued enforcement activities.
We periodically receive information requests and notices of potential noncompliance with environmental laws and regulations from governmental agencies, which are addressed on a case-by-case basis with the relevant agency.
Any of these events could have a material adverse effect on our results of operations or financial condition.
Our future effective tax rates could be adversely affected by legislative tax reform, changes in statutory rates or changes in tax laws, or interpretations thereof.
[Index](#sFE311CB6ABB9555D9B4B73BA146651C6)
us, could result in lower net sales, slower inventory turnover, greater markdowns on inventory, and a reduction in profitability due to lower margins.
Our access to funds under our credit facility
certain liabilities and costs.
Any failure to maintain an
including information permitting cashless payments.
resulting in lower sales and profitability.
engineering, environmental or geological problems; weather interference; fires or other casualty losses; and unanticipated cost increases.
Item 7. Management’s Discussion and Analysis of Financial Condition and Results of Operations
148 rewritten, 168 added, 64 removed, 216 unchanged
The following discussion and analysis is intended to provide the reader with information that will assist in understanding the significant factors affecting our consolidated operating results, financial condition, liquidity and capital resources during the three-year period ended December [removed: 26, 2015] [added: 31, 2016] (our fiscal years [removed: 2015, 2014] [added: 2016, 2015] and [removed: 2013).][added: 2014).]
[added: Founded in 1938,] Tractor Supply Company is the largest operator of rural lifestyle retail stores in the United States.
As of December [removed: 26, 2015,] [added: 31, 2016,] we operated [removed: 1,488] [added: 1,738] retail stores in 49 states under the names Tractor Supply Company, Del’s Feed & Farm Supply and [removed: HomeTown Pet.][added: Petsense.]
Our current and long-term growth strategy is to: (1) expand domestic geographic market presence through opening new retail stores, (2) enhance financial performance through comparable store sales growth achieved through targeted merchandising and marketing programs with an “everyday value price” philosophy supported by strong customer service, (3) enhance product margin through strategic product sourcing, inventory and markdown management, a strong exclusive brand offering, and optimization of product pricing and transportation costs, (4) leverage operating costs by focusing on opportunities for continuous improvement and elimination of waste in all of our processes, (5) expand market opportunities via omni-channel enhancements, tying together our website product content, social [removed: media] [added: media, digital] and online shopping experience, and (6) expand through selective acquisitions, as such opportunities arise, to [added: add complementary businesses and to] enhance penetration into new and existing markets to [removed: complement] [added: supplement] organic growth.
Over the past five [removed: years] [added: years,] we have experienced considerable growth in stores, growing from [removed: 1,001] [added: 1,085] stores at the end of [removed: 2010] [added: 2011] to [removed: 1,488] [added: 1,738] stores [added: (1,595 Tractor Supply and Del’s retail stores and 143 Petsense retail stores)] at the end of fiscal [removed: 2015,] [added: 2016,] and in sales, with a compounded annual growth rate of approximately [removed: 11.3%.][added: 9.9%.]
We have developed a proven method for selecting store sites and have identified approximately [removed: 1,000] [added: 900] additional opportunities for new Tractor Supply stores.
[removed: We] [added: In 2016, we] opened [removed: 114] [added: 113] new [added: Tractor Supply] stores in [removed: 2015] [added: 37 states] and [removed: 107] [added: began operating 143 Petsense stores in 26 states, as compared to 114] new [added: Tractor Supply] stores in [removed: 2014,] [added: 2015, resulting in] a selling square footage increase of approximately [removed: 8.0%] [added: 10.8%] in fiscal [removed: 2015] [added: 2016] and approximately [removed: 8.3%] [added: 8.0%] in fiscal [removed: 2014.][added: 2015.]
Net sales increased [removed: 9.0%] [added: 8.9%] to [removed: $6.23] [added: $6.78] billion in fiscal [removed: 2015] [added: 2016] from [removed: $5.71] [added: $6.23] billion in fiscal [removed: 2014.][added: 2015.]
Comparable store sales increased [removed: 3.1%] [added: 1.6%] in fiscal [removed: 2015] [added: 2016] versus a [removed: 3.8%] [added: 3.1%] increase in fiscal [removed: 2014.][added: 2015.]
Gross profit increased [removed: 9.9%] [added: 8.5%] to [removed: $2.14] [added: $2.33] billion in fiscal [removed: 2015] [added: 2016] from [removed: $1.95] [added: $2.14] billion in fiscal [removed: 2014,] [added: 2015,] and gross margin [removed: increased 30] [added: decreased 10] basis points to [removed: 34.4%] [added: 34.3%] of [added: net] sales in fiscal [removed: 2015] [added: 2016] from [removed: 34.1%] [added: 34.4%] of [added: net] sales in fiscal [removed: 2014.][added: 2015.]
Operating income [removed: increased 10] [added: decreased 20] basis points to [removed: 10.4%] [added: 10.2%] of net sales in fiscal [removed: 2015] [added: 2016] from [removed: 10.3%] [added: 10.4%] of net sales in fiscal [removed: 2014.][added: 2015.]
In fiscal [removed: 2015,] [added: 2016,] diluted earnings per share grew [removed: 12.8%,] [added: 9.0%] to [removed: $3.00] [added: $3.27] compared to [removed: $2.66] [added: $3.00] in fiscal [removed: 2014.][added: 2015.]
We ended the year with [removed: $63.8] [added: $53.9] million in cash and outstanding debt of [removed: $150.0] [added: $275.0] million, after returning [removed: $395.8] [added: $454.0] million to our stockholders through stock repurchases and dividends.
| We identify potentially excess and slow-moving inventory by evaluating turn rates, historical and expected future sales trends, age of merchandise, overall inventory levels, current cost of inventory and other benchmarks. We have established an inventory valuation reserve to recognize the estimated impairment in value (i.e., an inability to realize the full carrying value) based on our aggregate assessment of these valuation indicators under prevailing market conditions and current merchandising strategies. | | We do not believe our merchandise inventories are subject to significant risk of obsolescence in the near term. However, changes in market conditions or consumer purchasing patterns could result in the need for additional reserves. Our impairment reserve contains uncertainties because the calculation requires management to make assumptions and to apply judgment regarding forecasted customer demand and the promotional environment. | | We have not made any material changes in the accounting methodology used to recognize inventory impairment reserves in the financial periods presented. We do not believe there is a reasonable likelihood that there will be a material change in the future estimates or assumptions we use to calculate impairment. However, if assumptions regarding consumer demand or clearance potential for certain products are inaccurate, we may be exposed to losses or gains that could be material. A 10% change in our impairment reserve as of December [removed: 26, 2015,] [added: 31, 2016,] would have affected net income by approximately [removed: $0.4] [added: $0.5] million in fiscal [removed: 2015.] [added: 2016.] |
| We perform physical inventories at [removed: each store at] least once a [removed: year,] [added: year for each store that has been open more than 12 months,] and we have established a reserve for estimating inventory shrinkage between physical inventory counts. The reserve is established by assessing the chain-wide average shrinkage experience rate, applied to the related periods’ sales volumes. Such assessments are updated on a regular basis for the most recent individual store experiences. | | The estimated store inventory shrink rate is based on historical experience. We believe historical rates are a reasonably accurate reflection of future trends. Our shrinkage reserve contains uncertainties because the calculation requires management to make assumptions and to apply judgment regarding future shrinkage trends, the effect of loss prevention measures and new merchandising strategies. | | We have not made any material changes in the accounting methodology used to recognize shrinkage in the financial periods presented. We do not believe there is a reasonable likelihood that there will be a material change in the future estimates or assumptions we use to calculate our shrinkage reserve. However, if our estimates regarding inventory losses are inaccurate, we may be exposed to losses or gains that could be material. A 10% change in our shrinkage reserve as of December [removed: 26, 2015,] [added: 31, 2016,] would have affected net income by approximately [removed: $1.2] [added: $1.4] million in fiscal [removed: 2015.] [added: 2016.] |
| We receive funding from substantially all of our significant merchandise vendors, in support of our business initiatives, through a variety of programs and arrangements, including vendor support funds (“vendor support”) and volume-based rebate funds (“volume rebates”). The amounts received are subject to terms of vendor agreements, most of which are “evergreen”, reflecting the on-going relationship with our significant merchandise vendors. Certain of our agreements, primarily volume rebates, are renegotiated annually, based on expected annual purchases of the vendor’s product. Vendor funding is initially deferred as a reduction of the purchase price of inventory and then recognized as a reduction of cost of merchandise as the related inventory is sold. During interim periods, the amount of [removed: vendor support] [added: volume rebates] is estimated based upon initial commitments and anticipated purchase levels with applicable vendors. | | The estimated purchase volume (and related vendor funding) is based on our current knowledge of inventory levels, sales trends and expected customer demand, as well as planned new store openings and relocations. Although we believe we can reasonably estimate purchase volume and related volume rebates at interim periods, it is possible that actual year-end results could be different from previously estimated amounts. Our allocation methodology contains uncertainties because the calculation requires management to make assumptions and to apply judgment regarding customer demand, purchasing activity, target thresholds, vendor attrition and collectability. | | We have not made any material changes in the accounting methodology used to establish our vendor [removed: support] [added: funding] reserves in the financial periods presented. At the end of each fiscal year, a significant portion of the actual purchase activity is known. Thus, we do not believe there is a reasonable likelihood that there will be a material change in the amounts recorded as vendor [removed: support.] [added: funding.] We do not believe there is a significant collectability risk related to vendor [removed: support] [added: funding] amounts due [added: to] us at the end of fiscal [removed: 2015.] [added: 2016.] If a 10% reserve had been applied against our outstanding vendor [removed: support] [added: funding] due as of December [removed: 26, 2015,] [added: 31, 2016,] net income would have been affected by approximately [removed: $1.7] [added: $1.3] million in fiscal [removed: 2015.] [added: 2016.] Although it is unlikely that there will be any significant reduction in historical levels of vendor [removed: support,] [added: funding,] if such a reduction were to occur in future periods, the Company could experience a higher inventory balance and higher cost of sales. |
| We incur various types of transportation and delivery costs in connection with inventory purchases and distribution. Such costs are included as a component of the overall cost of inventories (on an aggregate basis) and recognized as a component of cost of merchandise sold as the related inventory is sold. | | We allocate freight as a component of total cost of sales without regard to inventory mix or unique freight burden of certain categories. This assumption has been consistently applied for all years presented. | | We have not made any material changes in the accounting methodology used to establish our capitalized freight balance or freight allocation in the financial periods presented. If a 10% increase or decrease had been applied against our current inventory capitalized freight balance as of December [removed: 26, 2015,] [added: 31, 2016,] net income would have been affected by approximately [removed: $6.6] [added: $6.9] million in fiscal [removed: 2015.] [added: 2016.] |
| We self-insure a significant portion of our employee medical insurance, workers’ compensation and general liability insurance plans. We have stop-loss insurance policies to protect from individual losses over specified dollar values. Provisions for losses related to our self-insured liabilities are based upon periodic independent actuarially determined estimates that consider a number of factors including historical claims experience, demographic factors and severity factors. | | The full extent of certain claims, especially workers’ compensation and general liability claims, may not become fully determined for several years. Our self-insured liabilities contain uncertainties because management is required to make assumptions and to apply judgment to estimate the ultimate cost to settle reported claims and claims incurred but not reported as of the balance sheet date based upon historical data and experience, including actuarial calculations. | | We have not made any material changes in the accounting methodology used to establish our self-insurance reserves in the financial periods presented. We do not believe there is a reasonable likelihood that there will be a material change in the assumptions we use to calculate insurance reserves. However, if we experience a significant increase in the number of claims or the cost associated with these claims, we may be exposed to losses that could be material. A 10% change in our self-insurance reserves as of December [removed: 26, 2015,] [added: 31, 2016,] would have affected net income by approximately [removed: $3.2] [added: $3.5] million in fiscal [removed: 2015.] [added: 2016.] |
| A portion of our sales are to tax-exempt customers, predominantly agricultural-based. We obtain exemption information as a necessary part of each tax-exempt transaction. Many of the states in which we conduct business will perform audits to verify our compliance with applicable sales tax laws. The business activities of our customers and the intended use of the unique products sold by us create a challenging and complex compliance environment. These circumstances also create some risk that we could be challenged as to the accuracy of our sales tax compliance. When establishing our sales tax audit reserve, we review our past audit experience and assessments with applicable states to continually determine if we have potential exposure for non-compliance. Any estimated liability is based on an initial assessment of compliance risk as well as our historical experience with each respective state. | | We continually reassess the exposure based on historical audit results, changes in policies, preliminary and final assessments made by state sales tax auditors, and additional documentation that may be provided to reduce the assessment. Our sales tax audit reserve contains uncertainties because management is required to make assumptions and to apply judgment regarding the complexity of agricultural-based exemptions, the ambiguity in state tax regulations, the number of ongoing audits and the length of time required to settle with the state taxing authorities. | | We have not made any material changes to our sales tax audit assessment methodology in the financial periods presented. We do not believe there is a reasonable likelihood that there will be a material change in the future estimates or assumptions we use to calculate the sales tax liability reserve. However, if our estimates regarding the ultimate sales tax liability are inaccurate, we may be exposed to losses or gains that could be material. A 10% change in our sales tax audit reserve as of December [removed: 26, 2015,] [added: 31, 2016,] would have affected net income by approximately [removed: $0.8] [added: $0.7] million in fiscal [removed: 2015.] [added: 2016.] |
| Our income tax returns are periodically audited by [removed: U.S.] [added: United States] federal and state tax authorities. These audits include questions regarding our tax filing positions, including the timing and amount of deductions and the allocation of income among various tax jurisdictions. At any time, multiple tax years are subject to audit by the various tax authorities. In evaluating the exposures associated with our various tax filing positions, we record a liability for uncertain tax positions taken or expected to be taken in a tax return. A number of years may elapse before a particular matter, for which we have established a reserve, is audited and fully resolved or clarified. We recognize the effect of income tax positions only if those positions are more likely than not of being sustained. Recognized income tax positions are measured at the largest amount that is greater than 50% likely of being realized. Changes in recognition or measurement are reflected in the period in which the change in judgment occurs. We adjust our tax contingencies reserve and income tax provision in the period in which actual results of a settlement with tax authorities differs from our established reserve, the statute of limitations expires for the relevant tax authority to examine the tax position or when more information becomes available. | | Our tax contingencies reserve contains uncertainties because management is required to make assumptions and to apply judgment to estimate the exposures associated with our various filing positions and whether or not the minimum requirements for recognition of tax benefits have been met. | | We have not made any material changes in the accounting methodology used to establish our tax contingencies in the financial periods presented. We do not believe there is a reasonable likelihood that there will be a material change in the reserves established for tax benefits not recognized. Although management believes that the judgments and estimates discussed herein are reasonable, actual results could differ, and we may be exposed to losses or gains that could be material. To the extent we prevail in matters for which reserves have been established, or are required to pay amounts in excess of our reserves, our effective income tax rate in a given financial statement period could be materially affected. An unfavorable tax settlement would require use of our cash and would result in an increase in our effective income tax rate in the period of resolution. A favorable tax settlement would be recognized as a reduction in our effective income tax rate in the period of resolution. A 10% change in our uncertain tax position reserve as of December [removed: 26, 2015] [added: 31, 2016] would have affected net income by approximately [removed: $0.2] [added: $0.1] million in fiscal [removed: 2015.] [added: 2016.] |
| Long-lived assets [removed: other than goodwill and indefinite-lived intangible assets, which] are [removed: separately tested for impairment, are] evaluated for impairment whenever events or changes in circumstances indicate that the carrying value may not be recoverable. When evaluating long-lived assets for potential impairment, we first compare the carrying value of the asset to the asset’s estimated future cash flows (undiscounted and without interest charges). The evaluation for long-lived assets is performed at the lowest level of identifiable cash flows, which is generally the individual store level. The significant assumptions used to determine estimated undiscounted cash flows include cash inflows and outflows directly resulting from the use of those assets in operations, including margin on net sales, payroll and related items, occupancy costs, insurance allocations and other costs to operate a store. If the estimated future cash flows are less than the carrying value of the asset, we calculate an impairment loss. The impairment loss calculation compares the carrying value of the asset to the asset’s estimated fair value, which may be based on an estimated future cash flow model. We recognize an impairment loss if the amount of the asset’s carrying value exceeds the asset’s estimated fair value. If we recognize an impairment loss, the adjusted carrying amount of the asset becomes its new cost basis. For a depreciable long-lived asset, the new cost basis will be depreciated (amortized) over the remaining estimated useful life of that asset. | | Our impairment loss calculations contain uncertainties because they require management to make assumptions and to apply judgment to estimate future cash flows and asset fair values, including forecasting useful lives of the assets and selecting the discount rate that reflects the risk inherent in future cash flows. | | We have not made any material changes in our impairment loss assessment methodology in the financial periods presented. We do not believe there is a reasonable likelihood that there will be a material change in the estimates or assumptions we use to calculate long-lived asset impairment losses. None of these estimates and assumptions are significantly sensitive, and a 10% change in any of these estimates would not have a material impact on our analysis. However, if actual results are not consistent with our estimates and assumptions used in estimating future cash flows and asset fair values, we may be exposed to losses that could be material. |
Our unaudited quarterly operating results for each fiscal quarter of [removed: 2015] [added: 2016] and [removed: 2014] [added: 2015] are shown below (in thousands, except per share amounts):
| [removed: 2015] | | First Quarter | | | | Second Quarter | | | | Third Quarter | | | | Fourth Quarter | | | | Total | | |
| Comparable store sales increase (decrease) [removed: (a)] [added: (b)] | | 5.7 | | % | | 5.6 | | % | | 2.9 | | % | | (1.4 | | )% | | 3.1 | | % |
| [removed: 2014] | | First Quarter | | | | Second Quarter | | | | Third Quarter | | | | Fourth Quarter | | | | Total | | |
[removed: (a)] [added: (b)] Comparable store metrics are calculated using sales generated from all stores open at least one year and all online sales, excluding certain adjustments to net sales.
[removed: Beginning in fiscal 2015, stores] [added: Stores] closed during the year are removed from our comparable store metrics calculations.
| | [removed: 2015] [added: 2016] | | | [removed: 2014] [added: 2015] | | | [removed: 2013] [added: 2014] | |
| Cost of merchandise sold (a) | [removed: 65.6] [added: 65.7] | | | [removed: 65.9] [added: 65.6] | | | [removed: 66.0] [added: 65.9] | |
| Gross margin (a) | [removed: 34.4] [added: 34.3] | | | [removed: 34.1] [added: 34.4] | | | [removed: 34.0] [added: 34.1] | |
| Selling, general and administrative expenses(a) | 22.0 | | | [removed: 21.8] [added: 22.0] | | | [removed: 22.1] [added: 21.8] | |
| Depreciation and amortization | [removed: 2.0] [added: 2.1] | | | 2.0 | | | [removed: 1.9] [added: 2.0] | |
| Income before income taxes | [removed: 10.4] [added: 10.1] | | | [removed: 10.3] [added: 10.4] | | | [removed: 10.0] [added: 10.3] | |
| Income tax provision | [removed: 3.8] [added: 3.7] | | | 3.8 | | | [removed: 3.6] [added: 3.8] | |
| Net income | [removed: 6.6] [added: 6.4] | % | | [removed: 6.5] [added: 6.6] | % | | [removed: 6.4] [added: 6.5] | % |
(a) Our gross margin amounts may not be comparable to those of other retailers since some retailers include all of the costs related to their distribution network in cost of merchandise sold and others (like our Company) exclude a portion of these distribution network costs from gross margin and instead include them in selling, general and administrative [removed: (“SG&A”)] expenses; refer to Note 1 – Significant Accounting Policies, of the Notes to Consolidated Financial Statements, included in Item 8 Financial Statements and Supplementary Data, of this Annual Report on Form 10-K.
The comparable store transaction count increased 3.3%, while comparable store average ticket decreased [removed: (0.2)%] [added: 0.2%] for fiscal 2015.
The comparable store sales increase was driven by an increase in traffic counts and the year-round strength of consumable, usable, [added: and] edible ("C.U.E.") products, principally animal- and pet-related merchandise.
The following chart indicates the percentage of [added: net] sales represented by each of our major product categories during fiscal 2015 and 2014:
| | Percent of [added: Net] Sales | | | | |
We also operate websites under the names TractorSupply.com and Petsense.com.
We also believe that there is opportunity for up to 1,000 Petsense stores.
[Index](#s280A637900D555ED970FF69A42C39D1F)
[Index](#s280A637900D555ED970FF69A42C39D1F)
[Index](#s280A637900D555ED970FF69A42C39D1F)
[Index](#s280A637900D555ED970FF69A42C39D1F)
[Index](#s280A637900D555ED970FF69A42C39D1F)
[Index](#s280A637900D555ED970FF69A42C39D1F)
| | | | | |
| --- | --- | --- | --- | --- |
| | | | | |
| Description | | Judgments and Uncertainties | | Effect if Actual Results Differ From Assumptions |
| Impairment of Goodwill and Other Indefinite-Lived Intangible Assets: | | | | |
| Goodwill and other indefinite-lived intangible assets are evaluated for impairment annually, or whenever events or changes in circumstances indicate that the carrying value may not be recoverable. In accordance with the accounting standards, an entity has the option first to assess qualitative factors to determine whether events and circumstances indicate that it is more likely than not that goodwill or an indefinite-lived intangible asset is impaired. If after such assessment an entity concludes that the asset is not impaired, then the entity is not required to take further action. However, if an entity concludes otherwise, then it is required to determine the fair value of the asset using a quantitative impairment test, and if impaired, the associated assets must be written down to fair value. The quantitative test for goodwill impairment is a two-step process. The first step of the goodwill impairment test, used to identify the potential for impairment, compares the fair value of a reporting unit with the carrying value of its net assets, including goodwill. If the fair value of the reporting unit is less than the carrying value of the reporting unit, the second step of the goodwill impairment test is performed to measure the amount of impairment loss to be recorded, if any. The second step, if required, would compare the implied fair value of goodwill with the current carrying amount of goodwill. If the implied fair value of goodwill is less than the carrying value, an impairment charge would be recorded to the Company’s operations. We determine fair values for each reporting unit using the market approach, when available and appropriate, or the income approach, or a combination of both. If multiple valuation methodologies are used, the results are weighted appropriately. The quantitative impairment test for other indefinite-lived intangible assets involves comparing the carrying amount of the asset to the sum of the discounted cash flows expected to be generated by the asset. If the implied fair value of the indefinite-lived intangible asset is less than the carrying value, an impairment charge would be recorded to the Company’s operations. | | Our impairment loss calculation contains uncertainties because they require management to make assumptions and to apply judgment to qualitative factors as well as estimate future cash flows and asset fair values, including forecasting prospective financial information and selecting the discount rate that reflects the risk inherent in future cash flows. | | We do not believe there is a reasonable likelihood that there will be a material change in the estimates or assumptions we use to calculate indefinite-lived asset impairment losses. None of these estimates and assumptions are significantly sensitive, and a 10% change in any of these estimates would not have a material impact on our analysis. However, if actual results are not consistent with our estimates and assumptions used in estimating future cash flows and asset fair values, we may be exposed to losses that could be material. |
[Index](#s280A637900D555ED970FF69A42C39D1F)
| 2016 (a) | | (13 weeks) | | | | (13 weeks) | | | | (13 weeks) | | | | (14 weeks) | | | | (53 weeks) | | |
| Net sales | | $ | 1,467,797 | | | $ | 1,852,534 | | | $ | 1,542,706 | | | $ | 1,916,542 | | | $ | 6,779,579 | |
| Gross profit | | 494,444 | | | | 649,222 | | | | 535,274 | | | | 646,262 | | | | 2,325,202 | | |
| Operating income | | 108,195 | | | | 249,249 | | | | 142,020 | | | | 194,616 | | | | 694,080 | | |
| Net income | | 67,668 | | | | 156,425 | | | | 89,444 | | | | 123,583 | | | | 437,120 | | |
| Basic | | $ | 0.51 | | | $ | 1.17 | | | $ | 0.67 | | | $ | 0.94 | | | $ | 3.29 | |
| Diluted | | $ | 0.50 | | | $ | 1.16 | | | $ | 0.67 | | | $ | 0.94 | | | $ | 3.27 | |
| Comparable store sales increase (decrease) (b) | | 4.9 | | % | | (0.5 | | )% | | (0.6 | | )% | | 3.1 | | % | | 1.6 | | % |
| 2015 | | (13 weeks) | | | | (13 weeks) | | | | (13 weeks) | | | | (13 weeks) | | | | (52 weeks) | | |
(a) Beginning in the fourth quarter ended December 31, 2016, selected financial and operating information includes the consolidation of Petsense, unless otherwise noted.
Closed stores are removed from our comparable store metrics calculations.
Petsense stores are not considered comparable stores until 12 months after the date of acquisition.
| Operating income | 10.2 | | | 10.4 | | | 10.3 | |
| Interest expense, net | 0.1 | | | — | | | — | |
[Index](#s280A637900D555ED970FF69A42C39D1F)
Fiscal 2016 Compared to Fiscal 2015
Net sales increased 8.9% to $6.78 billion in fiscal 2016 from $6.23 billion in fiscal 2015.
The fourth quarter included an extra sales week as a part of the Company’s 53-week calendar in 2016, which represented 1.6% of the overall 8.9% sales increase over prior year.
Petsense stores are not considered comparable stores until 12 months after the date of acquisition.
Livestock equipment and hardline products such as fencing and trailers also performed well throughout the year.
The full year sales performance was negatively impacted by unpredictable weather patterns during the spring selling season and unseasonably warm weather in the key cold months of the year which drove softness in cold weather seasonal categories and big ticket items such as log splitters and stoves.
Additionally, the Company believes that economic conditions in the energy producing markets negatively impacted consumer spending primarily in the Midwest and South Central regions.
| Tractor Supply | 2016 | | | 2015 | |
| New stores opened | 113 | | | 114 | |
| Petsense | | | | | |
We also operate a website under the name TractorSupply.com.
During 2015, we opened stores in 33 states and completed construction of a new distribution center in Casa Grande, Arizona to support our continued expansion into the western states.
Also in 2015, we completed construction of two smaller cross-dock facilities (“mixing centers”) in Texas to improve distribution of certain high-volume bulk products.
[Index](#sFE311CB6ABB9555D9B4B73BA146651C6)
| Net sales | | $ | 1,183,680 | | | $ | 1,583,831 | | | $ | 1,359,950 | | | $ | 1,584,254 | | | $ | 5,711,715 | |
| Gross profit | | 396,219 | | | | 550,532 | | | | 464,069 | | | | 539,595 | | | | 1,950,415 | | |
| Operating income | | 78,729 | | | | 211,029 | | | | 122,013 | | | | 177,701 | | | | 589,472 | | |
| Net income | | 48,809 | | | | 133,411 | | | | 76,603 | | | | 112,062 | | | | 370,885 | | |
| Basic | | $ | 0.35 | | | $ | 0.96 | | | $ | 0.56 | | | $ | 0.82 | | | $ | 2.69 | |
| Diluted | | $ | 0.35 | | | $ | 0.95 | | | $ | 0.55 | | | $ | 0.81 | | | $ | 2.66 | |
| Comparable store sales increase (a) | | 2.2 | | % | | 1.9 | | % | | 5.6 | | % | | 5.3 | | % | | 3.8 | | % |
This change in the calculation methodology did not have a material impact on the comparable store metrics reported in prior periods presented due to the minimal number of stores closed in those periods.
costs at the stores and incremental costs associated with our two new mixing centers and our new distribution facility in Casa Grande, Arizona.
Fiscal 2014 Compared to Fiscal 2013
Net sales increased 10.6% to $5.71 billion in fiscal 2014 from $5.16 billion in fiscal 2013.
This was a result of continued investment in C.U.E. inventory, expanded product assortments and improved localized product offerings.
Seasonal merchandise, predominantly heating and outdoor power equipment, performed well during the year.
We also estimate that comparable store sales were unfavorably impacted by approximately 85 basis points due to deflation, principally in livestock feed and bird feeding products.
| | 2014 | | | 2013 | |
(a) Includes the Company’s two HomeTown Pet stores opened in fiscal 2014.
| Product Category: | 2014 | | | 2013 | |
Gross profit increased 11.2% to $1.95 billion in fiscal 2014 compared to $1.75 billion in fiscal 2013.
This improvement in gross margin reflects improved direct product margin partially offset by higher transportation costs, primarily due to our continued western store expansion.
Direct product margin increased as a result of continued focus on our four strategic margin initiatives which include inventory and markdown management, strategic sourcing, exclusive branding and retail price management.
The SG&A improvement as a percent of sales was primarily attributable to the leverage of comparable store sales growth and lower year-over-year incentive compensation expense.
Our effective tax rate increased to 36.9% for fiscal 2014 compared to 36.2% in fiscal 2013 as the prior year was favorably impacted by the reversal of various reserves for uncertain tax positions.
| Inventories | 1,284.4 | | | | 1,115.5 | | | | 168.9 | | |
| Deferred income taxes | 46.0 | | | | 41.0 | | | | 5.0 | | |
| Total current assets | 1,485.4 | | | | 1,274.0 | | | | 211.4 | | |
| Working capital | $ | 814.1 | | | $ | 670.9 | | | $ | 143.2 | |
The 2011 Senior Credit Facility was unsecured and would have matured on October 24, 2016.
As a result of the maturity date in the new agreement, the Company has presented any outstanding borrowings under the 2011 Senior Credit Facility as of December 26, 2015 as a non-current liability in the Consolidated Balance Sheet in accordance with the applicable accounting guidance.
There were no compensating balance requirements associated with the 2011 Senior Credit Facility.
The 2011 Senior Credit Facility required quarterly compliance with respect to two material covenants: a fixed charge coverage ratio and a leverage ratio.
The 2011 Senior Credit Facility also contained certain other restrictions regarding additional indebtedness, capital expenditures, business operations, guarantees, investments, mergers, consolidations and sales of assets, transactions with subsidiaries or affiliates, and liens.
Borrowings for both the term loan and the revolving credit facility bear interest at either the bank’s base rate or LIBOR plus an additional amount ranging from 0.500% to 1.125% per annum, adjusted quarterly based on our leverage ratio.
The Company is also required to pay, quarterly in arrears, a commitment fee for unused capacity ranging from 0.075% to 0.200% per annum, adjusted quarterly based on the Company’s leverage ratio.
Proceeds from the 2016 Senior Credit Facility are available to be used for working capital, capital expenditures, dividends, share repurchases, and other matters.
The fixed charge coverage ratio compares consolidated EBITDAR to the sum of interest paid and rental expense (excluding any straight-line rent adjustments).
The leverage ratio compares total debt plus rental expense (excluding any straight-line rent adjustments) multiplied by a factor of six to consolidated EBITDAR.
An excerpt. Shown here: 40 of 148 rewritten, 40 of 168 added and 40 of 64 removed. The counts are complete. For every sentence, read Item 7. Management’s Discussion and Analysis of Financial Condition and Results of Operations in the FY2016 filing and the FY2015 filing.
Item 7A. Quantitative and Qualitative Disclosures About Market Risk
4 rewritten, 5 added, 1 removed, 7 unchanged
We are exposed to interest rate changes, primarily as a result of [added: borrowings under] our [added: senior] credit [removed: facility] [added: facilities] (as discussed in Note [removed: 3] [added: 5] to the Consolidated Financial [removed: Statements)] [added: Statements),] which [removed: bears] [added: bear] interest based on variable rates.
[removed: A 1% change in interest rates on our variable rate debt would have] affected interest expense by approximately [removed: $1.1] [added: $1.5] million, [removed: $0.7] [added: $1.1] million, and [removed: $0.3] [added: $0.7] million in the fiscal years ended December [added: 31, 2016, December] 26, 2015, [added: and] December 27, 2014, [removed: and December 28, 2013.][added: respectively.]
On a prospective basis, a 1% change in interest rates on [removed: debt] [added: our variable rate debt, in excess of that amount covered by the interest rate swap,] existing as of December [removed: 26, 2015,] [added: 31, 2016,] would result in interest expense fluctuating approximately [removed: $1.5] [added: $0.9] million per year.
Our strategy is to reduce or mitigate the effects of purchase price [removed: volatility] [added: volatility,] principally by taking advantage of vendor incentive programs, economies of scale from increased volume of purchases, adjusting retail prices and selectively buying from the most competitive vendors without sacrificing quality.
As discussed in Note 6 to the Consolidated Financial Statements, we entered into an interest rate swap agreement effective March 31, 2016, which is intended to mitigate interest rate risk associated with future changes in interest rates for the term loan borrowings under the 2016 Senior Credit Facility.
As a result of this interest rate swap, our exposure to interest rate volatility is minimized beginning in the second fiscal quarter of 2016.
The interest rate swap agreement has been executed for risk management purposes and is not held for trading purposes.
A 1% change in interest rates on our variable rate debt in excess of that amount covered by the interest rate swap would have
[Index](#s280A637900D555ED970FF69A42C39D1F)
[Index](#sFE311CB6ABB9555D9B4B73BA146651C6)
Item 1. Business
69 rewritten, 24 added, 14 removed, 194 unchanged
We operate retail stores under the names Tractor Supply Company, Del’s Feed & Farm Supply and [removed: HomeTown Pet] [added: Petsense] and operate [removed: a website] [added: websites] under the [removed: name TractorSupply.com.][added: names TractorSupply.com and Petsense.com.]
At December [removed: 26, 2015,] [added: 31, 2016,] we operated [removed: 1,488 retail] [added: 143 Petsense] stores in [removed: 49] [added: 26] states.
Our Tractor Supply stores typically range in size from 15,000 to 20,000 square feet of inside selling [removed: space] [added: space,] along with additional outside selling [added: space and our Petsense stores have approximately 5,500 square feet of inside selling] space.
[removed: We] [added: For Tractor Supply retail locations, we] use a standard design for most new built-to-suit locations that includes approximately 15,500 square feet of inside selling space.
We believe our sales and earnings growth [removed: are] [added: is] the result of executing our business strategy, which includes the following key components:
We believe the ability of our store team members to provide friendly, responsive and seasoned advice helps our customers find the right products to satisfy their everyday needs [removed: in addition to] [added: as well as] the specialty items needed to complete their rural lifestyle projects.
In addition, these layouts allow for departmental space to be easily [removed: reallocated] [added: re-allocated] and visual displays to be changed for seasonal products and promotions.
Display and product placement information is [added: routinely] sent to stores [removed: weekly] to ensure quality and uniformity among the stores.
Informative signs are located [removed: throughout each store] [added: in key product categories] to assist customers with purchasing decisions and merchandise location.
Our store layouts and visual displays [removed: afford] [added: are designed to provide] our customers a feeling of familiarity and enhance the shopping experience.
Also, [removed: all of] our store team members wear highly visible red vests, aprons or smocks with nametags, and our customer service and checkout counters are conveniently [removed: located.][added: located near the front of the store.]
Our [removed: broad] product assortment [removed: and physical store size are] [added: is] tailored to meet the needs of our customers in various geographic markets.
No one product accounted for more than 10% of our sales during [removed: 2015.][added: 2016.]
[removed: We offer the following] [added: Our] comprehensive selection of [removed: merchandise:][added: merchandise is comprised of the following major product categories:]
The following chart indicates the percentage of [added: net] sales represented by each of our major product categories during fiscal [removed: 2015, 2014] [added: 2016, 2015] and [removed: 2013:][added: 2014:]
| | Percent of [added: Net] Sales | | | | | | | |
| Product Category: | [removed: 2015] [added: 2016] | | | [removed: 2014] [added: 2015] | | | [removed: 2013] [added: 2014] | |
| Livestock and Pet | [removed: 44] [added: 46] | % | | 44 | % | | [removed: 43] [added: 44] | % |
| Hardware, Tools, Truck and Towing | [removed: 23] [added: 22] | | | [removed: 22] [added: 23] | | | [removed: 23] [added: 22] | |
| Seasonal, Gift and Toy Products | [removed: 20] [added: 19] | | | 20 | | | 20 | |
| Clothing and Footwear | 8 | | | [removed: 9] [added: 8] | | | 9 | |
We are focused on providing key products that our customers use on a regular basis for their lifestyle and maintenance needs with emphasis on consumable, usable, [added: and] edible (“C.U.E.”) products.
Examples of [removed: C.U.E] [added: C.U.E.] product categories include, but are not limited to, livestock feed and bedding, pet food, lubricants, and various seasonal products, such as heating, pest control and twine.
We purchase our products from a group of approximately [removed: 800] [added: 850] vendors, with no one vendor representing more than 10% of our purchases during fiscal [removed: 2015.][added: 2016.]
Approximately 300 core vendors accounted for 90% of our [added: merchandise] purchases during fiscal [removed: 2015.][added: 2016.]
We also employ a dedicated inventory management team that focuses exclusively on [removed: all] forecasting and [removed: replenishment functions, and] [added: inventory replenishment,] a committed merchandise planning team that concentrates on assortment [removed: planning.][added: planning and a specialized pricing team that seeks to optimize market-specific pricing for our products.]
Our exclusive brands represented approximately [added: 32% of our total sales in fiscal 2016 and approximately] 31% of our total sales in fiscal [removed: 2015, 2014] [added: 2015] and [removed: 2013.][added: fiscal 2014.]
[removed: We currently operate a distribution network for supplying stores with merchandise, and in] [added: In] fiscal [removed: 2015] [added: 2016,] our [added: Tractor Supply] stores received approximately [removed: 70%] [added: 75%] of merchandise through this network while the remaining merchandise shipped directly to the stores from our vendors.
We believe this flow facilitates the prompt and efficient distribution of merchandise [removed: to our stores] in order to enhance in-stocks, minimize freight costs and improve the inventory turn rate.
Our distribution facilities, located in Arizona, Georgia, Indiana, Kentucky, Maryland, Nebraska, Texas, and [removed: Washington] [added: Washington,] represent total distribution capacity of 5.0 million square feet.
We manage our inbound and outbound transportation activity in-house through the use of a [removed: web-based] transportation management system.
We [removed: utilize several common carriers for store deliveries and] manage our transportation costs through carrier negotiations, the monitoring of transportation routes, and the scheduling of deliveries.
To drive store traffic and position ourselves as a destination store, we promote broad selections of merchandise with newspaper circulars, customer targeted direct mail and [removed: email and] [added: e-mail, as well as] digital [added: and social media] offerings.
We communicate with our customers across multiple touch points including our stores, e-commerce website (TractorSupply.com), [removed: email and] [added: e-mail, social media,] direct [removed: mail.][added: mail and our customer call center.]
Our goal is to be available [removed: when] [added: at any time] and [removed: how] [added: in any way] our customers choose to engage with our brand.
Connecting with consumers online provides the opportunity [removed: to allow] [added: for] customers to shop at a time and place that fits their schedule while delivering enhanced product information, research and decision tools that support product selection and informational needs in specific subject areas.
We believe [removed: this capability] [added: our e-commerce capabilities] further [removed: enhances] [added: enhance] customer service and [removed: extends] [added: extend] our market to areas where our retail stores are not currently located.
Additionally in [removed: 2015,] [added: 2016,] we continued to invest in our omni-channel platform [removed: and] [added: through] expanded capabilities related to fulfillment options, product information and site research.
We [removed: also introduced responsive web design that provided] [added: are focused on delivering] an enhanced mobile and tablet experience, [removed: improved] [added: improving] the site response time and [removed: added additional] [added: expanding our] product offerings for vendor direct to customer shipments.
[removed: We opened] [added: Our] two HomeTown Pet stores [added: were converted to Petsense stores] in fiscal [removed: 2014.][added: 2017.]
At December 31, 2016, we operated 1,738 retail stores in 49 states (1,595 Tractor Supply and Del’s retail stores and 143 Petsense retail stores).
[Index](#s280A637900D555ED970FF69A42C39D1F)
[Index](#s280A637900D555ED970FF69A42C39D1F)
We currently operate a distribution network for supplying stores with merchandise and delivering product ordered through TractorSupply.com.
In fiscal 2017, we plan to begin construction on a new northeast distribution
[Index](#s280A637900D555ED970FF69A42C39D1F)
center as well as an expansion of our existing distribution center in Waverly, Nebraska which will provide additional distribution capacity once construction is completed.
Our distribution centers utilize warehouse and labor management tools that support the planning, control and processing of inventory.
We utilize multiple common carriers for store and direct to customer deliveries.
In 2016, we also began offering in certain stores an option to buy online and pick up in store.
Petsense
On September 29, 2016, we acquired Petsense, a small-box pet specialty supply retailer focused on meeting the needs of pet owners, primarily in small and mid-sized communities, and offering a variety of pet products and services.
The Petsense name is registered with the USPTO.
[Index](#s280A637900D555ED970FF69A42C39D1F)
In fiscal 2016, we opened 113 new Tractor Supply stores and began operating 143 Petsense stores as compared to 114 new Tractor Supply stores in fiscal 2015.
This represents a selling square footage increase of approximately 10.8% during fiscal 2016 and 8.0% during fiscal 2015.
At December 31, 2016, we operated 1,738 retail stores in 49 states (1,595 Tractor Supply and Del’s retail stores and 143 Petsense retail stores).
We also believe that there is opportunity for up to 1,000 Petsense stores.
[Index](#s280A637900D555ED970FF69A42C39D1F)
market niche for customers living the rural lifestyle.
Sandfort has served as Chief Executive Officer since December 2012.
He served as President and Chief Executive Officer of the Company from December 2012 to May 2016.
Prior to that time, he served as Senior Vice President – Merchandising since February 2011.
[Index](#s280A637900D555ED970FF69A42C39D1F)
[Index](#sFE311CB6ABB9555D9B4B73BA146651C6)
| | |
| --- | --- |
In 2015, we completed construction of a new distribution center in Casa Grande, Arizona, with a capacity of approximately 650,000 square feet.
This facility, which began shipping merchandise to stores in December 2015, will support our western store expansion.
Also in 2015, we completed construction of two smaller cross-dock facilities (“mixing centers”) in Texas to handle certain high-volume bulk products.
We continue to improve the technology in our distribution facilities, and currently eight of our ten facilities utilize a warehouse management system that provides for improved movement of inventory.
We will continue to refine this system and expect that it will be implemented in additional locations.
HomeTown Pet
HomeTown Pet is a new pet supply store that provides high-quality products, knowledge and service to pet owners.
The stores offer products for a wide variety of pets and animals, including cats, dogs, birds, reptiles and fish, as well as grooming and vet services.
We are a ‘test-and-learn’ company, and we believe these stores will help us gain better insight into the pet and animal supply category and provide valuable information that can help us better understand the unique needs of our pet customers.
We opened 114 new stores in 2015 and 107 new stores in 2014, which represents selling square footage increases of approximately 8.0% during fiscal 2015 and 8.3% during fiscal 2014.
We compete with general
An excerpt. Shown here: 40 of 69 rewritten, all 24 added and all 14 removed. The counts are complete. For every sentence, read Item 1. Business in the FY2016 filing and the FY2015 filing.
Item 3. Legal Proceedings
2 rewritten, 5 added, 13 removed, 1 unchanged
The Company believes that any estimated loss related to such matters has been adequately provided [added: for] in accrued liabilities to the extent probable and reasonably estimable.
Accordingly, the Company currently expects these matters will be resolved without material adverse effect on its consolidated financial [removed: condition,] [added: position,] results of operations or cash flows.
Item 103 of SEC Regulation S-K requires disclosure of certain environmental legal proceedings if the proceeding reasonably involves potential monetary sanctions of $100,000 or more.
We periodically receive information requests and notices of potential noncompliance with environmental laws and regulations from governmental agencies, which are addressed on a case-by-case basis with the relevant agency.
The Company has received a subpoena from the District Attorney of Yolo County, California, requesting records and information regarding its hazardous waste management and disposal practices in California.
The Company is currently working with Yolo County and other district attorneys in California to resolve alleged instances of noncompliance with applicable regulations.
The matter is still ongoing and the ultimate outcome cannot be determined at this time; however, the Company does not expect the resolution of this matter to have a material adverse effect on its consolidated financial position, results of operations or cash flows.
The Company responded to a Request for Information from the United States Environmental Protection Agency (“EPA”) in the first quarter of fiscal 2009 relating to certain recreational vehicles and non-road spark ignition engines sold by the Company.
In the first quarter of fiscal 2011, the Environmental Enforcement Section of the Department of Justice (“DOJ”), on behalf of the EPA, informed the Company that it believed the Company had violated the Clean Air Act by importing or causing the importation of certain engines that were noncompliant.
The products at issue were purchased by the Company pursuant to agreements with vendors under which the vendors represented that their products complied with all the applicable laws and regulations and under which the vendors agreed to indemnify the Company for any liabilities or costs relating to, among other matters, the noncompliance or alleged noncompliance of their products.
The Company notified these vendors of the EPA’s position and worked with these vendors to provide additional information to the DOJ and EPA regarding the alleged violations.
As a result of this process, the Company and its vendors provided evidence that many of the products identified by the DOJ and EPA in early 2011 were, in fact, in compliance with the Clean Air Act and that most of the remaining issues related to products purchased from one vendor.
The vendor of these products and the Company engaged in settlement discussions with the DOJ and EPA that resulted in the settlement of the matter.
A consent decree reflecting the terms of the settlement was filed with the United States District Court in Washington, D.C. on September 30, 2015.
Under the settlement, the Company agreed to implement a formal compliance program for the small-engine products purchased by the Company for resale to its customers.
The Company also agreed to pay a civil penalty, most of which was reimbursed by the vendor who sold the small-engine products at issue to the Company.
In addition, the Company agreed to sponsor an emissions offset program that will result in the replacement of 22 older wood-burning stoves with EPA-certified wood-burning stoves.
The settlement was approved by the court on January 19, 2016.
The civil penalty did not differ materially from the amount accrued.
The cost of the settlement and the compliance and emission offset program will not have a material effect on our financial condition, results of operations or cash flows.
Cover and table of contents
28 rewritten, 7 added, 6 removed, 78 unchanged
10-K 1 [removed: a2015form10-k.htm] [added: a2016form10-k.htm] 10-K TRACTOR SUPPLY COMPANY
For the fiscal year ended December [removed: 26, 2015][added: 31, 2016]
[removed: ][added: ]
The aggregate market value of the Common Stock held by non-affiliates of the registrant, based on the closing price of the Common Stock on The NASDAQ Global Select Market on June [removed: 26, 2015,] [added: 25, 2016,] the last business day of the registrant’s most recently completed second fiscal quarter, was approximately [removed: $9.9] [added: $9.6] billion.
| Class | | Outstanding at January [removed: 23, 2016] [added: 28, 2017] |
| Common Stock, $.008 par value | | [removed: 133,740,424] [added: 130,725,876] |
Portions of the Registrant’s definitive Proxy Statement for its [removed: 2016] [added: 2017] Annual Meeting of Stockholders are incorporated by reference into Part III hereof.
| [Forward-Looking [removed: Statements](#s0FF4FF4EAE865B98A8DEB7010F0A7B68)] [added: Statements](#s206CDFEE8C3C5D009677AAD83C0EAF52)] | | [removed: [ii](#s0FF4FF4EAE865B98A8DEB7010F0A7B68)] [added: [ii](#s206CDFEE8C3C5D009677AAD83C0EAF52)] |
| [removed: [1A.](#sCED01FD37F865A1BB30105312BF588D5)] [added: [1A.](#s6FF79F234DBA50358A8F781EC26BA243)] | [Risk [removed: Factors](#sCED01FD37F865A1BB30105312BF588D5)] [added: Factors](#s6FF79F234DBA50358A8F781EC26BA243)] | [removed: [7](#sCED01FD37F865A1BB30105312BF588D5)] [added: [7](#s6FF79F234DBA50358A8F781EC26BA243)] |
| [removed: [1B.](#sB82A005E77CF505397D17D222D089638)] [added: [1B.](#sA125FFA3D51652A8BC5E1EFCE351362B)] | [Unresolved Staff [removed: Comments](#sB82A005E77CF505397D17D222D089638)] [added: Comments](#sA125FFA3D51652A8BC5E1EFCE351362B)] | [removed: [13](#sB82A005E77CF505397D17D222D089638)] [added: [13](#sA125FFA3D51652A8BC5E1EFCE351362B)] |
| [removed: [3.](#s9098435BA5B95587B08FFDA486FFE313)] [added: [3.](#s00A1C24F51FA58F1A86FB1FE02180105)] | [Legal [removed: Proceedings](#s9098435BA5B95587B08FFDA486FFE313)] [added: Proceedings](#s00A1C24F51FA58F1A86FB1FE02180105)] | [removed: [14](#s9098435BA5B95587B08FFDA486FFE313)] [added: [15](#s00A1C24F51FA58F1A86FB1FE02180105)] |
| [removed: [4.](#s6EF0A67788D15FAD9458B69C2470DCC7)] [added: [4.](#s8F494AA1BDA45208AB71A350004D3821)] | [Mine Safety [removed: Disclosures](#s6EF0A67788D15FAD9458B69C2470DCC7)] [added: Disclosures](#s8F494AA1BDA45208AB71A350004D3821)] | [removed: [14](#s6EF0A67788D15FAD9458B69C2470DCC7)] [added: [15](#s8F494AA1BDA45208AB71A350004D3821)] |
| [removed: [5.](#s599472A6CA0259BBA56E74BA9B307432)] [added: [5.](#sF2C8EFFFA6F75CA491B221991B006903)] | [Market for Registrant’s Common Equity, Related Stockholder Matters and Issuer Purchases of Equity [removed: Securities](#s599472A6CA0259BBA56E74BA9B307432)] [added: Securities](#sF2C8EFFFA6F75CA491B221991B006903)] | [removed: [15](#s599472A6CA0259BBA56E74BA9B307432)] [added: [15](#sF2C8EFFFA6F75CA491B221991B006903)] |
| [removed: [6.](#s3A93A143AAD0534BAC428852252F7FBA)] [added: [6.](#s98499F0C13725CB1A49FB7AAD4A1A3A2)] | [Selected Financial [removed: Data](#s3A93A143AAD0534BAC428852252F7FBA)] [added: Data](#s98499F0C13725CB1A49FB7AAD4A1A3A2)] | [removed: [18](#s3A93A143AAD0534BAC428852252F7FBA)] [added: [19](#s98499F0C13725CB1A49FB7AAD4A1A3A2)] |
| [removed: [7.](#s17FD0E6AB5915E08A42D8FD12DE70881)] [added: [7.](#s501E3541E41C5BC89BBFA54C6A56C690)] | [Management’s Discussion and Analysis of Financial Condition and Results of [removed: Operations](#s17FD0E6AB5915E08A42D8FD12DE70881)] [added: Operations](#s501E3541E41C5BC89BBFA54C6A56C690)] | [removed: [19](#s17FD0E6AB5915E08A42D8FD12DE70881)] [added: [20](#s501E3541E41C5BC89BBFA54C6A56C690)] |
| [removed: [7A.](#s49153C599FDA5BEFB48201E9D4B81237)] [added: [7A.](#s99ED082F8A5F531793C969B776CDE0CD)] | [Quantitative and Qualitative Disclosures About Market [removed: Risk](#s49153C599FDA5BEFB48201E9D4B81237)] [added: Risk](#s99ED082F8A5F531793C969B776CDE0CD)] | [removed: [34](#s49153C599FDA5BEFB48201E9D4B81237)] [added: [38](#s99ED082F8A5F531793C969B776CDE0CD)] |
| [removed: [8.](#s5D1D5293C3B35B79B5178E32F513EB97)] [added: [8.](#s7F54EF6703905563AECFEC158BEFD82B)] | [Financial Statements and Supplementary [removed: Data](#s5D1D5293C3B35B79B5178E32F513EB97)] [added: Data](#s7F54EF6703905563AECFEC158BEFD82B)] | [removed: [35](#s5D1D5293C3B35B79B5178E32F513EB97)] [added: [39](#s7F54EF6703905563AECFEC158BEFD82B)] |
| [removed: [9.](#s7521ADE8EA9953A9839F9D800C23878D)] [added: [9.](#s3A98A0FE30F4591EBD3AB981F257F8CE)] | [Changes in and Disagreements with Accountants on Accounting and Financial [removed: Disclosure](#s7521ADE8EA9953A9839F9D800C23878D)] [added: Disclosure](#s3A98A0FE30F4591EBD3AB981F257F8CE)] | [removed: [59](#s7521ADE8EA9953A9839F9D800C23878D)] [added: [69](#s3A98A0FE30F4591EBD3AB981F257F8CE)] |
| [removed: [9A.](#s10B7B2A5C40556D7BAEF622087BC5637)] [added: [9A.](#sF7D3024E96875490A131A75B5DD75452)] | [Controls and [removed: Procedures](#s10B7B2A5C40556D7BAEF622087BC5637)] [added: Procedures](#sF7D3024E96875490A131A75B5DD75452)] | [removed: [59](#s10B7B2A5C40556D7BAEF622087BC5637)] [added: [69](#sF7D3024E96875490A131A75B5DD75452)] |
| [removed: [9B.](#sA7A223299031506A86271E3D948F3949)] [added: [9B.](#s08281E22A76E5E228CF548934942C948)] | [Other [removed: Information](#sA7A223299031506A86271E3D948F3949)] [added: Information](#s08281E22A76E5E228CF548934942C948)] | [removed: [59](#sA7A223299031506A86271E3D948F3949)] [added: [69](#s08281E22A76E5E228CF548934942C948)] |
| [PART [removed: III](#sBBCB290E6A2B5EA6A60025ED07894294)] [added: III](#s3B6CD126F0B9552A81FD67519F3A253F)] | | [removed: [59](#sBBCB290E6A2B5EA6A60025ED07894294)] [added: [69](#s3B6CD126F0B9552A81FD67519F3A253F)] |
| [removed: [10.](#s7BA250B43FD45F31ACA47854BCF7CE15)] [added: [10.](#s227EE44A954C51539A5FA1C125975B24)] | [Directors, Executive Officers and Corporate [removed: Governance](#s7BA250B43FD45F31ACA47854BCF7CE15)] [added: Governance](#s227EE44A954C51539A5FA1C125975B24)] | [removed: [59](#s7BA250B43FD45F31ACA47854BCF7CE15)] [added: [69](#s227EE44A954C51539A5FA1C125975B24)] |
| [removed: [11.](#s6320295335F55CB9A79EC51C4EB7EB92)] [added: [11.](#s5CDEF5ACD4925222A0A0E4E30F879EC3)] | [Executive [removed: Compensation](#s6320295335F55CB9A79EC51C4EB7EB92)] [added: Compensation](#s5CDEF5ACD4925222A0A0E4E30F879EC3)] | [removed: [60](#s6320295335F55CB9A79EC51C4EB7EB92)] [added: [70](#s5CDEF5ACD4925222A0A0E4E30F879EC3)] |
| [removed: [12.](#s40BD0704CD0A53318E7399DF5476A6F1)] [added: [12.](#s7782A24307B1515D92543C71D32E2B04)] | [Security Ownership of Certain Beneficial Owners and Management and Related Stockholder [removed: Matters](#s40BD0704CD0A53318E7399DF5476A6F1)] [added: Matters](#s7782A24307B1515D92543C71D32E2B04)] | [removed: [60](#s40BD0704CD0A53318E7399DF5476A6F1)] [added: [70](#s7782A24307B1515D92543C71D32E2B04)] |
| [removed: [13.](#sE7BB8008F34B5BD99B8789FC197F258E)] [added: [13.](#s8A22AD3B13E9525888995D850D8FF5D2)] | [Certain Relationships and Related Transactions, and Director [removed: Independence](#sE7BB8008F34B5BD99B8789FC197F258E)] [added: Independence](#s8A22AD3B13E9525888995D850D8FF5D2)] | [removed: [60](#sE7BB8008F34B5BD99B8789FC197F258E)] [added: [70](#s8A22AD3B13E9525888995D850D8FF5D2)] |
| [removed: [14.](#s62F15B0AF2EE530985E8EDE56A253261)] [added: [14.](#s85D81C25C3C152E79BD665FFB70FF89A)] | [Principal Accountant Fees and [removed: Services](#s62F15B0AF2EE530985E8EDE56A253261)] [added: Services](#s85D81C25C3C152E79BD665FFB70FF89A)] | [removed: [60](#s62F15B0AF2EE530985E8EDE56A253261)] [added: [70](#s85D81C25C3C152E79BD665FFB70FF89A)] |
| [removed: [15.](#s8A370122CFBB583896F31236C93E6884)] [added: [15.](#sE03B5352934F599DA8CA37BB8B6FB213)] | [Exhibits and Financial Statement [removed: Schedules](#s8A370122CFBB583896F31236C93E6884)] [added: Schedules](#sE03B5352934F599DA8CA37BB8B6FB213)] | [removed: [61](#s8A370122CFBB583896F31236C93E6884)] [added: [71](#sE03B5352934F599DA8CA37BB8B6FB213)] |
These factors include, without limitation, [removed: general] [added: national, regional and local] economic conditions affecting consumer spending, [added: weather conditions,] the [added: seasonal nature of the business, the] timing and acceptance of new products in the stores, the timing and mix of goods sold, purchase price volatility (including inflationary and deflationary pressures), the ability to increase sales at existing stores, the ability to manage growth and identify suitable locations, failure of an acquisition to produce anticipated results, the ability to successfully manage expenses and execute [removed: our] key gross margin enhancing initiatives, the availability of favorable credit sources, capital market conditions in general, the ability to open new stores in the manner and number currently contemplated, the impact of new stores on [removed: our business, competition, weather conditions,] the [removed: seasonal nature of our] business, [added: competition,] effective merchandising [removed: initiatives] and marketing [removed: emphasis,] [added: initiatives,] the ability to retain vendors, reliance on foreign suppliers, the ability to attract, train and retain qualified employees, product liability and other claims, changes in federal, state or local regulations, potential judgments, fines, legal fees and other costs, breach of information systems or theft of [added: employee or] customer data, ongoing and potential future legal or regulatory proceedings, management of [removed: our] [added: the Company’s] information systems, failure to develop and implement new technologies, the failure of customer-facing technology systems, business disruption including from the implementation of new supply chain technologies, effective tax rate changes and results of examination by taxing authorities, the ability to maintain an effective system of internal control over financial reporting, changes in accounting standards, assumptions and estimates, and those described in Item 1A.
| [PART I](#s9F10FA136F81523CAE515C7CF3A17901) | | [1](#s9F10FA136F81523CAE515C7CF3A17901) |
| [1.](#s3301F1B26E9D507C886F334B1AF7E024) | [Business](#s3301F1B26E9D507C886F334B1AF7E024) | [1](#s3301F1B26E9D507C886F334B1AF7E024) |
| [2.](#sE661331CB0BD5B8EA96B725AADEB59BC) | [Properties](#sE661331CB0BD5B8EA96B725AADEB59BC) | [13](#sE661331CB0BD5B8EA96B725AADEB59BC) |
| [PART II](#s91995B31E67357CCAEB1599DDD4305FD) | | [15](#s91995B31E67357CCAEB1599DDD4305FD) |
| [PART IV](#sF4FD17E5720250A8B23B8BB01BE8D82A) | | [71](#sF4FD17E5720250A8B23B8BB01BE8D82A) |
[Index](#s280A637900D555ED970FF69A42C39D1F)
[Index](#s280A637900D555ED970FF69A42C39D1F)
| [PART I](#s0F5B3ECED2D356D3AACB6168C231EC85) | | [1](#s0F5B3ECED2D356D3AACB6168C231EC85) |
| [1.](#s8C43A41B0929575396F6F86C69A87FE4) | [Business](#s8C43A41B0929575396F6F86C69A87FE4) | [1](#s8C43A41B0929575396F6F86C69A87FE4) |
| [2.](#s259094DCB62C584A9D82E207B3F7F726) | [Properties](#s259094DCB62C584A9D82E207B3F7F726) | [13](#s259094DCB62C584A9D82E207B3F7F726) |
| [PART II](#s9B95B7B305F45E78987DB2C3866559A1) | | [15](#s9B95B7B305F45E78987DB2C3866559A1) |
| [PART IV](#sF5CCE254ACEB5AC085F72BD2975E4B5C) | | [61](#sF5CCE254ACEB5AC085F72BD2975E4B5C) |
[Index](#sFE311CB6ABB9555D9B4B73BA146651C6)
Item 2. Properties
12 rewritten, 19 added, 18 removed, 26 unchanged
At December [removed: 26, 2015,] [added: 31, 2016,] the Company operated [removed: 1,488] [added: 1,738] stores in 49 states.
The Company leases approximately [removed: 93%] [added: 94%] of its stores, two distribution [removed: sites and] [added: sites,] its Merchandising Innovation Center (planogram) located in Nashville, [removed: Tennessee.][added: Tennessee, as well as the Petsense corporate headquarters located in Scottsdale, Arizona.]
| [removed: Ohio] [added: New Mexico] | | [removed: 87] [added: 27] | | [removed: New Mexico] [added: Rhode Island] | | [removed: 17] [added: 4] |
| New York | | [removed: 75] [added: 76] | | [removed: Massachusetts] [added: Nebraska] | | [removed: 16] [added: 15] |
| North Carolina | | [removed: 67] [added: 89] | | [removed: Illinois] [added: Maine] | | [removed: 14] [added: 19] |
| [removed: Georgia] [added: Virginia] | | [removed: 58] [added: 54] | | New Jersey | | 13 |
| [removed: Alabama] [added: Indiana] | | [removed: 47] [added: 54] | | North Dakota | | [removed: 11] [added: 13] |
| [removed: South Carolina] [added: California] | | [removed: 33] [added: 50] | | South Dakota | | [removed: 6] [added: 7] |
| Louisiana | | [removed: 30] [added: 36] | | Wyoming | | [removed: 6] [added: 7] |
| West Virginia | | [removed: 24] [added: 27] | | [removed: Montana] [added: Oregon] | | 4 |
| [removed: New Hampshire] [added: Texas] | | [removed: 20] [added: 196] | | [removed: Hawaii] [added: New Hampshire] | | [removed: 2] [added: 21] |
| Maryland | | [removed: 19] [added: 21] | | | | |
[Index](#s280A637900D555ED970FF69A42C39D1F)
| Pennsylvania | | 89 | | Kansas | | 20 |
| Ohio | | 87 | | Colorado | | 19 |
| Tennessee | | 87 | | Massachusetts | | 19 |
| Michigan | | 81 | | Wisconsin | | 17 |
| Georgia | | 79 | | Connecticut | | 17 |
| Kentucky | | 63 | | Utah | | 15 |
| Florida | | 58 | | Illinois | | 14 |
| Alabama | | 52 | | Minnesota | | 10 |
| Oklahoma | | 51 | | Iowa | | 9 |
| South Carolina | | 42 | | Vermont | | 7 |
| Arkansas | | 35 | | Montana | | 6 |
| Mississippi | | 34 | | Delaware | | 5 |
| Arizona | | 32 | | Idaho | | 4 |
| Missouri | | 25 | | Hawaii | | 2 |
| Washington | | 24 | | Nevada | | 2 |
| | | | | | | 1,738 |
[Index](#s280A637900D555ED970FF69A42C39D1F)
In fiscal 2017, we plan to begin construction on a new northeast distribution center, as well as an expansion of our existing distribution center in Waverly, Nebraska, which will provide additional distribution capacity once construction is completed.
| Texas | | 165 | | Colorado | | 17 |
| Pennsylvania | | 81 | | Washington | | 17 |
| Michigan | | 80 | | Kansas | | 16 |
| Tennessee (a) | | 71 | | Wisconsin | | 16 |
| Florida | | 55 | | Utah | | 13 |
| Kentucky | | 53 | | Connecticut | | 12 |
| Virginia | | 51 | | Nebraska | | 12 |
| Indiana | | 46 | | Minnesota | | 10 |
| California | | 44 | | Iowa | | 7 |
| Oklahoma | | 35 | | Vermont | | 7 |
| Arizona | | 28 | | Delaware | | 4 |
| Mississippi | | 25 | | Idaho | | 4 |
| Arkansas | | 23 | | Oregon | | 3 |
| Missouri | | 20 | | Rhode Island | | 3 |
| Maine | | 19 | | Nevada | | 2 |
| | | | | | | 1,488 |
(a) Includes the Company’s two HomeTown Pet stores.
[Index](#sFE311CB6ABB9555D9B4B73BA146651C6)
Item 4. Mine Safety Disclosures
0 rewritten, 0 added, 1 removed, 4 unchanged
[Index](#sFE311CB6ABB9555D9B4B73BA146651C6)
Item 5. Market for Registrant’s Common Equity, Related Stockholder Matters and Issuer Purchases of Equity Securities
18 rewritten, 23 added, 17 removed, 36 unchanged
| First Quarter | [removed: $90.49] [added: $90.76] | | [removed: $74.52] [added: $78.05] | | [removed: $78.17] [added: $90.49] | | [removed: $62.06] [added: $74.52] |
| Second Quarter | [removed: $93.99] [added: $97.25] | | [removed: $83.70] [added: $86.44] | | [removed: $72.99] [added: $93.99] | | [removed: $59.75] [added: $83.70] |
| Third Quarter | [removed: $96.28] [added: $95.39] | | [removed: $75.00] [added: $66.77] | | [removed: $67.84] [added: $96.28] | | [removed: $57.20] [added: $75.00] |
| Fourth Quarter | [removed: $94.00] [added: $78.17] | | [removed: $80.06] [added: $61.50] | | [removed: $79.14] [added: $94.00] | | [removed: $55.95] [added: $80.06] |
As of [removed: January 29, 2016,] [added: February 3, 2017,] the number of record holders of our common stock was [removed: 700] [added: 607] (excluding individual participants in nominee security position listings), and the estimated number of beneficial holders of our common stock was [removed: 100,000.][added: 115,000.]
During [removed: 2015] [added: 2016] and [removed: 2014,] [added: 2015,] the Board of Directors declared the following cash dividends:
It is the present intention of the Board of Directors to continue to pay a quarterly cash dividend; however, the declaration and payment of future dividends will be determined by the Board of Directors in its sole discretion and will depend upon the earnings, financial [removed: condition,] [added: condition] and capital needs of the Company, as well as other factors which the Board of Directors deem relevant.
On February [removed: 3, 2016,] [added: 8, 2017,] our Board of Directors declared a quarterly cash dividend of [removed: $0.20] [added: $0.24] per share of the Company’s common stock.
The dividend will be paid on March [removed: 8, 2016,] [added: 14, 2017,] to stockholders of record as of the close of business on February [removed: 22, 2016.][added: 27, 2017.]
[removed: The Company’s] [added: On October 31, 2016, the] Board of Directors [removed: has] authorized [removed: common stock repurchases under] a [added: $1 billion increase to the existing] share repurchase [removed: program of up] [added: program, bringing the total amount authorized] to [removed: $2] [added: $3] billion, exclusive of any fees, commissions, or other expenses related to such [removed: repurchases,] [added: repurchases and extended the program] through December [removed: 2017.][added: 31, 2020.]
Stock purchase activity during fiscal [removed: 2015] [added: 2016] is set forth in the table below:
[removed: (a)The] [added: (a) The] total number of shares purchased and average price paid per share include shares withheld from vested restricted stock units to satisfy employees’ minimum statutory tax withholding requirements of [removed: 12,940] [added: 10,236] during the first [removed: quarter, 206 during the second quarter, and 22,196 during the third] quarter.
The program may be limited or terminated at any [removed: time] [added: time,] without prior notice.
The following graph compares the cumulative total stockholder return on our common stock from December [removed: 25, 2010] [added: 31, 2011] to December [removed: 26, 2015] [added: 31, 2016] (the Company’s fiscal [removed: year-end)] [added: year-end),] with the cumulative total returns of the S&P 500 Index and the S&P Retail Index over the same period.
The comparison assumes that $100 was invested on December [removed: 25, 2010] [added: 31, 2011] in our common stock and in each of the foregoing indices and in each case assumes reinvestment of dividends.
The historical stock price performance shown on this graph is not [removed: necessarily] indicative of future performance.
[removed: ][added: 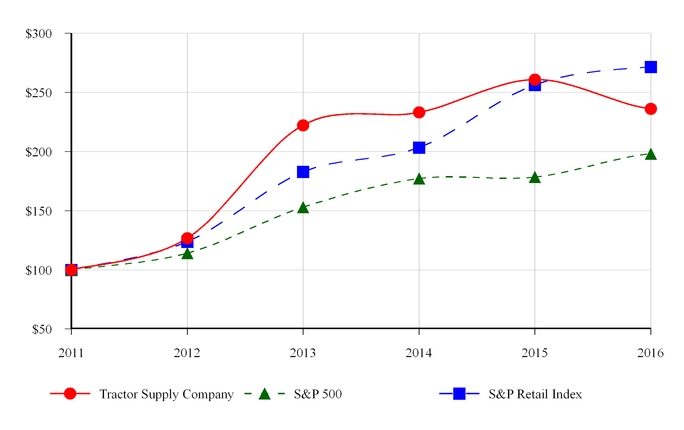]
| | | [removed: 12/25/2010 | | | |] 12/31/2011 | | | | 12/29/2012 | | | | 12/28/2013 | | | | 12/27/2014 | | | | 12/26/2015 | | | [added: | 12/31/2016 | | |]
| | 2016 | | | | 2015 | | |
[Index](#s280A637900D555ED970FF69A42C39D1F)
| October 31, 2016 | | $0.24 | | November 14, 2016 | | November 29, 2016 |
| August 1, 2016 | | $0.24 | | August 15, 2016 | | August 30, 2016 |
| May 2, 2016 | | $0.24 | | May 16, 2016 | | June 1, 2016 |
| February 3, 2016 | | $0.20 | | February 22, 2016 | | March 8, 2016 |
[Index](#s280A637900D555ED970FF69A42C39D1F)
The Company’s Board of Directors has authorized common stock repurchases under a share repurchase program.
| First Quarter (a) | | 1,194,323 | | | $ | 83.68 | | | 1,184,087 | | | $ | 471,601,257 | |
| Second Quarter | | 86,794 | | | 89.90 | | | | 86,794 | | | 463,799,558 | | |
| Third Quarter | | 1,409,652 | | | 77.17 | | | | 1,409,652 | | | 355,034,384 | | |
| 9/25/16 – 10/22/16 | | 1,200,000 | | | 67.41 | | | | 1,200,000 | | | 274,166,426 | | |
| 10/23/16 – 11/19/16 (b) | | 377,136 | | | 64.92 | | | | 377,136 | | | 1,249,687,202 | | |
| 11/20/16 – 12/31/16 | | 140,000 | | | 76.05 | | | | 140,000 | | | 1,239,042,973 | | |
| | | 1,717,136 | | | 67.56 | | | | 1,717,136 | | | 1,239,042,973 | | |
| As of December 31, 2016 | | 4,407,905 | | | $ | 75.44 | | | 4,397,669 | | | $ | 1,239,042,973 | |
(b) The Board authorized a $1 billion increase to its existing share repurchase program, bringing the total amount authorized to date under the program to $3 billion.
The program, established in February 2007, has been extended through December 31, 2020.
[Index](#s280A637900D555ED970FF69A42C39D1F)
| Tractor Supply Company | | $ | 100.00 | | | $ | 126.76 | | | $ | 222.22 | | | $ | 233.15 | | | $ | 260.81 | | | $ | 236.19 | |
| S&P 500 | | $ | 100.00 | | | $ | 114.07 | | | $ | 152.98 | | | $ | 177.08 | | | $ | 178.44 | | | $ | 198.18 | |
| S&P Retail Index | | $ | 100.00 | | | $ | 123.80 | | | $ | 182.90 | | | $ | 203.34 | | | $ | 256.45 | | | $ | 271.66 | |
[Index](#s280A637900D555ED970FF69A42C39D1F)
| | 2015 | | | | 2014 | | |
| October 29, 2014 | | $0.16 | | November 17, 2014 | | December 2, 2014 |
| July 30, 2014 | | $0.16 | | August 18, 2014 | | September 3, 2014 |
| April 30, 2014 | | $0.16 | | May 19, 2014 | | June 3, 2014 |
| February 5, 2014 | | $0.13 | | February 24, 2014 | | March 11, 2014 |
[Index](#sFE311CB6ABB9555D9B4B73BA146651C6)
| First Quarter (a) | | 609,140 | | | $ | 80.51 | | | 596,200 | | | $ | 815,403,974 | |
| Second Quarter (a) | | 876,106 | | | 87.45 | | | | 875,900 | | | 738,821,721 | | |
| Third Quarter (a) | | 1,400,896 | | | 86.60 | | | | 1,378,700 | | | 619,426,366 | | |
| 9/27/15 – 10/24/15 | | 354,636 | | | 85.16 | | | | 354,636 | | | 589,232,534 | | |
| 10/25/15 – 11/21/15 | | 72,777 | | | 89.95 | | | | 72,777 | | | 582,687,686 | | |
| 11/22/15 – 12/26/15 | | 137,200 | | | 87.49 | | | | 137,200 | | | 570,686,010 | | |
| | | 564,613 | | | 86.34 | | | | 564,613 | | | 570,686,010 | | |
| As of December 26, 2015 | | 3,450,755 | | | $ | 85.70 | | | 3,415,413 | | | $ | 570,686,010 | |
| Tractor Supply Company | | $ | 100.00 | | | $ | 144.94 | | | $ | 180.72 | | | $ | 312.15 | | | $ | 321.98 | | | $ | 354.01 | |
| S&P 500 | | $ | 100.00 | | | $ | 100.07 | | | $ | 111.59 | | | $ | 146.52 | | | $ | 166.20 | | | $ | 163.99 | |
| S&P Retail Index | | $ | 100.00 | | | $ | 102.22 | | | $ | 124.95 | | | $ | 182.52 | | | $ | 200.64 | | | $ | 250.37 | |
Item 6. Selected Financial Data
41 rewritten, 5 added, 1 removed, 19 unchanged
FIVE YEAR SELECTED FINANCIAL AND OPERATING HIGHLIGHTS [removed: (a)][added: (a)(b)]
| | [removed: 2015] [added: 2016] | | | | [removed: 2014] [added: 2015] | | | | [removed: 2013] [added: 2014] | | | | [removed: 2012] [added: 2013] | | | | [removed: 2011] [added: 2012] | | |
| | [removed: (52] [added: (53] weeks) | | | | (52 weeks) | | | | (52 weeks) | | | | (52 weeks) | | | | [removed: (53] [added: (52] weeks) | | |
| Net sales | $ | [removed: 6,226,507] [added: 6,779,579] | | | $ | [removed: 5,711,715] [added: 6,226,507] | | | $ | [removed: 5,164,784] [added: 5,711,715] | | | $ | [removed: 4,664,120] [added: 5,164,784] | | | $ | [removed: 4,232,743] [added: 4,664,120] | |
| Gross profit | [removed: 2,143,174] [added: 2,325,202] | | | | [removed: 1,950,415] [added: 2,143,174] | | | | [removed: 1,753,609] [added: 1,950,415] | | | | [removed: 1,566,054] [added: 1,753,609] | | | | [removed: 1,406,872] [added: 1,566,054] | | |
| Selling, general and administrative expenses | [removed: 1,369,097] [added: 1,488,164] | | | | [removed: 1,246,308] [added: 1,369,097] | | | | [removed: 1,138,934] [added: 1,246,308] | | | | [removed: 1,040,287] [added: 1,138,934] | | | | [removed: 973,822] [added: 1,040,287] | | |
| Depreciation and amortization | [removed: 123,569] [added: 142,958] | | | | [removed: 114,635] [added: 123,569] | | | | [removed: 100,025] [added: 114,635] | | | | [removed: 88,975] [added: 100,025] | | | | [removed: 80,347] [added: 88,975] | | |
| Operating income | [removed: 650,508] [added: 694,080] | | | | [removed: 589,472] [added: 650,508] | | | | [removed: 514,650] [added: 589,472] | | | | [removed: 436,792] [added: 514,650] | | | | [removed: 352,703] [added: 436,792] | | |
| Interest expense, net | [removed: 2,891] [added: 5,810] | | | | [removed: 1,885] [added: 2,891] | | | | [removed: 557] [added: 1,885] | | | | [removed: 1,055] [added: 557] | | | | [removed: 2,087] [added: 1,055] | | |
| Income before income taxes | [removed: 647,617] [added: 688,270] | | | | [removed: 587,587] [added: 647,617] | | | | [removed: 514,093] [added: 587,587] | | | | [removed: 435,737] [added: 514,093] | | | | [removed: 350,616] [added: 435,737] | | |
| Income tax expense | [removed: 237,222] [added: 251,150] | | | | [removed: 216,702] [added: 237,222] | | | | [removed: 185,859] [added: 216,702] | | | | [removed: 159,280] [added: 185,859] | | | | [removed: 127,876] [added: 159,280] | | |
| Net income | $ | [removed: 410,395] [added: 437,120] | | | $ | [removed: 370,885] [added: 410,395] | | | $ | [removed: 328,234] [added: 370,885] | | | $ | [removed: 276,457] [added: 328,234] | | | $ | [removed: 222,740] [added: 276,457] | |
| Net income per share – basic [removed: (b)] [added: (c)] | $ | [removed: 3.03] [added: 3.29] | | | $ | [removed: 2.69] [added: 3.03] | | | $ | [removed: 2.35] [added: 2.69] | | | $ | [removed: 1.94] [added: 2.35] | | | $ | [removed: 1.55] [added: 1.94] | |
| Net income per share – diluted [removed: (b)] [added: (c)] | $ | [removed: 3.00] [added: 3.27] | | | $ | [removed: 2.66] [added: 3.00] | | | $ | [removed: 2.32] [added: 2.66] | | | $ | [removed: 1.90] [added: 2.32] | | | $ | [removed: 1.51] [added: 1.90] | |
| Weighted average shares – diluted [removed: (b)] [added: (c)] | [removed: 136,845] [added: 133,813] | | | | [removed: 139,435] [added: 136,845] | | | | [removed: 141,723] [added: 139,435] | | | | [removed: 145,514] [added: 141,723] | | | | [removed: 147,842] [added: 145,514] | | |
| Dividends declared per common share outstanding | $ | [removed: 0.76] [added: 0.92] | | | $ | [removed: 0.61] [added: 0.76] | | | $ | [removed: 0.49] [added: 0.61] | | | $ | [removed: 0.36] [added: 0.49] | | | $ | [removed: 0.22] [added: 0.36] | |
| Gross margin | [removed: 34.4] [added: 34.3] | | % | | [removed: 34.1] [added: 34.4] | | % | | [removed: 34.0] [added: 34.1] | | % | | [removed: 33.6] [added: 34.0] | | % | | [removed: 33.2] [added: 33.6] | | % |
| Selling, general and administrative expenses | 22.0 | | % | | [removed: 21.8] [added: 22.0] | | % | | [removed: 22.1] [added: 21.8] | | % | | [removed: 22.3] [added: 22.1] | | % | | [removed: 23.0] [added: 22.3] | | % |
| Operating income | [removed: 10.4] [added: 10.2] | | % | | [removed: 10.3] [added: 10.4] | | % | | [removed: 10.0] [added: 10.3] | | % | | [removed: 9.4] [added: 10.0] | | % | | [removed: 8.3] [added: 9.4] | | % |
| Net income | [removed: 6.6] [added: 6.4] | | % | | [removed: 6.5] [added: 6.6] | | % | | [removed: 6.4] [added: 6.5] | | % | | [removed: 6.0] [added: 6.4] | | % | | [removed: 5.3] [added: 6.0] | | % |
| Stores open at end of year | [removed: 1,488] [added: 1,738] | | | | [removed: 1,382] [added: 1,488] | | | | [removed: 1,276] [added: 1,382] | | | | [removed: 1,176] [added: 1,276] | | | | [removed: 1,085] [added: 1,176] | | |
| Comparable store sales increase [removed: (c)] [added: (d)] | [removed: 3.1] [added: 1.6] | | % | | [removed: 3.8] [added: 3.1] | | % | | [removed: 4.8] [added: 3.8] | | % | | [removed: 5.3] [added: 4.8] | | % | | [removed: 8.2] [added: 5.3] | | % |
| New store sales (as a % of net sales) [removed: (d)] [added: (e)] | 5.6 | | % | | [removed: 6.2] [added: 5.6] | | % | | [removed: 5.4] [added: 6.2] | | % | | [removed: 5.9] [added: 5.4] | | % | | [removed: 5.6] [added: 5.9] | | % |
| Average transaction value | $ | [removed: 44.87] [added: 44.42] | | | $ | [removed: 44.84] [added: 44.87] | | | $ | [removed: 44.48] [added: 44.84] | | | $ | [removed: 44.40] [added: 44.48] | | | $ | [removed: 43.33] [added: 44.40] | |
| Comparable store average transaction value (decrease) increase (c) | [removed: (0.2] [added: (0.9] | | )% | | [removed: 0.6] [added: (0.2] | | [removed: %] [added: )%] | | [removed: 0.0] [added: 0.6] | | % | | [removed: 2.0] [added: —] | | % | | [removed: 3.1] [added: 2.0] | | % |
| Comparable store average transaction count increase [removed: (c)] [added: (d)] | [removed: 3.3] [added: 2.6] | | % | | [removed: 3.2] [added: 3.3] | | % | | [removed: 4.7] [added: 3.2] | | % | | [removed: 3.0] [added: 4.7] | | % | | [removed: 5.0] [added: 3.0] | | % |
| Total selling square footage (000’s) | [removed: 23,938] [added: 26,511] | | | | [removed: 22,176] [added: 23,938] | | | | [removed: 20,470] [added: 22,176] | | | | [removed: 18,893] [added: 20,470] | | | | [removed: 17,506] [added: 18,893] | | |
| Total team members | [removed: 23,000] [added: 26,000] | | | | [removed: 21,100] [added: 23,000] | | | | [removed: 19,200] [added: 21,100] | | | | [removed: 17,300] [added: 19,200] | | | | [removed: 16,400] [added: 17,300] | | |
| Capital expenditures (000’s) | $ | [removed: 236,496] [added: 226,017] | | | $ | [removed: 160,613] [added: 236,496] | | | $ | [removed: 218,200] [added: 160,613] | | | $ | [removed: 152,924] [added: 218,200] | | | $ | [removed: 166,156] [added: 152,924] | |
| Average inventory per store [removed: (e)] [added: (f)] | $ | [removed: 820.1] [added: 741.7] | | | $ | [removed: 752.7] [added: 820.1] | | | $ | [removed: 723.5] [added: 752.7] | | | $ | [removed: 727.4] [added: 723.5] | | | $ | [removed: 723.4] [added: 727.4] | |
| Inventory turns | [removed: 3.23] [added: 3.19] | | | | [removed: 3.32] [added: 3.23] | | | | [removed: 3.29] [added: 3.32] | | | | [removed: 3.28] [added: 3.29] | | | | [removed: 3.23] [added: 3.28] | | |
| Working capital [added: (g)] | $ | [removed: 814,147] [added: 740,615] | | | $ | [removed: 670,897] [added: 768,177] | | | $ | [removed: 677,107] [added: 670,897] | | | $ | [removed: 569,547] [added: 677,107] | | | $ | [removed: 629,624] [added: 569,547] | |
| Total assets | $ | [removed: 2,370,826] [added: 2,674,942] | | | $ | [removed: 2,034,571] [added: 2,370,826] | | | $ | [removed: 1,903,391] [added: 2,034,571] | | | $ | [removed: 1,706,808] [added: 1,903,391] | | | $ | [removed: 1,594,832] [added: 1,706,808] | |
| Long-term debt, less current portion [removed: (f)] [added: (h)] | $ | [removed: 166,992] [added: 289,769] | | | $ | [removed: 4,957] [added: 166,992] | | | $ | [removed: 1,200] [added: 4,957] | | | $ | [removed: 1,242] [added: 1,200] | | | $ | [removed: 1,284] [added: 1,242] | |
| Stockholders’ equity | $ | [removed: 1,393,294] [added: 1,453,218] | | | $ | [removed: 1,293,561] [added: 1,393,294] | | | $ | [removed: 1,246,894] [added: 1,293,561] | | | $ | [removed: 1,024,974] [added: 1,246,894] | | | $ | [removed: 1,008,290] [added: 1,024,974] | |
Fiscal year [removed: 2011] [added: 2016] consisted of 53 weeks while all other fiscal years consisted of 52 weeks.
[removed: (b)] [added: (c)] Basic net income per share is calculated based on the weighted average number of common shares outstanding applied to net income.
[removed: (c)] [added: (d)] Comparable store metrics are calculated on an annual basis using sales generated from all stores open at least one year and all online sales, excluding certain adjustments to net sales.
[removed: (d)] [added: (e)] New stores sales metrics are based on stores open for less than one year.
[removed: (e)] [added: (f)] Assumes average inventory cost, excluding inventory in-transit.
(b) Beginning in the fourth quarter ended December 31, 2016, selected financial and operating information includes the consolidation of Petsense, unless otherwise noted.
Petsense stores are not considered comparable stores until 12 months after the date of acquisition.
(g) Working capital for 2016 and 2015 reflects deferred tax assets as non-current as a result of the adoption of ASU 2015-17 (which is discussed in Note 15 to the Consolidated Financial Statements).
Years prior to 2015 have not been adjusted to reflect the adoption of this guidance.
[Index](#s280A637900D555ED970FF69A42C39D1F)
[Index](#sFE311CB6ABB9555D9B4B73BA146651C6)
An excerpt. Shown here: 40 of 41 rewritten, all 5 added and all 1 removed. The counts are complete. For every sentence, read Item 6. Selected Financial Data in the FY2016 filing and the FY2015 filing.
Item 8. Financial Statements and Supplementary Data
302 rewritten, 292 added, 82 removed, 472 unchanged
| [Management's Report on Internal Control over Financial [removed: Reporting](#sC7D38B4177C15FA5BE5A646FC41AEBB8)] [added: Reporting](#s1CB1138F059C50E4A68B5D8A9A894297)] | [removed: [36](#sC7D38B4177C15FA5BE5A646FC41AEBB8)] [added: [40](#s1CB1138F059C50E4A68B5D8A9A894297)] |
| [Reports of Independent Registered Public Accounting [removed: Firm](#s2446B3F4E10F51BF8C7D3DF99A50AD82)] [added: Firm](#s0E2A7D61B1ED5649B37E7ECFC4700F1A)] | [removed: [37](#s2446B3F4E10F51BF8C7D3DF99A50AD82)] [added: [41](#s0E2A7D61B1ED5649B37E7ECFC4700F1A)] |
| [Consolidated Statements of Income for the fiscal years [removed: ended](#sC2548368945252EE9FC1CA46849B66A8)] [added: ended](#sFAB5EA2EB1A25F199F24ED5B67943D7D)] December [added: 31, 2016, December] 26, 2015, [removed: December 27, 2014,] and December [removed: 28, 2013] [added: 27, 2014] | [removed: [39](#sC2548368945252EE9FC1CA46849B66A8)] [added: [43](#sFAB5EA2EB1A25F199F24ED5B67943D7D)] |
| [Consolidated Balance Sheets as [removed: of](#s15D21264FBC75105968576A48337CB8A)] [added: of](#sC3D9FF1CA7E25B89BAA74D7C60E0BD89)] December [removed: 26, 2015] [added: 31, 2016] and December [removed: 27, 2014] [added: 26, 2015] | [removed: [40](#s15D21264FBC75105968576A48337CB8A)] [added: [45](#sC3D9FF1CA7E25B89BAA74D7C60E0BD89)] |
| [Consolidated Statements of Stockholders’ Equity for the fiscal years [removed: ended](#s7EA8DD0BBE875BBDB9F4C34685B9F8C3)] [added: ended](#sCD58A4F7C9F6578CAB2327CFE33CAAF8)] December [added: 31, 2016, December] 26, 2015, [removed: December 27, 2014,] and December [removed: 28, 2013] [added: 27, 2014] | [removed: [41](#s7EA8DD0BBE875BBDB9F4C34685B9F8C3)] [added: [46](#sCD58A4F7C9F6578CAB2327CFE33CAAF8)] |
| [Consolidated Statements of Cash Flows for the fiscal years [removed: ended](#s51FB8CA3E2595997922C5D92360F3D68)] [added: ended](#s5C63043E71615ECABD30C7F18CA84D2C)] December [added: 31, 2016, December] 26, 2015, [removed: December 27, 2014,] and December [removed: 28, 2013] [added: 27, 2014] | [removed: [42](#s51FB8CA3E2595997922C5D92360F3D68)] [added: [47](#s5C63043E71615ECABD30C7F18CA84D2C)] |
| [Notes to Consolidated Financial [removed: Statements](#sC85B5BEFA43F56BF9F96D34496F1265D)] [added: Statements](#sDB62A17B50D650F2B0C44790EDD09128)] | [removed: [43](#sC85B5BEFA43F56BF9F96D34496F1265D)] [added: [48](#sDB62A17B50D650F2B0C44790EDD09128)] |
Management assessed the effectiveness of the Company’s internal control over financial reporting as of December [removed: 26, 2015.][added: 31, 2016.]
Based on this assessment, management believes that, as of December [removed: 26, 2015,] [added: 31, 2016,] the Company’s internal control over financial reporting is effective based on those criteria.
| Gregory A. Sandfort [removed: President and] Chief Executive Officer | | | | Anthony F. Crudele Executive Vice President - Chief Financial Officer and Treasurer |
| February [removed: 22,] [added: 3,] 2016 | | [added: $0.20] | | February 22, 2016 | [added: | March 8, 2016 |]
We have audited Tractor Supply Company’s internal control over financial reporting as of December [removed: 26, 2015,] [added: 31, 2016,] based on criteria established in Internal Control—Integrated Framework issued by the Committee of Sponsoring Organizations of the Treadway Commission (2013 framework) (the COSO criteria).
In our opinion, Tractor Supply Company maintained, in all material respects, effective internal control over financial reporting as of December [removed: 26, 2015,] [added: 31, 2016,] based on the COSO criteria.
We also have audited, in accordance with the standards of the Public Company Accounting Oversight Board (United States), the consolidated balance sheets of Tractor Supply Company as of December [removed: 26, 2015] [added: 31, 2016] and December [removed: 27, 2014,] [added: 26, 2015,] and the related consolidated statements of income, [added: comprehensive income,] stockholders’ equity, and cash flows for each of the three fiscal years in the period ended December [removed: 26, 2015,] [added: 31, 2016,] and our report dated February [removed: 22, 2016,] [added: 23, 2017,] expressed an unqualified opinion thereon.
We have audited the accompanying consolidated balance sheets of Tractor Supply Company as of December [removed: 26, 2015] [added: 31, 2016] and December [removed: 27, 2014,] [added: 26, 2015,] and the related consolidated statements of income, [added: comprehensive income,] stockholders’ equity, and cash flows for each of the three fiscal years in the period ended December [removed: 26, 2015.][added: 31, 2016.]
In our opinion, the financial statements referred to above present fairly, in all material respects, the consolidated financial position of Tractor Supply Company at December [removed: 26, 2015] [added: 31, 2016] and December [removed: 27, 2014,] [added: 26, 2015,] and the consolidated results of its operations and its cash flows for each of the three fiscal years in the period ended December [removed: 26, 2015,] [added: 31, 2016,] in conformity with U.S. generally accepted accounting principles.
We also have audited, in accordance with the standards of the Public Company Accounting Oversight Board (United States), Tractor Supply Company’s internal control over financial reporting as of December [removed: 26, 2015,] [added: 31, 2016,] based on criteria established in Internal Control-Integrated Framework issued by the Committee of Sponsoring Organizations of the Treadway Commission (2013 framework) and our report dated February [removed: 22, 2016,] [added: 23, 2017,] expressed an unqualified opinion thereon.
| | [removed: 2015] [added: 2016] | | | | [removed: 2014] [added: 2015] | | | | [removed: 2013] [added: 2014] | | |
| Net sales | $ | [removed: 6,226,507] [added: 6,779,579] | | | $ | [removed: 5,711,715] [added: 6,226,507] | | | $ | [removed: 5,164,784] [added: 5,711,715] | |
| Cost of merchandise sold | [removed: 4,083,333] [added: 4,454,377] | | | | [removed: 3,761,300] [added: 4,083,333] | | | | [removed: 3,411,175] [added: 3,761,300] | | |
| Gross profit | [removed: 2,143,174] [added: 2,325,202] | | | | [removed: 1,950,415] [added: 2,143,174] | | | | [removed: 1,753,609] [added: 1,950,415] | | |
| Selling, general and administrative expenses | [removed: 1,369,097] [added: 1,488,164] | | | | [removed: 1,246,308] [added: 1,369,097] | | | | [removed: 1,138,934] [added: 1,246,308] | | |
| Depreciation and amortization | [removed: 123,569] [added: 142,958] | | | | [removed: 114,635] [added: 123,569] | | | | [removed: 100,025] [added: 114,635] | | |
| Operating income | [removed: 650,508] [added: 694,080] | | | | [removed: 589,472] [added: 650,508] | | | | [removed: 514,650] [added: 589,472] | | |
| Interest expense, net | [removed: 2,891] [added: 5,810] | | | | [removed: 1,885] [added: 2,891] | | | | [removed: 557] [added: 1,885] | | |
| Income before income taxes | [removed: 647,617] [added: 688,270] | | | | [removed: 587,587] [added: 647,617] | | | | [removed: 514,093] [added: 587,587] | | |
| Income tax expense | [removed: 237,222] [added: 251,150] | | | | [removed: 216,702] [added: 237,222] | | | | [removed: 185,859] [added: 216,702] | | |
| Net income | $ | [removed: 410,395] [added: 437,120] | | | $ | [removed: 370,885] [added: 410,395] | | | $ | [removed: 328,234] [added: 370,885] | |
| Net income per share – basic | $ | [removed: 3.03] [added: 3.29] | | | $ | [removed: 2.69] [added: 3.03] | | | $ | [removed: 2.35] [added: 2.69] | |
| Net income per share – diluted | $ | [removed: 3.00] [added: 3.27] | | | $ | [removed: 2.66] [added: 3.00] | | | $ | [removed: 2.32] [added: 2.66] | |
| Basic | [removed: 135,582] [added: 132,905] | | | | [removed: 137,769] [added: 135,582] | | | | [removed: 139,415] [added: 137,769] | | |
| Diluted | [removed: 136,845] [added: 133,813] | | | | [removed: 139,435] [added: 136,845] | | | | [removed: 141,723] [added: 139,435] | | |
| Dividends declared per common share outstanding | $ | [removed: 0.76] [added: 0.92] | | | $ | [removed: 0.61] [added: 0.76] | | | $ | [removed: 0.49] [added: 0.61] | |
| | December [removed: 26, 2015] [added: 31, 2016] | | | | December [removed: 27, 2014] [added: 26, 2015] | | |
| Cash and cash equivalents | $ | [removed: 63,813] [added: 53,916] | | | $ | [removed: 51,134] [added: 63,813] | |
| Inventories | [removed: 1,284,375] [added: 1,369,656] | | | | [removed: 1,115,450] [added: 1,284,375] | | |
| Prepaid expenses and other current assets | [removed: 87,510] [added: 90,557] | | | | [removed: 66,444] [added: 87,510] | | |
| Income taxes receivable | [removed: 3,763] [added: 3,680] | | | | [removed: —] [added: 3,763] | | |
| Deferred income taxes | [removed: 45,970] [added: 45,218] | | | | [removed: 40,962] [added: 55,194] | | |
| Land | [removed: 86,991] [added: 94,940] | | | | [removed: 79,571] [added: 86,991] | | |
| [Consolidated Statements of Comprehensive Income for the fiscal years ended December 31, 2016, December 26, 2015, and December 27, 2014](#s73de253e1b2249208fdba60ac776477f) | [44](#s73de253e1b2249208fdba60ac776477f) |
[Index](#s280A637900D555ED970FF69A42C39D1F)
| February 23, 2017 | | | | February 23, 2017 |
[Index](#s280A637900D555ED970FF69A42C39D1F)
February 23, 2017
[Index](#s280A637900D555ED970FF69A42C39D1F)
February 23, 2017
[Index](#s280A637900D555ED970FF69A42C39D1F)
| | (53 weeks) | | | | (52 weeks) | | | | (52 weeks) | | |
[Index](#s280A637900D555ED970FF69A42C39D1F)
CONSOLIDATED STATEMENTS OF COMPREHENSIVE INCOME
| | (53 weeks) | | | | (52 weeks) | | | | (52 weeks) | | |
| Change in fair value of interest rate swap, net of taxes | 1,392 | | | | — | | | | — | | |
| Total other comprehensive income | 1,392 | | | | — | | | | — | | |
| Total comprehensive income | $ | 438,512 | | | $ | 410,395 | | | $ | 370,885 | |
[Index](#s280A637900D555ED970FF69A42C39D1F)
| Total current assets | 1,517,809 | | | | 1,439,461 | | |
| Goodwill and other intangible assets | 125,717 | | | | 10,258 | | |
| Current portion of long-term debt | 10,000 | | | | — | | |
| Long-term debt | 263,850 | | | | 150,000 | | |
| Accumulated other comprehensive income | 1,392 | | | | — | | |
[Index](#s280A637900D555ED970FF69A42C39D1F)
| | | | | | | | | | | | | | | | | | | | | | | | | | | |
| --- | --- | --- | --- | --- | --- | --- | --- | --- | --- | --- | --- | --- | --- | --- | --- | --- | --- | --- | --- | --- | --- | --- | --- | --- | --- | --- |
| | | | | | | | | | | | | | | | | | | | | | | | | | | |
| | Common Stock | | | | | | | | | | | | | | | | | | | | | | | | | |
| | | | | | | | | | | | | | | | | | | | | | | | | | | |
| | | | | | | | | | | | | | | | | | | | | | | | | | | |
| | | | | | | | | | | | | | | | | | | | | | | | | | | |
| Repurchase of common stock | (4,398 | ) | | | | | | | | | | (331,708 | | ) | | | | | | | | | | (331,708 | | ) |
| Dividends paid | | | | | | | | | | | | | | | | | | | | (122,272 | | ) | | (122,272 | | ) |
| Change in fair value of interest rate swap, net of taxes | | | | | | | | | | | | | | | | 1,392 | | | | | | | | 1,392 | | |
| Net income | | | | | | | | | | | | | | | | | | | | 437,120 | | | | 437,120 | | |
| Stockholders' equity at December 31, 2016 | 130,795 | | | $ | 1,360 | | | $ | 671,515 | | | $ | (1,761,498 | ) | | $ | 1,392 | | | $ | 2,540,449 | | | $ | 1,453,218 | |
[Index](#s280A637900D555ED970FF69A42C39D1F)
(in thousands)
| | (53 weeks) | | | | (52 weeks) | | | | (52 weeks) | | |
| Net income | $ | 437,120 | | | $ | 410,395 | | | $ | 370,885 | |
| Acquisition of Petsense, net of cash acquired | (143,610 | | ) | | — | | | | — | | |
| Debt issuance costs | (1,380 | | ) | | — | | | | — | | |
[Index](#sFE311CB6ABB9555D9B4B73BA146651C6)
February 22, 2016
| Total current assets | 1,485,431 | | | | 1,273,990 | | |
| Goodwill | 10,258 | | | | 10,258 | | |
| Deferred income taxes | 9,224 | | | | 8,782 | | |
| Revolving credit loan | 150,000 | | | | — | | |
| | | | | | | | | | | | | | | | | | | | |
| --- | --- | --- | --- | --- | --- | --- | --- | --- | --- | --- | --- | --- | --- | --- | --- | --- | --- | --- | --- |
| Stockholders' equity at December 29, 2012 | $ | 1,307 | | | $ | 361,106 | | | $ | (709,172 | ) | | $ | 1,371,733 | | | $ | 1,024,974 | |
| Net income | | | | | | | | | | | | | 328,234 | | | | 328,234 | | |
| Decrease in restricted cash | — | | | | — | | | | | 8,400 | | |
| Repurchase of common stock | (292,705 | | ) | | (298,497 | | ) | | | (129,416 | | ) |
| Cash dividends paid to stockholders | (103,101 | | ) | | (84,061 | | ) | | | (68,484 | | ) |
The Company’s comprehensive income is equal to net income in fiscal 2015, 2014 and 2013.
Leasehold improvements added late in the lease term are amortized over the term of the lease (including the first renewal option, if the renewal is reasonably assured) or the useful life of the improvement, whichever is less.
All goodwill is associated with the Company as a whole.
| | | | | | |
| --- | --- | --- | --- | --- | --- |
| Outstanding December 29, 2012 | 6,060,382 | | | $ | 19.48 | | | | | | | 6.6 | | $ | 147,229 | |
| Granted | 1,027,251 | | | 51.87 | | | | $ | 14.67 | | | | | | | |
| Exercised | (2,681,225 | ) | | 12.95 | | | | | | | | | | | | |
| Canceled | (97,360 | ) | | 43.27 | | | | | | | | | | | | |
| Exercisable at December 26, 2015 | 1,965,084 | | | $ | 37.53 | | | | | | | 5.8 | | $ | 94,598 | |
| Restricted at December 29, 2012 | | 603,394 | | | $ | 18.76 | |
| Granted | | 59,864 | | | 51.72 | | |
| Exercised | | (244,462 | ) | | 14.00 | | |
| Forfeited | | (5,638 | ) | | 36.24 | | |
The 2011 Senior Credit Facility was unsecured and would have matured on October 24, 2016.
As a result of the maturity date in the new agreement, the Company has presented any outstanding borrowings under the 2011 Senior Credit Facility as of December 26, 2015 as a non-current liability in the Consolidated Balance Sheet in accordance with the applicable accounting guidance.
There were no compensating balance requirements associated with the 2011 Senior Credit Facility.
The 2011 Senior Credit Facility required quarterly compliance with respect to two material covenants: a fixed charge coverage ratio and a leverage ratio.
The 2011 Senior Credit Facility also contained certain other restrictions regarding additional indebtedness, capital expenditures, business operations, guarantees, investments, mergers, consolidations and sales of assets, transactions with subsidiaries or affiliates, and liens.
Borrowings for both the term loan and the revolving credit facility bear interest at either the bank’s base rate or LIBOR plus an additional amount ranging from 0.500% to 1.125% per annum, adjusted quarterly based on our leverage ratio.
The Company is also required to pay, quarterly in arrears, a commitment fee for unused capacity ranging from 0.075% to 0.200% per annum, adjusted quarterly based on the Company’s leverage ratio.
Proceeds from the 2016 Senior Credit Facility are available to be used for working capital, capital expenditures, dividends, share repurchases, and other matters.
The fixed charge coverage ratio compares consolidated EBITDAR to the sum of interest paid and rental expense (excluding any straight-line rent adjustments).
The leverage ratio compares total debt plus rental expense (excluding any straight-line rent adjustments) multiplied by a factor of six to consolidated EBITDAR.
| 2016 | $ | 1,876 | | | $ | 265,327 | |
| 2017 | 1,876 | | | | 258,361 | | |
| 2018 | 1,876 | | | | 249,250 | | |
An excerpt. Shown here: 40 of 302 rewritten, 40 of 292 added and 40 of 82 removed. The counts are complete. For every sentence, read Item 8. Financial Statements and Supplementary Data in the FY2016 filing and the FY2015 filing.
Item 9A. Controls and Procedures
2 rewritten, 0 added, 0 removed, 6 unchanged
We carried out an evaluation required by the Securities Exchange Act of 1934, as amended (the “1934 Act”), under the supervision and with the participation of our principal executive officer and principal financial officer, of the effectiveness of the design and operation of our disclosure controls and procedures (as defined in Rule 13a-15(e) and 15d-15(e) under the 1934 Act) as of December [removed: 26, 2015.][added: 31, 2016.]
Based on this evaluation, our principal executive officer and principal financial officer concluded that, as of December [removed: 26, 2015] [added: 31, 2016,] our disclosure controls and procedures were effective.
Item 10. Directors, Executive Officers and Corporate Governance
2 rewritten, 1 added, 4 removed, 4 unchanged
The information set forth under the captions “Item 1: Election of Directors,” “Board Meetings and Committees,” and “Section 16(a) Beneficial Ownership Reporting Compliance” in our Proxy Statement for our Annual Meeting of Stockholders to be held on May [removed: 3, 2016] [added: 9, 2017,] is incorporated herein by reference.
A copy of the Code of Ethics can also be obtained, free of charge, upon written request to the Corporate Secretary, Tractor Supply Company, 5401 Virginia Way, [added: Brentwood, TN 37027.]
[Index](#s280A637900D555ED970FF69A42C39D1F)
[Index](#sFE311CB6ABB9555D9B4B73BA146651C6)
Brentwood, TN 37027.
| | |
| --- | --- |
Item 11. Executive Compensation
1 rewritten, 0 added, 0 removed, 0 unchanged
The information set forth under the captions “Corporate Governance – Compensation Committee Interlocks and Insider Participation,” “Compensation of Directors,” and “Executive Compensation” in our Proxy Statement for our Annual Meeting of Stockholders to be held on May [removed: 3, 2016] [added: 9, 2017,] is incorporated herein by reference.
Item 12. Security Ownership of Certain Beneficial Owners and Management and Related Stockholder Matters
4 rewritten, 2 added, 2 removed, 11 unchanged
The information set forth under the caption “Security Ownership of Certain Beneficial Owners and Management” in our Proxy Statement for our Annual Meeting of Stockholders to be held on May [removed: 3, 2016] [added: 9, 2017,] is incorporated herein by reference.
Following is a summary of our equity compensation plans as of December [removed: 26, 2015,] [added: 31, 2016,] under which equity securities are authorized for issuance, aggregated as follows:
| Employee Stock Purchase Plan | | — | | | — | | | | [removed: 12,163,549] [added: 12,093,987] | |
(a) Includes [removed: 3,861,506] [added: 3,973,747 outstanding] stock options, [removed: 166,673] [added: 154,142] unvested restricted stock units and [removed: 52,944] [added: 39,889] restricted stock units which have vested but the receipt of which have been deferred by the recipient.
| Stock Incentive Plans | | 4,167,778 | | (a) | $ | 62.39 | | (b) | 3,773,031 | |
| Total | | 4,167,778 | | | $ | 62.39 | | | 15,867,018 | |
| Stock Incentive Plans | | 4,081,123 | | (a) | $ | 51.99 | | (b) | 4,802,224 | |
| Total | | 4,081,123 | | | $ | 51.99 | | | 16,965,773 | |
Item 13. Certain Relationships and Related Transactions, and Director Independence
1 rewritten, 0 added, 0 removed, 0 unchanged
The information set forth under the captions “Corporate Governance [removed: -] [added: –] Director Independence and Board Operations” and [removed: “Related-Party] [added: “Related – Party] Transactions” in our Proxy Statement for our Annual Meeting of Stockholders to be held on May [removed: 3, 2016] [added: 9, 2017,] is incorporated herein by reference.
Item 14. Principal Accountant Fees and Services
1 rewritten, 1 added, 1 removed, 1 unchanged
The information set forth under the caption “Item 2 – Ratification of Reappointment of Independent Registered Public Accounting Firm” in our Proxy Statement for our Annual Meeting of Stockholders to be held on May [removed: 3, 2016,] [added: 9, 2017,] is incorporated herein by reference.
[Index](#s280A637900D555ED970FF69A42C39D1F)
[Index](#sFE311CB6ABB9555D9B4B73BA146651C6)
Item 15. Exhibits and Financial Statement Schedules
38 rewritten, 5 added, 7 removed, 87 unchanged
See Consolidated Financial Statements under Item 8 on pages [removed: 39] [added: 40] through [removed: 59] [added: 69] of this Form 10-K.
The exhibits listed in the Index to Exhibits, which appears on pages [removed: 63] [added: 73] through [removed: 65] [added: 75] of this Form 10-K, are incorporated herein by reference or filed as part of this Form 10-K.
| Date: | February [removed: 22, 2016] [added: 23, 2017] | By: | /s/ Anthony F. Crudele Executive Vice President – Chief Financial Officer and Treasurer |
| /s/ Anthony F. Crudele Anthony F. Crudele | Executive Vice President – Chief Financial Officer and Treasurer (Principal Financial and Accounting Officer) | | February [removed: 22, 2016] [added: 23, 2017] |
| /s/ Gregory A. Sandfort Gregory A. Sandfort | [removed: President and] Chief Executive Officer and Director (Principal Executive Officer) | | February [removed: 22, 2016] [added: 23, 2017] |
| /s/ Cynthia T. Jamison Cynthia T. Jamison | Chairman of the Board | | February [removed: 22, 2016] [added: 23, 2017] |
| /s/ Johnston C. Adams Johnston C. Adams | Director | | February [removed: 22, 2016] [added: 23, 2017] |
| /s/ Peter D. Bewley Peter D. Bewley | Director | | February [removed: 22, 2016] [added: 23, 2017] |
| /s/ Keith R. Halbert Keith R. Halbert | Director | | February [removed: 22, 2016] [added: 23, 2017] |
| /s/ George MacKenzie George MacKenzie | Director | | February [removed: 22, 2016] [added: 23, 2017] |
| /s/ Edna K. Morris Edna K. Morris | Director | | February [removed: 22, 2016] [added: 23, 2017] |
| /s/ Mark J. Weikel Mark J. Weikel | Director | | February [removed: 22, 2016] [added: 23, 2017] |
| 3.2 | [removed: Fourth] [added: Fifth] Amended and Restated By-laws (filed as Exhibit [removed: 3.1] [added: 3.1(i)] to Registrant’s Current Report on Form 8-K, filed with the Commission on [removed: August 6, 2014,] [added: February 15, 2017,] Commission File No. 000-23314, and incorporated herein by reference). |
| [removed: 10.11] [added: 10.15] | Tractor Supply [removed: Co. 2004 Cash] [added: Company 2006 Stock] Incentive [removed: Plan, effective April 15, 2004] [added: Plan] (filed as Exhibit [removed: 10.1] [added: 99.1] to [added: the] Registrant’s [removed: Quarterly] [added: Current] Report on Form [removed: 10-Q,] [added: 8-K] filed with the Commission on [removed: August 4, 2004,] [added: April 27, 2006,] Commission File No. [removed: 000-23314,] [added: 000-23314] and incorporated herein by [removed: reference).] [added: reference).+] |
| [removed: 10.12] [added: 10.11] | Form of Incentive Stock Option Agreement under the 2000 Stock Incentive Plan (filed as Exhibit 10.46 to Registrant’s Annual Report on Form 10-K, filed with the Commission on March 10, 2005, Commission File No. 000-23314, and incorporated herein by reference).+ |
| [removed: 10.13] [added: 10.12] | Form of Incentive Stock Option Agreement under the 2000 Stock Incentive Plan (filed as Exhibit 10.44 to Registrant’s Annual Report on Form 10-K, filed with the Commission on March 16, 2006, Commission File No. 000-23314, and incorporated herein by reference).+ |
| [removed: 10.14] [added: 10.13] | Form of Incentive Stock Option Agreement under the 2006 Stock Incentive Plan (filed as Exhibit 10.39 to Registrant’s Annual Report on Form 10-K, filed with the Commission on February 28, 2007, Commission File No. 000-23314, and incorporated herein by reference).+ |
| [removed: 10.15] [added: 10.14] | Form of Incentive Stock Option Agreement under the 2006 Stock Incentive Plan (filed as Exhibit 10.45 to Registrant’s Annual Report on Form 10-K, filed with the Commission on February 27, 2008, Commission File No. 000-23314, incorporated herein by reference).+ |
| [removed: 10.16] [added: 10.18] | Tractor Supply Company [removed: 2006] [added: 2009] Stock Incentive Plan (filed as Exhibit 99.1 to [removed: the] Registrant’s Current Report on Form [removed: 8-K] [added: 8-K,] filed with the Commission on April [removed: 27, 2006,] [added: 14, 2009,] Commission File No. [removed: 000-23314] [added: 000-23314,] and incorporated herein by reference).+ |
| [removed: 10.17] [added: 10.16] | Second Amendment to the Tractor Supply Company 2006 Stock Incentive Plan, effective February 8, 2007 (filed as Exhibit 10.38 to Registrant’s Annual Report on Form 10-K, filed with the Commission on February 28, 2007, Commission File No. 000-23314, and incorporated herein by reference.)+ |
| [removed: 10.18] [added: 10.17] | Form of Incentive Stock Option Agreement under the 2006 Stock Incentive Plan (filed as Exhibit 10.41 to the Registrant’s Annual Report on Form 10-K, filed with the Commission on February 25, 2009, Commission File No. 000-23314, and incorporated herein by reference).+ |
| 10.19 | [added: Form of Incentive Stock Option Agreement under the] Tractor Supply Company 2009 Stock Incentive Plan (filed as Exhibit [removed: 99.1] [added: 10.44] to Registrant’s [removed: Current] [added: Quarterly] Report on Form [removed: 8-K,] [added: 10-Q,] filed with the Commission on [removed: April 14,] [added: August 4,] 2009, Commission File No. 000-23314, and incorporated herein by reference).+ |
| [removed: 10.20] [added: 10.21] | Form of [removed: Incentive] [added: Nonqualified] Stock Option Agreement under the Tractor Supply Company 2009 Stock Incentive Plan (filed as Exhibit [removed: 10.44] [added: 10.46] to Registrant’s Quarterly Report on Form 10-Q, filed with the Commission on August 4, 2009, Commission File No. 000-23314, and incorporated herein by reference).+ |
| [removed: 10.21] [added: 10.20] | Form of Restricted Share Unit Agreement under the Tractor Supply Company 2009 Stock Incentive Plan (filed as Exhibit 10.45 to Registrant’s Quarterly Report on Form 10-Q, filed with the Commission on August 4, 2009, Commission File No. 000-23314, and incorporated herein by reference).+ |
| [removed: 10.22] [added: 10.29] | [removed: Form of Nonqualified Stock Option Agreement under] [added: First Amendment to] the Tractor Supply Company 2009 Stock Incentive [removed: Plan] [added: Plan, effective February 4, 2015] (filed as Exhibit [removed: 10.46] [added: 10.34] to [added: the] Registrant’s [removed: Quarterly] [added: Annual] Report on Form [removed: 10-Q,] [added: 10-K,] filed with the Commission on [removed: August 4, 2009,] [added: February 18, 2015,] Commission File No. 000-23314, and incorporated herein by [removed: reference).+] [added: reference) +] |
| [removed: 10.23] [added: 10.22] | Form of Director Restricted Stock Unit Award Agreement (filed as Exhibit 10.48 to Registrant’s Quarterly Report on Form 10-Q, filed with the Commission on November 2, 2009, Commission File No. 000-23314, and incorporated herein by reference).+ |
| [removed: 10.24] [added: 10.23] | Form of Restricted Share Unit Agreement for Officers (filed as Exhibit 10.49 to Registrant’s Quarterly Report on Form 10-Q, filed with the Commission on November 2, 2009, Commission File No. 000-23314, and incorporated herein by reference).+ |
| [removed: 10.25] [added: 10.24] | Form of Deferred Stock Unit Award Agreement for Directors (filed as Exhibit 10.50 to Registrant’s Quarterly Report on Form 10-Q, filed with the Commission on November 2, 2009, Commission File No. 000-23314, and incorporated herein by reference).+ |
| [removed: 10.26] [added: 10.25] | Compensation Recoupment Policy (filed as Exhibit 10.42 to Registrant’s Quarterly Report on Form 10-Q, filed with the Commission on May 3, 2011, Commission File No. 000-23314, and incorporated herein by reference).+ |
| [removed: 10.27] [added: 10.26] | Credit Agreement, dated as of October 24, 2011, by and among Tractor Supply Company, as Borrower, certain subsidiaries of the Company, certain lenders and Bank of America, N.A., as Administrative Agent for the lenders (filed as Exhibit 10.1 to Registrant’s Current Report on Form 8-K, filed with the Commission on October 28, 2011, Commission File No. 000-23314, and incorporated herein by reference). |
| [removed: 10.28] [added: 10.27] | First Amendment to Credit Agreement and Increase of Revolving Committed Amount dated May 16, 2014, by and among Tractor Supply Company, as Borrower, certain subsidiaries of the Company, certain lenders and Bank of America, N.A., as Administrative Agent for the lenders (filed as Exhibit 10.1 to Registrant’s Current Report on Form 8-K, filed with the Commission on May 21, 2014, Commission File No. 000-23314, and incorporated herein by reference). |
| [removed: 10.29] [added: 10.28] | [removed: Director Resignation Policy] [added: Transition Agreement dated March 10, 2014, by and between Tractor Supply Company and Kimberly D. Vella] (filed as Exhibit [removed: 10.3] [added: 10.1] to Registrant’s Current Report on Form 8-K, filed with the Commission on March [removed: 15, 2012,] [added: 14, 2014,] Commission File No. 000-23314, and incorporated herein by [removed: reference).] [added: reference).+] |
| [removed: 10.30] [added: 10.34] | Transition Agreement dated [removed: March 10, 2014,] [added: November 14, 2016,] by and between Tractor Supply Company and [removed: Kimberly D. Vella] [added: Anthony F. Crudele] (filed as Exhibit 10.1 to [removed: Registrant’s] [added: the] Current Report on Form 8-K, filed with the Commission on [removed: March 14, 2014,] [added: November 17, 2016,] Commission File No. 000-23314, and incorporated herein by [removed: reference).+] [added: reference.) +] |
| 10.31 | [removed: Form of] Amended and Restated [removed: Change in Control Agreement for Anthony F. Crudele] [added: Employment Agreement, dated March 17, 2015, by and between Tractor Supply Company and Greg A. Sandfort] (filed as Exhibit [removed: 10.1] [added: 10.2] to Registrant’s Current Report on Form 8-K, filed with the Commission on March [removed: 15, 2012,] [added: 18, 2015,] Commission File No. 000-23314, and incorporated herein by reference).+ |
| [removed: 10.32] [added: 10.30] | Form of Change in Control [removed: Agreement for] [added: Agreement, dated March 17, 2015, by and between Tractor Supply Company and] each of [removed: Benjamin F. Parrish, Jr.,] Steve K. [removed: Barbarick and] [added: Barbarick, Anthony F. Crudele,] Lee J. [removed: Downing] [added: Downing, Chad M. Frazell, Robert D. Mills and Benjamin F. Parrish, Jr.] (filed as Exhibit [removed: 10.2] [added: 10.1] to Current Report on Form 8-K, filed with the Commission on March [removed: 15, 2012,] [added: 18, 2015,] Commission File No. 000-23314, and incorporated herein by reference).+ |
| [removed: 10.33] [added: 10.32] | [removed: Employment] [added: Transition] Agreement [added: dated January 27, 2016, by and] between Tractor Supply Company and [removed: Greg A. Sandfort dated October 2, 2012] [added: Lee J. Downing] (filed as [removed: Exhibit 10.1] [added: exhibit 10.37] to [removed: Registrant’s Current] [added: the Annual] Report on Form [removed: 8-K,] [added: 10-K,] filed with the Commission on [removed: October 2, 2012,] [added: February 23, 2016,] Commission [removed: File] No. 000-23314, and incorporated herein by [removed: reference).+] [added: reference). +] |
| [removed: 10.36] [added: 10.33] | [removed: Amended and Restated Employment] [added: Credit] Agreement, dated [removed: March 17, 2015,] [added: as of February 19, 2016,] by and [removed: between] [added: among] Tractor Supply [removed: Company] [added: Company, as Borrower, certain subsidiaries of the Company, certain lenders] and [removed: Greg A. Sandfort] [added: Wells Fargo Bank, National Association, as Administrative Agent and Regions Bank, as Syndication Agent, for the lenders] (filed as Exhibit [removed: 10.2] [added: 10.1] to [removed: Registrant’s] Current Report on Form 8-K, filed with the Commission on [removed: March 18, 2015,] [added: February 22, 2016,] Commission File No. 000-23314, and incorporated herein by [removed: reference).+] [added: reference).] |
| 101* | The following financial information from our Annual Report on Form 10-K for fiscal [removed: 2015,] [added: 2016,] filed with the SEC on February [removed: 22, 2016,] [added: 23, 2017,] formatted in Extensible Business Reporting Language (XBRL): (i) the Consolidated Balance Sheets at December [removed: 26, 2015] [added: 31, 2016] and December [removed: 27, 2014,] [added: 26, 2015,] (ii) the Consolidated Statements of Income for [added: the fiscal] years ended December [added: 31, 2016, December] 26, 2015, [added: and] December 27, 2014, [added: (iii) the Consolidated Statements of Comprehensive Income for the fiscal years ended December 31, 2016, December 26, 2015,] and December [removed: 28, 2013, (iii)] [added: 27, 2014, (iv)] the Consolidated Statements of Cash Flows for [added: the fiscal] years ended December [added: 31, 2016, December] 26, 2015, [added: and] December 27, 2014, [removed: and December 28, 2013, (iv)] [added: (v)] the Consolidated Statements of Stockholders’ Equity for the [added: fiscal] years ended December [added: 31, 2016, December] 26, 2015, [added: and] December 27, 2014, and [removed: December 28, 2013, and (v)] [added: (vi)] the Notes to Consolidated Financial Statements. |
[Index](#s280A637900D555ED970FF69A42C39D1F)
| /s/ Ramkumar Krishnan Ramkumar Krishnan | Director | | February 23, 2017 |
[Index](#s280A637900D555ED970FF69A42C39D1F)
[Index](#s280A637900D555ED970FF69A42C39D1F)
[Index](#s280A637900D555ED970FF69A42C39D1F)
[Index](#sFE311CB6ABB9555D9B4B73BA146651C6)
| /s/ Richard W. Frost Richard W. Frost | Director | | February 22, 2016 |
| | |
| 10.34 | First Amendment to the Tractor Supply Company 2009 Stock Incentive Plan, effective February 4, 2015 (filed as Exhibit 10.34 to the Registrant’s Annual Report on Form 10-K, filed with the Commission on February 18, 2015, Commission File No. 000-23314, and incorporated herein by reference) + |
| 10.35 | Form of Change in Control Agreement, dated March 17, 2015, by and between Tractor Supply Company and each of Steve K. Barbarick, Anthony F. Crudele, Lee J. Downing, Chad M. Frazell, Robert D. Mills and Benjamin F. Parrish, Jr. (filed as Exhibit 10.1 to Current Report on Form 8-K, filed with the Commission on March 18, 2015, Commission File No. 000-23314, and incorporated herein by reference).+ |
| 10.37* | Transition Agreement dated January 27, 2016, by and between Tractor Supply Company and Lee J. Downing. + |
| 10.38 | Credit Agreement, dated as of February 19, 2016, by and among Tractor Supply Company, as Borrower, certain subsidiaries of the Company, certain lenders and Wells Fargo Bank, National Association, as Administrative Agent and Regions Bank, as Syndication Agent, for the lenders (filed as Exhibit 10.1 to Current Report on Form 8-K, filed with the Commission on February 22, 2016, Commission File No. 000-23314, and incorporated herein by reference). |