 filings.tools
Tyson Foods (TSN) 10-K risk factor changes: FY2016 vs FY2015
The 2016-10-01 10-K against the 2015-10-03 one, compared heading by heading and sentence by sentence. One of these filings carries no fiscal year tag, so its year is the calendar year of the period end.
Item 1A23 rewritten7 added1 removed298 unchanged
All filing items1,019 rewritten352 added531 removed2,401 unchanged
Summary
counted, not written
- Item 1A headings could not be compared: only 0 carried over between the two years, which usually means one filing was read wrongly, so none is reported as new or removed.
- Sentence by sentence, 352 added, 531 removed, 1,019 rewritten and 2,401 unchanged across 17 items that differ.
Sentences by item
21 items, with every count and a link to each item that changed
Underlined words on a shaded ground are new in FY2016; struck-through words were in FY2015. Sentences that are wholly new or wholly gone are labelled rather than marked.
Item 1A. RISK FACTORS
23 rewritten, 7 added, 1 removed, 298 unchanged
Our actual [removed: cost-savings] [added: cost savings] could differ materially from our current estimates.
Actual [removed: cost-savings,] [added: cost savings,] the costs required to realize the [removed: cost-savings] [added: cost savings] and the source of the [removed: cost-savings] [added: cost savings] could differ materially from our estimates, and we cannot assure you that we will achieve the full amount of [removed: cost-savings] [added: cost savings] on the schedule anticipated or at all or that these [removed: cost-savings] [added: cost savings] programs will not have other adverse effects on our business.
In light of these uncertainties, you should not place undue reliance on our estimated [removed: cost-savings.][added: cost savings.]
Corn, soybean meal and other feed ingredients, for instance, represented roughly [removed: 64%] [added: 57%] of our cost of growing a live chicken in fiscal [removed: 2015.][added: 2016.]
However, outbreaks of disease and other events, which may be beyond our control, either in our own livestock or [removed: cattle and hogs] [added: livestock] owned by independent producers who sell livestock to us, could significantly affect demand for our products, consumer perceptions of certain protein products, the availability of livestock for purchase by us and our ability to conduct our operations.
In fiscal [removed: 2015,] [added: 2016,] we sold products to approximately [removed: 130] [added: 115] countries.
Major sales markets include [removed: Brazil,] Canada, Central America, China, the European Union, Japan, Mexico, the Middle East, South [removed: Korea,] [added: Korea] and Taiwan.
Our sales to customers in foreign countries for fiscal [removed: 2015] [added: 2016] totaled [removed: $5.2] [added: $4.1] billion, of which [removed: $4.1] [added: $3.5] billion related to export sales from the United States.
In addition, we had approximately [removed: $191] [added: $204] million of long-lived assets located in foreign countries, primarily Brazil, China, and India, at the end of fiscal [removed: 2015.][added: 2016.]
We have approximately [removed: 113,000] [added: 114,000] employees, approximately [removed: 36,000] [added: 33,000] of whom are covered by collective bargaining agreements or are members of labor unions.
As of October [removed: 3, 2015,] [added: 1, 2016,] we had $10.7 billion of goodwill and indefinite life intangible assets, which represented approximately [removed: 47%] [added: 48%] of total assets.
Legal claims, [added: class action lawsuits,] other regulatory enforcement actions, or failure to comply with applicable legal standards or requirements could affect our product sales, reputation and profitability.
Legal claims or regulatory enforcement actions arising out of our failure or alleged failure to comply with applicable laws and [removed: regulations] [added: regulations, including those contained in Item 3, Legal Proceedings and Part II, Item 8, and Notes to Consolidated Financial Statements, Note 19: Commitments and Contingencies in this Annual Report on Form 10-K,] could subject us to civil and criminal [removed: penalties] [added: penalties, including debarment from governmental contracts] that could materially and adversely affect our product sales, reputation, financial condition and results of operations.
Like other companies, our information technology systems may be vulnerable to a variety of [removed: interruptions,] [added: disruptions,] including [removed: during] [added: but not limited to] the process of upgrading or replacing software, databases or components thereof, natural disasters, terrorist attacks, telecommunications failures, computer viruses, cyber-attacks, hackers, unauthorized access attempts and other security issues.
We have implemented [removed: technology] [added: and continue to evaluate] security initiatives and disaster recovery plans to mitigate our exposure to these risks, but these measures may not be adequate.
Any significant failure of our systems, including failures that prevent our systems from functioning as [removed: intended,] [added: intended or our failure to timely identify or appropriately respond to cyber-attacks or other cyber incidents,] could cause transaction errors, processing inefficiencies, loss of customers and sales, have negative consequences on our employees and our business [removed: partners and] [added: partners,] have a negative impact on our operations or business [removed: reputation.][added: reputation and expose us to liability, litigation and regulatory enforcement actions.]
In addition, if we are unable to prevent security breaches, we may suffer financial and reputational damage or penalties because of the unauthorized disclosure of confidential information belonging to us or to our [added: business] partners, customers, consumers or suppliers.
[removed: In addition,] [added: Finally,] the disclosure of non-public [removed: sensitive] information through external media channels could lead to the loss of intellectual property or damage our reputation and brand image.
Our business could suffer significant setbacks in sales and operating income if our customers’ plans and/or markets change significantly or if we lost one or more of our largest customers, including, for example, Wal-Mart Stores, Inc., which accounted for [removed: 16.8%] [added: 17.5%] of our sales in fiscal [removed: 2015.][added: 2016.]
Natural disasters, fire, bioterrorism, pandemic or extreme weather, including droughts, floods, excessive cold or heat, hurricanes or other storms, could impair the health or growth of livestock or interfere with our operations due to power outages, fuel shortages, [added: decrease in availability of water,] damage to our production and processing facilities or disruption of transportation channels, among other things.
As of October [removed: 3, 2015,] [added: 1, 2016,] Tyson Limited Partnership (the TLP) owns 99.985% of the outstanding shares of the Company's Class B Common Stock, $0.10 par value (Class B stock) and the TLP and members of the Tyson family own, in the aggregate, [removed: 1.79%] [added: 2.06%] of the outstanding shares of the Company's Class A Common Stock, $0.10 par value (Class A stock), giving them, collectively, control of approximately [removed: 70.64%] [added: 71.18%] of the total voting power of the Company's outstanding voting stock.
As of October [removed: 3, 2015,] [added: 1, 2016,] Mr. John Tyson, Chairman of the Board of Directors, has 33.33% of the general partner percentage interests, and Ms. Barbara Tyson, a director of the Company, has 11.115% general partner percentage interests (the remaining general partnership interests are held by the Tyson Partnership Interest Trust (44.44%) and Harry C.
As of October [removed: 3, 2015,] [added: 1, 2016,] the funded status of our defined benefit pension plans was an underfunded position of [removed: $410] [added: $336] million, as compared to an underfunded position of [removed: $381] [added: $410] million at the end of fiscal [removed: 2014.][added: 2015.]
If we are unable to attract, hire or retain key employees or a highly skilled and diverse global workforce, it could have a negative impact on our business, financial condition or results of operations.
Our continued growth requires us to attract, hire, retain and develop key employees, including our executive officers and senior management team, and maintain a highly skilled and diverse global workforce.
We compete to attract and hire highly skilled employees and our own employees are highly sought after by our competitors and other companies.
Competition could cause us to lose talented employees, and unplanned turnover could deplete our institutional knowledge and result in increased costs due to increased competition for employees.
We are increasingly dependent on information technology, and our business and reputation could suffer if we are unable to protect our information technology systems against, or effectively respond to, cyber-attacks, other cyber incidents or security breaches or if our information technology systems are otherwise disrupted.
Attempted cyber-attacks and other cyber incidents are occurring more frequently, are constantly evolving in nature, are becoming more sophisticated and are being made by groups and individuals with a wide range of motives and expertise.
Similar risks exist with respect to the third-party vendors that we rely upon for aspects of our information technology support services and administrative functions, including health and benefit plan administration and certain finance and accounting functions, and systems managed, hosted, provided and/or used by third parties and their vendors.
Failures or security breaches of our information technology systems could disrupt our operations and negatively impact our business.
Item 7. MANAGEMENT’S DISCUSSION AND ANALYSIS OF FINANCIAL CONDITION AND RESULTS OF OPERATIONS
154 rewritten, 77 added, 75 removed, 576 unchanged
Other [removed: now] [added: primarily] includes our foreign chicken production operations in China and India and third-party merger and integration costs.
| • | Fiscal year – Our accounting cycle resulted in a [removed: 53-week] [added: 52-week] year for [added: both] fiscal [removed: 2015] [added: 2016] and [added: 2014 and] a [removed: 52-week] [added: 53-week] year for [removed: 2014 and 2013.] [added: fiscal 2015.] |
| • | General – [removed: Operating] [added: Our operating] income grew [removed: 52%] [added: 31%] in fiscal [removed: 2015] [added: 2016] over fiscal [removed: 2014,] [added: 2015,] which was led by [added: the Beef segment's $413 million improvement in operating income and] record earnings in our [removed: Chicken and] Prepared Foods [added: segment, as well as continued strong performance in the Chicken and Pork] segments. Sales [removed: increased 10%] [added: decreased 11% in fiscal 2016 over fiscal 2015, primarily due] to [removed: a record $41.4 billion, driven by price and mix improvements,] [added: declining beef prices,] the [removed: incremental] impact of [removed: Hillshire Brands] [added: an additional week in fiscal 2015] and the [removed: positive impact] [added: sale] of [removed: 53 weeks in fiscal 2015.] [added: our Brazil and Mexico chicken production operations.] We continued to execute our strategy of accelerating growth in domestic value-added chicken sales, prepared food sales, innovating products, services and customer insights and cultivating our talent development to support Tyson's growth for the future. |
| • | [removed: Hillshire] Integration – We continue to maintain focus on the integration of Hillshire Brands and synergy capture. [removed: As we execute our Prepared Foods strategy, we estimate the impact] [added: We expect to realize synergies] of [removed: the Hillshire Brands synergies, along with] [added: around $675 million in fiscal 2017 from] the [added: acquisition as well as our] profit improvement plan [removed: related to] [added: for] our legacy Prepared Foods [removed: business, will have a positive impact of more than $500 million] [added: business. The amount expected to be realized] in fiscal [removed: 2016 and more than] [added: 2017 is reduced from our previous estimate of] $700 million [removed: by] [added: as some of the incremental synergies are now expected to be realized in] fiscal [removed: 2017.] [added: 2018.] The majority of these benefits are expected to be realized in the Prepared Foods segment. We will [added: continue to] invest a portion of the synergies in innovation, new product launches and [removed: strengthening] [added: support the growth of] our brands. In fiscal [removed: 2015,] [added: 2016,] we captured [removed: $322] [added: $258] million of [added: incremental] synergies [removed: and profit improvement initiatives,] [added: above the $322 million captured in fiscal 2015, for a total] of [removed: which $285] [added: $580] million [removed: impacted the Prepared Foods segment.] [added: of synergies realized in fiscal 2016.] |
| • | Market [removed: environment] [added: Environment] – [added: Domestic protein production (chicken, beef, pork and turkey according to the USDA) increased approximately 3% in fiscal 2016 over fiscal 2015 and export market conditions experienced some improvement over fiscal 2015.] Our Chicken segment delivered [removed: record] [added: strong] results in fiscal [removed: 2015] [added: 2016] driven by [removed: strong] [added: favorable] demand [added: for our products] and [added: lower feed costs. The Beef segment earnings improved over fiscal 2015 due to more] favorable [removed: domestic] market [removed: conditions, partially offset by disruptions caused by export bans.] [added: conditions associated with an increase in cattle supply which resulted in lower fed cattle costs.] The Pork [removed: segment results remained in its normalized] [added: segment's] operating margin [removed: range, but were down from last year due to unfavorable] [added: was above its normalized range as domestic] market conditions [removed: from a decline in exports] [added: were favorable with lower livestock cost] and [removed: periods of] increased [removed: domestic availability of] [added: demand for our] pork products. Our Prepared Foods segment delivered record operating income [removed: and operating margins] as we continued to [removed: execute our profit improvement plan] [added: realize synergies] and [removed: integrate Hillshire Brands. The Beef segment experienced a loss driven by] lower [removed: availability of fed cattle supplies, higher fed cattle] [added: input] costs, [removed: export market disruptions,] [added: partially offset with higher marketing, advertising,] and [removed: reduced demand for premium beef products due to the relative value of competing proteins.] [added: promotion spend.] |
| • | Margins – Our total operating margin was [removed: 5.2%] [added: 7.7%] in fiscal [removed: 2015.] [added: 2016.] Operating margins by segment were as follows: |
| • | Liquidity – During fiscal [removed: 2015,] [added: 2016,] we generated [removed: $2.6] [added: $2.7] billion of operating cash flows. We repurchased [removed: 11.0] [added: 30.8] million shares of our Class A common stock for [removed: $455] [added: $1,868] million under our share repurchase program in fiscal [removed: 2015.] [added: 2016.] At October [removed: 3, 2015,] [added: 1, 2016,] we had [removed: $1.9] [added: $1.3] billion of liquidity, which included the availability under our revolving credit facility and [removed: $688] [added: $349] million of cash and cash equivalents. |
| | [removed: 2015] [added: 2016] | | | | [removed: 2014] [added: 2015] | | | | [removed: 2013] [added: 2014] | | |
| Net income [removed: from continuing operations] attributable to Tyson | $ | [removed: 1,220] [added: 1,768] | | | $ | [removed: 864] [added: 1,220] | | | $ | [removed: 848] [added: 864] | |
| Net income [removed: from continuing operations] attributable to Tyson [removed: –] [added: -] per diluted share | [removed: 2.95] [added: 4.53] | | | | [removed: 2.37] [added: 2.95] | | | | [removed: 2.31] [added: 2.37] | | |
[removed: 2013] [added: 2016] – Included the following [removed: item:][added: items:]
| Sales | $ | [removed: 41,373] [added: 36,881] | | | $ | [removed: 37,580] [added: 41,373] | | | $ | [removed: 34,374] [added: 37,580] | |
| Change in sales volume | [removed: 5.0] [added: (4.6] | | [removed: %] [added: )%] | | [removed: 2.4] [added: 5.0] | | % | | | | |
| Change in average sales price | [removed: 4.8] [added: (6.5] | | [removed: %] [added: )%] | | [removed: 6.9] [added: 4.8] | | % | | | | |
| Sales growth | [removed: 10.1] [added: (10.9] | | [removed: %] [added: )%] | | [removed: 9.3] [added: 10.1] | | % | | | | |
| Cost of sales | $ | [removed: 37,456] [added: 32,184] | | | $ | [removed: 34,895] [added: 37,456] | | | $ | [removed: 32,016] [added: 34,895] | |
| Gross profit | [removed: 3,917] [added: 4,697] | | | | [removed: 2,685] [added: 3,917] | | | | [removed: 2,358] [added: 2,685] | | |
| Cost of sales as a percentage of sales | [removed: 90.5] [added: 87.3] | | % | | [removed: 92.9] [added: 90.5] | | % | | [removed: 93.1] [added: 92.9] | | % |
| • | Cost of sales [removed: increased] [added: decreased] by approximately [removed: $2.9] [added: $5.3] billion. [removed: Higher] [added: Lower] input costs per pound [removed: increased] [added: decreased] cost of sales [removed: $2.3] [added: approximately $3.6] billion and [removed: higher] [added: lower] sales volume [removed: increased] [added: decreased] cost of sales [removed: $610 million.] [added: approximately $1.7 billion.] |
| • | The [removed: $2.3] [added: approximate $3.6] billion impact of [removed: higher] [added: lower] input costs was primarily driven by: |
| • | [removed: Increase] [added: Decrease] in raw material and other input costs [added: of approximately $300 million] in our Prepared Foods [removed: segment of approximately $210 million.] [added: segment.] |
| • | [removed: Increase] [added: Decrease] due to net [removed: losses] [added: realized derivative gains] of [removed: $260] [added: $96] million in fiscal [removed: 2014,] [added: 2016,] compared to net [removed: gains] [added: realized derivative losses] of [removed: approximately $5] [added: $102] million in fiscal [removed: 2013, from] [added: 2015 due to] our [removed: Beef and Pork segment commodity] risk management activities. These amounts exclude [removed: the impact] [added: offsetting impacts] from related physical purchase transactions, which [removed: mostly offset] [added: are included in] the [removed: losses.] [added: change in live cattle and hog costs and raw material and feed costs described above. Additionally, cost of sales increased due to net unrealized gains of $11 million in fiscal 2016, compared to net unrealized gains of $80 million in fiscal 2015, primarily due to our Chicken, Beef and Pork segment commodity risk management activities.] |
| • | [removed: Decrease] [added: Decreases] in feed costs of [removed: $600] [added: approximately $170] million in our Chicken segment. |
| Selling, general and administrative | $ | [removed: 1,748] [added: 1,864] | | | $ | [removed: 1,255] [added: 1,748] | | | $ | [removed: 983] [added: 1,255] | |
| As a percentage of sales | [removed: 4.2] [added: 5.1] | | % | | [removed: 3.3] [added: 4.2] | | % | | [removed: 2.9] [added: 3.3] | | % |
| • | Increase of [removed: $272] [added: $116] million in selling, general and administrative was primarily driven by: |
| • | Increase of [removed: $32] [added: $88] million related to [added: marketing,] advertising and [added: promotion expense to drive] sales [removed: promotions.] [added: growth.] |
[removed: 2015/2014/2013] [added: 2016/2015/2014] – Interest income remained relatively flat due to continued low interest rates.
| Cash interest expense | $ | [removed: 293] [added: 248] | | | $ | [removed: 132] [added: 293] | | | $ | [removed: 124] [added: 132] | |
| Non-cash interest expense | [removed: —] [added: 1] | | | | — | | | | [removed: 21] [added: —] | | |
| Total Interest Expense | $ | [removed: 293] [added: 249] | | | $ | [removed: 132] [added: 293] | | | $ | [removed: 145] [added: 132] | |
[removed: 2015/2014/2013 –][added: | | 2016 | | | | 2015 | | | | 2014 | | |]
| • | Cash interest expense primarily included interest expense related to the coupon rates for senior notes and term loans and commitment/letter of credit fees incurred on our revolving credit facilities. The [added: decrease in cash interest expense in fiscal 2016 was primarily due to a reduction of our debt. The] increase in cash interest expense in fiscal 2015 [removed: and 2014] was primarily due to senior notes and term loans issued and debt assumed in connection with our completed acquisition of Hillshire Brands on August 28, 2014. |
| • | Non-cash interest expense primarily included amounts related to the amortization of debt issuance costs and discounts/premiums on note issuances, offset by interest capitalized. [removed: The decrease in non-cash interest expense in fiscal 2015 and 2014 is primarily due the reduction in non-cash interest expense on our 2013 Notes which were retired in early fiscal 2014.] |
| | [removed: 2015] [added: 2016] | | | [removed: 2014] | [added: 2015] | | [removed: 2013] | | [added: 2014 | | |]
| | [removed: 36.3] [added: 31.8] | % | | [removed: 31.6] [added: 36.3] | % | | [removed: 32.6] [added: 31.6] | % |
| • | Domestic production activity deduction reduced the rate [removed: 3.2%.] [added: 2.6%.] |
| • | State income taxes increased the rate [removed: 2.4%.] [added: 2.7%.] |
Other [removed: now] [added: primarily] includes our foreign chicken production operations in China and [removed: India, in addition to] [added: India and] third-party merger and integration costs.
Additionally, the results from Dynamic Fuels, which was sold in fiscal 2014, are also included in Other [removed: in comparative periods.][added: fiscal 2014 results until the closing date of such sale.]
| • | Chicken – 11.9% |
| • | Beef – 2.4% |
| • | Pork – 10.8% |
| • | Prepared Foods – 10.0% |
| • | $53 million, or $0.14 per diluted share, related to recognition of previously unrecognized tax benefits and audit settlements. |
2016 vs. 2015 –
| • | Sales Volume – Sales were negatively impacted by lower sales volume, which accounted for a decrease of $1.9 billion. Each segment had a decline in sales volume primarily attributed to the additional week in fiscal 2015. The decrease in sales volume was also attributable to the divestitures of the Mexico and Brazil chicken production operations in fiscal 2015. When excluding these impacts along with the divestiture of our Heinold Hog Markets business in the first quarter of fiscal 2015, total company sales volume increased 0.1%. |
| • | Average Sales Price – Sales were negatively impacted by lower average sales prices, which accounted for a decrease of $2.6 billion. Each segment had a decrease in average sales prices largely due to decreased pricing associated with lower beef, pork, and chicken prices, with the largest decrease in the Beef segment. |
2016 vs. 2015 –
| • | Decrease in live cattle cost of approximately $2.6 billion in our Beef segment. |
| • | Decrease in live hog costs of approximately $360 million in our Pork segment. |
| • | The $1.7 billion impact of lower sales volume was primarily due to the sale of our Mexico chicken production operation in fiscal 2015 along with the additional week in fiscal 2015. |
2016 vs. 2015 –
| • | Increase of $71 million of employee costs including payroll and stock-based and incentive-based compensation. |
| • | Increase of $11 million related to bad debt expense. |
| • | Increase of $17 million in all other primarily related to professional fees, information technology costs and rent. |
| • | Decrease of $26 million due to a reduction in amortization and other expense related to our intangible assets. |
| • | Decrease of $25 million related to fiscal 2015 sale of our chicken production operations in Brazil and Mexico. |
| • | Decrease of $20 million of merger and integration costs. |
| | 2016 | | | | 2015 | | | | 2014 | | |
| | $ | (6 | ) | | $ | (9 | ) | | $ | (7 | ) |
| | 2016 | | | | 2015 | | | | 2014 | | |
2016/2015/2014 –
| | 2016 | | | | 2015 | | | | 2014 | | |
| | $ | (8 | ) | | $ | (36 | ) | | $ | 53 | |
2016 – Included $12 million of equity earnings in joint ventures and $4 million in net foreign currency exchange losses.
| | 2016 | | | 2015 | | | 2014 | |
| • | Unrecognized tax benefits activity, mostly related to expiration of statutes of limitations and settlements with taxing authorities, reduced the rate 1.7%. |
| | 2016 | | | | 2015 | | | | 2014 | | | | 2016 | | | | 2015 | | | | 2014 | | |
2016 vs. 2015 –
| • | Sales Volume – Sales volume decreased primarily due to the additional week in fiscal 2015, in addition to a planned temporary decrease in production in the fourth quarter of fiscal 2016 while we transitioned our mix to sell more value-added and less commodity products along with optimizing our mix and our buy versus grow strategy. |
| • | Operating Income – Operating income was negatively impacted by the additional week in fiscal 2015 along with increases in operating costs and marketing, advertising and promotion expenses, partially offset by lower feed costs of $170 million. |
| | 2016 | | | | 2015 | | | | Change 2016 vs. 2015 | | | | 2014 | | | | Change 2015 vs. 2014 | | |
2016 vs. 2015 –
| • | Sales Volume – Sales volume decreased due to the additional week in fiscal 2015. When excluding the additional week in fiscal 2015, sales volume increased 0.8% due to increased availability of cattle supply and better demand for our beef products despite a reduction in live cattle processing capacity due to the closure of our Denison, Iowa, facility in the fourth quarter of fiscal 2015. |
| • | Operating Income – Operating income increased due to more favorable market conditions as we maximized our revenues relative to the decline in live fed cattle cost, in addition to reduced losses from mark-to-market open derivative positions and lower-of-cost-or market inventory adjustments that were incurred in the fourth quarter of fiscal 2015, partially offset by higher operating costs. |
| | 2016 | | | | 2015 | | | | Change 2016 vs. 2015 | | | | 2014 | | | | Change 2015 vs. 2014 | | |
2016 vs. 2015 –
| • | Sales Volume – Sales volume decreased due to the divestiture of our Heinold Hog Markets business in the first quarter of fiscal 2015 and the additional week in fiscal 2015. Excluding these impacts, sales volume grew 1.2%, driven by better demand for our pork products. |
| • | Operating Income – Operating income increased as we maximized our revenues relative to the decline in live hog markets and due to better plant utilization associated with increased volume processed, which were partially offset by higher operating costs, losses incurred in our live hog operation and the additional week in fiscal 2015. |
Following the sale of our Mexico and Brazil operations in fiscal 2015, we began reporting our international operation, which was previously reported as the International segment, in Other.
All periods presented have been reclassified to reflect this change.
Chicken, Beef, Pork and Prepared Foods results were not impacted by this change.
| • | Mexico – We recorded a $161 million pre-tax gain as a result of the sale of our Mexico operation in the fourth quarter of fiscal 2015. The gain is reflected in Other for segment reporting and included in Cost of Sales in the Consolidated Statements of Income. |
| • | China impairment – Following the sale of our Mexico and Brazil chicken production operations, we have continued to review our strategies and outlook for the remaining international businesses, which operations include our chicken production operations in China. Despite our belief in the potential for this business, our Chinese operations have not achieved profitability. Given the ongoing losses being generated in this business, recent changes in the strategy and management of the business, and the depressed economic outlook for China, we assessed our Chinese operations for potential impairment in the fourth quarter of fiscal 2015. As a result of this evaluation, during the fourth quarter of fiscal 2015, we recorded a $169 million impairment charge. The impairment was comprised of $126 million of property, plant and equipment, $23 million of goodwill and $20 million of other assets. The China operation is included in Other for segment reporting and the impairment is included in Cost of Sales in the Consolidated Statements of Income. |
| • | Chicken – 12.0% |
| • | Beef – (0.4)% (included $12 million closure and impairment charges related to the ceasing of beef operations at our Denison facility) |
| • | Pork – 7.2% |
| • | Prepared Foods – 7.5% (included $8 million in net insurance proceeds related to a legacy Hillshire Brands plant fire, $10 million in merger and integration costs and $59 million in Prepared Foods network optimization impairment charges) |
| | | | | | | | | | | | |
| Net loss from discontinued operation attributable to Tyson | — | | | | — | | | | (70 | | ) |
| Net loss from discontinued operation attributable to Tyson – per diluted share | — | | | | — | | | | (0.19 | | ) |
| Net income attributable to Tyson | 1,220 | | | | 864 | | | | 778 | | |
| Net income attributable to Tyson - per diluted share | 2.95 | | | | 2.37 | | | | 2.12 | | |
| • | $19 million, or $0.05 per diluted share, related to recognized currency translation adjustment gain. |
2014 vs. 2013 –
| • | Sales Volume – Sales were positively impacted by an increase in sales volume, which accounted for an increase of $679 million. All segments, with the exception of the Beef segment, had an increase in sales volume. Prepared Foods contributed to the majority of the increase due to the acquisition and consolidation of Hillshire Brands in our final month of fiscal 2014. |
| • | Average Sales Price – Sales were positively impacted by higher average sales price, which accounted for an increase of approximately $2.5 billion. Beef, Pork and Prepared Foods experienced increased average sales price, partially offset by decreased pricing in Chicken. The increase in average sales price was largely due to continued tight domestic availability of protein, increased pricing associated with rising live and raw material costs, and improved mix. The majority of the increase was driven by the Beef and Pork segments. |
| • | Increase in live cattle and live hog costs of approximately $1.7 billion and $550 million, respectively. |
| • | The $610 million impact of higher sales volume was driven by increases in all of our segments, with the exception of Beef. Chicken and Prepared Foods contributed to the majority of the increase, with the Prepared Foods increase mainly attributable to the acquisition and consolidation of Hillshire Brands in our final month of fiscal 2014. |
| • | Increase of $71 million related to employee costs including payroll and stock-based and incentive-based compensation, of which $19 million related to employee severance and retention costs associated with the Hillshire Brands acquisition and implementation of our Prepared Foods strategy. |
| • | Increase of $82 million related to professional fees, of which $52 million related to the Hillshire Brands acquisition and integration costs. |
| • | Increases of $17 million in information technology costs, $7 million in charitable contributions and donations and $5 million in commissions. |
| • | Increase of $50 million related to the Hillshire Brands selling, general and administrative post-closing expenses in our final month of fiscal 2014. |
| | $ | (9 | ) | | $ | (7 | ) | | $ | (7 | ) |
| | $ | (36 | ) | | $ | 53 | | | $ | (20 | ) |
2013 – Included $19 million related to recognized currency translation adjustment gain.
2013 –
| • | General business credits reduced the rate 1.3%. |
Following the sale of our Mexico and Brazil operations in fiscal 2015, we began reporting our international operation in Other, which was previously reported as the International segment.
| • | Sales Volume – Sales volume grew as a result of stronger demand for chicken products and mix of rendered product sales. |
| • | Operating Income – Operating income increased due to higher sales volume and lower feed ingredient costs of $600 million, partially offset by decreased average sales price. |
| • | Sales Volume – Sales volume decreased due to a reduction in live cattle processed. |
| • | Operating Income – Operating income increased due to improved operational execution and maximizing our revenues relative to the rising live cattle markets, partially offset by increased operating costs. |
| • | Derivative Activities – Operating results included net losses of $72 million in fiscal 2014, compared to net gains of $9 million in fiscal 2013 for commodity risk management activities related to futures contracts. These amounts exclude the impact from related physical sale and purchase transactions, which mostly offset the commodity risk management gains and losses. |
| • | Sales Volume – Sales volume increased due to better domestic demand for our pork products. |
| • | Operating Income – Operating income increased as we maximized our revenues relative to live hog markets, partially attributable to operational and mix performance. |
| • | Derivative Activities – Operating results included net losses of $112 million in fiscal 2014, compared to net losses of $15 million in fiscal 2013 for commodity risk management activities related to futures contracts. These amounts exclude the impact from related physical sale and purchase transactions, which mostly offset the commodity risk management losses. |
| • | Sales Volume – Sales volume increased as a result of improved demand for our Prepared Foods products and incremental volumes as a result of the acquisition of Hillshire Brands in our final month of fiscal 2014. |
| • | Average Sales Price – Average sales price increased due to price increases associated with higher input costs along with better product mix which was positively impacted incrementally by the acquisition of Hillshire Brands in our final month of fiscal 2014. |
An excerpt. Shown here: 40 of 154 rewritten, 40 of 77 added and 40 of 75 removed. The counts are complete. For every sentence, read Item 7. MANAGEMENT’S DISCUSSION AND ANALYSIS OF FINANCIAL CONDITION AND RESULTS OF OPERATIONS in the FY2016 filing and the FY2015 filing.
Item 7A. QUANTITATIVE AND QUALITATIVE DISCLOSURES ABOUT MARKET RISK
11 rewritten, 3 added, 1 removed, 36 unchanged
The following table presents a sensitivity analysis resulting from a hypothetical change of 10% in market prices as of October [added: 1, 2016, and October] 3, 2015, [removed: and September 27, 2014,] on the fair value of open positions.
| [added: Live] Cattle | $ | [removed: 13] [added: 5] | | | $ | [removed: 42] [added: 13] | |
| [added: Lean] Hogs | [removed: 12] [added: 7] | | | | [removed: 32] [added: 12] | | |
| [removed: Grain] [added: Grain:] | [removed: 3] | | | | [removed: 10] | | |
Interest Rate Risk: At October [removed: 3, 2015,] [added: 1, 2016,] we had variable rate debt of [removed: $1,057] [added: $1,357] million with a weighted average interest rate of [removed: 1.5%.][added: 1.8%.]
A hypothetical 10% increase in interest rates effective at October [added: 1, 2016, and October] 3, 2015, [removed: and September 27, 2014,] would have a minimal effect on interest expense.
At October [removed: 3, 2015,] [added: 1, 2016,] we had fixed-rate debt of [removed: $5,668] [added: $4,922] million with a weighted average interest rate of [removed: 4.4%.][added: 4.3%.]
A hypothetical 10% decrease in interest rates would have increased the fair value of our fixed-rate debt by approximately [removed: $87] [added: $71] million at October [removed: 3, 2015,] [added: 1, 2016,] and [removed: $109] [added: $87] million at [removed: September 27, 2014.][added: October 3, 2015.]
See Part II, Item 8, Notes to Consolidated Financial Statements, Note [removed: 15:] [added: 14:] Pensions and Other Postretirement Benefits for additional information.
A hypothetical 10% change in foreign exchange rates effective at October [added: 1, 2016, and October] 3, 2015, [removed: and September 27, 2014,] related to the foreign exchange forward and option contracts would have a $3 million [removed: and $9 million impact, respectively,] [added: impact] on pretax income.
At October [added: 1, 2016, and October] 3, 2015, [removed: and September 27, 2014, 20.0%] [added: 18.9%] and [removed: 18.6%,] [added: 20.0%,] respectively, of our net accounts receivable balance was due from Wal-Mart Stores, Inc. No other single customer or customer group represented greater than 10% of net accounts receivable.
| | 2016 | | | | 2015 | | |
| Corn | 26 | | | | 3 | | |
| Soy Meal | 8 | | | | — | | |
| | 2015 | | | | 2014 | | |
Item 1. BUSINESS
34 rewritten, 3 added, 8 removed, 129 unchanged
Through our wholly-owned subsidiary, Cobb-Vantress, [removed: Inc. (Cobb),] [added: Inc.,] we are one of the leading poultry breeding stock suppliers in the world.
Hillshire [removed: Brands] [added: Brands'] results of operations are included in the Prepared Foods segment.
Other [removed: now] [added: primarily] includes our foreign chicken production operations in China and India and third-party merger and integration costs.
The contribution of each segment to net sales and operating income (loss), and the identifiable assets attributable to each segment, are set forth in Part II, Item 8, Notes to Consolidated Financial Statements, Note [removed: 17:] [added: 16:] Segment Reporting.
Chicken: Chicken includes our domestic operations related to raising and processing live chickens [removed: into] [added: into, and purchasing raw materials for,] fresh, frozen and value-added chicken products, as well as sales from allied products.
[removed: On August 28, 2014, we completed the acquisition of Hillshire Brands, a manufacturer and marketer of branded, convenient foods which] [added: This segment] includes brands such as Jimmy Dean®, [removed: Ball Park®,] Hillshire Farm®, [added: Ball Park®, Wright®,] State Fair®, Van's®, Sara Lee® and Chef [removed: Pierre® pies] [added: Pierre®,] as well as artisanal brands Aidells®, Gallo Salame®, and Golden [removed: Island® premium jerky.][added: Island®.]
Products primarily include pepperoni, bacon, breakfast sausage, turkey, lunchmeat, hot dogs, pizza crusts and toppings, flour and corn tortilla products, desserts, appetizers, [added: snacks,] prepared meals, ethnic foods, soups, sauces, side dishes, meat dishes, breadsticks and processed meats.
We operate [removed: our own] feed mills to produce scientifically-formulated feeds.
In fiscal [removed: 2015,] [added: 2016,] corn, soybean meal and other feed ingredients were major production costs, representing roughly [removed: 64%] [added: 57%] of our cost of growing a live chicken domestically.
While we produce nearly all our inventory of breeder chickens and live broilers, we also purchase [removed: live,] ice-packed or deboned chicken to meet production and sales requirements.
Wal-Mart Stores, Inc. accounted for [removed: 16.8%] [added: 17.5%] of our fiscal [removed: 2015] [added: 2016] consolidated sales.
No other single customer or customer group represented more than 10% of fiscal [removed: 2015] [added: 2016] consolidated sales.
We sold products in approximately [removed: 130] [added: 115] countries in fiscal [removed: 2015.][added: 2016.]
Major sales markets include [removed: Brazil,] Canada, Central America, China, the European Union, Japan, Mexico, the Middle East, South [removed: Korea,] [added: Korea] and Taiwan.
| • | Cobb-Vantress, a chicken breeding stock subsidiary, has business interests in Argentina, Brazil, China, the Dominican Republic, India, Japan, the Netherlands, [added: New Zealand,] the Philippines, Russia, Spain, Turkey, the United Kingdom and Venezuela. |
| • | Godrej Tyson Foods, a joint venture in India in which we have a majority interest, is [added: primarily] a chicken processing business. |
| • | Tyson Mexico Trading Company, a Mexican subsidiary, sells chicken products primarily [removed: though] [added: through] co-packer arrangements. |
Additional information regarding export sales and long-lived assets located in foreign countries is set forth in Part II, Item 8, Notes to Consolidated Financial Statements, Note [removed: 17:] [added: 16:] Segment Reporting.
The [removed: Discovery Centers] [added: centers] enable us to bring new market-leading retail and foodservice products to the customer quickly and efficiently.
Research and development costs totaled [removed: $75] [added: $96] million, [removed: $52] [added: $75] million, and [removed: $50] [added: $52] million in fiscal [removed: 2015, 2014] [added: 2016, 2015] and [removed: 2013,] [added: 2014,] respectively.
In addition to our own internal Food Safety and Quality Assurance oversight and review, our chicken, beef, pork and prepared foods products are subject to inspection prior to distribution, primarily by the [removed: United States Department of Agriculture (USDA)] [added: USDA] and the United States Food and Drug [removed: Administration (FDA).][added: Administration.]
We are also participants in the United States Hazard Analysis Critical Control Point [removed: (HACCP)] program and are subject to the Sanitation Standard Operating Procedures and the Public Health Security and Bioterrorism Preparedness and Response Act of 2002.
As of October [removed: 3, 2015,] [added: 1, 2016,] we employed approximately [removed: 113,000] [added: 114,000] employees.
Approximately [removed: 107,000] [added: 108,000] employees were employed in the United States and 6,000 employees were employed in foreign countries, primarily in China.
Approximately [removed: 31,000] [added: 29,000] employees in the United States were subject to collective bargaining agreements with various labor unions, with approximately [removed: 12%] [added: 43%] of those employees [added: at locations either under negotiation for contract renewal or] included under agreements expiring in fiscal [removed: 2016.][added: 2017.]
Approximately [removed: 5,000] [added: 4,000] employees in foreign countries were subject to collective bargaining agreements.
Our principal marketing objective is to be the [removed: leading branded] [added: preferred] provider of [removed: protein-based solutions for our consumers and customers across] chicken, [removed: turkey,] beef, pork and prepared [removed: foods.][added: foods products for our customers and consumers.]
We [removed: grow our leading brands (Tyson®,] [added: build the Tyson®,] Jimmy Dean®, Hillshire Farm®, Sara Lee®, Ball Park®, Wright®, Aidells® and State [removed: Fair®)] [added: Fair® brands] while supporting strong regional and emerging brands primarily through [removed: consumer engagement marketing plans] [added: well-defined, product-specific advertising, marketing, and public relations efforts] focused [removed: on core] [added: toward key] consumer targets [removed: leveraging proprietary research and insights.][added: with specific needs.]
We utilize our national distribution system and customer support services to achieve the leading market position for our [removed: products.][added: products and brands.]
We have filed a number of patents [removed: and trademarks] relating to our processes and products that either have been approved or are in the process of [removed: application.][added: review.]
Because we do a significant amount of brand name and product line advertising to promote our products, we consider the protection of our trademarks to be important to our marketing [removed: efforts.][added: efforts and have registered and applied for the registration of a number of trademarks.]
We utilize internal procedures and safeguards to protect the confidentiality of such information and, where appropriate, seek patent and/or [removed: trademark] [added: other] protection for the technology we utilize.
Such forward-looking statements include, but are not limited to, current views and estimates of our outlook for fiscal [removed: 2016,] [added: 2017,] other future economic circumstances, industry conditions in domestic and international markets, our performance and financial results (e.g., debt levels, return on invested capital, value-added product growth, capital expenditures, tax rates, access to foreign markets and dividend policy).
Among the factors that may cause actual results and experiences to differ from anticipated results and expectations expressed in such forward-looking statements are the following: (i) the effect of, or changes in, general economic conditions; (ii) fluctuations in the cost and availability of inputs and raw materials, such as live cattle, live swine, feed grains (including corn and soybean meal) and energy; (iii) market conditions for finished products, including competition from other global and domestic food processors, supply and pricing of competing products and alternative proteins and demand for alternative proteins; (iv) successful rationalization of existing facilities and operating efficiencies of the facilities; (v) risks associated with our commodity purchasing activities; (vi) access to foreign markets together with foreign economic conditions, including currency fluctuations, import/export restrictions and foreign politics; (vii) outbreak of a livestock disease (such as avian influenza (AI) or bovine spongiform encephalopathy (BSE)), which could have an adverse effect on livestock we own, the availability of livestock we purchase, consumer perception of certain protein products or our ability to access certain domestic and foreign markets; (viii) changes in availability and relative costs of labor and contract growers and our ability to maintain good relationships with employees, labor unions, contract growers and independent producers providing us livestock; (ix) issues related to food safety, including costs resulting from product recalls, regulatory compliance and any related claims or litigation; (x) changes in consumer preference and diets and our ability to identify and react to consumer trends; (xi) significant marketing plan changes by large customers or loss of one or more large customers; (xii) adverse results from litigation; (xiii) impacts on our operations caused by factors and forces beyond our control, such as natural disasters, fire, bioterrorism, pandemics or extreme weather; (xiv) risks associated with leverage, including cost increases due to rising interest rates or changes in debt ratings or outlook; (xv) compliance with and changes to regulations and laws (both domestic and foreign), including changes in accounting standards, tax laws, environmental laws, agricultural laws and occupational, health and safety laws; (xvi) our ability to make effective acquisitions or joint ventures and successfully integrate newly acquired businesses into existing operations; (xvii) [removed: failures or] [added: cyber incidents,] security breaches [added: or other disruptions] of our information technology systems; (xviii) effectiveness of advertising and marketing programs; and (xix) those factors listed under Item 1A.
With regards to our food products we have two research and development locations, our Discovery Center in Springdale, Arkansas, and another center located in Downers Grove, Illinois.
The centers include over 80,000 square feet of United States Department of Agriculture (USDA) pilot plant space, two consumer sensory and focus group areas, a packaging lab and 25 research kitchens.
We identify growth and business opportunities through consumer and customer insights derived via leading research and analytic capabilities.
Following the sale of the Mexico and Brazil operations in fiscal 2015, we began reporting our international operation, which was previously reported as the International segment, in Other.
All periods presented have been reclassified to reflect this change.
Chicken, Beef, Pork and Prepared Foods results were not impacted by this change.
For further description of the sale of the Mexico and Brazil operations, refer to Part II, Item 8, Notes to Consolidated Financial Statements, Note 3: Acquisitions and Dispositions.
Hillshire Brands' results from operations are reported in the Prepared Foods segment from the date of acquisition.
Our Discovery Centers include a 100,000 square foot research and development facility in Springdale, Arkansas with 19 research kitchens and a USDA-inspected pilot plant.
We also lease an approximately 78,000 square foot research and development facility outside Chicago, Illinois assumed in our Hillshire Brands acquisition, which includes five test kitchens and a USDA-inspected pilot plant.
Our insights ensure we maintain relevancy and are consistently meeting the needs of our consumer and customer partners.
Item 3. LEGAL PROCEEDINGS
4 rewritten, 7 added, 0 removed, 17 unchanged
Refer to the description of certain legal proceedings pending against us under Part II, Item 8, Notes to Consolidated Financial Statements, Note [removed: 20:] [added: 19:] Commitments and Contingencies, which discussion is incorporated herein by reference.
The [removed: United States Environmental Protection Agency] [added: EPA] has also indicated to us that it has begun a criminal investigation into the incident.
We are cooperating with the [removed: Environmental Protection Agency] [added: EPA] but cannot predict the outcome of its investigation at this time.
Other Matters: [removed: We currently have] [added: As of October 1, 2016, we had] approximately [removed: 113,000] [added: 114,000] employees and, at any time, have various employment practices matters outstanding.
Our subsidiary, Tyson Poultry, Inc., has been in negotiations with Region 6 of the Unites States Environmental Protection Agency (the “EPA”) to resolve concerns about an accident at the Hope, Arkansas processing plant which occurred on April 23, 2016.
The EPA alleged violation of the Clean Air Act Risk Management Plan requirements related to our anhydrous ammonia refrigeration system and the accident.
Pursuant to an administrative settlement with the EPA, we will pay a penalty of $106,894, perform independent, third-party audits at 20 facilities in Arkansas, Oklahoma and Texas over the next 3 years, and construct a closed vent refrigeration system at a facility in Region 6 within the next 2 years.
On April 23, 2015, the EPA issued a Finding and Notice of Violation (the “NOV”) to Tyson Foods, Inc. and our subsidiary, Southwest Products, LLC, alleging violations of the California Truck and Bus Regulation.
The NOV alleges that certain diesel-powered trucks operated by us in California did not comply with California’s emission requirements for in-use trucks and that we did not verify the compliance status of independent carriers hired to carry products in California.
In January 2016, the EPA proposed that we pay a civil penalty of $283,990 to resolve these allegations.
We are cooperating with the EPA and believe that we have defenses to the allegations of the NOV.
Cover and table of contents
27 rewritten, 5 added, 5 removed, 63 unchanged
| | For the fiscal year ended | October [removed: 3, 2015] [added: 1, 2016] |
[removed: ][added: ]
Yes [removed: \[X\] No] \[ \] [added: No \[X\]]
On [removed: March 28, 2015,] [added: April 2, 2016,] the aggregate market value of the registrant’s Class A Common Stock, $0.10 par value (Class A stock), and Class B Common Stock, $0.10 par value (Class B stock), held by non-affiliates of the registrant was [removed: $11,395,283,906] [added: $20,012,635,241] and [removed: $412,319,] [added: $732,308,] respectively.
On October [removed: 31, 2015,] [added: 29, 2016,] there were [removed: 295,644,459] [added: 290,558,412] shares of Class A stock and [removed: 70,010,805] [added: 70,010,755] shares of Class B stock outstanding.
Portions of the registrant’s definitive Proxy Statement for the registrant’s Annual Meeting of Shareholders to be held February [removed: 5, 2016,] [added: 9, 2017,] are incorporated by reference into Part III of this Annual Report on Form 10-K.
| Item 1. | [removed: [Business](#sD5DDABF0512452848F3120EB1628B7AD)] [added: [Business](#s616302C2761A50BDB2A44CC407EFCAD1)] | [removed: [2](#sD5DDABF0512452848F3120EB1628B7AD)] [added: [2](#s616302C2761A50BDB2A44CC407EFCAD1)] |
| Item 1A. | [Risk [removed: Factors](#sF8FC8B1D08175B4AABCF81CCEFA056E7)] [added: Factors](#s2430E48F753A5DFA858761D90796039A)] | [removed: [6](#sF8FC8B1D08175B4AABCF81CCEFA056E7)] [added: [6](#s2430E48F753A5DFA858761D90796039A)] |
| Item 1B. | [Unresolved Staff [removed: Comments](#sB66E1A0996425227A0D212F7077771B1)] [added: Comments](#sA8C95B027F06513BA64B8CF3102A5267)] | [removed: [14](#sB66E1A0996425227A0D212F7077771B1)] [added: [14](#sA8C95B027F06513BA64B8CF3102A5267)] |
| Item 2. | [removed: [Properties](#sB20F4D6CD86953B89A738221267AAE8A)] [added: [Properties](#s69630D0B3FBC56B383A1FDD003F71A7D)] | [removed: [15](#sB20F4D6CD86953B89A738221267AAE8A)] [added: [15](#s69630D0B3FBC56B383A1FDD003F71A7D)] |
| Item 3. | [Legal [removed: Proceedings](#sFDFC02B1508E54A7935CF40C45FAE798)] [added: Proceedings](#s4B91CD2FC0995A7DB3F37ABDDE2BC585)] | [removed: [16](#sFDFC02B1508E54A7935CF40C45FAE798)] [added: [16](#s4B91CD2FC0995A7DB3F37ABDDE2BC585)] |
| Item 4. | [Mine Safety [removed: Disclosures](#sEE875B89DC2056EBB920C21905156FA6)] [added: Disclosures](#s3E2FD190E7D15CDB8765C3837ED0376E)] | [removed: [16](#sEE875B89DC2056EBB920C21905156FA6)] [added: [16](#s3E2FD190E7D15CDB8765C3837ED0376E)] |
| Item 5. | [Market for Registrant’s Common Equity, Related Stockholder Matters and Issuer Purchases of Equity [removed: Securities](#s794D68127A7A5968B433EDC87E77422D)] [added: Securities](#s2B00B2341C8D5AD2A08BE76080E09766)] | [removed: [19](#s794D68127A7A5968B433EDC87E77422D)] [added: [19](#s2B00B2341C8D5AD2A08BE76080E09766)] |
| Item 6. | [Selected Financial [removed: Data](#s0E4CE21DC15650E2B868533E2D846854)] [added: Data](#s18A91AE6E847504B86B7D9D24F368D79)] | [removed: [21](#s0E4CE21DC15650E2B868533E2D846854)] [added: [21](#s18A91AE6E847504B86B7D9D24F368D79)] |
| Item 7. | [Management’s Discussion and Analysis of Financial Condition and Results of [removed: Operations](#sEF11C6F13B39560C94FEE2BF733AC7EF)] [added: Operations](#s906428747EC653A7B4A6010DB1C8ECD6)] | [removed: [23](#sEF11C6F13B39560C94FEE2BF733AC7EF)] [added: [23](#s906428747EC653A7B4A6010DB1C8ECD6)] |
| Item 7A. | [Quantitative and Qualitative Disclosures About Market [removed: Risk](#sD033FC43819255BEB980A3C3DFC30380)] [added: Risk](#s11BF3CDC3F705F28B7707C263DC54EE0)] | [removed: [43](#sD033FC43819255BEB980A3C3DFC30380)] [added: [42](#s11BF3CDC3F705F28B7707C263DC54EE0)] |
| Item 8. | [Financial Statements and Supplementary [removed: Data](#sE9A9699FBF85503CA9D638AD2C44E789)] [added: Data](#sD61CA297295D5A699298E2259618BCA1)] | [removed: [45](#sE9A9699FBF85503CA9D638AD2C44E789)] [added: [44](#sD61CA297295D5A699298E2259618BCA1)] |
| Item 9. | [Changes in and Disagreements With Accountants on Accounting and Financial [removed: Disclosure](#s29C896E1A1A952BB8CC7DAEFDB588392)] [added: Disclosure](#sBEAFE7DFF7225DB8B69086D670FFBF9F)] | [removed: [93](#s29C896E1A1A952BB8CC7DAEFDB588392)] [added: [86](#sBEAFE7DFF7225DB8B69086D670FFBF9F)] |
| Item 9A. | [Controls and [removed: Procedures](#s27C9498F28C5556D90997A6C74DC7585)] [added: Procedures](#s11AB09B3C43E56E59677DBFC3BEFB3F3)] | [removed: [93](#s27C9498F28C5556D90997A6C74DC7585)] [added: [86](#s11AB09B3C43E56E59677DBFC3BEFB3F3)] |
| Item 9B. | [Other [removed: Information](#s0DBBA8CAEB4456EC81F6F2102E3E15BF)] [added: Information](#sB29E7F538B4A52B289397C4CFC3A0C2E)] | [removed: [93](#s0DBBA8CAEB4456EC81F6F2102E3E15BF)] [added: [86](#sB29E7F538B4A52B289397C4CFC3A0C2E)] |
| [PART [removed: III](#s9386BC7FD7395E1C80CC70659876AEC9)] [added: III](#s001CB444291E527C93508F2F71F1D240)] | | |
| Item 10. | [Directors, Executive Officers and Corporate [removed: Governance](#s1920F4F279785ABD8A23B2651A5FF547)] [added: Governance](#s592AFD6A4A0355F4964AC29752A364C1)] | [removed: [94](#s1920F4F279785ABD8A23B2651A5FF547)] [added: [87](#s592AFD6A4A0355F4964AC29752A364C1)] |
| Item 11. | [Executive [removed: Compensation](#s87625E3B9FB4578E92862E73AFF6DC47)] [added: Compensation](#s4D576F9AC44F5338830DDD6F54ED2FA2)] | [removed: [94](#s87625E3B9FB4578E92862E73AFF6DC47)] [added: [87](#s4D576F9AC44F5338830DDD6F54ED2FA2)] |
| Item 12. | [Security Ownership of Certain Beneficial Owners and Management and Related Stockholder [removed: Matters](#s02E7C6775A77565781EB1E61E80B8719)] [added: Matters](#s4EB1B6E14C175CEA812D10FD236C6755)] | [removed: [94](#s02E7C6775A77565781EB1E61E80B8719)] [added: [87](#s4EB1B6E14C175CEA812D10FD236C6755)] |
| Item 13. | [Certain Relationships and Related Transactions, and Director [removed: Independence](#s42C3AE7477955F18BE15E43DD32A7857)] [added: Independence](#s83FF7D26D0745E469AC66B26E72F5F22)] | [removed: [94](#s42C3AE7477955F18BE15E43DD32A7857)] [added: [87](#s83FF7D26D0745E469AC66B26E72F5F22)] |
| Item 14. | [Principal Accounting Fees and [removed: Services](#s52DA96159E80548D96362C5452A8FB87)] [added: Services](#s19AE39B156165DDCB011BDAC899F3294)] | [removed: [94](#s52DA96159E80548D96362C5452A8FB87)] [added: [87](#s19AE39B156165DDCB011BDAC899F3294)] |
| Item 15. | [Exhibits, Financial Statement [removed: Schedules](#s145DD2806E9F538081816F2A19E3FB69)] [added: Schedules](#sFB51D4FBBB395505AB06AB6E737AFD7C)] | [removed: [95](#s145DD2806E9F538081816F2A19E3FB69)] [added: [88](#sFB51D4FBBB395505AB06AB6E737AFD7C)] |
10-K 1 tsn201610kq4.htm FORM 10-K
\[\]
| [PART I](#s9334049B37FA5EF490B58C168B8F0C54) | | |
| [PART II](#s12F1B3F9EC405443964307638AC0A43F) | | |
| [PART IV](#s76A9CFD6DA185768BBF7A6C1D1A9B458) | | |
10-K 1 tsn201510kq4.htm 10-K
\[X\]
| [PART I](#s102A56E65B7151FABDE59577F341878F) | | |
| [PART II](#sDBDE69BB7E295CFAB31086F16161CB98) | | |
| [PART IV](#s227BCF6DBA005A46AD8D9837B18625A2) | | |
Item 2. PROPERTIES
13 rewritten, 3 added, 5 removed, 36 unchanged
We have production and distribution operations in the following states: Alabama, Arizona, Arkansas, California, Delaware, Florida, Georgia, Illinois, Indiana, Iowa, Kansas, Kentucky, Maryland, Michigan, Mississippi, Missouri, Nebraska, North Carolina, Oklahoma, Pennsylvania, South Carolina, Tennessee, Texas, [removed: Utah,] Virginia, Washington and Wisconsin.
Additionally, [removed: we, either directly or through our subsidiaries,] [added: we] have sales offices, facilities or participate in joint venture operations in Argentina, Brazil, Canada, China, the Dominican Republic, Hong Kong, India, Japan, Mexico, the Netherlands, [added: New Zealand,] the Philippines, [removed: the Republic of Ireland,] Russia, South Korea, Spain, Taiwan, Turkey, the United Arab Emirates, the United Kingdom and Venezuela.
| Broiler hatcheries | [removed: 59] [added: 60] | | | 3 | | | [removed: 62] [added: 63] | |
| Processing [removed: plants(2)] [added: plants] | [removed: 32] [added: 30] | | | [removed: 6] [added: 4] | | | [removed: 38] [added: 34] | |
| Cold Storage Facilities | [removed: 51] [added: 50] | | | — | | | [removed: 51] [added: 50] | |
| | | | | Capacity(1) per week at October [removed: 3, 2015] [added: 1, 2016] | | | Fiscal [removed: 2015] [added: 2016] Average Capacity Utilization | |
| Chicken [removed: Processing Plants] [added: Production Facilities] | | | | 39 million head | | | 89 | % |
| Beef Production Facilities | | | | [removed: 176,000] [added: 165,000] head | | | [removed: 73] [added: 76] | % |
| Pork Production Facilities | | | | 456,000 head | | | [removed: 88] [added: 91] | % |
| Prepared Foods Processing [removed: Plants] [added: Facilities(2)] | | | | 78 million pounds | | | [removed: 87] [added: 84] | % |
| (1) | Capacity per week based on the following: [removed: Chicken- five day week,] [added: Chicken and] Prepared [removed: Foods- five] [added: Foods (five] day [removed: week,] [added: week) and] Beef and [removed: Pork- six] [added: Pork (six] day [removed: week.] [added: week).] |
We also have [removed: 30] [added: 29] animal nutrition operations, nine of which are associated with the Chicken rendering plants, [removed: 20] [added: 19] within various Chicken processing facilities and one pet treats plant.
In addition, our foreign chicken [added: production] operations in China and India include four processing plants, two rendering plants, three feed mills and five broiler hatcheries.
| Breeder houses | 430 | | | 44 | | | 474 | |
| (2) | In fiscal 2016, we changed the method of calculating capacity for our Prepared Foods processing plants. If we would have used the fiscal 2015 method, fiscal 2016 capacity would have been 74 million pounds with an 89% average capacity utilization. |
We also have various plants which have rendering operations along with tanneries and hide treatment operations.
| Breeder houses | 383 | | | 31 | | | 414 | |
| (2) | Includes our owned Chicago, Illinois hospitality plant and our Jefferson, Wisconsin, plant scheduled to close in the back half of fiscal 2016. |
Some also treat and tan hides.
Carcass facilities reduce live cattle to dressed carcass form.
Processing facilities conduct fabricating operations to produce boxed beef and allied products.
Item 4. MINE SAFETY DISCLOSURES
20 rewritten, 8 added, 3 removed, 46 unchanged
The name, title, age [added: (as of October 1, 2016)] and calendar year of initial election to executive office of our executive officers are listed below:
| John Tyson | | Chairman of the Board of Directors | | [removed: 62] [added: 63] | | 2011 |
| Curt T. Calaway | | Senior Vice President, Controller and Chief Accounting Officer | | [removed: 42] [added: 43] | | 2012 |
| Andrew P. Callahan | | President, Retail Packaged Brands | | [removed: 49] [added: 50] | | 2014 |
| Howell P. Carper | | Executive Vice President, [removed: Strategy and New Ventures] [added: Operations Services] | | 62 | | 2013 |
| Sally Grimes | | [removed: President] [added: President, International] and Chief Global Growth Officer | | [removed: 44] [added: 45] | | 2014 |
| Thomas P. Hayes | | [removed: Chief Commercial Officer and President, Foodservice] [added: President] | | [removed: 50] [added: 51] | | 2014 |
| Donnie King | | [removed: President of] [added: President,] North American [removed: Operations, Fresh Beef/Pork, Poultry and Prepared Foods] [added: Operations] | | [removed: 53] [added: 54] | | 2009 |
| Dennis Leatherby | | Executive Vice President and Chief Financial Officer | | [removed: 55] [added: 56] | | 1994 |
| Mary Oleksiuk | | Executive Vice President and Chief Human Resources Officer | | [removed: 53] [added: 54] | | 2014 |
| Donnie Smith | | [removed: President and] Chief Executive Officer | | 56 | | 2008 |
| Stephen Stouffer | | President, Fresh Meats | | [removed: 55] [added: 56] | | 2013 |
| David L. Van Bebber | | Executive Vice President and General Counsel | | [removed: 59] [added: 60] | | 2008 |
| Noel White | | President, Poultry | | [removed: 57] [added: 58] | | 2009 |
[removed: (“Hal”) Carper was appointed Executive Vice President, Strategy and New Ventures in 2013, after serving] [added: He previously served] as Group Vice President, Research and Development, Logistics, and Technical Services since 2008, prior to which he served as Senior Vice President, Corporate Research and Development since 2003, and Senior Vice President and General Manager, Foodbrands Foodservice since 2001.
Sally Grimes was appointed [removed: President] [added: President, International] and Chief Global Growth Officer in June 2015 following her appointment as President and Global Growth Officer in [removed: September] 2014.
Prior to joining Hillshire Brands, Ms. Grimes served as Global Vice President, Marketing for the writing and creative expression business unit at Newell Rubbermaid, Inc. [removed: (global marketer of consumer and commercial products)] from 2007 to 2012.
[added: Mr.] Hayes [removed: was appointed] [added: previously served as] Chief Commercial Officer [removed: in] [added: since] June 2015 after being appointed President, [removed: Food Service] [added: Foodservice] in [removed: September] 2014.
Donnie King was appointed President [removed: of] North American [removed: Operations, Fresh Beef/Pork, Poultry and Prepared Foods] [added: Operations] in June 2015 following his appointment as President of North American Operations and Food Service in 2014.
[removed: Donnie] [added: Mr.] Smith [removed: was appointed President and Chief Executive Officer in November 2009, after serving] [added: served] as Senior Group Vice President, Poultry and Prepared Foods since January 2009, prior to which he served as Group Vice President of Consumer Products since 2008, Group Vice President of Logistics and Operations Services since 2007, Group Vice President Information Systems, Purchasing and Distribution since 2006 and Senior Vice President and Chief Information Officer since 2005.
| Monica McGurk | | Executive Vice President, Strategy and New Ventures and President, Foodservice | | 46 | | 2016 |
(“Hal”) Carper was appointed Executive Vice President, Operations Services in April 2016, after serving as Executive Vice President, Strategy and New Ventures since 2013.
Hayes was appointed President in June 2016.
Monica McGurk was appointed Executive Vice President, Strategy and New Ventures and President, Foodservice in August 2016 after serving as Senior Vice President, Strategy and New Ventures since April 2016.
Prior to joining the Company, Ms. McGurk served as Senior Vice President of Strategy, Decision Support and eCommerce for the North American Group of the Coca-Cola Company from 2014 to 2016, prior to which she served as Vice President, Strategy & eCommerce since late 2012.
Prior to joining the Coca-Cola Company, she was the Chief Executive Officer and Executive Editor of The Alumni Factor from May through November 2012.
Prior to this position, she was a partner with McKinsey & Company, a global management consulting firm with which she served in various roles for 19 years.
Donnie Smith was appointed President and Chief Executive Officer in November 2009 and continues to serve as Chief Executive Officer following Mr. Hayes’ appointment as President in June 2016.
| Mike Roetzel | | Executive Vice President, Operations Services | | 56 | | 2015 |
Mike Roetzel was appointed Executive Vice President of Operations Services in November 2015, after serving as Group Vice President of Operations Services since 2013, prior to which he served as Senior Vice President, Purchasing since 2008, and various officer positions since 1999.
Mr. Roetzel was initially employed by the Company in 1986.
Item 5. MARKET FOR REGISTRANT’S COMMON EQUITY, RELATED STOCKHOLDER MATTERS AND ISSUER PURCHASES OF EQUITY SECURITIES
20 rewritten, 9 added, 11 removed, 33 unchanged
As of October [removed: 31, 2015,] [added: 29, 2016,] there were approximately [removed: 24,000] [added: 23,000] holders of record of our Class A stock and [removed: seven] [added: six] holders of record of our Class B [removed: stock, excluding holders in the security position listings held by nominees.][added: stock.]
In fiscal [removed: 2014,] [added: 2016,] the annual dividend rate for Class A stock was [removed: $0.30] [added: $0.60] per share and the annual dividend rate for Class B stock was [removed: $0.27] [added: $0.54] per share.
On November [removed: 19, 2015,] [added: 17, 2016,] the Board of Directors increased the [removed: quarterly] dividend previously declared on [removed: July 30, 2015,] [added: August 4, 2016,] to [removed: $0.15] [added: $0.225] per share on our Class A stock and [removed: $0.135] [added: $0.2025] per share on our Class B stock.
The increased quarterly dividend is payable on December 15, [removed: 2015,] [added: 2016,] to shareholders of record at the close of business on December 1, [removed: 2015.][added: 2016.]
Also on November [removed: 19, 2015,] [added: 17, 2016,] the Board of Directors declared a quarterly dividend of [removed: $0.15] [added: $0.225] per share on our Class A stock and [removed: $0.135] [added: $0.2025] per share on our Class B stock, payable on March 15, [removed: 2016,] [added: 2017,] to shareholders of record at the close of business on March 1, [removed: 2016.][added: 2017.]
We anticipate the remaining quarterly dividends in fiscal [removed: 2016] [added: 2017] will be [removed: $0.15] [added: $0.225] and [removed: $0.135] [added: $0.2025] per share of our Class A and Class B stock, respectively.
[removed: Beginning in fiscal 2017, we anticipate] [added: We also continue] to [removed: increase] [added: anticipate] our annual dividends [added: to increase] approximately $0.10 per year.
The high and low sales prices of our Class A stock for each quarter of fiscal [removed: 2015] [added: 2016] and [removed: 2014] [added: 2015] are represented in the table below.
| First Quarter | $ | [removed: 43.37] [added: 54.42] | | | $ | [removed: 37.02] [added: 42.89] | | | $ | [removed: 34.38] [added: 43.37] | | | $ | [removed: 27.33] [added: 37.02] | |
| Second Quarter | [removed: 42.41] [added: 68.17] | | | | [removed: 37.10] [added: 48.52] | | | | [removed: 43.45] [added: 42.41] | | | | [removed: 33.03] [added: 37.10] | | |
| Third Quarter | [removed: 45.10] [added: 70.44] | | | | [removed: 37.24] [added: 59.45] | | | | [removed: 44.24] [added: 45.10] | | | | [removed: 34.90] [added: 37.24] | | |
| Fourth Quarter | [removed: 44.78] [added: 77.05] | | | | [removed: 39.05] [added: 65.83] | | | | [removed: 41.88] [added: 44.78] | | | | [removed: 36.12] [added: 39.05] | | |
| (1) | On February 7, 2003, we announced our Board of Directors approved a program to repurchase up to 25 million shares of Class A [added: common] stock from time to time in open market or privately negotiated transactions. On May 3, 2012, our Board of Directors approved an increase of 35 million [removed: shares authorized for repurchase under this program. On] [added: shares, on] January 30, 2014, our Board of Directors approved an increase of 25 million shares [removed: authorized for repurchase] [added: and, on February 4, 2016, our Board of Directors approved an increase of 50 million shares] under [removed: this] [added: the] program. The program has no fixed or scheduled termination date. |
| (2) | We purchased [removed: 258,556] [added: 254,857] shares during the period that were not made pursuant to our previously announced stock repurchase program, but were purchased to fund certain Company obligations under our equity compensation plans. These transactions included [removed: 215,099] [added: 244,498] shares purchased in open market transactions and [removed: 43,457] [added: 10,359] shares withheld to cover required tax withholdings on the vesting of restricted stock. |
[removed: 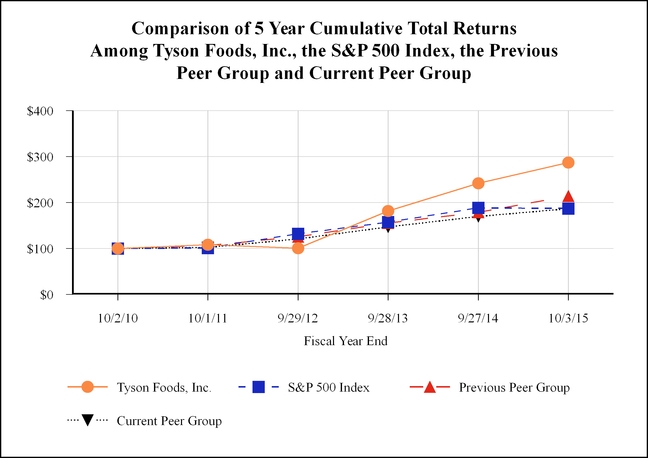][added: 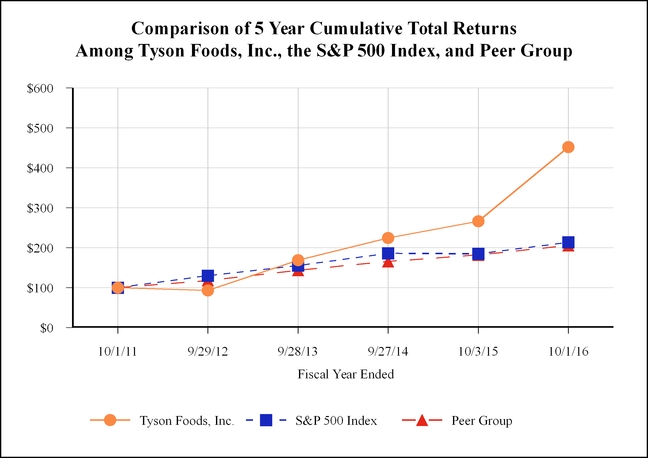]
| | Fiscal Years [removed: Ending] [added: Ended] | | | | | | | | | | | | | | | | | | | | | | |
| | Base Period [removed: 10/2/10 | | | |] 10/1/11 | | | | 9/29/12 | | | | 9/28/13 | | | | 9/27/14 | | | | 10/3/15 | | | [added: | 10/1/16 | | |]
The total cumulative return on investment (change in the year-end stock price plus reinvested dividends), which is based on the stock price or composite index at the end of fiscal [removed: 2010,] [added: 2011,] is presented for each of the periods for the Company, the S&P 500 Index, [removed: the previous peer group] and [removed: the current] [added: our] peer group.
The [removed: previous] peer group [removed: included:] [added: includes:] Archer-Daniels-Midland Company, Bunge Limited, Campbell Soup Company, ConAgra Foods, Inc., Dean Foods Company, General Mills, Inc., [removed: Hillshire Brands (up to August 28, 2014),] Hormel Foods Corp., Kellogg Co., [removed: Kraft Foods Group Inc. (up to July 2, 2015),] McCormick & Co., Mondelez [removed: Interenational] [added: International] Inc., [removed: Pilgrim’s] [added: PepsiCo, Inc., Pilgrim's] Pride Corporation, Sanderson Farms, Inc., [added: The Hershey Company,] and The J.M. Smucker Company.
The graph compares the performance of the Company's Class A common stock with that of the S&P 500 Index and [removed: both] peer [removed: groups,] [added: group,] with the return of each company in the peer [removed: groups] [added: group] weighted on market capitalization.
| | 2016 | | | | | | | | 2015 | | | | | | |
| Jul. 3, 2016 to Jul. 30, 2016 | 4,706,269 | | | $ | 70.20 | | 4,598,556 | | | 44,488,878 | |
| Jul. 31, 2016 to Sept. 3, 2016 | 2,643,859 | | | 74.69 | | | 2,543,335 | | | 41,945,543 | |
| Sept. 4, 2016 to Oct. 1, 2016 | 1,652,309 | | | 74.61 | | | 1,605,689 | | | 40,339,854 | |
| Total | 9,002,437 | | (2) | $ | 72.33 | | 8,747,580 | | (3) | 40,339,854 | |
| Tyson Foods, Inc. | $ | 100.00 | | | $ | 93.09 | | | $ | 168.50 | | | $ | 224.16 | | | $ | 266.17 | | | $ | 452.03 | |
| S&P 500 Index | 100.00 | | | | 130.20 | | | | 155.39 | | | | 186.05 | | | | 184.91 | | | | 213.44 | | |
| Peer Group | 100.00 | | | | 117.85 | | | | 143.56 | | | | 165.74 | | | | 182.04 | | | | 205.49 | | |
The stock price performance of the Company's Class A common stock shown in the above graph is not necessarily indicative of future stock price performance.
| | 2015 | | | | | | | | 2014 | | | | | | |
| Jun. 28, 2015 to Jul. 25, 2015 | 92,654 | | | $ | 43.48 | | — | | | 27,929,771 | |
| Jul. 26, 2015 to Aug. 29, 2015 | 3,265,564 | | | 41.92 | | | 3,173,112 | | | 24,756,659 | |
| Aug. 30, 2015 to Oct. 3, 2015 | 3,701,964 | | | 42.31 | | | 3,628,514 | | | 21,128,145 | |
| Total | 7,060,182 | | (2) | $ | 42.14 | | 6,801,626 | | (3) | 21,128,145 | |
| Tyson Foods, Inc. | $ | 100.00 | | | $ | 107.73 | | | $ | 100.29 | | | $ | 181.53 | | | $ | 241.50 | | | $ | 286.76 | |
| S&P 500 Index | 100.00 | | | | 101.14 | | | | 131.69 | | | | 157.17 | | | | 188.18 | | | | 187.02 | | |
| Previous Peer Group | 100.00 | | | | 106.42 | | | | 125.22 | | | | 155.13 | | | | 178.46 | | | | 213.97 | | |
| Current Peer Group | 100.00 | | | | 102.25 | | | | 120.48 | | | | 146.77 | | | | 169.42 | | | | 186.09 | | |
The current peer group includes: Archer-Daniels-Midland Company, Bunge Limited, Campbell Soup Company, ConAgra Foods, Inc., Dean Foods Company, General Mills, Inc., Hormel Foods Corp., Kellogg Co., McCormick & Co., Mondelez Interenational Inc., PepsiCo, Inc., Pilgrim's Pride Corporation, Sanderson Farms, Inc., The Hershey Company, and The J.M. Smucker Company.
The differences between the current peer group and the previous peer group were the removal of Hillshire Brands and Kraft Foods Group Inc. because both ceased being publicly traded companies in fiscal 2014 and fiscal 2015, respectively, and the addition of PepsiCo, Inc. and The Hershey Company to more accurately reflect the Company’s peers in terms of industry standing.
Item 6. SELECTED FINANCIAL DATA
39 rewritten, 11 added, 7 removed, 57 unchanged
| | [removed: 2015] [added: 2016] | | | | [removed: 2014] [added: 2015] | | | | [removed: 2013] [added: 2014] | | | | [removed: 2012] [added: 2013] | | | | [removed: 2011] [added: 2012] | | |
| Sales | $ | [removed: 41,373] [added: 36,881] | | | $ | [removed: 37,580] [added: 41,373] | | | $ | [removed: 34,374] [added: 37,580] | | | $ | [removed: 33,055] [added: 34,374] | | | $ | [removed: 32,032] [added: 33,055] | |
| Operating income | [removed: 2,169] [added: 2,833] | | | | [removed: 1,430] [added: 2,169] | | | | [removed: 1,375] [added: 1,430] | | | | [removed: 1,286] [added: 1,375] | | | | [removed: 1,289] [added: 1,286] | | |
| Net interest expense | [removed: 284] [added: 243] | | | | [removed: 125] [added: 284] | | | | [removed: 138] [added: 125] | | | | [removed: 344] [added: 138] | | | | [removed: 231] [added: 344] | | |
| Income from continuing operations | [removed: 1,224] [added: 1,772] | | | | [removed: 856] [added: 1,224] | | | | [removed: 848] [added: 856] | | | | [removed: 614] [added: 848] | | | | [removed: 738] [added: 614] | | |
| Loss from discontinued operation, net of tax | — | | | | — | | | | [removed: (70] [added: —] | | [removed: )] | | [removed: (38] [added: (70] | | ) | | [removed: (5] [added: (38] | | ) |
| Net income | [removed: 1,224] [added: 1,772] | | | | [removed: 856] [added: 1,224] | | | | [removed: 778] [added: 856] | | | | [removed: 576] [added: 778] | | | | [removed: 733] [added: 576] | | |
| Net income attributable to Tyson | [removed: 1,220] [added: 1,768] | | | | [removed: 864] [added: 1,220] | | | | [removed: 778] [added: 864] | | | | [removed: 583] [added: 778] | | | | [removed: 750] [added: 583] | | |
| Income from continuing operations | [removed: 2.95] [added: 4.53] | | | | [removed: 2.37] [added: 2.95] | | | | [removed: 2.31] [added: 2.37] | | | | [removed: 1.68] [added: 2.31] | | | | [removed: 1.98] [added: 1.68] | | |
| Loss from discontinued operation | — | | | | — | | | | [removed: (0.19] [added: —] | | [removed: )] | | [removed: (0.10] [added: (0.19] | | ) | | [removed: (0.01] [added: (0.10] | | ) |
| Net income | [removed: 2.95] [added: 4.53] | | | | [removed: 2.37] [added: 2.95] | | | | [removed: 2.12] [added: 2.37] | | | | [removed: 1.58] [added: 2.12] | | | | [removed: 1.97] [added: 1.58] | | |
| Class A | [removed: 0.425] [added: 0.650] | | | | [removed: 0.325] [added: 0.425] | | | | [removed: 0.310] [added: 0.325] | | | | [removed: 0.160] [added: 0.310] | | | | 0.160 | | |
| Class B | [removed: 0.383] [added: 0.585] | | | | [removed: 0.294] [added: 0.383] | | | | [removed: 0.279] [added: 0.294] | | | | [removed: 0.144] [added: 0.279] | | | | 0.144 | | |
| Cash and cash equivalents | $ | [removed: 688] [added: 349] | | | $ | [removed: 438] [added: 688] | | | $ | [removed: 1,145] [added: 438] | | | $ | [removed: 1,071] [added: 1,145] | | | $ | [removed: 716] [added: 1,071] | |
| Shareholders’ equity | [removed: 9,706] [added: 9,624] | | | | [removed: 8,904] [added: 9,706] | | | | [removed: 6,233] [added: 8,904] | | | | [removed: 6,042] [added: 6,233] | | | | [removed: 5,685] [added: 6,042] | | |
| Depreciation and amortization | $ | [removed: 711] [added: 705] | | | $ | [removed: 530] [added: 711] | | | $ | [removed: 519] [added: 530] | | | $ | [removed: 499] [added: 519] | | | $ | [removed: 506] [added: 499] | |
| Capital expenditures | [removed: 854] [added: 695] | | | | [removed: 632] [added: 854] | | | | [removed: 558] [added: 632] | | | | [removed: 690] [added: 558] | | | | [removed: 643] [added: 690] | | |
| EBITDA | [removed: 2,906] [added: 3,538] | | | | [removed: 1,897] [added: 2,906] | | | | [removed: 1,818] [added: 1,897] | | | | [removed: 1,731] [added: 1,818] | | | | [removed: 1,767] [added: 1,731] | | |
| Return on invested capital | [removed: 13.4] [added: 18.1] | | % | | [removed: 11.8] [added: 13.4] | | % | | [removed: 18.5] [added: 11.9] | | % | | [removed: 17.7] [added: 18.5] | | % | | [removed: 18.5] [added: 17.7] | | % |
| Effective tax rate for continuing operations | [removed: 36.3] [added: 31.8] | | % | | [removed: 31.6] [added: 36.3] | | % | | [removed: 32.6] [added: 31.6] | | % | | [removed: 36.4] [added: 32.6] | | % | | [removed: 31.6] [added: 36.4] | | % |
| Book value per share | $ | [removed: 23.36] [added: 25.67] | | | $ | [removed: 23.70] [added: 24.25] | | | $ | [removed: 18.13] [added: 21.86] | | | $ | [removed: 16.84] [added: 18.13] | | | $ | [removed: 15.38] [added: 16.84] | |
| Stock price high | [removed: 45.10] [added: 77.05] | | | | [removed: 44.24] [added: 45.10] | | | | [removed: 32.40] [added: 44.24] | | | | [removed: 21.06] [added: 32.40] | | | | [removed: 20.12] [added: 21.06] | | |
| Stock price low | [removed: 37.02] [added: 42.89] | | | | [removed: 27.33] [added: 37.02] | | | | [removed: 15.93] [added: 27.33] | | | | [removed: 14.07] [added: 15.93] | | | | [removed: 14.59] [added: 14.07] | | |
| b. | Fiscal 2015 [added: was a 53-week year, while the other years presented were 52-week years. Fiscal 2015] included a $169 million pretax impairment charge related to our China operation, $57 million pretax expense related to merger and integration costs, $59 million pretax impairment charges related to our Prepared Foods network optimization, $12 million pretax charges related to Denison impairment and plant closure costs, $8 million pretax gain related to net insurance proceeds (net of costs) related to a legacy Hillshire Brands plant fire, $21 million pretax gain on the sale of equity securities, $161 million pretax gain on the sale of the Mexico operation, $39 million pretax gain related to the impact of the additional week in fiscal 2015 and $26 million unrecognized tax benefit gain. |
| [removed: g.] [added: f.] | Return on invested capital is calculated by dividing operating income by the sum of the average of beginning and ending total debt and shareholders’ equity less cash and cash equivalents. |
| [removed: h.] [added: g.] | For the total debt to capitalization calculation, capitalization is defined as total debt plus total shareholders’ equity. |
| Net income | $ | [removed: 1,224] [added: 1,772] | | | $ | [removed: 856] [added: 1,224] | | | $ | [removed: 778] [added: 856] | | | $ | [removed: 576] [added: 778] | | | $ | [removed: 733] [added: 576] | |
| Less: Interest income | [removed: (9] [added: (6] | | ) | | [removed: (7] [added: (9] | | ) | | (7 | | ) | | [removed: (12] [added: (7] | | ) | | [removed: (11] [added: (12] | | ) |
| Add: Interest expense | [removed: 293] [added: 249] | | | | [removed: 132] [added: 293] | | | | [removed: 145] [added: 132] | | | | [removed: 356] [added: 145] | | | | [removed: 242] [added: 356] | | |
| Add: Income tax expense (a) | [removed: 697] [added: 826] | | | | [removed: 396] [added: 697] | | | | [removed: 411] [added: 396] | | | | [removed: 351] [added: 411] | | | | [removed: 341] [added: 351] | | |
| Add: Depreciation | [removed: 609] [added: 617] | | | | [removed: 494] [added: 609] | | | | [removed: 474] [added: 494] | | | | [removed: 443] [added: 474] | | | | [removed: 433] [added: 443] | | |
| Add: Amortization (b) | [removed: 92] [added: 80] | | | | [removed: 26] [added: 92] | | | | [removed: 17] [added: 26] | | | | 17 | | | | [removed: 29] [added: 17] | | |
| EBITDA | $ | [removed: 2,906] [added: 3,538] | | | $ | [removed: 1,897] [added: 2,906] | | | $ | [removed: 1,818] [added: 1,897] | | | $ | [removed: 1,731] [added: 1,818] | | | $ | [removed: 1,767] [added: 1,731] | |
| Less: Cash and cash equivalents | [removed: (688] [added: (349] | | ) | | [removed: (438] [added: (688] | | ) | | [removed: (1,145] [added: (438] | | ) | | [removed: (1,071] [added: (1,145] | | ) | | [removed: (716] [added: (1,071] | | ) |
| Less: Short-term investments | [removed: (2] [added: (4] | | ) | | [removed: (1] [added: (2] | | ) | | (1 | | ) | | [removed: (3] [added: (1] | | ) | | [removed: (2] [added: (3] | | ) |
| Gross debt/EBITDA | [removed: 2.3x] [added: 1.8x] | | | | [removed: 4.3x] [added: 2.3x] | | | | [removed: 1.3x] [added: 4.3x] | | | | [removed: 1.4x] [added: 1.3x] | | | | [removed: 1.2x] [added: 1.4x] | | |
| Net debt/EBITDA | [removed: 2.1x] [added: 1.7x] | | | | [removed: 4.1x] [added: 2.1x] | | | | [removed: 0.7x] [added: 4.1x] | | | | [removed: 0.8x] [added: 0.7x] | | | | 0.8x | | |
| (b) | Excludes the amortization of debt discount expense of [added: $8 million,] $10 million, $10 million, $28 [removed: million, $39] million and [removed: $44] [added: $39] million for fiscal [added: 2016,] 2015, 2014, [removed: 2013, 2012] [added: 2013] and [removed: 2011,] [added: 2012,] respectively, as it is included in Interest expense. |
Investors should rely primarily on our GAAP [removed: results] [added: results,] and use non-GAAP financial measures only [removed: supplementally] [added: supplementally,] in making investment decisions.
| Total assets | 22,373 | | | | 22,969 | | | | 23,906 | | | | 12,167 | | | | 11,882 | | |
| Total debt | 6,279 | | | | 6,690 | | | | 8,128 | | | | 2,398 | | | | 2,418 | | |
| Total debt to capitalization | 39.5 | | % | | 40.8 | | % | | 47.7 | | % | | 27.8 | | % | | 28.6 | | % |
| a. | Fiscal 2016 net income included $53 million related to the recognition of previously unrecognized tax benefits and audit settlements. In fiscal 2016, we adopted new accounting guidance, retrospectively, requiring classification of debt issuance costs as a reduction of the carrying value of the debt. In doing so, $29 million, $35 million, $50 million, $10 million and $14 million of deferred issuance costs have been reclassified from Other Assets to Long-Term Debt in our Consolidated Balance Sheets for fiscal 2016, 2015, 2014, 2013 and 2012 respectively. This change is reflected above in total assets, total debt, total debt to capitalization and return on invested capital ratios. |
| h. | In fiscal 2016, we changed our methodology of calculating the book value per share to include the remaining minimum shares that will be issued from our tangible equity units for each period presented above. |
| | 2016 | | | | 2015 | | | | 2014 | | | | 2013 | | | | 2012 | | |
| Total gross debt (c) | $ | 6,279 | | | $ | 6,690 | | | $ | 8,128 | | | $ | 2,398 | | | $ | 2,418 | |
| Total net debt | $ | 5,926 | | | $ | 6,000 | | | $ | 7,689 | | | $ | 1,252 | | | $ | 1,344 | |
| | |
| --- | --- |
| (c) | In fiscal 2016, we adopted new accounting guidance, retrospectively, requiring classification of debt issuance costs as a reduction of the carrying value of the debt. In doing so, $29 million, $35 million, $50 million, $10 million and $14 million of deferred issuance costs have been reclassified from Other Assets to Long-Term Debt in our Consolidated Balance Sheets for fiscal 2016, 2015, 2014, 2013 and 2012, respectively. |
| Total assets | 23,004 | | | | 23,956 | | | | 12,177 | | | | 11,896 | | | | 11,071 | | |
| Total debt | 6,725 | | | | 8,178 | | | | 2,408 | | | | 2,432 | | | | 2,182 | | |
| Total debt to capitalization | 40.9 | | % | | 47.9 | | % | | 27.9 | | % | | 28.7 | | % | | 27.7 | | % |
| a. | Fiscal 2015 was a 53-week year, while the other years presented were 52-week years. |
| f. | Fiscal 2011 included an $11 million non-operating gain related to the sale of interest in an equity method investment and a $21 million reduction to income tax expense related to a reversal of reserves for foreign uncertain tax positions. |
| Total gross debt | $ | 6,725 | | | $ | 8,178 | | | $ | 2,408 | | | $ | 2,432 | | | $ | 2,182 | |
| Total net debt | $ | 6,035 | | | $ | 7,739 | | | $ | 1,262 | | | $ | 1,358 | | | $ | 1,464 | |
Item 8. FINANCIAL STATEMENTS AND SUPPLEMENTARY DATA
572 rewritten, 171 added, 394 removed, 892 unchanged
| | Three years ended October [removed: 3, 2015] [added: 1, 2016] | | | | | | | | | | |
| | [removed: 2015] [added: 2016] | | | | [removed: 2014] [added: 2015] | | | | [removed: 2013] [added: 2014] | | |
| Sales | $ | [removed: 41,373] [added: 36,881] | | | $ | [removed: 37,580] [added: 41,373] | | | $ | [removed: 34,374] [added: 37,580] | |
| Cost of Sales | [removed: 37,456] [added: 32,184] | | | | [removed: 34,895] [added: 37,456] | | | | [removed: 32,016] [added: 34,895] | | |
| Gross Profit | [removed: 3,917] [added: 4,697] | | | | [removed: 2,685] [added: 3,917] | | | | [removed: 2,358] [added: 2,685] | | |
| Selling, General and Administrative | [removed: 1,748] [added: 1,864] | | | | [removed: 1,255] [added: 1,748] | | | | [removed: 983] [added: 1,255] | | |
| Operating Income | [removed: 2,169] [added: 2,833] | | | | [removed: 1,430] [added: 2,169] | | | | [removed: 1,375] [added: 1,430] | | |
| Interest income | [removed: (9] [added: (6] | | ) | | [removed: (7] [added: (9] | | ) | | (7 | | ) |
| Interest expense | [removed: 293] [added: 249] | | | | [removed: 132] [added: 293] | | | | [removed: 145] [added: 132] | | |
| Other, net | [removed: (36] [added: (8] | | ) | | [removed: 53] [added: (36] | | [added: )] | | [removed: (20] [added: 53] | | [removed: )] |
| Total Other (Income) Expense | [removed: 248] [added: 235] | | | | [removed: 178] [added: 248] | | | | [removed: 118] [added: 178] | | |
| Income from Continuing Operations before Income Taxes | [removed: 1,921] | | | | [removed: 1,252] | | | | [removed: 1,257] | | | [added: | | | | | | | | | | | | | 2,598 | | |]
| Income Tax Expense | [removed: 697] [added: 826] | | | | [removed: 396] [added: 697] | | | | [removed: 409] [added: 396] | | |
| Net Income | [removed: 1,224] [added: 1,772] | | | | [removed: 856] [added: 1,224] | | | | [removed: 778] [added: 856] | | |
| Less: Net Income (Loss) Attributable to Noncontrolling Interests | 4 | | | | [removed: (8] [added: 4] | | [removed: )] | | [removed: —] [added: (8] | | [added: )] |
| Net Income Attributable to Tyson | $ | [removed: 1,220] [added: 1,768] | | | $ | [removed: 864] [added: 1,220] | | | $ | [removed: 778] [added: 864] | |
| Class A Basic | [removed: 335] [added: 315] | | | | [removed: 284] [added: 335] | | | | [removed: 282] [added: 284] | | |
| Diluted | [removed: 413] [added: 390] | | | | [removed: 364] [added: 413] | | | | [removed: 367] [added: 364] | | |
| [removed: Net Income Per Share] [added: Pro forma net income per diluted share] from [removed: Continuing Operations Attributable] [added: continuing operations attributable] to [removed: Tyson: | | | | | | | |] [added: Tyson] | [added: $] | [added: 2.50] | |
| Class A Basic | $ | [removed: 3.06] [added: 4.67] | | | $ | [removed: 2.48] [added: 3.06] | | | $ | [removed: 2.46] [added: 2.48] | |
| Class B Basic | $ | [removed: 2.79] [added: 4.24] | | | $ | [removed: 2.26] [added: 2.79] | | | $ | [removed: 2.22] [added: 2.26] | |
| Diluted | $ | [removed: 2.95] [added: 4.53] | | | $ | [removed: 2.37] [added: 2.95] | | | $ | [removed: 2.31] [added: 2.37] | |
| Class A Basic | $ | [removed: 3.06] [added: 4.67] | | | $ | [removed: 2.48] [added: 3.06] | | | $ | [removed: 2.26] [added: 2.48] | |
| Class B Basic | $ | [removed: 2.79] [added: 4.24] | | | $ | [removed: 2.26] [added: 2.79] | | | $ | [removed: 2.04] [added: 2.26] | |
| Diluted | $ | [removed: 2.95] [added: 4.53] | | | $ | [removed: 2.37] [added: 2.95] | | | $ | [removed: 2.12] [added: 2.37] | |
| Class A | $ | [removed: 0.425] [added: 0.650] | | | $ | [removed: 0.325] [added: 0.425] | | | $ | [removed: 0.310] [added: 0.325] | |
| Class B | $ | [removed: 0.383] [added: 0.585] | | | $ | [removed: 0.294] [added: 0.383] | | | $ | [removed: 0.279] [added: 0.294] | |
| Net Income | $ | [removed: 1,224] [added: 1,772] | | | $ | [removed: 856] [added: 1,224] | | | $ | [removed: 778] [added: 856] | |
| Derivatives accounted for as cash flow hedges | [removed: 2] [added: (1] | | [added: )] | | [removed: 1] [added: 2] | | | | [removed: (14] [added: 1] | | [removed: )] |
| Investments | [removed: (1] [added: —] | | [removed: )] | | [removed: 4] [added: (1] | | [added: )] | | [removed: (3] [added: 4] | | [removed: )] |
| Currency translation | [removed: 36] [added: 4] | | | | [removed: (30] [added: 36] | | [removed: )] | | [removed: (37] [added: (30] | | ) |
| Postretirement benefits | [removed: 20] [added: 42] | | | | [removed: (14] [added: 20] | | [removed: )] | | [removed: 9] [added: (14] | | [added: )] |
| Total Other Comprehensive Income (Loss), Net of Taxes | [removed: 57] [added: 45] | | | | [removed: (39] [added: 57] | | [removed: )] | | [removed: (45] [added: (39] | | ) |
| Comprehensive Income | [removed: 1,281] [added: 1,817] | | | | [removed: 817] [added: 1,281] | | | | [removed: 733] [added: 817] | | |
| Less: Comprehensive Income [removed: (Loss)] Attributable to Noncontrolling Interests | 4 | | | | [removed: (8] [added: 4] | | [removed: )] | | [removed: —] [added: (8] | | [added: )] |
| Comprehensive Income Attributable to Tyson | $ | [removed: 1,277] [added: 1,813] | | | $ | [removed: 825] [added: 1,277] | | | $ | [removed: 733] [added: 825] | |
| [added: | |] October [added: 1, 2016 | | | | | | | October] 3, [removed: 2015, and] [added: 2015 | | | | | | |] September 27, 2014 | | | | | | [removed: | |]
| | [added: 2016 | | | |] 2015 | | | | 2014 | | |
| Cash and cash equivalents | $ | [removed: 688] [added: 349] | | | $ | [removed: 438] [added: 688] | |
| Accounts receivable, net | [removed: 1,620] [added: 1,542] | | | | [removed: 1,684] [added: 1,620] | | |
| Income before Income Taxes | 2,598 | | | | 1,921 | | | | 1,252 | | |
| October 1, 2016, and October 3, 2015 | | | | | | | |
| Total Assets | $ | 22,373 | | | $ | 22,969 | |
| | | | | | | | | Three years ended October 1, 2016 | | | | | | | | | | | | |
| | Three years ended October 1, 2016 | | | | | | | | | | |
| Net income | $ | 1,772 | | | $ | 1,224 | | | $ | 856 | |
| | 2016 | | | | 2015 | | |
Brands and trademarks are generally based on the straight-line method over 20 years or less.
Customer relationships are generally amortized over seven to 17 years based on the pattern of revenue expected to be generated from the use of the asset.
| | 2016 | | | | 2015 | | |
Marketing and Promotion Costs: We promote our products with marketing, advertising, trade promotions, and consumer incentives, which include, but are not limited to, coupons, discounts, rebates, and volume-based incentives.
Advertising Expenses: Advertising expense is charged to operations in the period incurred and is recorded as selling, general and administrative expense.
Advertising expense totaled $238 million, $181 million and $112 million in fiscal 2016, 2015 and 2014, respectively.
In August 2016, the Financial Accounting Standards Board ("FASB") issued guidance which aims to eliminate diversity in practice in how certain cash receipts and cash payments are presented and classified in the statement of cash flows.
Early adoption is permitted and the retrospective transition method should be applied.
In March 2016, the FASB issued guidance which simplifies several aspects of the accounting for employee share-based payment transactions, including the accounting for income taxes, forfeitures, and statutory tax withholding requirements, as well as classification of related amounts within the statement of cash flows and impact on earnings per share.
Early adoption is permitted and the application of the guidance requires various transition methods depending on the specific amendment.
We are currently evaluating the impact this guidance will have on our consolidated financial statements.
In February 2016, the FASB issued guidance which created new accounting and reporting guidelines for leasing arrangements.
The guidance requires lessees to recognize a right-of-use asset and lease liability for all leases with terms of more than 12 months.
Recognition, measurement and presentation of expenses and cash flows arising from a lease will depend on classification as a finance or operating lease.
The guidance also requires qualitative and quantitative disclosures regarding the amount, timing, and uncertainty of cash flows arising from leases.
The guidance is effective for annual reporting periods and interim periods within those annual reporting periods beginning after December 15, 2018, our fiscal 2020.
Early adoption is permitted and the modified retrospective method should be applied.
We are currently evaluating the impact this guidance will have on our consolidated financial statements.
In January 2016, the FASB issued guidance that requires most equity investments be measured at fair value, with subsequent changes in fair value recognized in net income.
The guidance also impacts financial liabilities under the fair value option and the presentation and disclosure requirements on the classification and measurement of financial instruments.
The guidance is effective for annual reporting periods and interim periods within those annual reporting periods beginning after December 15, 2017, our fiscal 2019.
It should be applied by means of a cumulative-effect adjustment to the balance sheet as of the beginning of the fiscal year of adoption, unless, equity securities do not have readily determinable fair values, in which case, the amendments should be applied prospectively.
We are currently evaluating the impact this guidance will have on our consolidated financial statements.
The guidance is effective for annual reporting periods and interim periods within those annual reporting periods beginning after December 15, 2016, our fiscal 2018.
We are currently evaluating the impact this guidance will have on our consolidated financial statements.
The guidance is effective for annual reporting periods and interim periods within those annual reporting periods beginning after December 15, 2015, our fiscal 2017, and should be applied prospectively or retrospectively, of which we will apply prospectively.
The adoption of this guidance is not expected to have a material impact on our consolidated financial statements.
Early adoption is permitted and the retrospective or modified retrospective transition method should be applied.
We are currently evaluating the impact this guidance will have on our consolidated financial statements.
NOTE 2: CHANGES IN ACCOUNTING PRINCIPLES
In November 2015, the FASB issued guidance to simplify the presentation of deferred income taxes.
The guidance requires that deferred tax liabilities and assets be classified as non-current in the balance sheet.
The guidance is effective for annual reporting periods and interim periods within those annual reporting periods beginning after December 15, 2016, our fiscal 2018, and may be applied either prospectively to all deferred tax liabilities and assets or retrospectively to all periods presented.
| | | | | | | | | | | | |
| --- | --- | --- | --- | --- | --- | --- | --- | --- | --- | --- | --- |
| Income from Continuing Operations | 1,224 | | | | 856 | | | | 848 | | |
| Loss from Discontinued Operation, Net of Tax | — | | | | — | | | | (70 | | ) |
| Amounts Attributable to Tyson: | | | | | | | | | | | |
| Net Income from Continuing Operations | 1,220 | | | | 864 | | | | 848 | | |
| Net Loss from Discontinued Operation | — | | | | — | | | | (70 | | ) |
| Net Loss Per Share from Discontinued Operation Attributable to Tyson: | | | | | | | | | | | |
| Class A Basic | $ | — | | | $ | — | | | $ | (0.20 | ) |
| Class B Basic | $ | — | | | $ | — | | | $ | (0.18 | ) |
| Diluted | $ | — | | | $ | — | | | $ | (0.19 | ) |
| | | | | | | | |
| --- | --- | --- | --- | --- | --- | --- | --- |
| Assets held for sale | — | | | | 446 | | |
| Other Assets | 612 | | | | 623 | | |
| Total Assets | $ | 23,004 | | | $ | 23,956 | |
| Liabilities held for sale | — | | | | 141 | | |
Under these valuation approaches, we are required to make estimates and assumptions about sales, operating margins, growth rates, royalty rates and discount rates based on budgets, business plans, economic projections, anticipated future cash flows and marketplace data.
We did not have material indefinite life intangible assets prior to the acquisition of Hillshire Brands in August 2014.
Advertising and promotion expenses for fiscal 2015, 2014 and 2013 were $966 million, $641 million and $555 million, respectively.
Reclassification: We reclassified Share-based compensation expense, which was previously included in Other, net within the cash flows from operating activities in the Consolidated Statements of Cash Flows to conform to the current period presentation.
Early adoption is permitted.
In April 2014, the FASB issued guidance changing the criteria for reporting discontinued operations.
The guidance also modifies the related disclosure requirements.
Early adoption is permitted and we adopted it in fiscal 2014.
The following table summarizes the fair values of the assets acquired and liabilities assumed at the acquisition date.
The purchase price was allocated based on information available at the acquisition date.
| | | | | |
| --- | --- | --- | --- | --- |
| Accounts receivable | | 236 | | |
| Inventories | | 414 | | |
| Goodwill | | 4,790 | | |
| Accounts payable | | (347 | | ) |
| Other current liabilities | | (327 | | ) |
| Other Liabilities | | (500 | | ) |
| Net asset acquired | | $ | 8,244 | |
The fair value of identifiable intangible assets at the acquisition date is as follows:
| Intangible Asset Category | | Type | | Life in Years | | Fair Value | | |
| Brands & trademarks | | Non-amortizable | | Indefinite | | $ | 4,062 | |
| Brands & trademarks | | Amortizable | | 20 years | | 532 | | |
An excerpt. Shown here: 40 of 572 rewritten, 40 of 171 added and 40 of 394 removed. The counts are complete. For every sentence, read Item 8. FINANCIAL STATEMENTS AND SUPPLEMENTARY DATA in the FY2016 filing and the FY2015 filing.
Item 9A. CONTROLS AND PROCEDURES
5 rewritten, 0 added, 1 removed, 9 unchanged
Based on that evaluation, the CEO and CFO concluded that, as of October [removed: 3, 2015,] [added: 1, 2016,] our disclosure controls and procedures were effective.
In the quarter ended October [removed: 3, 2015,] [added: 1, 2016,] there have been no changes in the Company’s internal control over financial reporting that have materially affected, or are reasonably likely to materially affect, the Company’s internal control over financial reporting.
Management conducted an evaluation of the effectiveness of our internal control over financial reporting as of October [removed: 3, 2015.][added: 1, 2016.]
Based on this evaluation under the framework in Internal Control – Integrated Framework (2013) issued by COSO, management concluded the Company’s internal control over financial reporting was effective as of October [removed: 3, 2015.][added: 1, 2016.]
The Company’s independent registered public accounting firm, PricewaterhouseCoopers LLP, who has audited the fiscal [removed: 2015] [added: 2016] financial statements included in this Annual Report on Form [removed: 10-K] [added: 10-K,] has also audited the effectiveness of the Company’s internal control over financial [removed: reporting.][added: reporting as of October 1, 2016, as stated in its report which appears in Part II, Item 8 of this Annual Report on Form 10-K.]
Its report appears in Part II, Item 8 of this Annual Report on Form 10-K.
Item 9B. OTHER INFORMATION
0 rewritten, 1 added, 9 removed, 1 unchanged
None
On November 19, 2015, we entered into a new employment agreement with Donnie Smith, our President and Chief Executive Officer.
This contract replaces the previous contract for Mr. Smith entered into November 14, 2012.
Mr. Smith’s agreement provides for an annual base salary of $1,175,000.
The agreement provides for eligibility for (i) performance and incentive awards under annual and long-term cash and equity incentive plans then in effect, on terms and in amounts consistent with those as determined by and subject to the discretion of the Compensation and Leadership Development Committee of our Board of Directors, (ii) the Company’s supplemental executive retirement plan, (iii) any benefit programs generally applicable to executive officers of the Company, and (iv) use of Company-owned assets, including aircraft up to 50 hours annually, subject to the Company’s use and policies, along with reimbursement and gross-up for any tax liability associated with such use.
Mr. Smith may terminate his employment under the agreement, subject to confidentiality and non-compete obligations contained therein, upon 30 days’ prior written notice to the Company.
The Company has the right to terminate the agreement at any time upon written notice to Mr. Smith.
Any such termination without cause is subject to the Company’s obligation to continue to pay base salary for 36 months following termination consistent with the Severance Pay Plan for Contracted Officers and subject to provisions relating to the early vesting of stock options, restricted stock and performance stock awards.
Upon the occurrence of a change in control (as defined in the agreement), all previously granted restricted stock, performance stock and stock option awards will be treated in accordance with the applicable award agreement.
The foregoing description of Mr. Smith’s employment agreement is qualified in its entirety by reference to the full text of such agreement, which is filed as Exhibit 10.17 to this Form 10-K and incorporated by reference herein.
Item 10. DIRECTORS, EXECUTIVE OFFICERS AND CORPORATE GOVERNANCE
1 rewritten, 0 added, 0 removed, 4 unchanged
See information set forth under the captions “Election of Directors”, "Information Regarding the Board and its [removed: Committees",] [added: Committees" and] "Report of the Audit Committee" [removed: and “Section 16(a) Beneficial Ownership Reporting Compliance”] in the Company’s definitive Proxy Statement for the Company’s Annual Meeting of Shareholders to be held February [removed: 5, 2016] [added: 9, 2017] (the “Proxy Statement”), which information is incorporated herein by reference.
Item 11. EXECUTIVE COMPENSATION
1 rewritten, 0 added, 0 removed, 1 unchanged
See the information set forth under the captions “Executive Compensation,” “Director Compensation For Fiscal Year [removed: 2015,”] [added: 2016,”] “Compensation Discussion and Analysis,” “Report of the Compensation and Leadership Development Committee,” [removed: and] “Compensation Committee Interlocks and Insider [removed: Participation”] [added: Participation”, and "Section 16(a) Beneficial Ownership Reporting Compliance"] in the Proxy Statement, which information is incorporated herein by reference.
Item 12. SECURITY OWNERSHIP OF CERTAIN BENEFICIAL OWNERS AND MANAGEMENT AND RELATED STOCKHOLDER MATTERS
3 rewritten, 3 added, 2 removed, 10 unchanged
The following information reflects certain information about our equity compensation plans as of October [removed: 3, 2015:][added: 1, 2016:]
| | Number of Securities to be issued upon exercise of outstanding options | | | Weighted average exercise price of outstanding options | | | | Number of Securities remaining available for future issuance under equity compensation plans (excluding Securities reflected in the first column [removed: (a))] [added: (a) (b))] | |
| (a) | Shares available for future issuance as of October [removed: 3, 2015,] [added: 1, 2016,] under the Stock Incentive Plan [removed: (24,293,913),] [added: (20,726,621),] the Employee Stock Purchase Plan [removed: (16,215,229)] [added: (15,409,556)] and the Retirement Savings Plan (7,647,608) |
| Equity compensation plans approved by security holders | 11,191,656 | | | $ | 33.74 | | | 43,783,785 | |
| Total | 11,191,656 | | | $ | 33.74 | | | 43,783,785 | |
| (b) | "Securities" and "shares" refer to the Company's Class A common stock. |
| Equity compensation plans approved by security holders | 14,735,065 | | | $ | 28.30 | | | 48,156,750 | |
| Total | 14,735,065 | | | $ | 28.30 | | | 48,156,750 | |
Item 15. EXHIBITS, FINANCIAL STATEMENT SCHEDULES
92 rewritten, 44 added, 9 removed, 188 unchanged
Consolidated Statements of Income for the three years ended October [removed: 3, 2015][added: 1, 2016]
Consolidated Statements of Comprehensive Income for the three years ended October [removed: 3, 2015][added: 1, 2016]
Consolidated Balance Sheets at October [removed: 3, 2015,] [added: 1, 2016,] and [removed: September 27, 2014][added: October 3, 2015]
Consolidated Statements of Shareholders’ Equity for the three years ended October [removed: 3, 2015][added: 1, 2016]
Consolidated Statements of Cash Flows for the three years ended October [removed: 3, 2015][added: 1, 2016]
Financial Statement Schedule - Schedule II Valuation and Qualifying Accounts for the three years ended October [removed: 3, 2015][added: 1, 2016]
| | By: | /s/ Dennis Leatherby | | November [removed: 23, 2015] [added: 21, 2016] |
| | | Executive Vice President and Chief Financial Officer [added: (Principal Financial Officer)] | | |
| /s/ Gaurdie E. Banister Jr. | | Director | | November [removed: 23, 2015] [added: 21, 2016] |
| /s/ Curt T. Calaway | | Senior Vice President, Controller and | | November [removed: 23, 2015] [added: 21, 2016] |
| /s/ Mikel A. Durham | | Director | | November [removed: 23, 2015] [added: 21, 2016] |
| /s/ Dennis Leatherby | | Executive Vice President and Chief Financial Officer | | November [removed: 23, 2015] [added: 21, 2016] |
| /s/ Kevin M. McNamara | | Director | | November [removed: 23, 2015] [added: 21, 2016] |
| /s/ Brad T. Sauer | | Director | | November [removed: 23, 2015] [added: 21, 2016] |
| /s/ Donnie Smith | | [removed: Director, President] [added: Director] and Chief Executive Officer | | November [removed: 23, 2015] [added: 21, 2016] |
| /s/ Robert C. Thurber | | Director | | November [removed: 23, 2015] [added: 21, 2016] |
| /s/ Barbara A. Tyson | | Director | | November [removed: 23, 2015] [added: 21, 2016] |
| /s/ John Tyson | | Chairman of the Board of Directors | | November [removed: 23, 2015] [added: 21, 2016] |
| [removed: 4.4] [added: 4.17] | | Form of [removed: 6.60% Senior Notes due April 1, 2016, issued under the Company Indenture] [added: Unit] (previously filed as Exhibit 4.1 to the Company’s Current Report on Form 8-K filed [removed: March 22, 2006,] [added: August 5, 2014,] Commission File No. 001-14704, and incorporated herein by reference). |
| [removed: 4.5] [added: 4.4] | | Supplemental Indenture, dated as of September 18, 2006, by and among the Company, Tyson Fresh Meats, Inc. and JPMorgan Chase Bank, National Association, supplementing the Company Indenture (previously filed as Exhibit 10.1 to the Company’s Current Report on Form 8-K filed September 19, 2006, Commission File No. 001-14704, and incorporated herein by reference). |
| [removed: 4.6] [added: 4.5] | | Supplemental Indenture dated as of September 15, 2008, by and between the Company and The Bank of New York Mellon Trust Company, National Association (as successor to JPMorgan Chase Bank, N.A. (formerly The Chase Manhattan Bank, N.A.)), as Trustee (including the form of 3.25% Convertible Senior Notes due 2013), supplementing the Company Indenture (previously filed as Exhibit 4.2 to the Company’s Current Report on Form 8-K filed September 15, 2008, Commission File No. 001-14704, and incorporated herein by reference). |
| [removed: 4.7] [added: 4.6] | | Supplemental Indenture dated as of June 13, 2012, by and between the Company and The Bank of New York Mellon Trust Company, National Association (as successor to JPMorgan Chase Bank, N.A. (formerly The Chase Manhattan Bank, N.A.)), as Trustee, supplementing the Company Indenture (previously filed as Exhibit 4.1 to the Company's Current Report on Form 8-K filed June 13, 2012, Commission File No. 001-14704, and incorporated herein by reference). |
| [removed: 4.8] [added: 4.7] | | Form of 4.50% Senior Note due 2022 (previously filed as Exhibit 4.2 and included in Exhibit 4.1 to the Company's Current Report on Form 8‑K filed June 13, 2012, Commission File No. 001‑14704, and incorporated herein by reference). |
| [removed: 4.9] [added: 4.8] | | Supplemental Indenture dated as of August 8, 2014, by and between the Company and The Bank of New York Mellon Trust Company, National Association (as successor to JPMorgan Chase Bank, N.A. (formerly The Chase Manhattan Bank, N.A.)), as Trustee, supplementing the Company Indenture (previously filed as Exhibit 4.2 to the Company's Current Report on Form 8-K filed August 8, 2014, Commission File No. 001-14704, and incorporated herein by reference). |
| [removed: 4.10] [added: 4.9] | | Form of 2.65% Senior Note due 2019 [removed: (included in] [added: (previously filed as] Exhibit 4.2 to the Company's Current Report on Form 8‑K filed August 8, 2014, Commission File No. 001‑14704, and incorporated herein by reference). |
| [removed: 4.11] [added: 4.10] | | Supplemental Indenture dated as of August 8, 2014, by and between the Company and The Bank of New York Mellon Trust Company, National Association (as successor to JPMorgan Chase Bank, N.A. (formerly The Chase Manhattan Bank, N.A.)), as Trustee, supplementing the Company Indenture (previously filed as Exhibit 4.4 to the Company's Current Report on Form 8-K filed August 8, 2014, Commission File No. 001-14704, and incorporated herein by reference). |
| [removed: 4.12] [added: 4.11] | | Form of 3.95% Senior Note due 2024 (included in Exhibit 4.4 to the Company's Current Report on Form 8‑K filed August 8, 2014, Commission File No. 001‑14704, and incorporated herein by reference). |
| [removed: 4.13] [added: 4.12] | | Supplemental Indenture dated as of August 8, 2014, by and between the Company and The Bank of New York Mellon Trust Company, National Association (as successor to JPMorgan Chase Bank, N.A. (formerly The Chase Manhattan Bank, N.A.)), as Trustee, supplementing the Company Indenture (previously filed as Exhibit 4.6 to the Company's Current Report on Form 8-K filed August 8, 2014, Commission File No. 001-14704, and incorporated herein by reference). |
| [removed: 4.14] [added: 4.13] | | Form of 4.875% Senior Note due 2034 (included in Exhibit 4.6 to the Company's Current Report on Form 8‑K filed August 8, 2014, Commission File No. 001‑14704, and incorporated herein by reference). |
| [removed: 4.15] [added: 4.14] | | Supplemental Indenture dated as of August 8, 2014, by and between the Company and The Bank of New York Mellon Trust Company, National Association (as successor to JPMorgan Chase Bank, N.A. (formerly The Chase Manhattan Bank, N.A.)), as Trustee, supplementing the Company Indenture (previously filed as Exhibit 4.8 to the Company's Current Report on Form 8-K filed August 8, 2014, Commission File No. 001-14704, and incorporated herein by reference). |
| [removed: 4.16] [added: 4.15] | | Form of 5.15% Senior Note due 2044 [removed: (included in] [added: (previously filed as] Exhibit 4.8 to the Company's Current Report on Form 8‑K filed August 8, 2014, Commission File No. 001‑14704, and incorporated herein by reference). |
| [removed: 4.17] [added: 4.16] | | Purchase Contract Agreement dated as of August 5, 2014, by and between the Company and The Bank of New York Mellon Trust Company, N.A., as Purchase Contract Agent [removed: (included in] [added: (previously filed as] Exhibit 4.1 of the Company’s Current Report on Form 8-K filed August 5, 2014, Commission File No. 001-14704, and incorporated herein by reference). |
| 4.18 | | Form of [removed: Unit] [added: Purchase Contract] (previously filed as Exhibit 4.1 to the Company’s Current Report on Form 8-K filed August 5, 2014, Commission File No. 001-14704, and incorporated herein by reference). |
| [removed: 4.19] [added: 4.20] | | Form of [removed: Purchase Contract] [added: Amortizing Note] (previously filed as Exhibit [removed: 4.1] [added: 4.5] to the Company’s Current Report on Form 8-K filed August 5, 2014, Commission File No. 001-14704, and incorporated herein by reference). |
| [removed: 4.20] [added: 4.19] | | Supplemental Indenture dated as of August 5, 2014, by and between the Company and The Bank of New York Mellon Trust Company, N.A., as Trustee, supplementing the Company Indenture [removed: (included in] [added: (previously filed as] Exhibit 4.5 of the Company’s Current Report on Form 8-K filed August 5, 2014, Commission File No. 001-14704, and incorporated herein by reference). |
| [removed: 4.21] [added: 10.21] | [added: *] | [removed: Form] [added: Letter Agreement dated as] of [removed: Amortizing Note] [added: June 13, 2016, between the Company and Donnie Smith] (previously filed as Exhibit [removed: 4.5] [added: 10.2] to the Company’s Current Report on Form 8-K filed [removed: August 5, 2014,] [added: June 14, 2016,] Commission File No. 001-14704, and incorporated herein by reference). |
| [removed: 4.22] [added: 4.21] | | Indenture dated October 2, 1990, between Sara Lee Corporation and Continental Bank, N.A., as Trustee (the “Sara Lee Indenture”) (previously filed as Exhibit 4.1 of Amendment No. 1 to Registration Statement No. 33-33603 on Form S-3 by Sara Lee Corporation, predecessor in interest to The Hillshire Brands Company, filed with the Commission on October 5, 1990, Commission File No. 001-03344, and incorporated herein by reference). |
| [removed: 4.23] [added: 4.22] | | Form of 4.10% Notes due 2020 issued pursuant to the Sara Lee Indenture [removed: (included in] [added: (previously filed as] Exhibit 4.2 to Current Report on Form 8-K dated September 7, 2010 by The Hillshire Brands Company, Commission File No. 001-03344, and incorporated herein by reference). |
| [removed: 4.24] [added: 4.23] | | Form of 6.13% Notes due 2032 issued pursuant to the Sara Lee Indenture (previously filed as Exhibit 4.25 to the Company’s Annual Report on Form 10-K for the fiscal year ended September 27, 2014, Commission File No. 001-14704, and incorporated herein by reference). |
| [removed: 10.4] [added: 10.5] | [added: *] | Amended and Restated Employment Agreement, dated as of May 1, 2014, by and between the Company and John Tyson (previously filed as Exhibit 10.1 to the Company’s Quarterly Report on Form 10-Q for the period ended March 29, 2014, Commission File No. 001-14704, and incorporated herein by reference). |
Report on Form 10-K and incorporated herein by reference.
| /s/ Mike Beebe | | Director | | November 21, 2016 |
| Mike Beebe | | | | |
| /s/ Thomas P. Hayes | | Director and President | | November 21, 2016 |
| Thomas P. Hayes | | | | |
| | | | | |
| | | | | |
| 10.4 | | Amendment No. 1 to Term Loan Agreement, dated as of May 5, 2016, by and between the Company and Bank of America, N.A. as lender (previously filed as Exhibit 10.1 to the Company’s Quarterly Report on Form 10-Q for the period ended April 2, 2016, Commission File No. 001-14704, and incorporated herein by reference). |
| 10.17 | * | Employment Agreement, dated November 17, 2015, by and between the Company and Donald J. Smith(previously filed as Exhibit 10.17 to the Company’s Annual Report on Form 10-K for the fiscal year ended October 3, 2015, Commission File No. 001-14704, and incorporated herein by reference). |
| 10.19 | * | Employment Agreement, dated April 25, 2016, by and between the Company and Monica McGurk (previously filed as Exhibit 10.2 to the Company’s Quarterly Report on Form 10-Q for the period ended April 2, 2016, Commission File No. 001-14704, and incorporated herein by reference). |
| 10.20 | * | Amended and Restated Employment Agreement dated as of June 13, 2016, entered into between the Company and Thomas Hayes (previously filed as Exhibit 10.1 to the Company’s Current Report on Form 8-K filed June 14, 2016, Commission File No. 001-14704, and incorporated herein by reference). |
| 10.54 | * | Form of Stock Incentive Award Agreement with non-contracted officers pursuant to which performance stock awards are granted under the Tyson Foods, Inc. 2000 Stock Incentive Plan effective November 30, 2015. 2000 Stock Incentive Plan effective November 30, 2015 (previously filed as Exhibit 10.1 to the Company’s Quarterly Report on Form 10-Q for the period ended January 2, 2016, Commission File No. 001-14704, and incorporated herein by reference). |
| 10.55 | * | Form of Stock Incentive Award Agreement with contracted officers pursuant to which performance stock awards are granted under the Tyson Foods, Inc. 2000 Stock Incentive Plan effective November 30, 2015 (previously filed as Exhibit 10.2 to the Company’s Quarterly Report on Form 10-Q for the period ended January 2, 2016, Commission File No. 001-14704, and incorporated herein by reference). |
| 10.56 | * | Form of Stock Incentive Award Agreement with contracted employees pursuant to which restricted stock awards are granted under the Tyson Foods, Inc. 2000 Stock Incentive Plan effective November 30, 2015 (previously filed as Exhibit 10.3 to the Company’s Quarterly Report on Form 10-Q for the period ended January 2, 2016, Commission File No. 001-14704, and incorporated herein by reference). |
| 10.57 | * | Form of Stock Incentive Award Agreement with non-contracted employees which include non-competition, non-solicitation and confidentiality agreements, pursuant to which restricted stock awards are granted under the Tyson Foods, Inc. 2000 Stock Incentive Plan effective November 30, 2015 (previously filed as Exhibit 10.4 to the Company’s Quarterly Report on Form 10-Q for the period ended January 2, 2016, Commission File No. 001-14704, and incorporated herein by reference). |
| 10.58 | * | Form of Stock Incentive Award Agreement with non-contracted employees pursuant to which restricted stock awards are granted under the Tyson Foods, Inc. 2000 Stock Incentive Plan effective November 30, 2015 (previously filed as Exhibit 10.5 to the Company’s Quarterly Report on Form 10-Q for the period ended January 2, 2016, Commission File No. 001-14704, and incorporated herein by reference). |
| 10.59 | * | Form of Stock Incentive Award Agreement pursuant to which restricted stock awards subject to performance criteria are granted under the Tyson Foods, Inc. 2000 Stock Incentive Plan effective November 30, 2015 (previously filed as Exhibit 10.6 to the Company’s Quarterly Report on Form 10-Q for the period ended January 2, 2016, Commission File No. 001-14704, and incorporated herein by reference). |
| 10.60 | * | Form of Stock Incentive Plan Stock Agreement pursuant to which restricted stock units awards are granted under the Tyson Foods, Inc. 2000 Stock Incentive Plan effective November 30, 2015 (previously filed as Exhibit 10.7 to the Company’s Quarterly Report on Form 10-Q for the period ended January 2, 2016, Commission File No. 001-14704, and incorporated herein by reference). |
| 10.61 | * | Form of Stock Incentive Agreement pursuant to which stock appreciation rights awards are granted under the Tyson Foods, Inc. 2000 Stock Incentive Plan effective November 30, 2015 (previously filed as Exhibit 10.8 to the Company’s Quarterly Report on Form 10-Q for the period ended January 2, 2016, Commission File No. 001-14704, and incorporated herein by reference). |
| 10.62 | * | Form of Stock Incentive Award Agreement with contracted employees pursuant to which stock options awards are granted under the Tyson Foods, Inc. 2000 Stock Incentive Plan effective November 30, 2015 (previously filed as Exhibit 10.9 to the Company’s Quarterly Report on Form 10-Q for the period ended January 2, 2016, Commission File No. 001-14704, and incorporated herein by reference). |
| 10.63 | * | Form of Stock Incentive Award Agreement with non-contracted employees which include non-competition, non-solicitation and confidentiality agreements, pursuant to which stock options awards are granted under the Tyson Foods, Inc. 2000 Stock Incentive Plan effective November 30, 2015 (previously filed as Exhibit 10.10 to the Company’s Quarterly Report on Form 10-Q for the period ended January 2, 2016, Commission File No. 001-14704, and incorporated herein by reference). |
| 10.64 | * | Form of Stock Incentive Award Agreement with non-contracted employees pursuant to which stock options awards are granted under the Tyson Foods, Inc. 2000 Stock Incentive Plan effective November 30, 2015 (previously filed as Exhibit 10.11 to the Company’s Quarterly Report on Form 10-Q for the period ended January 2, 2016, Commission File No. 001-14704, and incorporated herein by reference). |
| | | |
| --- | --- | --- |
| | | |
| | | |
| | | |
| | | |
| | | |
| 10.68 | * | Amended and Restated Tyson Foods, Inc. Supplemental Executive Retirement and Life Insurance Premium Plan effective January 1, 2017. |
| | | |
| | | |
| | | |
| | | |
| | | |
| | | |
| | | |
| | | |
| | | |
| | | |
Report on Form 10-K.
| /s/ Jim Kever | | Director | | November 23, 2015 |
| Jim Kever | | | | |
| 10.17 | | Employment Agreement, dated November 17, 2015, by and between the Company and Donald J. Smith. |
| 10.18 | | Employment Agreement, dated August 29, 2013, by and between the Company and Michael V. Roetzel. |
| 10.19 | | Employment Agreement, dated August 28, 2015, by and between the Company and Curt T. Calaway. |
| 2013 | | 33 | | | | 17 | | | | — | | | | (4 | | ) | | 46 | | |
| 2013 | | 24 | | | | 49 | | | | — | | | | (57 | | ) | | 16 | | |
| 2013 | | 78 | | | | 8 | | | | — | | | | (9 | | ) | | 77 | | |
An excerpt. Shown here: 40 of 92 rewritten, 40 of 44 added and all 9 removed. The counts are complete. For every sentence, read Item 15. EXHIBITS, FINANCIAL STATEMENT SCHEDULES in the FY2016 filing and the FY2015 filing.