 filings.tools
Tyson Foods (TSN) 10-K risk factor changes: FY2015 vs FY2014
The 2015-10-03 10-K against the 2014-09-27 one, compared heading by heading and sentence by sentence. One of these filings carries no fiscal year tag, so its year is the calendar year of the period end.
Item 1A21 rewritten8 added1 removed293 unchanged
All filing items1,137 rewritten494 added479 removed2,440 unchanged
Summary
counted, not written
- Item 1A headings could not be compared: only 0 carried over between the two years, which usually means one filing was read wrongly, so none is reported as new or removed.
- Sentence by sentence, 494 added, 479 removed, 1,137 rewritten and 2,440 unchanged across 18 items that differ.
Sentences by item
21 items, with every count and a link to each item that changed
Underlined words on a shaded ground are new in FY2015; struck-through words were in FY2014. Sentences that are wholly new or wholly gone are labelled rather than marked.
Item 1A. RISK FACTORS
21 rewritten, 8 added, 1 removed, 293 unchanged
Read the full itemFY2015 item · filed November 23, 2015FY2014 item · filed November 17, 2014
We continue to evaluate our estimates of synergies to be realized from the Hillshire Brands acquisition and refine [removed: them, so that our actual cost-savings could differ materially from our current estimates.][added: them.]
Corn, soybean meal and other feed ingredients, for instance, represented roughly [removed: 68%] [added: 64%] of our cost of growing a live chicken in fiscal [removed: 2014.][added: 2015.]
In fiscal [removed: 2014,] [added: 2015,] we sold products to approximately 130 countries.
Major sales markets include Brazil, Canada, Central America, China, the European Union, Japan, Mexico, the Middle East, South Korea, [removed: Taiwan,] and [removed: Vietnam.][added: Taiwan.]
Our sales to customers in foreign countries for fiscal [removed: 2014] [added: 2015] totaled [removed: $6.3] [added: $5.2] billion, of which [removed: $4.7] [added: $4.1] billion related to export sales from the United States.
In addition, we had approximately [removed: $324] [added: $191] million of long-lived assets located in foreign countries, primarily Brazil, China, and India, at the end of fiscal [removed: 2014.][added: 2015.]
| • | impact of currency exchange rate fluctuations between the [removed: U.S.] [added: United States] dollar and foreign currencies, particularly the Brazilian real, the British pound sterling, the Canadian dollar, the Chinese renminbi, the European euro, the [removed: Indian rupee] [added: Japanese yen] and the Mexican peso; |
We have approximately [removed: 124,000] [added: 113,000] employees, approximately [removed: 42,000] [added: 36,000] of whom are covered by collective bargaining agreements or are members of labor unions.
These organisms and pathogens are found generally in the [removed: environment; therefore,] [added: environment and] there is a risk that one or more, as a result of food processing, could be present in our products.
These organisms and pathogens also can be introduced to our products as a result of improper handling at the [removed: further processing,] [added: further-processing,] foodservice or consumer level.
Our revolving credit [removed: facility contains] [added: and term loan facilities contain] affirmative and negative covenants that, among other things, may limit or restrict our ability to: create liens and encumbrances; incur debt; merge, dissolve, liquidate or consolidate; make acquisitions and investments; dispose of or transfer assets; change the nature of our business; engage in certain transactions with affiliates; and enter into hedging transactions, in each case, subject to certain qualifications and exceptions.
Our senior notes [removed: and term loans] also contain affirmative and negative covenants that, among other things, may limit or restrict our ability to: create liens; engage in certain sale/leaseback transactions; and engage in certain consolidations, mergers and sales of assets.
As of [removed: September 27, 2014,] [added: October 3, 2015,] we had [removed: $10.8] [added: $10.7] billion of goodwill and indefinite life intangible assets, which represented approximately [removed: 45%] [added: 47%] of total assets.
| • | the [removed: need to obtain] [added: availability and terms of] additional debt or equity financing for any transaction. |
Our business could suffer significant setbacks in sales and operating income if our customers’ plans and/or markets change significantly or if we lost one or more of our largest customers, including, for example, Wal-Mart Stores, Inc., which accounted for [removed: 14.6%] [added: 16.8%] of our sales in fiscal [removed: 2014.][added: 2015.]
As of [removed: September 27, 2014,] [added: October 3, 2015,] Tyson Limited Partnership (the TLP) owns 99.985% of the outstanding shares of the Company's Class B Common Stock, $0.10 par value (Class B stock) and the TLP and members of the Tyson family own, in the aggregate, [removed: 1.78%] [added: 1.79%] of the outstanding shares of the Company's Class A Common Stock, $0.10 par value (Class A stock), giving them, collectively, control of approximately [removed: 70.14%] [added: 70.64%] of the total voting power of the Company's outstanding voting stock.
As of [removed: September 27, 2014,] [added: October 3, 2015,] Mr. John Tyson, Chairman of the Board of Directors, has 33.33% of the general partner percentage interests, and Ms. Barbara Tyson, a director of the Company, has 11.115% general partner percentage interests (the remaining general partnership interests are held by the Tyson Partnership Interest Trust (44.44%) and Harry C.
Hillshire Brands intended for the Spin-Off and certain related transactions to qualify as tax-free under Sections 355, 368(a)(1)(D), and 361 and related provisions of the [removed: U.S.] [added: United States] Internal Revenue Code, which we refer to as the Code, and Hillshire Brands received a private letter ruling from the IRS substantially to the effect that the Spin-Off and certain related transactions, including [removed: the] [added: a] debt exchange, will qualify as tax-free to Hillshire Brands and its stockholders for [removed: U.S.] [added: United States] federal income tax purposes.
Accordingly, even though Hillshire Brands obtained a ruling and a “should” opinion of counsel, the IRS could assert that Hillshire Brands has not satisfied the requirements for tax-free treatment and such assertion, if successful, could result in significant [removed: U.S.] [added: United States] federal income tax liabilities for us.
[added: Participation in a] Multiemployer Pension Plan could adversely affect our business.
As of [removed: September 27, 2014,] [added: October 3, 2015,] the funded status of our defined benefit pension plans was an underfunded position of [removed: $381] [added: $410] million, as compared to an underfunded position of [removed: $86] [added: $381] million at the end of fiscal [removed: 2013.][added: 2014.]
Our actual cost-savings could differ materially from our current estimates.
We may incur additional tax expense or become subject to additional tax liabilities.
We are subject to taxes in the United States and numerous foreign jurisdictions.
Significant judgment is required in determining our provision for income taxes.
Our total income tax expense could be affected by changes in tax rates in various jurisdictions, changes in the valuation of deferred tax assets and liabilities or changes in tax laws or their interpretation.
We are also subject to the examination of our tax returns and other tax matters by the Internal Revenue Service and other tax authorities.
There can be no assurance as to the outcome of these examinations.
If a taxing authority disagrees with the positions we have taken, we could face additional tax liability, including interest and penalties, which could adversely affect our financial results.
The increase in the underfunded position is due to the acquisition of Hillshire Brands.
Item 7. MANAGEMENT’S DISCUSSION AND ANALYSIS OF FINANCIAL CONDITION AND RESULTS OF OPERATIONS
172 rewritten, 156 added, 83 removed, 501 unchanged
Read the full itemFY2015 item · filed November 23, 2015FY2014 item · filed November 17, 2014
We are one of the world's largest [removed: producers of chicken, beef, pork and prepared foods that include] [added: food companies with] leading brands such as Tyson®, Jimmy Dean®, Hillshire Farm®, Sara [removed: Lee® frozen bakery,] [added: Lee®,] Ball Park®, Wright®, Aidells® and State Fair®.
[added: Chicken,] Beef, [removed: Pork,] [added: Pork and] Prepared Foods [removed: and Other] results were not impacted by this change.
Hillshire [removed: Brands' one month] [added: Brands] results from operations [removed: for fiscal 2014] [added: subsequent to the acquisition closing] are included in the Prepared Foods segment.
| • | General – Operating income grew [removed: 4%] [added: 52%] in fiscal [removed: 2014] [added: 2015] over fiscal [removed: 2013,] [added: 2014,] which was led by record earnings in our Chicken [removed: segment] and [removed: strong performance in our Beef and Pork] [added: Prepared Foods] segments. [removed: Revenues] [added: Sales] increased [removed: 9%] [added: 10%] to a record [removed: $37.6] [added: $41.4] billion, driven by price and mix [removed: improvements. We were able to overcome a $2.3 billion increase in input costs through strong operational execution] [added: improvements, the incremental impact of Hillshire Brands] and [removed: margin management.] [added: the positive impact of 53 weeks in fiscal 2015.] We continued to execute our strategy of accelerating growth in domestic value-added chicken sales, prepared food sales, innovating products, services and customer insights and cultivating our talent development to support Tyson's growth for the future. |
[added: | • |] Margins – Our total operating margin was [removed: 3.8%] [added: 5.2%] in fiscal [removed: 2014.][added: 2015. Operating margins by segment were as follows: |]
| • | Liquidity – During fiscal [removed: 2014,] [added: 2015,] we generated [removed: $1.2] [added: $2.6] billion of operating cash flows. We repurchased [removed: 7.1] [added: 11.0] million shares of our Class A common stock for [removed: $250] [added: $455] million under our share repurchase program in fiscal [removed: 2014.] [added: 2015.] At [removed: September 27, 2014,] [added: October 3, 2015,] we had [removed: $1.6] [added: $1.9] billion of liquidity, which [removed: includes] [added: included] the availability under our [added: revolving] credit facility and [removed: $438] [added: $688] million of cash and cash equivalents. |
| • | [added: Fiscal year –] Our accounting cycle resulted in a [removed: 52-week] [added: 53-week] year for fiscal [removed: 2014, 2013] [added: 2015] and [removed: 2012.] [added: a 52-week year for 2014 and 2013.] |
| | [removed: 2014] [added: 2015] | | | | [removed: 2013] [added: 2014] | | | | [removed: 2012] [added: 2013] | | |
| Net income from continuing operations attributable to Tyson | $ | [removed: 864] [added: 1,220] | | | $ | [removed: 848] [added: 864] | | | $ | [removed: 621] [added: 848] | |
| Net income from continuing operations attributable to Tyson – per diluted share | [removed: 2.37] [added: 2.95] | | | | [removed: 2.31] [added: 2.37] | | | | [removed: 1.68] [added: 2.31] | | |
| Net loss from discontinued operation attributable to Tyson | — | | | | [removed: (70] [added: —] | | [removed: )] | | [removed: (38] [added: (70] | | ) |
| Net loss from discontinued operation attributable to Tyson – per diluted share | — | | | | [removed: (0.19] [added: —] | | [removed: )] | | [removed: (0.10] [added: (0.19] | | ) |
| Net income attributable to Tyson | [removed: 864] [added: 1,220] | | | | [removed: 778] [added: 864] | | | | [removed: 583] [added: 778] | | |
| Net income attributable to Tyson - per diluted share | [removed: 2.37] [added: 2.95] | | | | [removed: 2.12] [added: 2.37] | | | | [removed: 1.58] [added: 2.12] | | |
2014 – [removed: Net income included] [added: Included] the following items (fiscal 2014 per diluted share adjustments utilized a weighted average shares outstanding amount of 356 million):
| • | $197 million, or [removed: $0.37] [added: ($0.37)] per diluted share, related to the Hillshire Brands acquisition, integration and costs associated with our Prepared Foods improvement plan. |
| • | $42 million, or [removed: $0.16] [added: ($0.16)] per diluted share, related to an impairment in our Brazil operation and Mexico undistributed earnings tax. |
| • | $40 million, or [removed: $0.07] [added: ($0.07)] per diluted share, related to the Hillshire Brands post-closing results, purchase price accounting adjustments and [removed: ongoing] costs related to a legacy Hillshire Brands plant fire. |
| • | $27 million, or [removed: $0.12] [added: ($0.12)] per diluted share, related to the Hillshire Brands acquisition financing incremental interest costs and share dilution. |
2013 – [removed: Net income included] [added: Included] the following item:
| | [removed: 2014] [added: 2015] | | | | [removed: 2013] [added: 2014] | | | | [removed: 2012] [added: 2013] | | |
| Sales | $ | [removed: 37,580] [added: 41,373] | | | $ | [removed: 34,374] [added: 37,580] | | | $ | [removed: 33,055] [added: 34,374] | |
| Change in sales volume | [removed: 2.4] [added: 5.0] | | % | | [removed: (0.2] [added: 2.4] | | [removed: )%] [added: %] | | | | |
| Change in average sales price | [removed: 6.9] [added: 4.8] | | % | | [removed: 4.6] [added: 6.9] | | % | | | | |
| Sales growth | [removed: 9.3] [added: 10.1] | | % | | [removed: 4.0] [added: 9.3] | | % | | | | |
| • | Average Sales Price – Sales were positively impacted by higher average sales price, which accounted for an increase of approximately $2.5 billion. Beef, Pork and Prepared Foods experienced increased average sales price, partially offset by decreased pricing in [removed: Chicken and International.] [added: Chicken.] The increase in average sales price was largely due to continued tight domestic availability of protein, increased pricing associated with rising live and raw material costs, and improved mix. The majority of the increase was driven by the Beef and Pork segments. |
| | [removed: 2014] [added: 2015] | | | | [removed: 2013] [added: 2014] | | | | [removed: 2012] [added: 2013] | | |
| Cost of sales | $ | [removed: 34,895] [added: 37,456] | | | $ | [removed: 32,016] [added: 34,895] | | | $ | [removed: 30,865] [added: 32,016] | |
| Gross profit | [removed: 2,685] [added: 3,917] | | | | [removed: 2,358] [added: 2,685] | | | | [removed: 2,190] [added: 2,358] | | |
| Cost of sales as a percentage of sales | [removed: 92.9] [added: 90.5] | | % | | [removed: 93.1] [added: 92.9] | | % | | [removed: 93.4] [added: 93.1] | | % |
| • | Decrease in feed costs of $600 million in our Chicken [removed: segment and $42 million in our International] segment. |
| • | The [removed: $1.2 billion] [added: approximate $330 million] impact of higher input costs was primarily driven by: |
| • | [removed: Increase] [added: Decreases] in feed costs of [removed: $406] [added: approximately $450] million in our Chicken [removed: segment and $64 million in our International] segment. |
| • | [removed: Increase] [added: Decrease] in raw material and other input costs [added: of approximately $290 million] in our Prepared Foods [removed: segment of approximately $110 million.] [added: segment.] |
| | [removed: 2014] [added: 2015] | | | | [removed: 2013] [added: 2014] | | | | [removed: 2012] [added: 2013] | | |
| Selling, general and administrative | $ | [removed: 1,255] [added: 1,748] | | | $ | [removed: 983] [added: 1,255] | | | $ | [removed: 904] [added: 983] | |
| As a percentage of sales | [removed: 3.3] [added: 4.2] | | % | | [removed: 2.9] [added: 3.3] | | % | | [removed: 2.7] [added: 2.9] | | % |
| • | Increase of [removed: $79] [added: $493] million in selling, general and administrative was primarily driven by: |
| • | Increase of [removed: $44] [added: $27] million related to employee costs including payroll and stock-based [removed: and incentive-based] compensation. |
| | [removed: 2014] [added: 2015] | | | | [removed: 2013] [added: 2014] | | | | [removed: 2012] [added: 2013] | | |
We are a recognized market leader in chicken, beef and pork as well as prepared foods, including bacon, breakfast sausage, turkey, lunchmeat, hot dogs, pizza crusts and toppings, tortillas and desserts.
Following the sale of our Mexico and Brazil operations in fiscal 2015, we began reporting our international operation, which was previously reported as the International segment, in Other.
Other now includes our foreign chicken production operations in China and India and third-party merger and integration costs.
| • | Hillshire Integration – We continue to maintain focus on the integration of Hillshire Brands and synergy capture. As we execute our Prepared Foods strategy, we estimate the impact of the Hillshire Brands synergies, along with the profit improvement plan related to our legacy Prepared Foods business, will have a positive impact of more than $500 million in fiscal 2016 and more than $700 million by fiscal 2017. The majority of these benefits are expected to be realized in the Prepared Foods segment. We will invest a portion of the synergies in innovation, new product launches and strengthening our brands. In fiscal 2015, we captured $322 million of synergies and profit improvement initiatives, of which $285 million impacted the Prepared Foods segment. |
| • | Market environment – Our Chicken segment delivered record results in fiscal 2015 driven by strong demand and favorable domestic market conditions, partially offset by disruptions caused by export bans. The Pork segment results remained in its normalized operating margin range, but were down from last year due to unfavorable market conditions from a decline in exports and periods of increased domestic availability of pork products. Our Prepared Foods segment delivered record operating income and operating margins as we continued to execute our profit improvement plan and integrate Hillshire Brands. The Beef segment experienced a loss driven by lower availability of fed cattle supplies, higher fed cattle costs, export market disruptions, and reduced demand for premium beef products due to the relative value of competing proteins. |
| • | Mexico – We recorded a $161 million pre-tax gain as a result of the sale of our Mexico operation in the fourth quarter of fiscal 2015. The gain is reflected in Other for segment reporting and included in Cost of Sales in the Consolidated Statements of Income. |
| • | China impairment – Following the sale of our Mexico and Brazil chicken production operations, we have continued to review our strategies and outlook for the remaining international businesses, which operations include our chicken production operations in China. Despite our belief in the potential for this business, our Chinese operations have not achieved profitability. Given the ongoing losses being generated in this business, recent changes in the strategy and management of the business, and the depressed economic outlook for China, we assessed our Chinese operations for potential impairment in the fourth quarter of fiscal 2015. As a result of this evaluation, during the fourth quarter of fiscal 2015, we recorded a $169 million impairment charge. The impairment was comprised of $126 million of property, plant and equipment, $23 million of goodwill and $20 million of other assets. The China operation is included in Other for segment reporting and the impairment is included in Cost of Sales in the Consolidated Statements of Income. |
| • | Chicken – 12.0% |
| • | Beef – (0.4)% (included $12 million closure and impairment charges related to the ceasing of beef operations at our Denison facility) |
| • | Prepared Foods – 7.5% (included $8 million in net insurance proceeds related to a legacy Hillshire Brands plant fire, $10 million in merger and integration costs and $59 million in Prepared Foods network optimization impairment charges) |
2015 – Included the following items:
| • | $169 million, or ($0.41) per diluted share, related to an impairment charge in China. |
| • | $59 million, or ($0.09) per diluted share, related to Prepared Foods network optimization impairment charges. |
| • | $57 million, or ($0.09) per diluted share, related to merger and integration costs. |
| • | $12 million, or ($0.02) per diluted share, related to closure and impairment charges related to the ceasing of beef operations at our Denison facility. |
| • | $161 million, or $0.24 per diluted share, related to a gain on sale of the Mexico operation. |
| • | $39 million, or $0.06 per diluted share, related to the additional week in fiscal 2015. |
| • | $26 million, or $0.06 per diluted share, related to recognition of previously unrecognized tax benefits. |
| • | $21 million, or $0.03 per diluted share, related to a gain on sale of equity securities. |
| • | $8 million, or $0.02 per diluted share, of insurance proceeds (net of costs) related to a legacy Hillshire Brands plant fire. |
2015 vs. 2014 –
| • | Sales Volume – Sales were positively impacted by higher sales volume, which accounted for an increase of $2.4 billion. The Chicken segment had an increase in sales volume primarily due to an extra week in fiscal 2015, and the Prepared Foods segment had an increase in sales volume primarily due to the acquisition and consolidation of Hillshire Brands in our final month of fiscal 2014 in addition to an extra week in fiscal 2015. The increase in sales volume was partially offset by a decrease in the Beef and Pork segments along with the divestitures of the Mexico and Brazil chicken operations in fiscal 2015. |
| • | Average Sales Price – Sales were positively impacted by higher average sales prices, which accounted for an increase of $1.4 billion. The Beef and Prepared Foods segments each had an increase in average sales prices, partially offset by a decrease in average sales prices in the Chicken and Pork segments. The increase in average sales price was largely due to continued tight domestic availability of beef products along with the change in mix in the Prepared Foods segment as a result of the acquisition and consolidation of Hillshire Brands in our final month of fiscal 2014. |
2015 vs. 2014 –
| • | Cost of sales increased by approximately $2.6 billion. Higher input costs per pound increased cost of sales approximately $330 million and higher sales volume increased cost of sales approximately $2.3 billion. |
| • | Increase in live cattle cost of approximately $1.1 billion and operating costs of approximately $90 million in our Beef segment. |
| • | Increase in input cost per pound related to the acquisition of Hillshire Brands on August 28, 2014. |
| • | Increase of $49 million and $12 million related to Prepared Foods network optimization impairment charges and Denison plant impairment and closure costs, respectively. |
| • | Decrease in live hog costs of approximately $500 million in our Pork segment. |
| • | Decrease due to net unrealized gains of $55 million in fiscal 2015, compared to net unrealized losses of $39 million in fiscal 2014, from our Beef and Pork segment commodity risk management activities. |
| • | The $2.3 billion impact of higher sales volume was driven by an increase in sales volume in our Chicken and Prepared Foods segments, partially offset by decreases in sales volume in our Beef and Pork segments. Prepared Foods contributed a majority of the increase due to the acquisition of Hillshire Brands on August 28, 2014, in addition to the extra week in fiscal 2015. |
2015 vs. 2014 –
| • | Increase of $487 million related to the inclusion of Hillshire Brands in fiscal 2015 results with only one month in fiscal 2014 results. |
| • | Increase of $69 million related to incremental amortization associated with the acquired Hillshire Brands' intangibles. |
| • | Decrease of $59 million related to advertising and sales promotions in the legacy Tyson business primarily attributable to discontinuing certain programs that were present in fiscal 2014. |
| • | Decrease of $14 million related to merger and integration costs and employee severance and retention costs associated with the Hillshire Brands acquisition and implementation of our Prepared Foods strategy. |
| • | Decrease of $17 million in all other primarily related to professional fees. |
| | $ | (9 | ) | | $ | (7 | ) | | $ | (7 | ) |
| Cash interest expense | $ | 293 | | | $ | 132 | | | $ | 124 | |
| | $ | (36 | ) | | $ | 53 | | | $ | (20 | ) |
Our operations are conducted in five segments: Chicken, Beef, Pork, Prepared Foods and International.
Our International segment became a separate reportable segment in the second quarter of fiscal 2014 as a result of changes to our internal financial reporting to align with previously announced executive leadership changes.
The International segment includes our foreign operations primarily related to raising and processing live chickens into fresh, frozen and value-added chicken products in Brazil, China, India and Mexico.
| • | Market environment – Our Chicken segment delivered record results in fiscal 2014 driven by strong demand and favorable domestic market conditions. Our Beef segment experienced higher fed cattle costs and reduced availability of fed cattle supplies but delivered strong results by maximizing our revenues relative to the rising costs experienced in the live cattle markets. The Pork segment's operating margins remained within its normalized range due to favorable market conditions associated with lower pork supplies. Our Prepared Foods segment was challenged by rapidly increasing raw material prices in addition to costs incurred as we continue to execute our Prepared Foods strategy. Our International segment experienced higher volumes, offset with lower average sales prices due to weak demand of chicken in our foreign operations. |
Operating margins by segment were as follows:
| • | Chicken – 7.9% |
| • | Beef – 2.1% |
| • | Prepared Foods – (1.5)% |
| • | International - (8.8)% |
2012 – Net income included the following item:
| • | $167 million pretax charge, or $0.29 per diluted share, related to the early extinguishment of debt. |
2013 vs. 2012 –
| • | Sales Volume – Sales were negatively impacted by a slight decrease in sales volume, which accounted for a decrease of $255 million. This was primarily due to decreases in the Beef and Pork segments, partially offset by increases in the Chicken, Prepared Foods and International segments. |
| • | Average Sales Price – Sales were positively impacted by higher average sales price, which accounted for an increase of approximately $1.6 billion. All segments experienced increased average sales price, largely due to continued tight domestic availability of protein, increased pricing associated with rising live and raw material costs, and improved mix. The majority of the increase was driven by the Chicken and Beef segments. |
2013 vs. 2012 –
| • | Cost of sales increased by approximately $1.2 billion due to higher input cost per pound. |
| • | Increase in live cattle and hog costs of approximately $395 million. |
| • | Increase due to net losses of $15 million in fiscal 2013, compared to net gains of approximately $66 million in fiscal 2012, from our Pork segment commodity risk management activities. These amounts exclude the impact from related physical purchase transactions, which impact future period operating results. |
| • | Increase of $32 million related to advertising and sales promotions. |
2013 vs. 2012 –
| | $ | (7 | ) | | $ | (7 | ) | | $ | (12 | ) |
| Cash interest expense, net of amounts capitalized | $ | 124 | | | $ | 117 | | | $ | 151 | |
| Loss on early extinguishment of debt | — | | | | — | | | | 167 | | |
| • | Loss on early extinguishment of debt included the amount paid exceeding the par value of debt, unamortized discount and unamortized debt issuance costs related to the full extinguishment of the 2014 Notes. |
| | $ | 53 | | | $ | (20 | ) | | $ | (23 | ) |
2012 – Included $16 million of equity earnings in joint ventures and $4 million in net foreign currency exchange gains.
2012 –
| • | General business credits reduced the rate 0.7%. |
The results from Dynamic Fuels are included in Other.
We allocate expenses related to corporate activities to the segments, except for acquisition and integration related fees which are included in Other.
| International | 1,381 | | | | 1,324 | | | | 1,104 | | | | (121 | | ) | | (37 | | ) | | (70 | | ) |
| Other | — | | | | 46 | | | | 167 | | | | (74 | | ) | | — | | | | (14 | | ) |
2013 vs. 2012 –
| • | Sales Volume – Sales volume grew due to increased production driven by stronger demand for our chicken products. |
| • | Average Sales Price – The increase in average sales price was primarily due to mix changes and price increases associated with higher input costs. Since many of our sales contracts are formula based or shorter-term in nature, we were able to offset rising input costs through improved pricing and mix. |
| • | Operating Income – Operating income was positively impacted by increased average sales price, and improved live performance and operational execution. These increases were partially offset by increased feed costs of $406 million. |
2013 vs. 2012 –
| • | Sales Volume – Sales volume decreased due to less outside trim and tallow purchases, partially offset by increased production volumes. |
| • | Operating Income – Operating income increased due to improved operational execution, less volatile live cattle markets and improved export markets, partially offset by increased operating costs. |
2013 vs. 2012 –
An excerpt. Shown here: 40 of 172 rewritten, 40 of 156 added and 40 of 83 removed. The counts are complete. For every sentence, read Item 7. MANAGEMENT’S DISCUSSION AND ANALYSIS OF FINANCIAL CONDITION AND RESULTS OF OPERATIONS in the FY2015 filing and the FY2014 filing.
Item 7A. QUANTITATIVE AND QUALITATIVE DISCLOSURES ABOUT MARKET RISK
12 rewritten, 1 added, 1 removed, 35 unchanged
Read the full itemFY2015 item · filed November 23, 2015FY2014 item · filed November 17, 2014
The following table presents a sensitivity analysis resulting from a hypothetical change of 10% in market prices as of [added: October 3, 2015, and] September 27, 2014, [removed: and September 28, 2013,] on the fair value of open positions.
The market risk exposure analysis [removed: includes] [added: included] hedge and non-hedge derivative financial instruments.
| Cattle | $ | [removed: 42] [added: 13] | | | $ | [removed: 13] [added: 42] | |
| Hogs | [removed: 32] [added: 12] | | | | [removed: 35] [added: 32] | | |
| Grain | [removed: 10] [added: 3] | | | | [removed: 23] [added: 10] | | |
Interest Rate Risk: At [removed: September 27, 2014,] [added: October 3, 2015,] we had variable rate debt of [removed: $2.1 billion] [added: $1,057 million] with a weighted average interest rate of [removed: 1.6%.][added: 1.5%.]
A hypothetical 10% increase in interest rates effective at [added: October 3, 2015, and] September 27, 2014, [removed: and September 28, 2013,] would have a minimal effect on interest expense.
At [removed: September 27, 2014,] [added: October 3, 2015,] we had fixed-rate debt of [removed: $6.1 billion] [added: $5,668 million] with a weighted average interest rate of [removed: 4.3%.][added: 4.4%.]
A hypothetical 10% decrease in interest rates would have increased the fair value of our fixed-rate debt by approximately [removed: $109] [added: $87] million at [removed: September 27, 2014,] [added: October 3, 2015,] and [removed: $22] [added: $109] million at September [removed: 28, 2013.][added: 27, 2014.]
The primary currencies we have exposure to are the Brazilian real, the British pound sterling, the Canadian dollar, the Chinese renminbi, the European euro, the [removed: Indian rupee] [added: Japanese yen] and the Mexican peso.
A hypothetical 10% change in foreign exchange rates effective at [added: October 3, 2015, and] September 27, 2014, [removed: and September 28, 2013,] related to the foreign exchange forward and option contracts would have a [removed: $9] [added: $3] million and [removed: $11] [added: $9] million impact, respectively, on pretax income.
At [added: October 3, 2015, and] September 27, 2014, [removed: and September 28, 2013, 18.6%] [added: 20.0%] and [removed: 17.5%,] [added: 18.6%,] respectively, of our net accounts receivable balance was due from Wal-Mart Stores, Inc. No other single customer or customer group represented greater than 10% of net accounts receivable.
| | 2015 | | | | 2014 | | |
| | 2014 | | | | 2013 | | |
Item 1. BUSINESS
38 rewritten, 5 added, 26 removed, 128 unchanged
Read the full itemFY2015 item · filed November 23, 2015FY2014 item · filed November 17, 2014
Founded in 1935, Tyson Foods, Inc. and its subsidiaries (collectively, “Company,” “we,” “us” or “our”) [removed: are] [added: is] one of the world's largest [removed: producers of chicken, beef, pork and prepared foods that include] [added: food companies with] leading brands such as Tyson®, Jimmy Dean®, Hillshire Farm®, Sara [removed: Lee® frozen bakery,] [added: Lee®,] Ball Park®, Wright®, Aidells® and State Fair®.
Our operations are conducted in [removed: five] [added: four reportable] segments: Chicken, Beef, [removed: Pork, Prepared Foods] [added: Pork] and [removed: International.][added: Prepared Foods.]
[removed: The fiscal 2014 one month] [added: Hillshire Brands'] results from operations [removed: for Hillshire Brands] are [removed: included] [added: reported] in the Prepared Foods segment [removed: and in this 2014 Annual Report on Form 10-K.][added: from the date of acquisition.]
For further description of [removed: this transaction,] [added: the sale of the Mexico and Brazil operations,] refer to Part II, Item 8, Notes to Consolidated Financial Statements, Note 3: Acquisitions and Dispositions.
We operate in [removed: five] [added: four reportable] segments: Chicken, Beef, [removed: Pork, Prepared Foods] [added: Pork] and [removed: International.][added: Prepared Foods.]
[added: Chicken, Beef, Pork and] Prepared Foods [removed: and Other] results were not impacted by this change.
The contribution of each segment to net sales and operating income (loss), and the identifiable assets attributable to each segment, are set forth in [removed: Note 17: Segment Reporting of the] [added: Part II, Item 8,] Notes to Consolidated Financial [removed: Statements.][added: Statements, Note 17: Segment Reporting.]
Products primarily include pepperoni, bacon, [added: breakfast] sausage, [removed: beef and pork] [added: turkey, lunchmeat, hot dogs,] pizza [added: crusts and] toppings, [removed: pizza crusts,] flour and corn tortilla products, [added: desserts,] appetizers, prepared meals, ethnic foods, soups, sauces, side dishes, meat dishes, breadsticks and processed meats.
[removed: As previously discussed, on] [added: On] August 28, 2014, we completed the acquisition of Hillshire Brands, a manufacturer and marketer of branded, convenient foods which includes brands such as Jimmy Dean®, Ball Park®, Hillshire Farm®, State Fair®, Van's®, Sara Lee® [removed: frozen bakery] and Chef Pierre® pies as well as artisanal brands Aidells®, Gallo Salame®, and Golden Island® premium jerky.
Hillshire [removed: Brands' one month] [added: Brands] results [removed: from] [added: of] operations [removed: for fiscal 2014] are included in the Prepared Foods segment.
In fiscal [removed: 2014,] [added: 2015,] corn, soybean meal and other feed ingredients were major production costs, representing roughly [removed: 68%] [added: 64%] of our cost of growing a live chicken domestically.
Pork and certain other prepared foods products, such as prepared meals, meat dishes, appetizers, frozen pies and breakfast [removed: sausage] [added: sausage,] generally experience increased demand during the winter months, primarily due to the holiday season, while demand generally decreases during the spring and summer months.
Wal-Mart Stores, Inc. accounted for [removed: 14.6%] [added: 16.8%] of our fiscal [removed: 2014] [added: 2015] consolidated sales.
No other single customer or customer group represented more than 10% of fiscal [removed: 2014] [added: 2015] consolidated sales.
We sold products in approximately 130 countries in fiscal [removed: 2014.][added: 2015.]
Major sales markets include Brazil, Canada, Central America, China, the European Union, Japan, Mexico, the Middle East, South Korea, [removed: Taiwan,] and [removed: Vietnam.][added: Taiwan.]
| • | Cobb-Vantress, a chicken breeding stock subsidiary, has business interests in Argentina, Brazil, China, the Dominican Republic, India, Japan, the Netherlands, [removed: Peru,] the Philippines, Russia, Spain, [removed: Sri Lanka, Thailand,] Turkey, the United Kingdom and Venezuela. |
| • | Tyson Rizhao, located in Rizhao, China, is a vertically-integrated [removed: poultry] [added: chicken] production operation. |
| • | Tyson Dalong, a joint venture in China in which we have a majority interest, is a chicken [removed: further processing] [added: further-processing] facility. |
| • | Tyson Nantong, located in Nantong, China, is a vertically-integrated [removed: poultry] [added: chicken] production operation. |
| • | Godrej Tyson Foods, a joint venture in India in which we have a majority interest, is a [removed: poultry] [added: chicken] processing business. |
Additional information regarding export [removed: sales,] [added: sales and] long-lived assets located in foreign countries [removed: and income (loss) from foreign operations] is set forth in Part II, Item 8, Notes to Consolidated Financial Statements, Note 17: Segment [removed: Reporting and Note 9: Income Taxes.][added: Reporting.]
Our Discovery [removed: Center includes] [added: Centers include a 100,000 square foot research and development facility in Springdale, Arkansas with] 19 research kitchens and a USDA-inspected pilot plant.
The Discovery [removed: Center enables] [added: Centers enable] us to bring new market-leading retail and foodservice products to the customer quickly and efficiently.
We also lease an approximately [removed: 73,000] [added: 78,000] square foot research and development facility outside Chicago, Illinois assumed in our Hillshire Brands [removed: acquisition.][added: acquisition, which includes five test kitchens and a USDA-inspected pilot plant.]
Research and development costs totaled [removed: $52] [added: $75] million, [removed: $50] [added: $52] million, and [removed: $43] [added: $50] million in fiscal [removed: 2014, 2013] [added: 2015, 2014] and [removed: 2012,] [added: 2013,] respectively.
[removed: Congress and] [added: Congress,] the United States Environmental Protection Agency [removed: are considering] [added: and some states continue to consider] various options to control greenhouse gas emissions.
It is unclear at this time [removed: when or] [added: what options,] if [removed: such options] [added: any,] will be finalized, [removed: or what] [added: and whether such options would have a direct impact on] the [removed: final form may be.][added: Company.]
Due to [removed: the] [added: continuing] uncertainty surrounding this issue, it is premature to speculate on the specific nature of impacts that imposition of greenhouse gas emission controls would have on [removed: us,] [added: us] and whether such impacts would have a material adverse effect.
Additionally, our [removed: International operation is] [added: foreign operations are] subject to various other food safety and quality assurance oversight and review.
As of [removed: September 27, 2014,] [added: October 3, 2015,] we employed approximately [removed: 124,000] [added: 113,000] employees.
Approximately [removed: 108,000] [added: 107,000] employees were employed in the United States and [removed: 16,000] [added: 6,000] employees were [added: employed] in foreign countries, primarily [removed: Brazil, China and Mexico.][added: in China.]
Approximately [removed: 32,000] [added: 31,000] employees in the United States were subject to collective bargaining agreements with various labor unions, with approximately [removed: 18%] [added: 12%] of those employees included under agreements expiring in fiscal [removed: 2015.][added: 2016.]
Approximately [removed: 10,000] [added: 5,000] employees in foreign countries were subject to collective bargaining agreements.
Our principal marketing objective is to be the [removed: primary] [added: leading branded] provider of [added: protein-based solutions for our consumers and customers across] chicken, [added: turkey,] beef, pork and prepared [removed: foods products for our customers and consumers.][added: foods.]
We [removed: build the Tyson®,] [added: grow our leading brands (Tyson®,] Jimmy Dean®, Hillshire Farm®, Sara [removed: Lee® frozen bakery,] [added: Lee®,] Ball Park®, Wright®, Aidells® and State [removed: Fair® brands] [added: Fair®)] while supporting strong regional and emerging brands primarily through [removed: well-defined product-specific advertising, marketing, and public relations efforts] [added: consumer engagement marketing plans] focused [removed: toward key] [added: on core] consumer targets [removed: with specific needs.][added: leveraging proprietary research and insights.]
Such forward-looking statements include, but are not limited to, current views and estimates of our outlook for fiscal [removed: 2015,] [added: 2016,] other future economic circumstances, industry conditions in domestic and international markets, our performance and financial results (e.g., debt levels, return on invested capital, value-added product growth, capital expenditures, tax rates, access to foreign markets and dividend policy).
Among the factors that may cause actual results and experiences to differ from anticipated results and expectations expressed in such forward-looking statements are the following: (i) the effect of, or changes in, general economic conditions; (ii) fluctuations in the cost and availability of inputs and raw materials, such as live cattle, live swine, feed grains (including corn and soybean meal) and energy; (iii) market conditions for finished products, including competition from other global and domestic food processors, supply and pricing of competing products and alternative proteins and demand for alternative proteins; (iv) successful rationalization of existing facilities and operating efficiencies of the facilities; (v) risks associated with our commodity purchasing activities; (vi) access to foreign markets together with foreign economic conditions, including currency fluctuations, import/export restrictions and foreign politics; (vii) outbreak of a livestock disease (such as avian influenza (AI) or bovine spongiform encephalopathy (BSE)), which could have an adverse effect on livestock we own, the availability of livestock we purchase, consumer perception of certain protein products or our ability to access certain domestic and foreign markets; (viii) changes in availability and relative costs of labor and contract growers and our ability to maintain good relationships with employees, labor unions, contract growers and independent producers providing us livestock; (ix) issues related to food safety, including costs resulting from product recalls, regulatory compliance and any related claims or litigation; (x) changes in consumer preference and diets and our ability to identify and react to consumer trends; (xi) significant marketing plan changes by large customers or loss of one or more large customers; (xii) adverse results from litigation; (xiii) impacts on our operations caused by factors and forces beyond our control, such as natural disasters, fire, bioterrorism, [removed: pandemic] [added: pandemics] or extreme weather; (xiv) risks associated with leverage, including cost increases due to rising interest rates or changes in debt ratings or outlook; (xv) compliance with and changes to regulations and laws (both domestic and foreign), including changes in accounting standards, tax laws, environmental laws, agricultural laws and occupational, health and safety laws; (xvi) our ability to make effective acquisitions or joint ventures and successfully integrate newly acquired businesses into existing operations; (xvii) failures or security breaches of our information technology systems; (xviii) effectiveness of advertising and marketing programs; and (xix) those factors listed under Item 1A.
We are a recognized market leader in chicken, beef and pork as well as prepared foods, including bacon, breakfast sausage, turkey, lunchmeat, hot dogs, pizza crusts and toppings, tortillas and desserts.
Following the sale of the Mexico and Brazil operations in fiscal 2015, we began reporting our international operation, which was previously reported as the International segment, in Other.
Other now includes our foreign chicken production operations in China and India and third-party merger and integration costs.
| • | Tyson Mexico Trading Company, a Mexican subsidiary, sells chicken products primarily though co-packer arrangements. |
Our insights ensure we maintain relevancy and are consistently meeting the needs of our consumer and customer partners.
During the second quarter of fiscal 2014, we
began reporting our International operation as a separate segment, which was previously included in our Chicken segment.
Our International segment became a separate reportable segment as a result of changes to our internal financial reporting to align with previously announced executive leadership changes.
Beef, Pork,
International: International includes our foreign operations primarily related to raising and processing live chickens into fresh, frozen and value-added chicken products in Brazil, China, India and Mexico.
Products are marketed in each respective country to food retailers, foodservice distributors, restaurant operators, hotel chains, noncommercial foodservice establishments and live markets, as well as to other international export markets.
On July 28, 2014, we announced our plan to sell our Brazil and Mexico operations, part of our International segment, to JBS SA ("JBS") for $575 million in cash.
We expect to complete the sale of our Brazil operation in the first quarter of fiscal 2015.
The sale of our Mexico operation is pending the necessary government approvals and is expected to close in the first half of fiscal 2015.
As a result, we have reclassified the assets and liabilities related to Mexico and Brazil to assets and liabilities held for sale.
Once chicks have hatched, they are sent to broiler farms.
Adult chickens are transported to processing plants where they are slaughtered and converted into finished products, which are then sent to distribution centers and delivered to customers.
In addition to feed ingredients to grow the chickens, we use cooking ingredients, packaging materials and cryogenic agents.
We believe our sources of supply for these materials are adequate for our present needs, and we do not anticipate any difficulty in acquiring these materials in the future.
International: The primary raw materials used in our international chicken operations are corn and soybean meal used as feed and live chickens raised primarily by independent contract growers and company-owned farms.
Pullets are sent to breeder houses, and the resulting eggs are sent to independent and company-owned hatcheries.
There, contract growers or employees care for and raise the chicks according to our standards, with advice from our technical service personnel, until the broilers reach the desired processing weight.
We operate our own feed mills to produce scientifically-formulated feeds and procure outside feed at times to meet our production needs.
In fiscal 2014, corn, soybean meal and other feed ingredients were major production costs, representing approximately two-thirds of our cost of growing a live chicken.
We also purchase live, ice-packed or fresh chicken to meet production and sales requirements.
| | |
| --- | --- |
| • | Tyson de Mexico, a Mexican subsidiary, is a vertically-integrated poultry production company. The sale of this subsidiary to JBS is pending necessary government approvals in Mexico and is expected to close in the first half of fiscal 2015. |
| • | Tyson do Brazil, a Brazilian subsidiary, is a vertically-integrated poultry production operation. We expect to complete the sale of this subsidiary to JBS in the first quarter of fiscal 2015. |
We identify distinct markets and business opportunities through continuous consumer and market research.
These efforts are designed to present key products as everyday solutions to relevant consumer problems; thereby becoming part of regular eating routines.
Item 3. LEGAL PROCEEDINGS
5 rewritten, 2 added, 2 removed, 14 unchanged
Read the full itemFY2015 item · filed November 23, 2015FY2014 item · filed November 17, 2014
The [removed: U.S.] [added: United States] Environmental Protection Agency has also indicated to us that it has begun a criminal investigation into the incident.
On June 19, 2005, the Attorney General and the Secretary of the Environment of the State of Oklahoma filed a complaint in the [removed: U.S.] [added: United States] District Court for the Northern District of Oklahoma against Tyson Foods, Inc., three subsidiaries and six other poultry integrators.
The complaint, which was subsequently amended, asserts a number of state and federal causes of action including, but not limited to, counts under [added: the] Comprehensive Environmental Response, Compensation, and Liability Act, Resource Conservation and Recovery Act, and state-law public nuisance theories.
Oklahoma’s claims were narrowed through various rulings issued before and during trial and its claims for natural resource damages were dismissed by the district court in a ruling issued on July 22, [removed: 2009] [added: 2009,] which was subsequently affirmed on appeal by the Tenth Circuit Court of Appeals.
Other Matters: We currently have approximately [removed: 124,000] [added: 113,000] employees and, at any time, have various employment practices matters outstanding.
In January 2015, a consent judgment was entered that resolved the lawsuit.
The judgment required payment of $540,000, which includes amounts for penalties, cost recovery and supplemental environmental projects.
Finally, we may be subject to claims from the City of Monett for causing it to violate various municipal regulations and for damages to the City’s treatment system.
We are currently in settlement discussions with the State of Missouri.
Cover and table of contents
27 rewritten, 5 added, 5 removed, 63 unchanged
Read the full itemFY2015 item · filed November 23, 2015FY2014 item · filed November 17, 2014
| | For the fiscal year ended | [removed: September 27, 2014] [added: October 3, 2015] |
[removed: ][added: ]
| 2200 [added: West] Don Tyson Parkway, Springdale, Arkansas | | 72762-6999 |
On March [removed: 29, 2014,] [added: 28, 2015,] the aggregate market value of the registrant’s Class A Common Stock, $0.10 par value (Class A stock), and Class B Common Stock, $0.10 par value (Class B stock), held by non-affiliates of the registrant was [removed: $11,778,761,908] [added: $11,395,283,906] and [removed: $466,236,] [added: $412,319,] respectively.
On October [removed: 25, 2014,] [added: 31, 2015,] there were [removed: 305,656,663] [added: 295,644,459] shares of Class A stock and 70,010,805 shares of Class B stock outstanding.
Portions of the registrant’s definitive Proxy Statement for the registrant’s Annual Meeting of Shareholders to be held [removed: January 30, 2015,] [added: February 5, 2016,] are incorporated by reference into Part III of this Annual Report on Form 10-K.
| Item 1. | [removed: [Business](#sFA500647C0568B9BDE9CC5C96FECEA9D)] [added: [Business](#sD5DDABF0512452848F3120EB1628B7AD)] | [removed: [2](#sFA500647C0568B9BDE9CC5C96FECEA9D)] [added: [2](#sD5DDABF0512452848F3120EB1628B7AD)] |
| Item 1A. | [Risk [removed: Factors](#s097015ACC3B483359AF7C5C9701470CA)] [added: Factors](#sF8FC8B1D08175B4AABCF81CCEFA056E7)] | [removed: [7](#s097015ACC3B483359AF7C5C9701470CA)] [added: [6](#sF8FC8B1D08175B4AABCF81CCEFA056E7)] |
| Item 1B. | [Unresolved Staff [removed: Comments](#sE708050069D7E7B2385FC5C970463D8C)] [added: Comments](#sB66E1A0996425227A0D212F7077771B1)] | [removed: [14](#sE708050069D7E7B2385FC5C970463D8C)] [added: [14](#sB66E1A0996425227A0D212F7077771B1)] |
| Item 2. | [removed: [Properties](#sDB3EF5AEC4B20681494FC5C90C68BAF4)] [added: [Properties](#sB20F4D6CD86953B89A738221267AAE8A)] | [removed: [15](#sDB3EF5AEC4B20681494FC5C90C68BAF4)] [added: [15](#sB20F4D6CD86953B89A738221267AAE8A)] |
| Item 3. | [Legal [removed: Proceedings](#sEA9D06F376AC7E74A970C5C97096062E)] [added: Proceedings](#sFDFC02B1508E54A7935CF40C45FAE798)] | [removed: [16](#sEA9D06F376AC7E74A970C5C97096062E)] [added: [16](#sFDFC02B1508E54A7935CF40C45FAE798)] |
| Item 4. | [Mine Safety [removed: Disclosures](#s025E7B96099420620B60C5C970B48702)] [added: Disclosures](#sEE875B89DC2056EBB920C21905156FA6)] | [removed: [17](#s025E7B96099420620B60C5C970B48702)] [added: [16](#sEE875B89DC2056EBB920C21905156FA6)] |
| Item 5. | [Market for Registrant’s Common Equity, Related Stockholder Matters and Issuer Purchases of Equity [removed: Securities](#s326A65F122EFA10C1065C5C90C7C5826)] [added: Securities](#s794D68127A7A5968B433EDC87E77422D)] | [removed: [19](#s326A65F122EFA10C1065C5C90C7C5826)] [added: [19](#s794D68127A7A5968B433EDC87E77422D)] |
| Item 6. | [Selected Financial [removed: Data](#s5DD2794EFA9D8964FD88C5C971A4B2CC)] [added: Data](#s0E4CE21DC15650E2B868533E2D846854)] | [removed: [21](#s5DD2794EFA9D8964FD88C5C971A4B2CC)] [added: [21](#s0E4CE21DC15650E2B868533E2D846854)] |
| Item 7. | [Management’s Discussion and Analysis of Financial Condition and Results of [removed: Operations](#s18AB854DDEE0EB1CBC97C5C971CD288F)] [added: Operations](#sEF11C6F13B39560C94FEE2BF733AC7EF)] | [removed: [23](#s18AB854DDEE0EB1CBC97C5C971CD288F)] [added: [23](#sEF11C6F13B39560C94FEE2BF733AC7EF)] |
| Item 7A. | [Quantitative and Qualitative Disclosures About Market [removed: Risk](#s92011AC147F0D423B7C9C5C973539FEA)] [added: Risk](#sD033FC43819255BEB980A3C3DFC30380)] | [removed: [42](#s92011AC147F0D423B7C9C5C973539FEA)] [added: [43](#sD033FC43819255BEB980A3C3DFC30380)] |
| Item 8. | [Financial Statements and Supplementary [removed: Data](#s269F2FA3D0A40CB7D4D4C5C97385A896)] [added: Data](#sE9A9699FBF85503CA9D638AD2C44E789)] | [removed: [44](#s269F2FA3D0A40CB7D4D4C5C97385A896)] [added: [45](#sE9A9699FBF85503CA9D638AD2C44E789)] |
| Item 9. | [Changes in and Disagreements With Accountants on Accounting and Financial [removed: Disclosure](#s2AF357CFE849F5F903E2C5C97A844E30)] [added: Disclosure](#s29C896E1A1A952BB8CC7DAEFDB588392)] | [removed: [95](#s2AF357CFE849F5F903E2C5C97A844E30)] [added: [93](#s29C896E1A1A952BB8CC7DAEFDB588392)] |
| Item 9A. | [Controls and [removed: Procedures](#s5787C60C60C9FE82A89DC5C97A847999)] [added: Procedures](#s27C9498F28C5556D90997A6C74DC7585)] | [removed: [95](#s5787C60C60C9FE82A89DC5C97A847999)] [added: [93](#s27C9498F28C5556D90997A6C74DC7585)] |
| Item 9B. | [Other [removed: Information](#sE717C30EF5507265E413C5C97A8E4A75)] [added: Information](#s0DBBA8CAEB4456EC81F6F2102E3E15BF)] | [removed: [95](#sE717C30EF5507265E413C5C97A8E4A75)] [added: [93](#s0DBBA8CAEB4456EC81F6F2102E3E15BF)] |
| [PART [removed: III](#s41CD1186ECB621C68B6EC5C97AACE1D9)] [added: III](#s9386BC7FD7395E1C80CC70659876AEC9)] | | |
| Item 10. | [Directors, Executive Officers and Corporate [removed: Governance](#s8EB178CFCF4B3308846DC5C97AD40EF3)] [added: Governance](#s1920F4F279785ABD8A23B2651A5FF547)] | [removed: [96](#s8EB178CFCF4B3308846DC5C97AD40EF3)] [added: [94](#s1920F4F279785ABD8A23B2651A5FF547)] |
| Item 11. | [Executive [removed: Compensation](#sC42D223C0D341C82A812C5C97B063B18)] [added: Compensation](#s87625E3B9FB4578E92862E73AFF6DC47)] | [removed: [96](#sC42D223C0D341C82A812C5C97B063B18)] [added: [94](#s87625E3B9FB4578E92862E73AFF6DC47)] |
| Item 12. | [Security Ownership of Certain Beneficial Owners and Management and Related Stockholder [removed: Matters](#sEB7F266521522C1440F0C5C97B24ED69)] [added: Matters](#s02E7C6775A77565781EB1E61E80B8719)] | [removed: [96](#sEB7F266521522C1440F0C5C97B24ED69)] [added: [94](#s02E7C6775A77565781EB1E61E80B8719)] |
| Item 13. | [Certain Relationships and Related Transactions, and Director [removed: Independence](#sD2D966F6FF1CE8A86D3DC5C97B56EC90)] [added: Independence](#s42C3AE7477955F18BE15E43DD32A7857)] | [removed: [96](#sD2D966F6FF1CE8A86D3DC5C97B56EC90)] [added: [94](#s42C3AE7477955F18BE15E43DD32A7857)] |
| Item 14. | [Principal Accounting Fees and [removed: Services](#sCF64FB010C31896870A0C5C97B74CF20)] [added: Services](#s52DA96159E80548D96362C5452A8FB87)] | [removed: [96](#sCF64FB010C31896870A0C5C97B74CF20)] [added: [94](#s52DA96159E80548D96362C5452A8FB87)] |
| Item 15. | [Exhibits, Financial Statement [removed: Schedules](#sC3F3105DBE52C7F951F2C5C97BCEC3A1)] [added: Schedules](#s145DD2806E9F538081816F2A19E3FB69)] | [removed: [97](#sC3F3105DBE52C7F951F2C5C97BCEC3A1)] [added: [95](#s145DD2806E9F538081816F2A19E3FB69)] |
10-K 1 tsn201510kq4.htm 10-K
\[X\]
| [PART I](#s102A56E65B7151FABDE59577F341878F) | | |
| [PART II](#sDBDE69BB7E295CFAB31086F16161CB98) | | |
| [PART IV](#s227BCF6DBA005A46AD8D9837B18625A2) | | |
10-K 1 tsn201410kq4.htm 10-K
\[ \]
| [PART I](#s7B444BBABB891CFFA727C5C96FBA3DA1) | | |
| [PART II](#sD9E38B6FACFFC1235C12C5C9710E7068) | | |
| [PART IV](#s904454810E082A45B460C5C97BA638E6) | | |
Item 2. PROPERTIES
19 rewritten, 2 added, 13 removed, 33 unchanged
Read the full itemFY2015 item · filed November 23, 2015FY2014 item · filed November 17, 2014
We have production and distribution operations in the following states: Alabama, Arizona, Arkansas, California, Delaware, Florida, Georgia, Illinois, Indiana, Iowa, Kansas, Kentucky, [removed: Mississippi,] Maryland, Michigan, [added: Mississippi,] Missouri, Nebraska, [removed: New Mexico, New York,] North Carolina, Oklahoma, Pennsylvania, South Carolina, Tennessee, Texas, Utah, Virginia, Washington and Wisconsin.
Additionally, we, either directly or through our subsidiaries, have sales offices, facilities or participate in joint venture operations in Argentina, Brazil, Canada, China, the Dominican Republic, Hong Kong, India, [removed: Ireland,] Japan, Mexico, the Netherlands, [removed: Peru,] the Philippines, [added: the Republic of Ireland,] Russia, South Korea, Spain, [removed: Sri Lanka,] Taiwan, [removed: Thailand,] Turkey, the United Arab Emirates, the United Kingdom and Venezuela.
| Processing plants | [removed: 45] [added: 44] | | | 1 | | | [removed: 46] [added: 45] | |
| Breeder houses | [removed: 368] [added: 383] | | | [removed: —] [added: 31] | | | [removed: 368] [added: 414] | |
| Beef Segment Production Facilities | [removed: 13] [added: 12] | | | — | | | [removed: 13] [added: 12] | |
| Processing [removed: plants(1)] [added: plants(2)] | [removed: 35] [added: 32] | | | 6 | | | [removed: 41] [added: 38] | |
| [removed: Hillshire Brands turkey] [added: Turkey] operation facilities | 6 | | | — | | | 6 | |
| [removed: Hillshire Brands distribution centers] [added: Distribution Centers] | [removed: 5] [added: 12] | | | [removed: —] [added: 1] | | | [removed: 5] [added: 13] | |
| [added: Chicken] Processing [removed: plants] [added: Plants] | [removed: 9] | | | [removed: 2] [added: 39 million head] | | | [removed: 11] [added: 89] | [added: %] |
| Cold Storage Facilities | [removed: 60] [added: 51] | | | [removed: 14] [added: —] | | | [removed: 74] [added: 51] | |
| Research and Development [removed: Facilities(2)] [added: Facilities] | 1 | | | 1 | | | 2 | |
| | | | | [removed: Capacity(3)] [added: Capacity(1)] per week at [removed: September 27, 2014] [added: October 3, 2015] | | | Fiscal [removed: 2014] [added: 2015] Average Capacity Utilization | |
| Beef Production Facilities | | | | [removed: 173,000] [added: 176,000] head | | | [removed: 77] [added: 73] | % |
| Pork Production Facilities | | | | [removed: 445,000] [added: 456,000] head | | | [removed: 86] [added: 88] | % |
| Prepared Foods Processing Plants | | | | [removed: 85] [added: 78] million pounds | | | [removed: 86] [added: 87] | % |
| [removed: (3)] [added: (1)] | Capacity per week based on the following: Chicken- five day week, Prepared [removed: Foods and International-] [added: Foods-] five [removed: to six] day week, Beef and Pork- six day week. |
Prepared Foods: Prepared Foods plants process fresh and frozen chicken, turkey, beef, pork and other raw materials into pizza toppings, branded and processed meats, [added: desserts,] appetizers, prepared meals, ethnic foods, soups, sauces, side dishes, pizza crusts, flour and corn tortilla products and meat dishes.
[removed: International: International chicken] [added: The] processing plants include various phases of slaughtering, dressing, cutting, packaging, deboning and [removed: further-processing.][added: further-processing chicken.]
The feed mills and broiler hatcheries generally have sufficient capacity to meet the needs of the [added: foreign] chicken growout operations.
| (2) | Includes our owned Chicago, Illinois hospitality plant and our Jefferson, Wisconsin, plant scheduled to close in the back half of fiscal 2016. |
In addition, our foreign chicken operations in China and India include four processing plants, two rendering plants, three feed mills and five broiler hatcheries.
| International Segment: | | | | | | | | |
| Rendering plants | 6 | | | — | | | 6 | |
| Feed mills | 7 | | | 4 | | | 11 | |
| Broiler hatcheries | 3 | | | 4 | | | 7 | |
| Breeder houses | 159 | | | — | | | 159 | |
| Broiler farm houses | 439 | | | — | | | 439 | |
| Distribution Centers | 10 | | | 9 | | | 19 | |
| Chicken Processing Plants | | | | 40 million head | | | 90 | % |
| International Processing Plants | | | | 8 million head | | | 67 | % |
| | |
| --- | --- |
| (1) | Includes 12 owned and four leased legacy Hillshire Brands processing plants. Additionally the 35 owned processing plants include three facilities, two legacy Prepared Foods (Buffalo, New York and Santa Teresa, New Mexico) and one legacy Hillshire Brands (Florence, Alabama), scheduled to close in fiscal 2015. |
| (2) | Includes one leased facility outside Chicago, Illinois assumed in our acquisition of Hillshire Brands. |
Item 4. MINE SAFETY DISCLOSURES
24 rewritten, 5 added, 1 removed, 40 unchanged
Read the full itemFY2015 item · filed November 23, 2015FY2014 item · filed November 17, 2014
| John Tyson | | Chairman of the Board of Directors | | [removed: 61] [added: 62] | | 2011 |
| Curt T. Calaway | | Senior Vice President, Controller and Chief Accounting Officer | | [removed: 41] [added: 42] | | 2012 |
| Andrew P. Callahan | | President, Retail Packaged Brands | | [removed: 48] [added: 49] | | 2014 |
| Howell P. Carper | | Executive Vice President, Strategy and New Ventures | | [removed: 61] [added: 62] | | 2013 |
| Sally Grimes | | President and [added: Chief] Global Growth Officer | | [removed: 43] [added: 44] | | 2014 |
| Donnie King | | President of North American [removed: Operations] [added: Operations, Fresh Beef/Pork, Poultry] and [removed: Food Service] [added: Prepared Foods] | | [removed: 52] [added: 53] | | 2009 |
| Dennis Leatherby | | Executive Vice President and Chief Financial Officer | | [removed: 54] [added: 55] | | 1994 |
| Mary Oleksiuk | | Executive Vice President and Chief Human Resources Officer | | [removed: 52] [added: 53] | | 2014 |
| Donnie Smith | | President and Chief Executive Officer | | [removed: 55] [added: 56] | | 2008 |
| Stephen Stouffer | | President, Fresh Meats | | [removed: 54] [added: 55] | | 2013 |
| David L. Van Bebber | | Executive Vice President and General Counsel | | [removed: 58] [added: 59] | | 2008 |
| Noel White | | President, Poultry | | [removed: 56] [added: 57] | | 2009 |
Mr. Callahan previously served as Executive Vice President and President, Retail of The Hillshire Brands [removed: Company,] [added: Company (“Hillshire Brands”)] since 2012, prior to which he served as Senior Vice President, Chief Customer Officer for Sara Lee Corporation's [added: (“Sara Lee”)] North American operations from 2011 to 2012, after serving as [removed: President,] [added: President] of Sara Lee's North American Foodservice segment from 2009 to 2011.
[removed: The] Hillshire Brands [removed: Company] was acquired by the Company in August 2014.
(“Hal”) Carper was appointed Executive Vice [removed: President] [added: President,] Strategy and New Ventures in 2013, after serving as Group Vice President, Research and Development, Logistics, and Technical Services since 2008, prior to which he served as Senior Vice President, Corporate Research and Development since 2003, and Senior Vice President and General Manager, Foodbrands Foodservice since 2001.
Sally Grimes was appointed President and [added: Chief] Global Growth Officer in [added: June 2015 following her appointment as President and Global Growth Officer in] September 2014.
Ms. Grimes previously served as Senior Vice President, Chief Innovation Officer and President, Gourmet Food [removed: Group,] [added: Group] of [removed: The] Hillshire Brands [removed: Company] since 2012.
Prior to joining Hillshire Brands, Ms. Grimes served as Global Vice President, [removed: Marketing,] [added: Marketing] for the writing and creative expression business unit at Newell Rubbermaid, Inc. (global marketer of consumer and commercial products) from 2007 to 2012.
Hayes was appointed [added: Chief Commercial Officer in June 2015 after being appointed] President, Food Service in September 2014.
Mr. Hayes previously served as Executive Vice President and Chief Supply Chain Officer of [removed: The] Hillshire Brands [removed: Company] since 2012, prior to which he served as Senior Vice President and Chief Supply Chain Officer for Sara [removed: Lee Corporation's] [added: Lee’s] North American Retail and Foodservice businesses from 2009 to 2012.
Mr. Hayes was initially employed by Sara Lee [removed: Corporation] in 2006.
[removed: Donnie King was appointed President of North American Operations and Food Service in 2014, after serving] [added: He previously served] as President of Prepared Foods, Customer and Consumer Solutions since 2013, Senior Group Vice President, Poultry and Prepared Foods since 2009, Group Vice President, Refrigerated and Deli since 2008, Group Vice President, Operations since 2007, Senior Vice President, Consumer Products Operations since 2006 and Senior Vice President, Poultry Operations since 2003.
Ms. Oleksiuk previously served as Senior Vice President, Chief Human Resources Officer for [removed: The] Hillshire Brands [removed: Company] since 2012.
Donnie Smith was appointed President and Chief Executive Officer in [added: November] 2009, after serving as Senior Group Vice President, Poultry and Prepared Foods since January 2009, prior to which he served as Group Vice President of Consumer Products since 2008, Group Vice President of Logistics and Operations Services since 2007, Group Vice President Information Systems, Purchasing and Distribution since 2006 and Senior Vice President and Chief Information Officer since 2005.
| Thomas P. Hayes | | Chief Commercial Officer and President, Foodservice | | 50 | | 2014 |
| Mike Roetzel | | Executive Vice President, Operations Services | | 56 | | 2015 |
Donnie King was appointed President of North American Operations, Fresh Beef/Pork, Poultry and Prepared Foods in June 2015 following his appointment as President of North American Operations and Food Service in 2014.
Mike Roetzel was appointed Executive Vice President of Operations Services in November 2015, after serving as Group Vice President of Operations Services since 2013, prior to which he served as Senior Vice President, Purchasing since 2008, and various officer positions since 1999.
Mr. Roetzel was initially employed by the Company in 1986.
| Thomas P. Hayes | | President, Food Service | | 49 | | 2014 |
Item 5. MARKET FOR REGISTRANT’S COMMON EQUITY, RELATED STOCKHOLDER MATTERS AND ISSUER PURCHASES OF EQUITY SECURITIES
18 rewritten, 13 added, 10 removed, 33 unchanged
Read the full itemFY2015 item · filed November 23, 2015FY2014 item · filed November 17, 2014
As of October [removed: 25, 2014,] [added: 31, 2015,] there were approximately 24,000 holders of record of our Class A stock and seven holders of record of our Class B stock, excluding holders in the security position listings held by nominees.
In fiscal [removed: 2013,] [added: 2015,] the annual dividend rate for Class A stock was [removed: $0.20] [added: $0.40] per share and the annual dividend rate for Class B stock was [removed: $0.18] [added: $0.36] per share.
On November [removed: 13, 2014,] [added: 19, 2015,] the Board of Directors increased the quarterly dividend previously declared on July 30, [removed: 2014,] [added: 2015,] to [removed: $0.10] [added: $0.15] per share on our Class A stock and [removed: $0.09] [added: $0.135] per share on our Class B stock.
The increased quarterly dividend is payable on December 15, [removed: 2014,] [added: 2015,] to shareholders of record at the close of business on December 1, [removed: 2014.][added: 2015.]
The high and low sales prices of our Class A stock for each quarter of fiscal [removed: 2014] [added: 2015] and [removed: 2013] [added: 2014] are represented in the table below.
| First Quarter | $ | [removed: 34.38] [added: 43.37] | | | $ | [removed: 27.33] [added: 37.02] | | | $ | [removed: 19.91] [added: 34.38] | | | $ | [removed: 15.93] [added: 27.33] | |
| Second Quarter | [removed: 43.45] [added: 42.41] | | | | [removed: 33.03] [added: 37.10] | | | | [removed: 24.85] [added: 43.45] | | | | [removed: 19.08] [added: 33.03] | | |
| Third Quarter | [removed: 44.24] [added: 45.10] | | | | [removed: 34.90] [added: 37.24] | | | | [removed: 26.00] [added: 44.24] | | | | [removed: 22.47] [added: 34.90] | | |
| Fourth Quarter | [removed: 41.88] [added: 44.78] | | | | [removed: 36.12] [added: 39.05] | | | | [removed: 32.40] [added: 41.88] | | | | [removed: 25.69] [added: 36.12] | | |
| (2) | We purchased [removed: 229,435] [added: 258,556] shares during the period that were not made pursuant to our previously announced stock repurchase program, but were purchased to fund certain Company obligations under our equity compensation plans. These transactions included [removed: 176,258] [added: 215,099] shares purchased in open market transactions and [removed: 53,177] [added: 43,457] shares withheld to cover required tax withholdings on the vesting of restricted stock. |
| (3) | [removed: There were no] [added: These] shares [added: were] purchased during the period pursuant to our previously announced stock repurchase program. |
[removed: ][added: 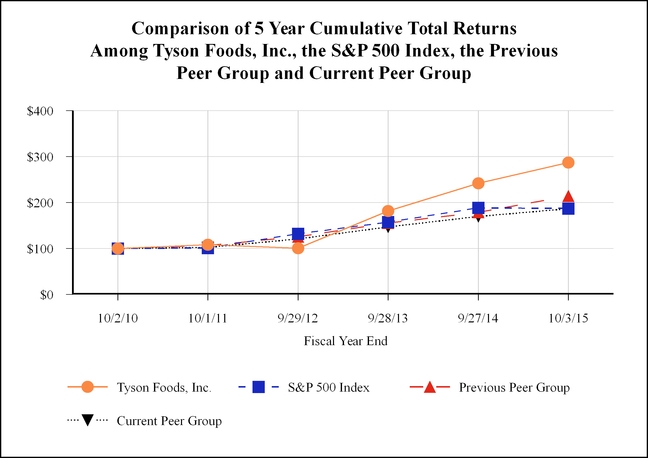]
| | Base Period [removed: 10/3/09 | | | |] 10/2/10 | | | | 10/1/11 | | | | 9/29/12 | | | | 9/28/13 | | | | 9/27/14 | | | [added: | 10/3/15 | | |]
The total cumulative return on investment (change in the year-end stock price plus reinvested dividends), which is based on the stock price or composite index at the end of fiscal [removed: 2009,] [added: 2010,] is presented for each of the periods for the Company, the S&P 500 Index, the previous peer group and the current peer group.
The previous peer group included: Archer-Daniels-Midland Company, Bunge Limited, Campbell Soup Company, ConAgra Foods, Inc., Dean Foods Company, General Mills, Inc., [removed: H.J. Heinz Co. (up to June 7, 2013),] Hillshire Brands [removed: (beginning on June] [added: (up to August] 28, [removed: 2012),] [added: 2014),] Hormel Foods Corp., Kellogg Co., Kraft Foods Group [removed: Inc.,] [added: Inc. (up to July 2, 2015),] McCormick & Co., [added: Mondelez Interenational Inc.,] Pilgrim’s Pride Corporation, Sanderson Farms, Inc., [removed: Smithfield Foods, Inc. (up to September 26, 2013)] and The J.M. Smucker Company.
The current peer group includes: Archer-Daniels-Midland Company, Bunge Limited, Campbell Soup Company, ConAgra Foods, Inc., Dean Foods Company, General Mills, Inc., [removed: Hillshire Brands (up to August 28, 2014),] Hormel Foods Corp., Kellogg Co., [removed: Kraft Foods Group Inc.,] McCormick & Co., Mondelez Interenational Inc., [added: PepsiCo, Inc.,] Pilgrim's Pride Corporation, Sanderson Farms, Inc., [added: The Hershey Company,] and The J.M. Smucker Company.
The differences between the current peer group and the previous peer group were the removal of [removed: H.J. Heinz Co.] [added: Hillshire Brands] and [removed: Smithfield Foods,] [added: Kraft Foods Group] Inc. because both ceased being publicly traded companies in fiscal [removed: 2014,] [added: 2014] and [added: fiscal 2015, respectively, and] the addition of [removed: Mondelez International,] [added: PepsiCo,] Inc. [removed: (formerly Kraft Foods, Inc.)] [added: and The Hershey Company] to more accurately reflect the Company’s peers in terms of industry standing.
The graph compares the performance of the [removed: Company] [added: Company's Class A common stock] with that of the S&P 500 Index and both peer groups, with the [removed: investment] [added: return of each company in the peer groups] weighted on market capitalization.
Also on November 19, 2015, the Board of Directors declared a quarterly dividend of $0.15 per share on our Class A stock and $0.135 per share on our Class B stock, payable on March 15, 2016, to shareholders of record at the close of business on March 1, 2016.
We anticipate the remaining quarterly dividends in fiscal 2016 will be $0.15 and $0.135 per share of our Class A and Class B stock, respectively.
Beginning in fiscal 2017, we anticipate to increase our annual dividends approximately $0.10 per year.
| | 2015 | | | | | | | | 2014 | | | | | | |
| Jun. 28, 2015 to Jul. 25, 2015 | 92,654 | | | $ | 43.48 | | — | | | 27,929,771 | |
| Jul. 26, 2015 to Aug. 29, 2015 | 3,265,564 | | | 41.92 | | | 3,173,112 | | | 24,756,659 | |
| Aug. 30, 2015 to Oct. 3, 2015 | 3,701,964 | | | 42.31 | | | 3,628,514 | | | 21,128,145 | |
| Total | 7,060,182 | | (2) | $ | 42.14 | | 6,801,626 | | (3) | 21,128,145 | |
| Tyson Foods, Inc. | $ | 100.00 | | | $ | 107.73 | | | $ | 100.29 | | | $ | 181.53 | | | $ | 241.50 | | | $ | 286.76 | |
| S&P 500 Index | 100.00 | | | | 101.14 | | | | 131.69 | | | | 157.17 | | | | 188.18 | | | | 187.02 | | |
| Previous Peer Group | 100.00 | | | | 106.42 | | | | 125.22 | | | | 155.13 | | | | 178.46 | | | | 213.97 | | |
| Current Peer Group | 100.00 | | | | 102.25 | | | | 120.48 | | | | 146.77 | | | | 169.42 | | | | 186.09 | | |
The information in this "Performance Graph" section shall not be deemed to be "soliciting material" or to be "filed" with the Securities and Exchange Commission or subject to Regulation 14A or 14C, or to the liabilities of Section 18 of the Securities Exchange Act of 1934.
| | 2014 | | | | | | | | 2013 | | | | | | |
| Jun. 29, 2014 to Jul. 26, 2014 | 81,199 | | | $ | 39.01 | | — | | | 32,054,771 | |
| Jul. 27, 2014 to Aug. 30, 2014 | 107,377 | | | 38.41 | | | — | | | 32,054,771 | |
| Aug. 31, 2014 to Sept. 27, 2014 | 40,859 | | | 38.35 | | | — | | | 32,054,771 | |
| Total | 229,435 | | (2) | $ | 38.61 | | — | | (3) | 32,054,771 | |
| Tyson Foods, Inc. | $ | 100.00 | | | $ | 133.34 | | | $ | 143.66 | | | $ | 133.73 | | | $ | 242.06 | | | $ | 322.02 | |
| S&P 500 Index | 100.00 | | | | 110.16 | | | | 111.42 | | | | 145.07 | | | | 173.13 | | | | 207.30 | | |
| Previous Peer Group | 100.00 | | | | 114.42 | | | | 120.23 | | | | 136.08 | | | | 150.45 | | | | 169.01 | | |
| Current Peer Group | 100.00 | | | | 115.87 | | | | 123.31 | | | | 145.13 | | | | 179.48 | | | | 200.67 | | |
Hillshire Brands was removed from the current peer group at the time its shares ceased public trading.
Item 6. SELECTED FINANCIAL DATA
48 rewritten, 2 added, 2 removed, 54 unchanged
Read the full itemFY2015 item · filed November 23, 2015FY2014 item · filed November 17, 2014
| in millions, except per [removed: share] [added: share, percentage] and ratio data | | | | | | | | | | | | | | | | | | | |
| | [removed: 2014] [added: 2015] | | | | [removed: 2013] [added: 2014] | | | | [removed: 2012] [added: 2013] | | | | [removed: 2011] [added: 2012] | | | | [removed: 2010] [added: 2011] | | |
| Sales | $ | [removed: 37,580] [added: 41,373] | | | $ | [removed: 34,374] [added: 37,580] | | | $ | [removed: 33,055] [added: 34,374] | | | $ | [removed: 32,032] [added: 33,055] | | | $ | [removed: 28,212] [added: 32,032] | |
| Operating income | [removed: 1,430] [added: 2,169] | | | | [removed: 1,375] [added: 1,430] | | | | [removed: 1,286] [added: 1,375] | | | | [removed: 1,289] [added: 1,286] | | | | [removed: 1,574] [added: 1,289] | | |
| Net interest expense | [removed: 125] [added: 284] | | | | [removed: 138] [added: 125] | | | | [removed: 344] [added: 138] | | | | [removed: 231] [added: 344] | | | | [removed: 333] [added: 231] | | |
| Income from continuing operations | [removed: 856] [added: 1,224] | | | | [removed: 848] [added: 856] | | | | [removed: 614] [added: 848] | | | | [removed: 738] [added: 614] | | | | [removed: 783] [added: 738] | | |
| Loss from discontinued operation, net of tax | — | | | | [removed: (70] [added: —] | | [removed: )] | | [removed: (38] [added: (70] | | ) | | [removed: (5] [added: (38] | | ) | | [removed: (18] [added: (5] | | ) |
| Net income | [removed: 856] [added: 1,224] | | | | [removed: 778] [added: 856] | | | | [removed: 576] [added: 778] | | | | [removed: 733] [added: 576] | | | | [removed: 765] [added: 733] | | |
| Net income attributable to Tyson | [removed: 864] [added: 1,220] | | | | [removed: 778] [added: 864] | | | | [removed: 583] [added: 778] | | | | [removed: 750] [added: 583] | | | | [removed: 780] [added: 750] | | |
| Income from continuing operations | [removed: 2.37] [added: 2.95] | | | | [removed: 2.31] [added: 2.37] | | | | [removed: 1.68] [added: 2.31] | | | | [removed: 1.98] [added: 1.68] | | | | [removed: 2.09] [added: 1.98] | | |
| Loss from discontinued operation | — | | | | [removed: (0.19] [added: —] | | [removed: )] | | [removed: (0.10] [added: (0.19] | | ) | | [removed: (0.01] [added: (0.10] | | ) | | [removed: (0.03] [added: (0.01] | | ) |
| Net income | [removed: 2.37] [added: 2.95] | | | | [removed: 2.12] [added: 2.37] | | | | [removed: 1.58] [added: 2.12] | | | | [removed: 1.97] [added: 1.58] | | | | [removed: 2.06] [added: 1.97] | | |
| Class A | [removed: 0.325] [added: 0.425] | | | | [removed: 0.310] [added: 0.325] | | | | [removed: 0.160] [added: 0.310] | | | | 0.160 | | | | 0.160 | | |
| Class B | [removed: 0.294] [added: 0.383] | | | | [removed: 0.279] [added: 0.294] | | | | [removed: 0.144] [added: 0.279] | | | | 0.144 | | | | 0.144 | | |
| Cash and cash equivalents | $ | [removed: 438] [added: 688] | | | $ | [removed: 1,145] [added: 438] | | | $ | [removed: 1,071] [added: 1,145] | | | $ | [removed: 716] [added: 1,071] | | | $ | [removed: 978] [added: 716] | |
| Total assets | [removed: 23,956] [added: 23,004] | | | | [removed: 12,177] [added: 23,956] | | | | [removed: 11,896] [added: 12,177] | | | | [removed: 11,071] [added: 11,896] | | | | [removed: 10,752] [added: 11,071] | | |
| Total debt | [removed: 8,178] [added: 6,725] | | | | [removed: 2,408] [added: 8,178] | | | | [removed: 2,432] [added: 2,408] | | | | [removed: 2,182] [added: 2,432] | | | | [removed: 2,536] [added: 2,182] | | |
| Shareholders’ equity | [removed: 8,904] [added: 9,706] | | | | [removed: 6,233] [added: 8,904] | | | | [removed: 6,042] [added: 6,233] | | | | [removed: 5,685] [added: 6,042] | | | | [removed: 5,201] [added: 5,685] | | |
| Depreciation and amortization | $ | [removed: 530] [added: 711] | | | $ | [removed: 519] [added: 530] | | | $ | [removed: 499] [added: 519] | | | $ | [removed: 506] [added: 499] | | | $ | [removed: 497] [added: 506] | |
| Capital expenditures | [removed: 632] [added: 854] | | | | [removed: 558] [added: 632] | | | | [removed: 690] [added: 558] | | | | [removed: 643] [added: 690] | | | | [removed: 550] [added: 643] | | |
| EBITDA | [removed: 1,897] [added: 2,906] | | | | [removed: 1,818] [added: 1,897] | | | | [removed: 1,731] [added: 1,818] | | | | [removed: 1,767] [added: 1,731] | | | | [removed: 1,987] [added: 1,767] | | |
| Return on invested capital | [removed: 11.8] [added: 13.4] | | % | | [removed: 18.5] [added: 11.8] | | % | | [removed: 17.7] [added: 18.5] | | % | | [removed: 18.5] [added: 17.7] | | % | | [removed: 23.0] [added: 18.5] | | % |
| Effective tax rate for continuing operations | [removed: 31.6] [added: 36.3] | | % | | [removed: 32.6] [added: 31.6] | | % | | [removed: 36.4] [added: 32.6] | | % | | [removed: 31.6] [added: 36.4] | | % | | [removed: 35.9] [added: 31.6] | | % |
| Total debt to capitalization | [removed: 47.9] [added: 40.9] | | % | | [removed: 27.9] [added: 47.9] | | % | | [removed: 28.7] [added: 27.9] | | % | | [removed: 27.7] [added: 28.7] | | % | | [removed: 32.8] [added: 27.7] | | % |
| Book value per share | $ | [removed: 23.70] [added: 23.36] | | | $ | [removed: 18.13] [added: 23.70] | | | $ | [removed: 16.84] [added: 18.13] | | | $ | [removed: 15.38] [added: 16.84] | | | $ | [removed: 13.78] [added: 15.38] | |
| Stock price high | [removed: 44.24] [added: 45.10] | | | | [removed: 32.40] [added: 44.24] | | | | [removed: 21.06] [added: 32.40] | | | | [removed: 20.12] [added: 21.06] | | | | [removed: 20.57] [added: 20.12] | | |
| Stock price low | [removed: 27.33] [added: 37.02] | | | | [removed: 15.93] [added: 27.33] | | | | [removed: 14.07] [added: 15.93] | | | | [removed: 14.59] [added: 14.07] | | | | [removed: 11.91] [added: 14.59] | | |
| [removed: a.] [added: c.] | Fiscal 2014 included a $42 million pretax impairment charge and other costs related to the sale of our Brazil operation and Mexico's undistributed earnings tax, $197 million pretax expense related to the Hillshire Brands acquisition, integration and costs associated with our Prepared Foods improvement plan, $40 million pretax expense related to the Hillshire Brands post-closing results, purchase price accounting, and [removed: ongoing plant] [added: costs] related [added: to a] legacy Hillshire Brands [removed: fire costs,] [added: plant fire,] $27 million pretax expense related to the Hillshire Brands acquisition financing incremental interest cost and $52 million unrecognized tax benefit gain. |
| [removed: b.] [added: d.] | Fiscal 2013 included a $19 million currency translation adjustment gain recognized in conjunction with the receipt of proceeds constituting the final resolution of our investment in Canada. [added: Additionally in fiscal 2013, we determined our Weifang operation (Weifang) was no longer core to the execution of our strategy in China. In July 2013, we completed the sale of Weifang. Non-cash charges related to the impairment of assets in Weifang amounted to $56 million and $15 million in fiscal 2013 and 2012, respectively.] |
| [removed: d.] [added: e.] | Fiscal 2012 included a pretax charge of $167 million related to the early extinguishment of debt. |
| [removed: e.] [added: f.] | Fiscal 2011 included an $11 million non-operating gain related to the sale of interest in an equity method investment and a $21 million reduction to income tax expense related to a reversal of reserves for foreign uncertain tax positions. |
| i. | "EBITDA" is [added: a Non-GAAP measure and] defined as net income less interest income, plus interest, taxes, depreciation and amortization. [added: A reconciliation of net income to EBITDA immediately follows.] |
| | [removed: 2014] [added: 2015] | | | | [removed: 2013] [added: 2014] | | | | [removed: 2012] [added: 2013] | | | | [removed: 2011] [added: 2012] | | | | [removed: 2010] [added: 2011] | | |
| Net income | $ | [removed: 856] [added: 1,224] | | | $ | [removed: 778] [added: 856] | | | $ | [removed: 576] [added: 778] | | | $ | [removed: 733] [added: 576] | | | $ | [removed: 765] [added: 733] | |
| Less: Interest income | [removed: (7] [added: (9] | | ) | | (7 | | ) | | [removed: (12] [added: (7] | | ) | | [removed: (11] [added: (12] | | ) | | [removed: (14] [added: (11] | | ) |
| Add: Interest expense | [removed: 132] [added: 293] | | | | [removed: 145] [added: 132] | | | | [removed: 356] [added: 145] | | | | [removed: 242] [added: 356] | | | | [removed: 347] [added: 242] | | |
| Add: Income tax expense (a) | [removed: 396] [added: 697] | | | | [removed: 411] [added: 396] | | | | [removed: 351] [added: 411] | | | | [removed: 341] [added: 351] | | | | [removed: 438] [added: 341] | | |
| Add: Depreciation | [removed: 494] [added: 609] | | | | [removed: 474] [added: 494] | | | | [removed: 443] [added: 474] | | | | [removed: 433] [added: 443] | | | | [removed: 416] [added: 433] | | |
| Add: Amortization (b) | [removed: 26] [added: 92] | | | | [removed: 17] [added: 26] | | | | 17 | | | | [removed: 29] [added: 17] | | | | [removed: 35] [added: 29] | | |
| EBITDA | $ | [removed: 1,897] [added: 2,906] | | | $ | [removed: 1,818] [added: 1,897] | | | $ | [removed: 1,731] [added: 1,818] | | | $ | [removed: 1,767] [added: 1,731] | | | $ | [removed: 1,987] [added: 1,767] | |
| a. | Fiscal 2015 was a 53-week year, while the other years presented were 52-week years. |
| b. | Fiscal 2015 included a $169 million pretax impairment charge related to our China operation, $57 million pretax expense related to merger and integration costs, $59 million pretax impairment charges related to our Prepared Foods network optimization, $12 million pretax charges related to Denison impairment and plant closure costs, $8 million pretax gain related to net insurance proceeds (net of costs) related to a legacy Hillshire Brands plant fire, $21 million pretax gain on the sale of equity securities, $161 million pretax gain on the sale of the Mexico operation, $39 million pretax gain related to the impact of the additional week in fiscal 2015 and $26 million unrecognized tax benefit gain. |
| c. | During fiscal 2013 we determined our Weifang operation (Weifang) was no longer core to the execution of our strategy in China. In July 2013, we completed the sale of Weifang. Non-cash charges related to the impairment of assets in Weifang amounted to $56 million and $15 million in fiscal 2013 and 2012, respectively. |
| f. | Fiscal 2010 included $61 million of interest expense related to losses on notes repurchased/redeemed during fiscal 2010, a $29 million non-tax deductible charge related to a full goodwill impairment related to an immaterial Chicken segment reporting unit and a $12 million non-operating charge related to the partial impairment of an equity method investment. Additionally, fiscal 2010 included insurance proceeds received of $38 million related to Hurricane Katrina. |
An excerpt. Shown here: 40 of 48 rewritten, all 2 added and all 2 removed. The counts are complete. For every sentence, read Item 6. SELECTED FINANCIAL DATA in the FY2015 filing and the FY2014 filing.
Item 8. FINANCIAL STATEMENTS AND SUPPLEMENTARY DATA
649 rewritten, 270 added, 304 removed, 1,034 unchanged
Read the full itemFY2015 item · filed November 23, 2015FY2014 item · filed November 17, 2014
| | Three years ended [removed: September 27, 2014] [added: October 3, 2015] | | | | | | | | | | |
| | [removed: 2014] [added: 2015] | | | | [removed: 2013] [added: 2014] | | | | [removed: 2012] [added: 2013] | | |
| Sales | $ | [removed: 37,580] [added: 41,373] | | | $ | [removed: 34,374] [added: 37,580] | | | $ | [removed: 33,055] [added: 34,374] | |
| Cost of Sales | [removed: 34,895] [added: 37,456] | | | | [removed: 32,016] [added: 34,895] | | | | [removed: 30,865] [added: 32,016] | | |
| Gross Profit | [removed: 2,685] [added: 3,917] | | | | [removed: 2,358] [added: 2,685] | | | | [removed: 2,190] [added: 2,358] | | |
| Selling, General and Administrative | [removed: 1,255] [added: 1,748] | | | | [removed: 983] [added: 1,255] | | | | [removed: 904] [added: 983] | | |
| Operating Income | [removed: 1,430] [added: 2,169] | | | | [removed: 1,375] [added: 1,430] | | | | [removed: 1,286] [added: 1,375] | | |
| Interest income | [removed: (7] [added: (9] | | ) | | (7 | | ) | | [removed: (12] [added: (7] | | ) |
| Interest expense | [removed: 132] [added: 293] | | | | [removed: 145] [added: 132] | | | | [removed: 356] [added: 145] | | |
| Other, net | [removed: 53] [added: (36] | | [added: )] | | [removed: (20] [added: 53] | | [removed: )] | | [removed: (23] [added: (20] | | ) |
| Total Other (Income) Expense | [removed: 178] [added: 248] | | | | [removed: 118] [added: 178] | | | | [removed: 321] [added: 118] | | |
| Income from Continuing Operations before Income Taxes | [removed: 1,252] [added: 1,921] | | | | [removed: 1,257] [added: 1,252] | | | | [removed: 965] [added: 1,257] | | |
| Income Tax Expense | [removed: 396] [added: 697] | | | | [removed: 409] [added: 396] | | | | [removed: 351] [added: 409] | | |
| Income from Continuing Operations | [removed: 856] [added: 1,224] | | | | [removed: 848] [added: 856] | | | | [removed: 614] [added: 848] | | |
| Loss from Discontinued Operation, Net of Tax | — | | | | [removed: (70] [added: —] | | [removed: )] | | [removed: (38] [added: (70] | | ) |
| Net Income | [removed: 856] [added: 1,224] | | | | [removed: 778] [added: 856] | | | | [removed: 576] [added: 778] | | |
| Less: Net [removed: Loss] [added: Income (Loss)] Attributable to Noncontrolling Interests | [removed: (8] [added: 4] | | [removed: )] | | [removed: —] [added: (8] | | [added: )] | | [removed: (7] [added: —] | | [removed: )] |
| Net Income Attributable to Tyson | $ | [removed: 864] [added: 1,220] | | | $ | [removed: 778] [added: 864] | | | $ | [removed: 583] [added: 778] | |
| Net Income from Continuing Operations | [removed: 864] [added: 1,220] | | | | [removed: 848] [added: 864] | | | | [removed: 621] [added: 848] | | |
| Net Loss from Discontinued Operation | — | | | | [removed: (70] [added: —] | | [removed: )] | | [removed: (38] [added: (70] | | ) |
| Net Income Attributable to Tyson | $ | [removed: 864] [added: 1,220] | | | $ | [removed: 778] [added: 864] | | | $ | [removed: 583] [added: 778] | |
| Class A Basic | [removed: 284] [added: 335] | | | | [removed: 282] [added: 284] | | | | [removed: 293] [added: 282] | | |
| Diluted | [removed: 364] [added: 413] | | | | [removed: 367] [added: 364] | | | | [removed: 370] [added: 367] | | |
| Class A Basic | $ | [removed: 2.48] [added: 3.06] | | | $ | [removed: 2.46] [added: 2.48] | | | $ | [removed: 1.75] [added: 2.46] | |
| Class B Basic | $ | [removed: 2.26] [added: 2.79] | | | $ | [removed: 2.22] [added: 2.26] | | | $ | [removed: 1.57] [added: 2.22] | |
| Diluted | $ | [removed: 2.37] [added: 2.95] | | | $ | [removed: 2.31] [added: 2.37] | | | $ | [removed: 1.68] [added: 2.31] | |
| Class A Basic | $ | — | | | $ | [removed: (0.20] [added: —] | [removed: )] | | $ | [removed: (0.11] [added: (0.20] | ) |
| Class B Basic | $ | — | | | $ | [removed: (0.18] [added: —] | [removed: )] | | $ | [removed: (0.09] [added: (0.18] | ) |
| Diluted | $ | — | | | $ | [removed: (0.19] [added: —] | [removed: )] | | $ | [removed: (0.10] [added: (0.19] | ) |
| Class A Basic | $ | [removed: 2.48] [added: 3.06] | | | $ | [removed: 2.26] [added: 2.48] | | | $ | [removed: 1.64] [added: 2.26] | |
| Class B Basic | $ | [removed: 2.26] [added: 2.79] | | | $ | [removed: 2.04] [added: 2.26] | | | $ | [removed: 1.48] [added: 2.04] | |
| Diluted | $ | [removed: 2.37] [added: 2.95] | | | $ | [removed: 2.12] [added: 2.37] | | | $ | [removed: 1.58] [added: 2.12] | |
| Class A | $ | [removed: 0.325] [added: 0.425] | | | $ | [removed: 0.310] [added: 0.325] | | | $ | [removed: 0.160] [added: 0.310] | |
| Class B | $ | [removed: 0.294] [added: 0.383] | | | $ | [removed: 0.279] [added: 0.294] | | | $ | [removed: 0.144] [added: 0.279] | |
| | Three years ended [removed: September 27, 2014] [added: October 3, 2015] | | | | | | | | | | |
| | [removed: 2014] [added: 2015] | | | | [removed: 2013] [added: 2014] | | | | [removed: 2012] [added: 2013] | | |
| Net Income | $ | [removed: 856] [added: 1,224] | | | $ | [removed: 778] [added: 856] | | | $ | [removed: 576] [added: 778] | |
| Derivatives accounted for as cash flow hedges | [removed: 1] [added: 2] | | | | [removed: (14] [added: 1] | | [removed: )] | | [removed: 17] [added: (14] | | [added: )] |
| Investments | [removed: 4] [added: (1] | | [added: )] | | [removed: (3] [added: 4] | | [removed: )] | | [removed: —] [added: (3] | | [added: )] |
| Currency translation | [removed: (30] [added: 36] | | [removed: )] | | [removed: (37] [added: (30] | | ) | | [removed: 3] [added: (37] | | [added: )] |
| | 2015 | | | | 2014 | | |
| Gain on dispositions of businesses | (177 | | ) | | — | | | | — | | |
| Share-based compensation expense | 69 | | | | 51 | | | | 36 | | |
| Net changes in other operating assets and liabilities | 71 | | | | 18 | | | | (27 | | ) |
| Proceeds from sale of businesses | 539 | | | | — | | | | — | | |
| Borrowings on revolving credit facility | 1,345 | | | | — | | | | — | | |
| Payments on revolving credit facility | (1,345 | | ) | | — | | | | — | | |
We are a recognized market leader in chicken, beef and pork as well as prepared foods, including bacon, breakfast sausage, turkey, lunchmeat, hot dogs, pizza crusts and toppings, tortillas and desserts.
| | 2015 | | | | 2014 | | |
Amortization expense is generally recognized in selling, general, and administrative expense.
We review the carrying value of definite life intangibles at each balance sheet date if indication of impairment exists.
Recoverability is assessed using undiscounted cash flows based on historical results and current projections of earnings before interest, taxes, depreciation and amortization.
We measure impairment as the excess of carrying value over the fair value of the definite life intangible asset.
We use various valuation techniques to estimate fair value, with the primary techniques being discounted cash flows, relief-from-royalty and multi-period excess earnings valuation approaches, which use significant unobservable inputs, or Level 3 inputs, as defined by the fair value hierarchy.
The discount rate used in our annual goodwill impairment test decreased to 6.8% in fiscal 2015 from 7.9% in fiscal 2014.
The discount rate used in our indefinite life intangible test was 8.0% in fiscal 2015.
We did not have material indefinite life intangible assets prior to the acquisition of Hillshire Brands in August 2014.
In fiscal 2015, we recorded a $23 million full impairment of an immaterial reporting unit’s goodwill.
| | 2015 | | | | 2014 | | |
| Accrued marketing, advertising and promotion expense | 192 | | | | 185 | | |
| Other | 488 | | | | 532 | | |
Reclassification: We reclassified Share-based compensation expense, which was previously included in Other, net within the cash flows from operating activities in the Consolidated Statements of Cash Flows to conform to the current period presentation.
NOTE 2: RECENTLY ISSUED ACCOUNTING PRONOUCEMENTS
The guidance provides for a single five-step model to be applied to all revenue contracts with customers.
The standard also requires additional financial statement disclosures that will enable users to understand the nature, amount, timing and uncertainty of revenue and cash flows relating to customer contracts.
Companies have an option to use either a retrospective approach or cumulative effect adjustment approach to implement the standard.
Early adoption is permitted for fiscal years beginning after December 15, 2016.
In February 2015, the FASB issued guidance changing the analysis procedures that a reporting entity must perform to determine whether it should consolidate certain types of legal entities.
All legal entities are subject to reevaluation under the revised consolidation model.
The new guidance affects the following areas: (1) limited partnerships and similar legal entities, (2) evaluating fees paid to a decision maker or a service provider as a variable interest, (3) the effect of fee arrangements on the primary beneficiary determination, (4) the effect of related parties on the primary beneficiary determination, and (5) certain investment funds.
This guidance is effective for annual reporting periods and interim periods within those annual reporting periods, beginning after December 15, 2015, our fiscal 2017.
The Company is currently evaluating the impact this guidance will have on our consolidated financial statements.
In April 2015, the FASB issued guidance which requires debt issuance costs to be presented in the balance sheet as a direct deduction from the associated debt liability.
The guidance is effective for annual reporting periods and interim periods within those annual reporting periods beginning after December 15, 2015, our fiscal 2017.
Early adoption is permitted.
In April 2015, the FASB issued guidance on the recognition of fees paid by a customer for cloud computing arrangements.
The new guidance clarifies that if a cloud computing arrangement includes a software license, the customer should account for the software license consistent with the acquisition of other software licenses.
If the arrangement does not include a software license, the customer should account for the arrangement as a service contract.
The guidance is effective for annual reporting periods and interim periods within those annual reporting periods beginning after December 15, 2015, our fiscal 2017.
The Company is currently evaluating the impact this guidance will have on our consolidated financial statements.
| | | | | | | | |
| --- | --- | --- | --- | --- | --- | --- | --- |
| | | | | | | | |
| Loss on early extinguishment of debt | — | | | | — | | | | 167 | | |
| | | | | | | | |
| | | | | | | | |
| | | | | | | | |
| | | | | | | | |
| Other | 717 | | | | 719 | | |
The guidance also modifies the related disclosure requirements, clarifies guidance for multiple-element arrangements and provides guidance for transactions that were not addressed fully in previous guidance.
NOTE 2: CHANGES IN ACCOUNTING PRINCIPLES
In December 2011 and February 2013, the FASB issued guidance enhancing disclosures related to offsetting of certain assets and liabilities.
We adopted this guidance in the first quarter of fiscal 2014.
Certain estimated values for the acquisition, including goodwill, intangible assets, plant property and equipment, and deferred taxes, are not yet finalized and the preliminary purchase price allocations are subject to change as we complete our analysis of the fair value at the date of acquisition.
| Inventories | | 421 | | |
| Goodwill | | 4,804 | | |
| | | | | | | | | |
| --- | --- | --- | --- | --- | --- | --- | --- | --- |
| | | | | | | | | |
Hillshire Brands' one month results were insignificant to our Consolidated Statements of Income.
We expect to complete the sale of our Brazil operation in the first quarter of fiscal 2015.
We expect to realize a gain on the sale of our Mexico operation, which is pending the necessary government approvals, and expect it to close in the first half of fiscal 2015.
At September 28, 2013, Dynamic Fuels had $166 million of total assets, of which $142 million was net property, plant and equipment, and $113 million of total liabilities, of which $100 million was long-term debt.
| | 10,381 | | | | 9,202 | | |
| | 909 | | | | 563 | | | | 317 | | | | 63 | | | | 39 | | | | — | | | | 1,891 | | |
| Goodwill | 908 | | | | 1,123 | | | | 317 | | | | 75 | | | | 68 | | | | — | | | | 2,491 | | |
The allocation of goodwill to our reportable segments is pending finalization of the expected synergies and the impact of the synergies to our reporting units.
| 3.25% Convertible senior notes due October 2013 (2013 Notes) | — | | | | 458 | | |
| Term loan facility: | | | | | | | |
| GO Zone tax-exempt bonds | — | | | | 100 | | |
| Other | 24 | | | | 80 | | |
In September 2014, we amended our existing credit facility which, among other things, increased our line of credit from $1.0 billion to $1.25 billion.
The 2016 Notes carry an interest rate at issuance of 6.60%, with an interest step up feature dependent on their credit rating.
On June 7, 2012, Moody's upgraded the credit rating of these notes from "Ba1" to "Baa3." This upgrade decreased the interest rate on the 2016 Notes from 6.85% to 6.60%, effective beginning with the six-month interest payment due October 1, 2012.
On February 11, 2013, S&P upgraded the credit rating of the 2016 Notes from "BBB-" to "BBB." This upgrade did not impact the interest rate on the 2016 Notes.
2019 / 2024 / 2034 / 2044 Notes
In August 2014, we issued senior unsecured notes with an aggregate principal amount of $3,250 million, consisting of $1,000 million due August 2019, $1,250 million due August 2024, $500 million due August 2034, and $500 million due August 2044.
The 2019 Notes, 2024 Notes, 2034 Notes, and 2044 Notes carry interest rates of 2.65%, 3.95%, 4.88% and 5.15%, respectively, with interest payments due semi-annually on August 15 and February 15.
After the original issue discounts of $7 million, we received net proceeds of $3,243 million.
In addition, we incurred offering expenses of $27 million.
An excerpt. Shown here: 40 of 649 rewritten, 40 of 270 added and 40 of 304 removed. The counts are complete. For every sentence, read Item 8. FINANCIAL STATEMENTS AND SUPPLEMENTARY DATA in the FY2015 filing and the FY2014 filing.
Item 9A. CONTROLS AND PROCEDURES
7 rewritten, 0 added, 2 removed, 8 unchanged
Read the full itemFY2015 item · filed November 23, 2015FY2014 item · filed November 17, 2014
Based on that evaluation, the CEO and CFO concluded that, as of [removed: September 27, 2014,] [added: October 3, 2015,] our disclosure controls and procedures were effective.
In the quarter ended [removed: September 27, 2014,] [added: October 3, 2015,] there have been no changes in the Company’s internal control over financial reporting that have materially affected, or are reasonably likely to materially affect, the Company’s internal control over financial reporting.
Management conducted an evaluation of the effectiveness of our internal control over financial reporting as of [removed: September 27, 2014.][added: October 3, 2015.]
In making this assessment, we used criteria set forth by the Committee of Sponsoring Organizations of the Treadway Commission (COSO) in Internal Control – Integrated Framework [removed: (1992).][added: (2013).]
Based on this evaluation under the framework in Internal Control – Integrated Framework [removed: (1992)] [added: (2013)] issued by COSO, [removed: Management] [added: management] concluded the Company’s internal control over financial reporting was effective as of [removed: September 27, 2014.][added: October 3, 2015.]
The Company’s independent registered public accounting firm, PricewaterhouseCoopers LLP, who has audited the fiscal [removed: 2014] [added: 2015] financial statements included in this [added: Annual Report on] Form 10-K has also audited the [added: effectiveness of the] Company’s internal control over financial reporting.
[removed: Their] [added: Its] report appears in Part II, Item [removed: 8.][added: 8 of this Annual Report on Form 10-K.]
Management excluded The Hillshire Brands Company from our assessment of internal control over financial reporting as of September 27, 2014 because it was acquired by the Company in a purchase business combination in August 2014.
The Hillshire Brands Company is a wholly-owned subsidiary whose total assets and total revenues represent 10% and 1%, respectively, of the related consolidated financial statement amounts as of and for the year ended September 27, 2014.
Item 9B. OTHER INFORMATION
0 rewritten, 9 added, 1 removed, 1 unchanged
Read the full itemFY2015 item · filed November 23, 2015FY2014 item · filed November 17, 2014
On November 19, 2015, we entered into a new employment agreement with Donnie Smith, our President and Chief Executive Officer.
This contract replaces the previous contract for Mr. Smith entered into November 14, 2012.
Mr. Smith’s agreement provides for an annual base salary of $1,175,000.
The agreement provides for eligibility for (i) performance and incentive awards under annual and long-term cash and equity incentive plans then in effect, on terms and in amounts consistent with those as determined by and subject to the discretion of the Compensation and Leadership Development Committee of our Board of Directors, (ii) the Company’s supplemental executive retirement plan, (iii) any benefit programs generally applicable to executive officers of the Company, and (iv) use of Company-owned assets, including aircraft up to 50 hours annually, subject to the Company’s use and policies, along with reimbursement and gross-up for any tax liability associated with such use.
Mr. Smith may terminate his employment under the agreement, subject to confidentiality and non-compete obligations contained therein, upon 30 days’ prior written notice to the Company.
The Company has the right to terminate the agreement at any time upon written notice to Mr. Smith.
Any such termination without cause is subject to the Company’s obligation to continue to pay base salary for 36 months following termination consistent with the Severance Pay Plan for Contracted Officers and subject to provisions relating to the early vesting of stock options, restricted stock and performance stock awards.
Upon the occurrence of a change in control (as defined in the agreement), all previously granted restricted stock, performance stock and stock option awards will be treated in accordance with the applicable award agreement.
The foregoing description of Mr. Smith’s employment agreement is qualified in its entirety by reference to the full text of such agreement, which is filed as Exhibit 10.17 to this Form 10-K and incorporated by reference herein.
None.
Item 10. DIRECTORS, EXECUTIVE OFFICERS AND CORPORATE GOVERNANCE
2 rewritten, 1 added, 0 removed, 2 unchanged
Read the full itemFY2015 item · filed November 23, 2015FY2014 item · filed November 17, 2014
See information set forth under the captions “Election of [removed: Directors”] [added: Directors”, "Information Regarding the Board] and [added: its Committees", "Report of the Audit Committee" and] “Section 16(a) Beneficial Ownership Reporting Compliance” in the Company’s definitive Proxy Statement for the Company’s Annual Meeting of Shareholders to be held [removed: January 30, 2015] [added: February 5, 2016] (the “Proxy Statement”), which information is incorporated herein by reference.
Pursuant to general instruction G(3) of Annual Report on Form 10-K, certain information concerning our executive officers is included under the caption “Executive Officers of the Company” in Part I of this [removed: Report.][added: Annual Report on Form 10-K.]
We will post any amendments to the Code of Conduct, and any waivers that are required to be disclosed by the rules of either the Securities and Exchange Commission or the New York Stock Exchange, on our website.
Item 11. EXECUTIVE COMPENSATION
2 rewritten, 0 added, 0 removed, 0 unchanged
Read the full itemFY2015 item · filed November 23, 2015FY2014 item · filed November 17, 2014
See the information set forth under the captions “Executive Compensation,” “Director Compensation For Fiscal Year [removed: 2014,”] [added: 2015,”] “Compensation Discussion and Analysis,” “Report of the Compensation and Leadership Development Committee,” and “Compensation Committee Interlocks and Insider Participation” in the Proxy Statement, which information is incorporated herein by reference.
However, pursuant to instructions to Item 407(e)(5) of [removed: the Securities and Exchange Commission] Regulation S-K, the material appearing under the sub-heading “Report of the Compensation and Leadership Development Committee” shall [added: be deemed "furnished" and] not be deemed to be “filed” with the [added: Securities and Exchange] Commission, other than as provided in this Item 11.
Item 12. SECURITY OWNERSHIP OF CERTAIN BENEFICIAL OWNERS AND MANAGEMENT AND RELATED STOCKHOLDER MATTERS
3 rewritten, 2 added, 2 removed, 10 unchanged
Read the full itemFY2015 item · filed November 23, 2015FY2014 item · filed November 17, 2014
The following information reflects certain information about our equity compensation plans as of [removed: September 27, 2014:][added: October 3, 2015:]
| | Number of Securities to be issued upon exercise of outstanding options | | | Weighted average exercise price of outstanding options | | | | Number of Securities remaining available for future issuance under equity compensation plans (excluding Securities reflected in the first [removed: column)] [added: column (a))] | |
| (a) | Shares available for future issuance as of [removed: September 27, 2014,] [added: October 3, 2015,] under the Stock Incentive Plan [removed: (30,428,186),] [added: (24,293,913),] the Employee Stock Purchase Plan [removed: (17,269,468)] [added: (16,215,229)] and the Retirement Savings Plan (7,647,608) |
| Equity compensation plans approved by security holders | 14,735,065 | | | $ | 28.30 | | | 48,156,750 | |
| Total | 14,735,065 | | | $ | 28.30 | | | 48,156,750 | |
| Equity compensation plans approved by security holders | 13,724,409 | | | $ | 21.30 | | | 55,345,262 | |
| Total | 13,724,409 | | | $ | 21.30 | | | 55,345,262 | |
Item 13. CERTAIN RELATIONSHIPS AND RELATED TRANSACTIONS, AND DIRECTOR INDEPENDENCE
1 rewritten, 0 added, 0 removed, 0 unchanged
Read the full itemFY2015 item · filed November 23, 2015FY2014 item · filed November 17, 2014
See the information included under the captions “Election of [removed: Directors”] [added: Directors”, "Information Regarding the Board] and [added: its Committees" and] “Certain Transactions” in the Proxy Statement, which information is incorporated herein by reference.
Item 15. EXHIBITS, FINANCIAL STATEMENT SCHEDULES
89 rewritten, 13 added, 26 removed, 187 unchanged
Read the full itemFY2015 item · filed November 23, 2015FY2014 item · filed November 17, 2014
[added: (1)] Consolidated [added: Financial] Statements [removed: of Income]
[added: Consolidated Statements of Income] for the three years ended [removed: September 27, 2014][added: October 3, 2015]
Financial Statement Schedule - Schedule II Valuation and Qualifying [added: Accounts for the three years ended October 3, 2015]
The exhibits filed with this report are listed in the Exhibit Index [removed: at] [added: following] the [removed: end of Item 15.][added: signature pages to this Annual]
| 2.1 | | Agreement and Plan of Merger, dated as of July 1, 2014, by and between the Company and Hillshire Brands (previously filed as Exhibit 2.1 to the Company's Current Report on Form 8-K filed July 2, 2014, Commission File No. 001-14704, and incorporated herein by reference). [added: Exhibits and schedules have been omitted pursuant to Item 601(b)(2) of Regulation S-K, but a copy will be furnished supplementally to the Securities and Exchange Commission upon request.] |
| 2.2 | | Share Purchase Agreement dated November 9, [removed: 2010] [added: 2010,] by and among BBU, Inc., Grupo Bimbo, S.A.B. DE C.V. and Hillshire Brands Corporation (previously filed as Exhibit 2.1 to Quarterly Report on Form 10-Q for the period ended January 1, [removed: 2011] [added: 2011,] by The Hillshire Brands Company, Commission File No. 001-03344, and incorporated herein by reference). [added: Exhibits and schedules have been omitted pursuant to Item 601(b)(2) of Regulation S-K, but a copy will be furnished supplementally to the Securities and Exchange Commission upon request.] |
| [removed: 2.3] [added: 10.53] | | [removed: Master Separation Agreement] [added: Tax Sharing Agreement, dated as of June 15, 2012,] by and [removed: between] [added: among] Sara Lee Corporation, D.E MASTER BLENDERS 1753 B.V. and DE US, [removed: Inc., dated as of June 15, 2012] [added: Inc.] (previously filed as Exhibit [removed: 2.1] [added: 10.1] to [added: the] Current Report on Form 8-K [removed: filed] [added: dated] June [removed: 15,] [added: 18,] 2012 by The Hillshire Brands Company, Commission File No. 001-03344, and incorporated herein by reference). |
| 4.1 | | Indenture dated June 1, [removed: 1995] [added: 1995,] by and between the Company and The Chase Manhattan Bank, N.A., as Trustee (the “Company Indenture”) (previously filed as Exhibit 4 to Registration Statement on Form S-3, filed with the Commission on December 18, 1997, Registration No. 333-42525, and incorporated herein by reference). |
| 4.2 | | Form of 7.0% Note due January 15, [removed: 2028] [added: 2028,] issued under the Company Indenture (previously filed as Exhibit 4.2 to the Company’s Quarterly Report on Form 10-Q for the period ended December 27, 1997, Commission File No. 001-14704, and incorporated herein by reference). |
| 4.3 | | Form of 7.0% Note due May 1, [removed: 2018] [added: 2018,] issued under the Company Indenture (previously filed as Exhibit 4.1 to the Company’s Quarterly Report on Form 10-Q for the period ended March 28, 1998, Commission File No. 001-14704, and incorporated herein by reference). |
| 4.4 | | Form of 6.60% Senior Notes due April 1, [removed: 2016] [added: 2016,] issued under the Company Indenture (previously filed as Exhibit 4.1 to the Company’s Current Report on Form 8-K filed March 22, 2006, Commission File No. 001-14704, and incorporated herein by reference). |
| 4.17 | | Purchase Contract Agreement dated as of August 5, [removed: 2014] [added: 2014,] by and between the Company and The Bank of New York Mellon Trust Company, N.A., as Purchase Contract Agent (included in Exhibit 4.1 of the Company’s Current Report on Form 8-K filed August 5, 2014, Commission File No. 001-14704, and incorporated herein by reference). |
| 4.20 | | Supplemental Indenture dated as of August 5, [removed: 2014] [added: 2014,] by and between the Company and The Bank of New York Mellon Trust Company, N.A., as Trustee, supplementing the Company Indenture (included in Exhibit 4.5 of the Company’s Current Report on Form 8-K filed August 5, 2014, Commission File No. 001-14704, and incorporated herein by reference). |
| 4.22 | | Indenture dated October 2, [removed: 1990] [added: 1990,] between Sara Lee Corporation and Continental Bank, N.A., as Trustee (the “Sara Lee Indenture”) (previously filed as Exhibit 4.1 of Amendment No. 1 to Registration Statement No. 33-33603 on Form S-3 by Sara Lee Corporation, predecessor in interest to The Hillshire Brands Company, filed with the Commission on October 5, 1990, Commission File No. 001-03344, and incorporated herein by reference). |
| 4.23 | | Form of [removed: 2.75%] [added: 4.10%] Notes due [removed: 2015] [added: 2020] issued pursuant to the Sara Lee Indenture (included in Exhibit [removed: 4.1] [added: 4.2] to Current Report on Form 8-K dated September 7, 2010 by The Hillshire Brands Company, Commission File No. 001-03344, and incorporated herein by reference). |
| 4.24 | | Form of [removed: 4.10%] [added: 6.13%] Notes due [removed: 2020] [added: 2032] issued pursuant to the Sara Lee Indenture [removed: (included in] [added: (previously filed as] Exhibit [removed: 4.2] [added: 4.25] to [removed: Current] [added: the Company’s Annual] Report on Form [removed: 8-K dated] [added: 10-K for the fiscal year ended] September [removed: 7, 2010 by The Hillshire Brands Company,] [added: 27, 2014,] Commission File No. [removed: 001-03344,] [added: 001-14704,] and incorporated herein by reference). |
| [removed: 10.1] [added: 10.2] | | [removed: Second Amended and Restated Commitment Letter entered into] [added: Term Loan Agreement, dated] as of [removed: June 9,] [added: July 15,] 2014, [added: by and] among the Company, Morgan Stanley Senior Funding, [removed: Inc.] [added: Inc., as the Administrative Agent,] and [removed: JPMorgan Chase Bank] [added: certain other lenders party thereto] (previously filed as Exhibit [removed: 10.1] [added: 10.2] to the Company’s Current Report on Form 8-K filed [removed: June 10,] [added: July 17,] 2014, Commission File No. 001-14704, and incorporated herein by reference). |
| [removed: 10.2] [added: 10.1] | | Credit Agreement, dated as of September 25, 2014, by and among the Company, JPMorgan Chase Bank, N.A., as the Administrative Agent, and certain other lenders party thereto (previously filed as Exhibit 10.1 to the Company's Current Report on Form 8-K filed September 29, 2014, Commission File No. 001-14704, and incorporated herein by reference). |
| 10.3 | | [removed: 364-Day Bridge] Term Loan Agreement, dated as of [removed: July 15, 2014,] [added: April 7, 2015,] by and among the Company, [removed: Morgan Stanley Senior Funding, Inc.,] [added: Bank of America, N.A.] as [removed: the Administrative Agent,] [added: lender,] and [removed: certain other lenders party thereto] [added: Merill Lynch, Pierce, Fenner & Smith Incorporated, as sole lead arranger and sole bookrunner] (previously filed as [removed: Exhibit] [added: exhibit] 10.1 to the [removed: Company’s] [added: Company's] Current Report on Form 8-K filed [removed: July 17, 2014,] [added: April 8, 2015,] Commission File No. 001-14704, and incorporated herein by reference). |
| [removed: 10.4] [added: 10.21] | | [removed: Term Loan] [added: Indemnity] Agreement, dated as of [removed: July 15, 2014, by and among the Company, Morgan Stanley Senior Funding, Inc., as] [added: September 28, 2007, between] the [removed: Administrative Agent,] [added: Company] and [removed: certain other lenders party thereto] [added: John Tyson] (previously filed as Exhibit 10.2 to the Company’s Current Report on Form 8-K filed [removed: July 17, 2014,] [added: September 28, 2007,] Commission File No. 001-14704, and incorporated herein by reference). |
| [removed: 10.5] [added: 10.4] | | Amended and Restated Employment Agreement, dated as of May 1, 2014, by and between the Company and John Tyson (previously filed as Exhibit 10.1 to the Company’s Quarterly Report on Form 10-Q for the period ended March 29, 2014, Commission File No. 001-14704, and incorporated herein by reference). |
| [removed: 10.6] [added: 10.5] | | Employment Agreement, dated August 27, 2012, by and between the Company and Curt T. Calaway (previously filed as Exhibit 10.11 to the Company's Annual Report on Form 10-K for the fiscal year ended September 29, 2012, Commission File No. 001-14704, and incorporated herein by reference). |
| [removed: 10.7] [added: 10.6] | | Employment Agreement, dated November 14, 2012, by and between the Company and Donald J. Smith (previously filed as Exhibit 10.12 to the Company's Annual Report on Form 10-K for the fiscal year ended September 29, 2012, Commission File No. 001-14704, and incorporated herein by reference). |
| [removed: 10.8] [added: 10.7] | | Employment Agreement, dated November 14, 2012, by and between the Company and David Van Bebber (previously filed as Exhibit 10.14 to the Company's Annual Report on Form 10-K for the fiscal year ended September 29, 2012, Commission File No. 001-14704, and incorporated herein by reference). |
| [removed: 10.9] [added: 10.8] | | Employment Agreement, dated November 14, 2012, by and between the Company and Dennis Leatherby (previously filed as Exhibit 10.15 to the Company's Annual Report on Form 10-K for the fiscal year ended September 29, 2012, Commission File No. 001-14704, and incorporated herein by reference). |
| 10.10 | | Employment Agreement, dated November [removed: 14, 2012,] [added: 15, 2013,] by and between the Company and [removed: Kenneth J. Kimbro] [added: Noel W. White] (previously filed as Exhibit [removed: 10.16] [added: 10.19] to the Company's Annual Report on Form 10-K for the fiscal year ended September [removed: 29, 2012,] [added: 28, 2013,] Commission File No. 001-14704, and incorporated herein by reference). |
| [removed: 10.11] [added: 10.9] | | Employment Agreement, dated November [removed: 14, 2012,] [added: 15, 2013,] by and between the Company and Donnie D. [removed: King (previously] [added: King(previously] filed as Exhibit 10.17 to the Company's Annual Report on Form 10-K for the fiscal year ended September [removed: 29, 2012,] [added: 28, 2013,] Commission File No. 001-14704, and incorporated herein by reference). |
| 10.12 | | Employment Agreement, dated November [removed: 15,] [added: 12,] 2013, by and between the Company and [removed: Donnie D. King(previously] [added: Stephen R. Stouffer(previously] filed as Exhibit [removed: 10.17] [added: 10.21] to the Company's Annual Report on Form 10-K for the fiscal year ended September 28, 2013, Commission File No. 001-14704, and incorporated herein by reference). |
| 10.13 | | Employment Agreement, dated [removed: November 14, 2012,] [added: August 29, 2014,] by and between the Company and [removed: Noel W. White (previously] [added: Andrew P. Callahan(previously] filed as Exhibit [removed: 10.18] [added: 10.19] to the [removed: Company's] [added: Company’s] Annual Report on Form 10-K for the fiscal year ended September [removed: 29, 2012,] [added: 27, 2014,] Commission File No. 001-14704, and incorporated herein by reference). |
| [removed: 10.14] [added: 10.11] | | Employment Agreement, dated November 15, 2013, by and between the Company and [removed: Noel W. White (previously] [added: Howell P. Carper(previously] filed as Exhibit [removed: 10.19] [added: 10.20] to the Company's Annual Report on Form 10-K for the fiscal year ended September 28, 2013, Commission File No. 001-14704, and incorporated herein by reference). |
| 10.15 | | Employment Agreement, dated [removed: November 15, 2013,] [added: August 29, 2014,] by and between the Company and [removed: Howell] [added: Thomas] P. [removed: Carper(previously] [added: Hayes (previously] filed as Exhibit [removed: 10.20] [added: 10.21] to the [removed: Company's] [added: Company’s] Annual Report on Form 10-K for the fiscal year ended September [removed: 28, 2013,] [added: 27, 2014,] Commission File No. 001-14704, and incorporated herein by reference). |
| 10.16 | | Employment Agreement, dated [removed: November 12, 2013,] [added: August 29, 2014,] by and between the Company and [removed: Stephen R. Stouffer(previously] [added: Mary Oleksiuk (previously] filed as Exhibit [removed: 10.21] [added: 10.22] to the [removed: Company's] [added: Company’s] Annual Report on Form 10-K for the fiscal year ended September [removed: 28, 2013,] [added: 27, 2014,] Commission File No. 001-14704, and incorporated herein by reference). |
| [removed: 10.17] [added: 10.14] | | Employment Agreement, dated [removed: November 14, 2012,] [added: August 29, 2014,] by and between the Company and [removed: James V. Lochner] [added: Sobhana (Sally) Grimes] (previously filed as Exhibit [removed: 10.13] [added: 10.20] to the Company’s Annual Report on Form 10-K for the fiscal year ended September [removed: 29, 2012,] [added: 27, 2014,] Commission File No. 001-14704, and incorporated herein by reference). |
| [removed: 10.18] [added: 10.25] | | [added: First] Amendment to [removed: Employment Agreement, dated November 15, 2013, by and between] the [removed: Company and James V. Lochner] [added: Tyson Foods, Inc. Employee Stock Purchase Plan, effective February 1, 2013] (previously filed as Exhibit [removed: 10.12] [added: 10.26] to the Company’s Annual Report on Form 10-K for the fiscal year ended September 28, 2013, Commission File No. 001-14704, and incorporated herein by reference). |
| 10.19 | | Employment Agreement, dated August [removed: 29, 2014,] [added: 28, 2015,] by and between the Company and [removed: Andrew P. Callahan.] [added: Curt T. Calaway.] |
| [removed: 10.20] [added: 10.18] | | Employment Agreement, dated August 29, [removed: 2014,] [added: 2013,] by and between the Company and [removed: Sobhana (Sally) Grimes.] [added: Michael V. Roetzel.] |
| [removed: 10.21] [added: 10.17] | | Employment Agreement, dated [removed: August 29, 2014,] [added: November 17, 2015,] by and between the Company and [removed: Thomas P. Hayes.] [added: Donald J. Smith.] |
| [removed: 10.23] [added: 10.20] | | Form of Retention Award Letter Agreement, dated August 29, 2014, by and between the Company and Andrew Callahan, Sobhana (Sally) Grimes, Thomas Hayes and Mary [removed: Oleksiuk.] [added: Oleksiuk (previously filed as Exhibit 10.23 to the Company’s Annual Report on Form 10-K for the fiscal year ended September 27, 2014, Commission File No. 001-14704, and incorporated herein by reference).] |
| [removed: 10.24] [added: 10.22] | | [removed: Indemnity Agreement, dated as] [added: Form] of [removed: September 28, 2007,] [added: Indemnity Agreement] between [removed: the Company and John] Tyson [added: Foods, Inc. and its directors and certain executive officers] (previously filed as Exhibit [removed: 10.2] [added: 10(t)] to the Company’s [removed: Current] [added: Annual] Report on Form [removed: 8-K filed] [added: 10-K for the fiscal year ended] September [removed: 28, 2007,] [added: 30, 1995,] Commission File No. [removed: 001-14704,] [added: 0-3400,] and incorporated herein by reference). |
| [removed: 10.25] [added: 10.26] | | [removed: Form] [added: Amended and Restated Executive Savings Plan] of [removed: Indemnity Agreement between] Tyson Foods, Inc. [removed: and its directors and certain executive officers] [added: effective January 1, 2013] (previously filed as Exhibit [removed: 10(t)] [added: 10.27] to the Company’s Annual Report on Form 10-K for the fiscal year ended September [removed: 30, 1995,] [added: 28, 2013,] Commission File No. [removed: 0-3400,] [added: 001-14704,] and incorporated herein by reference). |
Consolidated Statements of Comprehensive Income for the three years ended October 3, 2015
Consolidated Balance Sheets at October 3, 2015, and September 27, 2014
Consolidated Statements of Shareholders’ Equity for the three years ended October 3, 2015
Consolidated Statements of Cash Flows for the three years ended October 3, 2015
(2) Consolidated Financial Statement Schedules
(3) Exhibits required by Item 601 of Regulation S-K
Report on Form 10-K.
| | | (Principal Accounting Officer) | | |
| /s/ Mikel A. Durham | | Director | | November 23, 2015 |
| Mikel A. Durham | | | | |
| 2015 | | $ | 34 | | | $ | 1 | | | $ | — | | | $ | (8 | ) | | $ | 27 | |
| 2015 | | $ | 7 | | | $ | 99 | | | $ | — | | | $ | (48 | ) | | $ | 58 | |
| 2015 | | $ | 51 | | | $ | 21 | | | $ | — | | | $ | (4 | ) | | $ | 68 | |
Consolidated Statements of Comprehensive Income
for the three years ended September 27, 2014
Consolidated Balance Sheets at
September 27, 2014, and September 28, 2013
Consolidated Statements of Shareholders’ Equity
for the three years ended September 27, 2014
Consolidated Statements of Cash Flows
for the three years ended September 27, 2014
Accounts for the three years ended September 27, 2014
| | | |
| | | |
| | | |
| | | |
| 4.25 | | Form of 6.13% Notes due 2032 issued pursuant to the Sara Lee Indenture. |
| 10.22 | | Employment Agreement, dated August 29, 2014, by and between the Company and Mary Oleksiuk. |
| 10.55 | | Tyson Foods, Inc. Severance Pay Plan for Contracted Employees, effective October 31, 2012 (previously filed as Exhibit 10.54 to the Company's Annual Report on Form 10-K for the fiscal year ended September 29, 2012, Commission File No. 001-14704, and incorporated herein by reference). |
| 10.57 | | First Amendment to the Company's Supplemental Executive Retirement and Life Insurance Premium Plan as Amended and Restated as of November 14, 2014. |
| | | | | |
| | | | | |
| /s/ Kathleen M. Bader | | Director | | November 17, 2014 |
| Kathleen M. Bader | | | | |
| /s/ Albert C. Zapanta | | Director | | November 17, 2014 |
| Albert C. Zapanta | | | | |
| 2012 | | 31 | | | | 7 | | | | — | | | | (5 | | ) | | 33 | | |
| 2012 | | 6 | | | | 52 | | | | — | | | | (34 | | ) | | 24 | | |
| 2012 | | 92 | | | | 16 | | | | — | | | | (30 | | ) | | 78 | | |
An excerpt. Shown here: 40 of 89 rewritten, all 13 added and all 26 removed. The counts are complete. For every sentence, read Item 15. EXHIBITS, FINANCIAL STATEMENT SCHEDULES in the FY2015 filing and the FY2014 filing.