 filings.tools
Ulta Beauty (ULTA) 10-K risk factor changes: FY2019 vs FY2018
The 2019-02-02 10-K against the 2018-02-03 one, compared heading by heading and sentence by sentence. One of these filings carries no fiscal year tag, so its year is the calendar year of the period end.
Item 1A35 rewritten6 added9 removed256 unchanged
All filing items687 rewritten376 added317 removed1,339 unchanged
Summary
counted, not written
- Item 1A headings could not be compared: only 0 carried over between the two years, which usually means one filing was read wrongly, so none is reported as new or removed.
- Sentence by sentence, 376 added, 317 removed, 687 rewritten and 1,339 unchanged across 19 items that differ.
Sentences by item
22 items, with every count and a link to each item that changed
Underlined words on a shaded ground are new in FY2019; struck-through words were in FY2018. Sentences that are wholly new or wholly gone are labelled rather than marked.
Item 1A. Risk Factors
35 rewritten, 6 added, 9 removed, 256 unchanged
[added: Additionally, volatility and disruption to the capital and credit markets in the recent global] recession had a significant, adverse impact on global economic conditions, resulting in recessionary pressures and declines in consumer confidence and economic growth, which, in turn, led to declines in consumer spending.
[removed: Reduced consumer spending could cause changes in customer order patterns and changes in the level of merchandise purchased] by our customers, and may signify a reset of consumer spending habits, all of which may adversely affect our business, financial condition, profitability, and cash flows.
Despite the security measures we have in place and continual vigilance in regard to the protection of sensitive information, our systems and those of our [removed: third party] [added: third-party] service providers may be vulnerable to security breaches, attacks by hackers, acts of vandalism, computer viruses, misplaced or lost data, human errors, or other similar events.
For more information on our quarterly results of operations, see Note [removed: 13] [added: 17] to our consolidated financial statements, “Selected quarterly financial data (unaudited),” and Item 7, “Management’s Discussion and Analysis of Financial Condition and Results of Operations.”
The capacity of our distribution and order fulfillment infrastructure and the performance of our [removed: newly opened and to be opened] distribution centers may not be adequate to support our historical growth and expected future growth plans, which could prevent the successful implementation of these plans or cause us to incur excess costs to expand this infrastructure, which could have a material adverse effect on our business, financial condition, profitability, and cash flows.
In 2014, we began a multi-year supply chain project, which focused on, among other things, adding capacity and system improvements to support expanded [removed: omni-channel] [added: omnichannel] capabilities.
In order to support our historical and expected future growth and to maintain the efficient operation of our business, it is likely additional distribution centers [added: or fast fulfillment centers (e-commerce only)] will be [removed: added in the future.]
Our failure to effectively upgrade and expand our distribution capacity on a timely basis to keep pace with our anticipated growth in [added: stores and the performance of our distribution centers could have a material adverse effect on our business, financial condition, profitability, and cash flows.]
We are a retailer carrying over [removed: 20,000] [added: 25,000] beauty products that change on a regular basis in response to beauty trends, which makes the success of our operations particularly vulnerable to disruptions in our distribution infrastructure.
As a result, we encounter risks and difficulties frequently experienced by internet-based businesses, including risks related to our ability to attract and retain customers on a cost-effective basis and our ability to operate, support, expand, and develop our internet operations, [removed: website] [added: website, mobile applications] and software, and other related operational systems.
Although we believe that our [added: omnichannel] participation [removed: in both e-commerce and physical store sales] is a distinct advantage for us due to synergies and the potential for new customers, supporting product offerings through [removed: both of] these channels could create issues that have the potential to adversely affect our results of operations.
For example, if our e-commerce platform successfully grows, it may do so in part by attracting existing guests, rather than new guests, who choose to purchase products from us online [added: or through our mobile applications] rather than from our physical stores, thereby reducing the financial performance of our stores.
In addition, offering different products through each channel could cause conflicts and cause some of our current or potential internet [added: or mobile] customers to consider competing distributors of beauty products.
Offering products through our internet channel [added: or through our mobile applications] could also cause some of our current or potential vendors to consider competing internet [added: or mobile] offerings of their products either on their own or through competing distributors.
As we continue to grow our e-commerce platform, the impact of attracting existing rather than new guests, conflicts between product offerings online [added: or through our mobile applications] and through our stores, and opening up our channels to increased competition from pure-play e-commerce companies could have a material adverse effect on our business, financial condition, profitability, and cash flows.
There can be no assurance that we will be successful in implementing our growth plans or long-range strategic imperatives, [added: including our Efficiencies for Growth cost optimization program,] and our failure to do so could have a material adverse effect on our business, financial condition, profitability, and cash flows.
The Ulta.com website [removed: serves] [added: and our mobile applications serve] as an effective extension of Ulta Beauty’s marketing and prospecting strategies (beyond catalogs, newspaper inserts, and national advertising) by exposing potential new customers to the Ulta Beauty brand, product offerings, and enhanced content.
As the importance of our [removed: website] [added: website, mobile applications,] and e-commerce operations to our business grows, we are increasingly vulnerable to [removed: website] downtime and other technical failures.
[removed: Our future operations] and performance will be subject to these factors and these factors could have a material adverse effect on our business, financial condition, profitability, and cash flows or may require us to modify our current business practices and incur increased costs.
[added: We may] respond by increasing markdowns, initiating marketing promotions, or transferring product to other stores to reduce excess inventory, which would further decrease our gross profits and net income.
During fiscal [removed: 2017] [added: 2018] and fiscal [removed: 2016,] [added: 2017,] merchandise supplied to Ulta Beauty by our top ten vendor partners accounted for approximately [added: 62% and] 64% of our net [removed: sales.][added: sales, respectively.]
Our principal intellectual property rights include registered and common law trademarks on [removed: our name,] [added: “The Possibilities are Beautiful.®,”] “Ulta Beauty,” “Ulta,” [added: and other marks incorporating our name and] “All Things Beauty.
All in One [removed: Place.TM”] [added: Place®,”] and [removed: other marks incorporating our name,] [added: “21 Days of Beauty®,”] copyrights in our website [added: and mobile applications] content, rights to our domain name www.ulta.com, and trade secrets and know-how with respect to our Ulta Beauty branded product formulations, product sourcing, sales and [removed: marketing,] [added: marketing] and other aspects of our [removed: business.][added: business, and our digital innovations such as try-on applications and artificial intelligence.]
In addition, sanctions under various laws may include seizure of products, injunctions against future shipment of products, restitution [removed: and disgorgement of profits, operating restrictions, and criminal prosecution.]
If we, our vendors, or the manufacturers of our Ulta Beauty branded products fail to comply with those regulations, we could become subject to [added: significant penalties, claims, or product recalls, which could harm our results of operations or our ability to conduct our business.]
There has been a substantial increase in the use of social media platforms, including blogs, social media websites, and other forms of internet-based [added: and mobile] communications, which allow individuals access to a broad audience of consumers and other interested persons.
Customers value readily available information and often act on such information without further investigation and without regard to its [removed: accuracy.][added: accuracy or source.]
From time to time, we are subject to [added: litigation, including potential class action and single-plaintiff] litigation and other legal or regulatory proceedings or claims in the ordinary course of our business operations regarding, but not limited to, employment matters, [added: consumer claims,] security of consumer and employee personal information, contractual relations with suppliers, marketing and infringement of trademarks, and other intellectual property rights.
Litigation to defend ourselves against claims by third parties, or to enforce any rights that we may have against third parties, may be necessary, which could [added: absorb significant management time,] result in substantial costs and diversion of our resources, causing a material adverse effect on our business, financial condition, profitability, and cash flows.
[added: Any resolution of litigation or other legal or] regulatory proceedings or claims could materially adversely impact our business, financial condition, profitability, and cash flows.
[removed: In addition to infringement claims against us, we may become a party to other patent or trademark litigation and other proceedings, including interference] proceedings [removed: declared by the United States Patent and Trademark Office (USPTO) proceedings] before the USPTO’s Trademark Trial and Appeal Board and opposition proceedings in the European Patent Office, regarding intellectual property rights with respect to [added: our technologies,] products purchased from third-party vendors or our Ulta Beauty branded [removed: products and technology.][added: products.]
As we grow the number of our stores in new [removed: cities and states,] [added: locations,] we are subject to local building codes in an increasing number of local jurisdictions.
Ensuring compliance with local zoning and real estate land use restrictions across numerous jurisdictions is increasingly challenging as we grow the number of our stores in new [removed: cities and states.][added: locations.]
[added: Moreover, our landlords have occasionally been unable, due to the requirements of local zoning laws, to obtain in a] timely manner a certificate of occupancy with respect to the shell of our stores and/or the larger shopping centers and/or common areas (which certificate of occupancy is required by local building codes for us to open our store), causing us in [removed: some instances to delay store openings.]
[added: We may] affect repurchases under any stock repurchase program from time to time in the open market, in privately negotiated transactions or otherwise, including accelerated stock repurchase arrangements.
Reduced consumer spending could cause changes in customer order patterns and changes in the level of merchandise purchased
added in the future.
Our future operations
In addition to infringement claims against us, we may become a party to other patent or trademark litigation and other proceedings, including interference proceedings declared by the United States Patent and Trademark Office (USPTO)
and disgorgement of profits, operating restrictions, and criminal prosecution.
some instances to delay store openings.
Additionally, volatility and disruption to the capital and credit markets in the recent global
We opened our fourth and fifth distribution centers in 2015 and 2016, respectively, and expect to open our sixth distribution center in 2018.
stores and the performance of our newly opened distribution centers could have a material adverse effect on our business, financial condition, profitability, and cash flows.
We may
significant penalties, claims, or product recalls, which could harm our results of operations or our ability to conduct our business.
An unfavorable resolution of litigation or other legal or
Moreover, our landlords have occasionally been unable, due to the requirements of local zoning laws, to obtain in a
There can be no assurance that we will declare dividends in the future.
Any dividend payments will be within the discretion of our Board of Directors and will depend on, among other things, our financial condition, results of operations, capital requirements, capital expenditure requirements, contractual restrictions, anticipated cash needs, provisions of applicable law, and other factors that our Board of Directors may deem relevant.
Item 7. Management’s Discussion and Analysis of Financial Condition and Results of Operations
133 rewritten, 52 added, 52 removed, 234 unchanged
We [removed: focus on providing affordable indulgence to our guests by combining] [added: provide] unmatched product breadth, value, and convenience [removed: with] [added: in] a distinctive specialty retail [removed: environment and experience.][added: environment.]
Key aspects of our business include: our ability to offer our guests a unique combination of more than [removed: 20,000] [added: 25,000] beauty products [added: from] across the categories of prestige and mass cosmetics, fragrance, haircare, skincare, bath and body products, and salon styling tools, as well as a full-service salon in every store featuring hair, skin, and brow services; our focus on delivering a compelling value proposition to our guests across all of our product categories; and convenience, as our stores are predominantly located in convenient, high-traffic locations such as power centers.
We believe that the expanding U.S. beauty products and salon services industry, the shift in distribution channel of prestige beauty products from department stores to specialty [removed: retail stores, coupled with Ulta Beauty’s competitive strengths, positions us to capture additional market share in the industry.]
Over the long term, our growth strategy is to increase total net sales through increases in our comparable sales, opening new stores, and increasing [removed: e-commerce sales.][added: omnichannel capabilities.]
Operating profit is expected to increase as a result of our ability to expand merchandise margin and leverage our fixed store costs with comparable sales increases and operating efficiencies offset by incremental investments in people, systems, and supply chain required to support a [removed: 1,400] [added: 1,500] to 1,700 store chain [added: in the U.S.] with successful e-commerce and competitive [removed: omni-channel] [added: omnichannel] capabilities.
E-commerce [added: merchandise] sales are recognized based [removed: on delivery] [added: upon shipment] of merchandise to the [removed: guest.][added: guest based on meeting the transfer of control criteria.]
Salon service revenue is recognized at the time the service is [removed: provided.][added: provided to the guest.]
| | · | | the cost of merchandise [removed: sold (retail stores and e-commerce),] [added: sold,] including substantially all vendor allowances, which are treated as a reduction of merchandise costs; |
| | · | | salon services payroll and benefits; [added: and] |
[removed: | | · | | customer loyalty] [added: Loyalty] program [removed: expense; and |]
The Company’s fiscal years ended February [added: 2, 2019 (fiscal 2018), February] 3, [removed: 2018,] [added: 2018 (fiscal 2017), and] January 28, 2017 [removed: and January 30, 2016] [added: (fiscal 2016)] were [removed: 53,] 52, [removed: and 52 week periods, respectively, and are hereafter referred to as fiscal 2017, fiscal 2016,] [added: 53,] and [removed: fiscal 2015.][added: 52-week years, respectively.]
| | | [removed: |] Fiscal year ended | | | | | | | |
| | | [removed: |] February [removed: 3,] [added: 2,] | | | [removed: January 28,] [added: February 3,] | | | January [removed: 30,] [added: 28,] | |
| (Dollars in thousands) | | [removed: | 2018] [added: 2019] | | | [removed: 2017] [added: 2018] | | | [removed: 2016] [added: 2017] | |
| Net sales | | [removed: |] $ | [removed: 5,884,506] [added: 6,716,615] | | $ | [removed: 4,854,737] [added: 5,884,506] | | $ | [removed: 3,924,116] [added: 4,854,737] |
| Cost of sales | | | [removed: | 3,787,697] [added: 4,307,304] | | | [removed: 3,107,508] [added: 3,787,697] | | | [removed: 2,539,783] [added: 3,107,508] |
| Gross profit | | | [removed: | 2,096,809] [added: 2,409,311] | | | [removed: 1,747,229] [added: 2,096,809] | | | [removed: 1,384,333] [added: 1,747,229] |
| Selling, general and administrative expenses | | | [removed: | 1,287,232] [added: 1,535,464] | | | [removed: 1,073,834] [added: 1,287,232] | | | [removed: 863,354] [added: 1,073,834] |
| Pre-opening expenses | | | [removed: | 24,286] [added: 19,767] | | | [removed: 18,571] [added: 24,286] | | | [removed: 14,682] [added: 18,571] |
| Operating income | | | [removed: | 785,291] [added: 854,080] | | | [removed: 654,824] [added: 785,291] | | | [removed: 506,297] [added: 654,824] |
| Interest income, net | | | [removed: | (1,568)] [added: (5,061)] | | | [removed: (890)] [added: (1,568)] | | | [removed: (1,143)] [added: (890)] |
| Income before income taxes | | | [removed: | 786,859] [added: 859,141] | | | [removed: 655,714] [added: 786,859] | | | [removed: 507,440] [added: 655,714] |
| Income tax expense | | | [removed: | 231,625] [added: 200,582] | | | [removed: 245,954] [added: 231,625] | | | [removed: 187,432] [added: 245,954] |
| Net income | | [removed: |] $ | [removed: 555,234] [added: 658,559] | | $ | [removed: 409,760] [added: 555,234] | | $ | [removed: 320,008] [added: 409,760] |
| Other operating data: | | | | | | | | | | [removed: |]
| Number of stores end of period | | | [removed: | 1,074] [added: 1,174] | | | [removed: 974] [added: 1,074] | | | [removed: 874] [added: 974] |
| Comparable sales increase: | | | | | | | | | | [removed: |]
| Retail stores and salon services comparable sales | | | [removed: | 7.1%] [added: 5.1%] | | | [removed: 13.4%] [added: 7.1%] | | | [removed: 10.0%] [added: 13.4%] |
| E-commerce comparable sales | | | [removed: | 59.9%] [added: 35.4%] | | | [removed: 56.2%] [added: 59.9%] | | | [removed: 47.5%] [added: 56.2%] |
| Total comparable sales increase | | | [removed: | 11.0%] [added: 8.1%] | | | [removed: 15.8%] [added: 11.0%] | | | [removed: 11.8%] [added: 15.8%] |
| (Percentage of net sales) | | [removed: | 2018] [added: 2019] | | | [removed: 2017] [added: 2018] | | | [removed: 2016] [added: 2017] | |
| Net sales | | | [removed: |] 100.0% | | | 100.0% | | | 100.0% |
| Cost of sales | | | [removed: | 64.4%] [added: 64.1%] | | | [removed: 64.0%] [added: 64.4%] | | | [removed: 64.7%] [added: 64.0%] |
| Gross profit | | | [removed: | 35.6%] [added: 35.9%] | | | [removed: 36.0%] [added: 35.6%] | | | [removed: 35.3%] [added: 36.0%] |
| Selling, general and administrative expenses | | | [removed: | 21.9%] [added: 22.9%] | | | [removed: 22.1%] [added: 21.9%] | | | [removed: 22.0%] [added: 22.1%] |
| Pre-opening expenses | | | [removed: | 0.4%] [added: 0.3%] | | | 0.4% | | | 0.4% |
| Operating income | | | [removed: | 13.3%] [added: 12.7%] | | | [removed: 13.5%] [added: 13.3%] | | | [removed: 12.9%] [added: 13.5%] |
| Interest income, net | | | [removed: | 0.0%] [added: 0.1%] | | | 0.0% | | | 0.0% |
| Income before income taxes | | | [removed: | 13.3%] [added: 12.8%] | | | [removed: 13.5%] [added: 13.3%] | | | [removed: 12.9%] [added: 13.5%] |
| Income tax expense | | | [removed: | 3.9%] [added: 3.0%] | | | [removed: 5.1%] [added: 3.9%] | | | [removed: 4.8%] [added: 5.1%] |
We developed a unique specialty retail concept that offers a broad range of brands and price points, a compelling value proposition, and a convenient and welcoming shopping environment.
We define our target consumer as a beauty enthusiast, a consumer who is passionate about the beauty category and has high expectations for the shopping experience.
We estimate the beauty enthusiasts represents approximately 57% of shoppers and 77% of spend in the U.S. beauty category.
The continued growth of our business and any future increases in net sales, net income, and cash flows is dependent on our ability to execute our strategic imperatives: 1) drive growth across beauty enthusiast consumer groups, 2) deepen Ulta Beauty love and loyalty, 3) deliver a one of a kind, world class beauty assortment, 4) lead the in-store and beauty services experience transformation, 5) reinvent beauty digital engagement, 6) deliver operational excellence and drive efficiencies, and 7) invest in talent that drives a winning culture.
retail stores, coupled with Ulta Beauty’s competitive strengths, positions us to capture additional market share in the industry.
The Company has one reportable segment, which includes retail stores, salon services, and e-commerce.
Shipping and handling are treated as costs to fulfill the contract, and as a result, any fees received from guests are included in the transaction price allocated to the performance obligation of providing goods with a corresponding amount accrued within cost of sales for amounts paid to applicable carriers.
We provide refunds for merchandise returns within 60 days from the original purchase date.
State sales taxes are presented on a net basis as we consider our self a pass-through conduit for collecting and remitting state sales tax.
Other revenue sources include the private label credit card and co-branded credit card programs, as well as deferred revenue related to the loyalty program and gift card breakage.
Comparable sales include retail sales, salon services, and e-commerce.
As of February 2, 2019, we operated 1,174 stores across 50 states.
| | | | | | | | | | |
| --- | --- | --- | --- | --- | --- | --- | --- | --- | --- |
| | | | | | | | | | |
| | | | | | | | | | |
| | | | | | | | | | |
| --- | --- | --- | --- | --- | --- | --- | --- | --- | --- |
| | | Fiscal year ended | | | | | | | |
| | | February 2, | | | February 3, | | | January 28, | |
| | | | | | | | | | |
Net sales increased $832.1 million, or 14.1%, to $6,716.6 million in fiscal 2018 compared to $5,884.5 million in fiscal 2017.
E-commerce sales increased $183.5 million, or 32.3%, to $752.2 million compared to $568.7 million in fiscal 2017.
Other revenue increased $48.9 million in fiscal 2018.
Gross profit increased $312.5 million, or 14.9%, to $2,409.3 million in fiscal 2018, compared to $2,096.8 million in fiscal 2017.
The impact of new revenue recognition accounting drove 55 basis points of leverage.
| | · | | 55 basis points deleverage attributed to category and channel mix shifts and investments in our salon services and supply chain operation, partially offset by; |
Selling, general and administrative (SG&A) expenses increased $248.2 million, or 19.3%, to $1,535.5 million in fiscal 2018 compared to $1,287.2 million in fiscal 2017.
The impact of new revenue recognition accounting drove 80 basis points of deleverage.
| | · | | 10 basis points leverage in corporate overhead due to the impact of higher sales volume. |
Pre-opening expenses decreased $4.5 million, or 18.6%, to $19.8 million in fiscal 2018 compared to $24.3 million in fiscal 2017.
We did not have any outstanding borrowings on our credit facility as of February 2, 2019 and February 3, 2018.
The lower tax rate is primarily due to tax reform.
Net income increased $103.3 million, or 18.6%, to $658.6 million in fiscal 2018 compared to $555.2 million in fiscal 2017.
The sales for the 53rd week of fiscal 2017 were approximately $108.8 million.
| | | | February 2, | | | February 3, | | | January 28, | |
| (In thousands) | | | 2019 | | | 2018 | | | 2017 | |
| | · | | approximately $64 million due to the opening of the Company’s distribution center in Fresno, California, partially offset by; |
| | · | | approximately $48 million of productivity benefits from supply chain investments in new systems and merchandise planning tools. |
Capital expenditures decreased in fiscal 2018 compared to fiscal 2017 mainly due to lower cost in the new store program, less store refreshes, and total reduction in spend on information technology systems.
We developed a unique specialty retail concept that offers All Things Beauty.
All in One Place.TM, a compelling value proposition, and a convenient and welcoming shopping environment.
The continued growth of our business and any future increases in net sales, net income, and cash flows is dependent on our ability to execute our strategic imperatives: 1) acquire new guests and deepen loyalty with existing guests, 2) differentiate by delivering a distinctive and personalized guest experience across all channels, 3) offer relevant,
innovative, and often exclusive products that excite our guests, 4) deliver exceptional services in three core areas: hair, skin health, and brows, 5) grow stores and e-commerce to reach and serve more guests, 6) invest in infrastructure to support our guest experience and growth, and capture scale efficiencies, and 7) attract and retain talent that drives a winning culture.
We have determined the operating segments on the same basis that we use to internally evaluate performance.
We have combined our three operating segments: retail stores, salon services, and e-commerce, into one reportable segment because they have a similar class of consumers, economic characteristics, nature of products, and distribution methods.
Net sales include retail store and e-commerce merchandise sales as well as salon service revenue.
Comparable sales include the Company’s e-commerce business.
| --- | --- | --- | --- |
| | · | | credit card program incentives; |
| | · | | gift card breakage; |
As of February 3, 2018, we operated 1,074 stores across 48 states and the District of Columbia.
| | | | | | | | | | | |
| --- | --- | --- | --- | --- | --- | --- | --- | --- | --- | --- |
to $345.3 million in fiscal 2016.
See Note 6, “Income taxes,” for further information.
We expect our fiscal 2018 effective tax rate to be significantly lower than our fiscal 2017 effective tax rate as a result of the reduction of the federal corporate income tax rate.
Net sales increased $930.6 million, or 23.7%, to $4,854.7 million in fiscal 2016 compared to $3,924.1 million in fiscal 2015.
E-commerce sales increased $124.2 million, or 56.2%, to $345.3 million compared to $221.1 million in fiscal 2015.
Gross profit increased $362.9 million, or 26.2%, to $1,747.2 million in fiscal 2016, compared to $1,384.3 million, in fiscal 2015.
| | · | | 30 basis points improvement in merchandise margins driven by our marketing and merchandising strategies, including a reduction in year-over-year promotional levels; |
| | · | | 30 basis points of planned deleverage related to supply chain investments. |
SG&A expenses increased $210.5 million, or 24.4%, to $1,073.8 million in fiscal 2016 compared to $863.4 million in fiscal 2015.
| | · | | 20 basis points deleverage in corporate overhead due to higher variable compensation, depreciation expense and impairment charges related to the closure of stores in Chicago, Illinois and Denham Springs, Louisiana, partly offset by; |
| | · | | 40 basis points of leverage in marketing expense attributed to strong sales growth. |
Pre-opening expenses increased $3.9 million, or 26.5%, to $18.6 million in fiscal 2016 compared to $14.7 million in fiscal 2015.
We did not utilize our credit facility during fiscal 2016 or 2015.
The fiscal 2015 tax rate included benefits from lower state taxes that did not recur in fiscal 2016.
Net income increased $89.8 million, or 28.0%, to $409.8 million in fiscal 2016 compared to $320.0 million in fiscal 2015.
| | · | | approximately $33 million due to the ramp up of the Company’s distribution center in Dallas, Texas; and |
| | · | | approximately $22 million due to increased sales, new brand additions, and incremental inventory for in-store prestige brands. |
Capital expenditures increased in fiscal 2017 compared to fiscal 2016 mainly due to our new store program, store refreshes (prestige boutiques and related in-store merchandising upgrades), and information systems investments.
| (In millions) | | Budget | | | 2017 | | | 2016 | | | 2015 | |
| Operating lease obligations (1) | | $ | 2,234,521 | | $ | 313,335 | | $ | 613,115 | | $ | 537,912 | | $ | 770,159 |
| Purchase obligations | | | 19,002 | | | 19,002 | | | \- | | | \- | | | \- |
| Total (2) | | $ | 2,253,523 | | $ | 332,337 | | $ | 613,115 | | $ | 537,912 | | $ | 770,159 |
Customer loyalty program
We accrue the cost of anticipated redemptions related to this program at the time of the initial purchase based on historical experience.
Share-based compensation
We account for share-based compensation in accordance with the Accounting Standards Codification (ASC) rules for stock compensation.
An excerpt. Shown here: 40 of 133 rewritten, 40 of 52 added and 40 of 52 removed. The counts are complete. For every sentence, read Item 7. Management’s Discussion and Analysis of Financial Condition and Results of Operations in the FY2019 filing and the FY2018 filing.
Item 7A. Quantitative and Qualitative Disclosures about Market Risk
2 rewritten, 0 added, 1 removed, 5 unchanged
Interest rate [removed: sensitivity][added: risk]
We did not have any outstanding borrowings on our credit facility as of February [added: 2, 2019, February] 3, 2018, [removed: January 28, 2017,] or January [removed: 30, 2016.][added: 28, 2017.]
Interest income from cash equivalents and short-term investments with maturities of twelve months or less from the date of purchase is partially offset by interest expense, which represents interest from borrowings and various fees associated with the credit facility.
Item 1. Business
87 rewritten, 47 added, 49 removed, 150 unchanged
[removed: All in One Place.™] Our guests can satisfy all of their beauty needs at Ulta Beauty.
[removed: Our stores and website offer] [added: A typical Ulta Beauty store carries] more than [removed: 20,000] [added: 25,000] products from approximately 500 well-established and emerging beauty brands across all categories and price points, including Ulta Beauty’s own private label, the Ulta Beauty [added: Collection.]
Our bright and open store environment [removed: encourages] [added: and easy to shop website and mobile applications encourage] our guests to enjoy discovering new products and services.
We also offer a full-service salon in every store featuring hair, skin, [added: makeup,] and brow services.
[removed: Our] Value Proposition.
As of February [removed: 3, 2018,] [added: 2, 2019,] we operated [removed: 1,074] [added: 1,174] retail stores across [removed: 48 states and the District of Columbia,] [added: 50 states,] as well as an e-commerce [removed: website.][added: website and mobile applications.]
[removed: We have sharpened] [added: As we sharpen] our brand positioning, [removed: and] [added: we] are increasing awareness of the Ulta Beauty brand by communicating our brand differentiation through broad scale advertising.
We [removed: continue to] leverage [removed: our direct mail advertising, catalogs, and newspaper inserts to communicate with our guests, as well as] [added: a wide range of] marketing tactics [removed: such as] [added: including] digital, television, [removed: in-store events,] [added: direct mail, social media,] and public relations to drive brand engagement, deepen the guest connection to Ulta Beauty, and strengthen our authority in the beauty category.
We have [removed: approximately 28] [added: more than 31.8] million active Ulta Beauty guests enrolled in our Ultamate Rewards loyalty program.
Loyalty member transactions represent [removed: more than 90%] [added: over 95%] of our annual total net sales, and [removed: the transaction] [added: our] data demonstrates that loyalty members shop with higher frequency and spend more per visit as compared to non-members.
The Ulta Beauty guest experience today is differentiated by our broad array of categories, brands and price points, high quality [removed: services] [added: services,] and friendly, [removed: well-trained, non-commissioned] [added: well-trained] associates.
We believe our broad selection of merchandise across categories, price points, and brands [removed: offers] [added: offer] a unique shopping experience for our guests.
While the products we sell can be found in department stores, specialty stores, salons, drug stores, mass merchandisers, and pure-play e-commerce companies, we offer approximately 500 brands [removed: in one retail format] so that our guests can find everything they need in one shopping trip.
[removed: All in One Place.™ We plan to establish] Ulta Beauty [removed: as] [added: is] a leading salon authority [removed: by providing] [added: that provides] high quality and consistent services from our licensed stylists, with a focus on [removed: the key pillars of] hair, [removed: skin health,] [added: skin, makeup,] and brows.
Salon guests shop more frequently and spend [added: almost] three times more than non-salon guests based on [added: our] loyalty guest data.
We believe focusing on guest satisfaction, increasing effectiveness of promotions, and optimizing [removed: staffing] [added: staffing, scheduling,] and [removed: scheduling] [added: training] will make our services business an even stronger differentiator in our stores.
Our real estate vision is to make Ulta Beauty accessible and convenient to more consumers across a variety of markets, a key part of how we plan to [removed: double] [added: expand] our market share over [removed: the next several years.][added: time.]
We believe that over the long term, we have the potential to grow our store base to between [removed: 1,400] [added: 1,500] to 1,700 Ulta Beauty stores in the United States.
[removed: We have a solid track record of executing an aggressive store growth program and a] [added: Our] rigorous analytical approach to site selection [removed: that] has translated into a high performing real estate portfolio.
We expect to open approximately [removed: 100] [added: 70 to 80] new stores per year for the next several years.
In addition to store expansion, we expect to significantly grow our [removed: e-commerce sales.][added: omnichannel capabilities.]
Our e-commerce platform has two key roles: generating direct channel sales and [removed: profits, while] [added: profits by] communicating with our guests in an interactive, enjoyable way that reinforces the Ulta Beauty brand [added: and] driving traffic to our stores, website, and native applications.
Our [removed: omni-channel] [added: omnichannel] guests are extremely valuable, spending nearly three times as much as retail only guests.
We continue to develop and add new website [added: and mobile] features and functionality, marketing programs, product assortment, new brands, and [removed: omni-channel] [added: omnichannel] integration points.
[removed: Attract and retain] [added: Invest in] talent that drives a winning culture.
This market represents approximately [removed: $142] [added: $145] billion in sales, according to Euromonitor International and IBIS World Inc. The approximately [removed: $87] [added: $86] billion beauty products industry includes cosmetics, haircare, fragrance, bath and body, skincare, salon styling tools, and [removed: other toiletries.]
The approximately [removed: $55] [added: $59] billion salon services industry consists of hair, skin, and nail services.
The average investment required to open a new Ulta Beauty store is approximately [removed: $1.6] [added: $1.4] million, which includes capital investments, net of landlord contributions, [removed: pre-opening expenses, and initial inventory, net of payables.][added: pre-]
[removed: Our] [added: In] fiscal [removed: 2017 new store program was comprised] [added: 2018, 74%] of [removed: approximately 70%] new stores opened in existing shopping centers and [removed: 30%] [added: 26% opened] in new shopping centers.
[removed: In fiscal 2017, approximately 80% of] [added: Almost all] new stores were filling in existing markets [removed: and 20% of new stores were in] [added: compared to] new markets.
In addition to opening new stores, we also remodeled, relocated, or refreshed [removed: (prestige boutiques] [added: (in-store fixtures] and [removed: related in-store] merchandising upgrades) certain stores, as shown in the following table:
| | | February [removed: 3, 2018] [added: 2,] | | [removed: January 28, 2017] [added: February 3,] | | January [removed: 30, 2016] [added: 28,] |
| Total stores beginning of period | | [removed: 974] [added: 1,074] | | [removed: 874] [added: 974] | | [removed: 774] [added: 874] |
| Stores opened | | [removed: 102] [added: 107] | | [removed: 104] [added: 102] | | [removed: 103] [added: 104] |
| Stores closed | | [removed: (2)] [added: (7)] | | [removed: (4)] [added: (2)] | | [removed: (3)] [added: (4)] |
| Total stores end of period | | [removed: 1,074] [added: 1,174] | | [removed: 974] [added: 1,074] | | [removed: 874] [added: 974] |
| Total square footage | | [removed: 11,300,920] [added: 12,337,145] | | [removed: 10,271,184] [added: 11,300,920] | | [removed: 9,225,957] [added: 10,271,184] |
| Average square footage per store | | [removed: 10,522] [added: 10,509] | | [removed: 10,545] [added: 10,522] | | [removed: 10,556] [added: 10,545] |
| Stores remodeled | | [removed: 11] [added: 13] | | [removed: 12] [added: 11] | | [removed: 4] [added: 12] |
| Stores relocated | | [removed: 7] [added: 2] | | [removed: 2] [added: 7] | | [removed: 5] [added: 2] |
Shopping Experience.
Our stores, website, and mobile applications offer more than 25,000 products from approximately 500 well-established and emerging
We developed a unique specialty retail concept that offers a broad range of brands and price points, a compelling value proposition, and a convenient and welcoming shopping environment.
We define our target consumer as a beauty enthusiast, a consumer who is passionate about the beauty category and has high expectations for the shopping experience.
We estimate that beauty enthusiasts represent approximately 57% of shoppers and 77% of spend in the U.S. beauty category.
Drive growth across beauty enthusiast consumer groups.
We target beauty enthusiasts across multiple demographics and shopping behaviors.
With the unique needs and perspectives of our beauty enthusiast consumer groups, we have evolved how we connect with each group individually.
We believe we can drive guest acquisition across beauty enthusiast consumer groups by evolving our brand purpose and marketing mix, expanding our efforts to target specific consumer groups, and driving our leadership as a diversity forward brand.
We also plan to continue to drive brand awareness and traffic by making human connections in more innovative and meaningful ways by continuing to transform our marketing mix towards channels of the future.
Deepen Ulta Beauty love and loyalty.
We believe we can expand Ulta Beauty’s reach, relevancy, and engagement with our guests by evolving the value proposition of our Ultamate Rewards program, building strategic partnerships that create incremental value for our guests, and using our customer data to deliver personalized member experiences.
We aim to continue to innovate this
program to keep it relevant, exciting, engaging, and growing.
Our vision is to personalize messaging, communication, and experiences across every touch point: in-store, online, and through digital (including mobile) and print channels.
Deliver a one of a kind, world class beauty assortment.
Assortment is at the center of our value proposition and represents a core differentiator within the market.
We engage beauty enthusiasts to discover and play across all categories with an enticing assortment focused on innovation and leading trends, differentiation and exclusivity, and speed to market.
We continue to evolve our assortment to meet our guests’ desire for new and exclusive products.
Lead the in-store and beauty services experience transformation.
Our strategic vision is to transcend our competition by creating an immersive store experience that brings beauty to life in ways others cannot, by weaving together the best of products and services, focusing on human connection, and delivering a meaningful guest experience.
Our service offering is an important platform because it creates a means to connect more closely with our guests and to elevate their experience in our stores.
Reinvent beauty digital engagement.
Our strategic vision is to build industry leading e-commerce experiences that engage our guests through our differentiated assortment, personalization, convenience and interactive experiences.
Our omnichannel guests are extremely valuable, spending nearly three times more than retail only guests.
To increase this engagement, we have a multifaceted approach to communicate, engage, and transact across all channels and touch points.
By creating digital experiences that are visual and immersive, and seamlessly merging content and commerce, we aim to be the unmatched source of personalized beauty information and make the beauty shopping experience fun, interactive, easy, and functional.
During fiscal 2018, we extended our digital innovation capabilities by partnering with technology companies such as Spruce and Iterate, and by acquiring technology companies GlamST and QM Scientific.
Deliver operational excellence and drive efficiencies.
Our strategic vision is to manage end-to-end speed, quality, and efficiency to deliver exceptional guest experience, while leveraging efficiencies of scale to drive profit improvement.
These operating efficiencies will help us fund investments required for future growth.
Through our cost optimization program, Efficiencies For Growth, we plan to achieve cost savings in four work streams: category performance improvement, indirect procurement, end-to-end operations, and real estate.
We expect to achieve savings of $150 million to $200 million through this program over the next three years.
Our stores
As of February 2, 2019, we operated 1,174 stores across 50 states.
| | | 2019 | | 2018 | | 2017 |
opening expenses, and initial inventory, net of payables.
Omnichannel strategy
We have begun to roll out omnichannel capabilities such as “Buy Online, Pick-up in Store” and during 2018, we deployed “Store 2 Door” in all stores which provide the ability for customers to order in-store and have products delivered to their homes.
We also offer a number of products that are exclusive for a limited time or are offered in advance of our competitors.
All Things Beauty.
Collection.
We developed a unique specialty retail concept that offers All Things Beauty.
All in One Place.™, a compelling value proposition, and a convenient and welcoming shopping environment.
On January 29, 2017, we implemented a holding company reorganization pursuant to which Ulta Beauty, Inc., which was incorporated as a Delaware corporation in December 2016, became the successor to Ulta Salon, Cosmetics & Fragrance, Inc., the former publicly-traded company and now a wholly owned subsidiary of Ulta Beauty.
Acquire new guests and deepen loyalty with existing guests.
We believe there is an opportunity to use consumer insights and effective marketing tactics to acquire new guests and increase our “share of wallet” of existing guests.
In addition, we continue to leverage our loyalty program and CRM platform to drive traffic, better understand our guests’ purchasing patterns, and support new store site selection.
The customer data captured by our loyalty program, together with our CRM platform, enable customer segmentation and targeted marketing communications tailored to our guests’ unique beauty needs.
We believe our loyalty program, combined with our growing CRM capabilities, provide a significant long-term competitive advantage for Ulta Beauty.
Differentiate by delivering a distinctive and personalized guest experience across all channels.
Our opportunity is to sharpen that experience, by making it more relevant, differentiated, and personalized in-store and online.
Our store associates are the key to delivering a distinctive guest experience that is personal, informative, and fun.
To enable an elevated and engaging in-store guest experience, we are focusing on three key areas: process improvements, store and technology enhancements, and labor and staffing
solutions.
At the same time, we are improving our e-commerce guest experience to ensure it is easy and informative with content that inspires, educates, and enables sharing and social engagement.
For example, we have improved our mobile app and mobile site experience, offer a try-on app called “Glamlab” to digitally test products, and expanded our online assortment to include online only brands.
Through our loyalty and CRM capabilities, we continue to emphasize targeted communications and personalized promotions that are relevant to our guests.
Offer relevant, innovative, and often exclusive products that excite our guests.
Our vision is to be the undisputed destination for All Things Beauty.
All in One Place.™ To achieve this vision, we continue to evolve our product assortment with a focus on newness and exclusivity.
Deliver exceptional services in three core areas: hair, skin health, and brows.
Our service offerings play an important role in delivering on our brand promise to be All Things Beauty.
We provide haircare services in our full-service salons, using high quality Redken products and offering trend-right hairstyles and color.
We also offer skin services in partnership with Dermalogica in all stores and brow services through Benefit Brow Bars in most of our stores.
Grow stores and e-commerce to reach and serve more guests.
E-commerce sales represented 9.7% of total net sales in the fiscal year ended February 3, 2018, and we expect it to continue to grow as a percentage of our mix in the future.
Invest in infrastructure to support our guest experience and growth and capture scale efficiencies.
We expect to continue to grow enterprise inventory capabilities to better anticipate and respond to our guests’ demand across all channels.
This includes optimizing our distribution network, improving inventory turns by moving product faster and more frequently through all channels, and improving inventory visibility, forecast accuracy, and managing product life cycle through investments in people, process, and technology.
We also plan to invest in guest-facing labor hours, training, and tools to deliver a differentiated and personalized guest experience.
We expect to capture operational
efficiencies in new enterprise inventory capabilities to help fund investments in additional store labor and other in-store technologies.
We will also pursue opportunities to optimize our marketing spend to maximize effectiveness.
Finally, we plan to drive scale and cost efficiencies across the enterprise.
Retail stores
As of February 3, 2018, we operated 1,074 stores in 48 states and the District of Columbia.
We also have an internal elite artistic team that consists of 12 stylists and six pro team members.
E-commerce
We offer more than 20,000 beauty products from hundreds of brands.
An excerpt. Shown here: 40 of 87 rewritten, 40 of 47 added and 40 of 49 removed. The counts are complete. For every sentence, read Item 1. Business in the FY2019 filing and the FY2018 filing.
Item 3. Legal Proceedings
1 rewritten, 0 added, 0 removed, 0 unchanged
See Note [removed: 4] [added: 8] to our consolidated financial statements, “Commitments and contingencies - General litigation,” for information on legal proceedings.
Cover and table of contents
26 rewritten, 6 added, 5 removed, 85 unchanged
For the fiscal year ended February [removed: 3, 2018][added: 2, 2019]
Indicate by check mark whether the registrant has submitted electronically [removed: and posted on its corporate Web site, if any,] every Interactive Data File required to be submitted [removed: and posted] pursuant to Rule 405 of Regulation S-T (§ 232.405 of this chapter) during the preceding 12 months (or for such shorter period that the registrant was required to submit [removed: and post] such files).
See definitions of “large accelerated filer,” “accelerated filer,” “smaller reporting company,” and “emerging growth company” in Rule 12b‑2 of the Exchange [removed: Act.][added: Act.:]
| Non-accelerated filer ☐ [removed: (Do not check if a smaller reporting company)] | | Smaller reporting company ☐ | Emerging growth company ☐ |
Indicate by check mark whether the registrant is a shell company (as defined in Rule 12b‑2 of the [added: Exchange] Act).
The aggregate market value of the voting stock held by non-affiliates of the registrant, based upon the closing sale price of the common stock on [removed: July 28, 2017,] [added: August 3, 2018,] as reported on the NASDAQ Global Select Market, was approximately [removed: $9,854,201,000.][added: $10,735,950,000.]
The number of shares of the registrant’s common stock, par value $0.01 per share, outstanding as of March [removed: 29, 2018] [added: 28, 2019] was [removed: 60,611,334] [added: 58,803,744] shares.
Information required in response to Part III of Form 10‑K [removed: (Items 10, 11, 12, 13 and 14)] is hereby incorporated by reference from portions of the registrant’s Proxy Statement for the [removed: 2018] [added: 2019] Annual Meeting of Stockholders.
Such proxy statement will be filed with the Securities and Exchange Commission within 120 days of the registrant’s fiscal year ended February [removed: 3, 2018.][added: 2, 2019.]
| [Part I](#PartI_472203) | | | | [removed: 1] |
| [Part II](#PartII_970038) | | | | [removed: 24] |
| [Item 7A.](#Item7AQuantitativeandQualitativeDisclosu) | | [Quantitative and Qualitative Disclosures about Market Risk](#Item7AQuantitativeandQualitativeDisclosu) | | [removed: 41] [added: 40] |
| [Item 8.](#Item8FinancialStatementsandSupplementary) | | [Financial Statements and Supplementary Data](#Item8FinancialStatementsandSupplementary) | | [removed: 41] [added: 40] |
| [Item 9.](#Item9ChangesinandDisagreementswithAccoun) | | [Changes in and Disagreements with Accountants on Accounting and Financial Disclosure](#Item9ChangesinandDisagreementswithAccoun) | | [removed: 41] [added: 40] |
| [Item 9B.](#Item9BOtherInformation_494278) | | [Other Information](#Item9BOtherInformation_494278) | | [removed: 42] [added: 41] |
| [Part III](#PartIII_47569) | | | | [removed: 43] |
| [Item 10.](#Item10DirectorsExecutiveOfficersandCorpo) | | [Directors, Executive Officers and Corporate Governance](#Item10DirectorsExecutiveOfficersandCorpo) | | [removed: 43] [added: 42] |
| [Item 11.](#Item11ExecutiveCompensation_650349) | | [Executive Compensation](#Item11ExecutiveCompensation_650349) | | [removed: 43] [added: 42] |
| [Item 12.](#Item12SecurityOwnershipofCertainBenefici) | | [Security Ownership of Certain Beneficial Owners and Management and Related Stockholder Matters](#Item12SecurityOwnershipofCertainBenefici) | | [removed: 43] [added: 42] |
| [Item 13.](#Item13CertainRelationshipsandRelatedTran) | | [Certain Relationships and Related Transactions, and Director Independence](#Item13CertainRelationshipsandRelatedTran) | | [removed: 43] [added: 42] |
| [Item 14.](#Item14PrincipalAccountantFeesandServices) | | [Principal Accountant Fees and Services](#Item14PrincipalAccountantFeesandServices) | | [removed: 43] [added: 42] |
| [Part IV](#PartIV_745687) | | | | [removed: 44] |
| [Item 15.](#Item15ExhibitsandFinancialStatementSched) | | [Exhibits and Financial Statement Schedules](#Item15ExhibitsandFinancialStatementSched) | | [removed: 44] [added: 43] |
| [Item 16.](#Item16_10KSummary) | | [Form 10-K Summary](#Item16_10KSummary) | | [removed: 71] [added: 72] |
| [Signatures](#Signatures) | | | | [removed: 72] [added: 73] |
| | · | | other risk factors detailed in our public filings with the Securities and Exchange Commission (the SEC), including risk factors contained in Item 1A, “Risk Factors” of this Annual Report on Form 10‑K for the year ended February [removed: 3, 2018,] [added: 2, 2019,] as such may be amended or supplemented in our subsequently filed Quarterly Reports on Form 10‑Q. |
10-K 1 ulta-20190202x10k.htm 10-K
| | | | | |
| [Forward Looking Statements](#Forward_looking_statements) | | | | 1 |
| | | | | |
| | · | | the ability to execute our Efficiencies for Growth cost optimization program; |
| --- | --- | --- | --- |
10-K 1 ulta-20180203x10k.htm 10-K
ULTA BEAUTY, INC.
(Check one):
Shares of the registrant’s common stock held by each executive officer and director and by each entity or person that, to the registrant’s knowledge, owned 5% or more of the registrant’s outstanding common stock as of July 28, 2017 have been excluded in that such persons may be deemed to be affiliates of the registrant.
This determination of affiliate status is not necessarily a conclusive determination for other purposes.
Item 2. Properties
21 rewritten, 10 added, 12 removed, 23 unchanged
As of February [removed: 3, 2018,] [added: 2, 2019,] we operated [removed: 1,074] [added: 1,174] retail stores [removed: in 48 states and the District of Columbia,] [added: across 50 states,] as shown in the table below:
| Alabama | | [removed: 17] [added: 18] | | Montana | | 6 |
| Arizona | | [removed: 25] [added: 27] | | Nevada | | 14 |
| Arkansas | | [removed: 9] [added: 10] | | New Hampshire | | 7 |
| California | | [removed: 135] [added: 150] | | New Jersey | | [removed: 29] [added: 34] |
| Colorado | | [removed: 24] [added: 25] | | New Mexico | | 6 |
| Connecticut | | [removed: 13] [added: 16] | | New York | | [removed: 41] [added: 45] |
| Delaware | | 3 | | North Carolina | | [removed: 28] [added: 30] |
| [removed: District of Columbia] [added: Florida] | | [removed: 1] [added: 83] | | North Dakota | | 3 |
| Idaho | | 8 | | Oregon | | [removed: 12] [added: 14] |
| Illinois | | [removed: 52] [added: 55] | | Pennsylvania | | [removed: 40] [added: 42] |
| Iowa | | [removed: 9] [added: 10] | | South Carolina | | [removed: 15] [added: 20] |
| Kansas | | [removed: 11] [added: 12] | | South Dakota | | 2 |
| Kentucky | | [removed: 11] [added: 14] | | Tennessee | | [removed: 21] [added: 24] |
| Louisiana | | [removed: 16] [added: 17] | | Texas | | [removed: 100] [added: 104] |
| Maine | | 3 | | Utah | | [removed: 13] [added: 14] |
| [removed: Michigan] [added: Minnesota] | | [removed: 45] [added: 17] | | West Virginia | | [removed: 6] [added: 7] |
Our standard distribution center lease provides for a fixed minimum annual rent and generally has a 10 or 15‑year initial term with three or four renewal options with [added: terms of five years each.]
The general location, approximate size, and lease expiration dates of our distribution centers at February [removed: 3, 2018,] [added: 2, 2019,] are set forth below:
The corporate office is approximately [removed: 308,000] [added: 411,000] square feet with lease terms expiring from [removed: 2018] [added: 2019] to 2028.
[removed: In fiscal 2016,] [added: Additionally,] we [removed: opened] [added: have] a satellite corporate office in Chicago, Illinois.
| Georgia | | 35 | | Ohio | | 41 |
| Hawaii | | 4 | | Oklahoma | | 20 |
| Maryland | | 22 | | Vermont | | 1 |
| Massachusetts | | 18 | | Virginia | | 27 |
| Michigan | | 46 | | Washington | | 33 |
| Mississippi | | 9 | | Wisconsin | | 20 |
| Missouri | | 23 | | Wyoming | | 2 |
| | | | | Total | | 1,174 |
| Fresno, California | | 671,000 | | July 31, 2028 |
The Phoenix, Arizona distribution center lease expired on March 31, 2019.
| Florida | | 72 | | Ohio | | 40 |
| Georgia | | 33 | | Oklahoma | | 19 |
| Maryland | | 18 | | Virginia | | 25 |
| Massachusetts | | 17 | | Washington | | 26 |
| Minnesota | | 15 | | Wisconsin | | 20 |
| Mississippi | | 9 | | Wyoming | | 2 |
| Missouri | | 20 | | Total | | 1,074 |
We currently lease and operate five distribution centers located in Romeoville, Illinois; Phoenix, Arizona; Chambersburg, Pennsylvania; Greenwood, Indiana; and Dallas, Texas.
terms of five years each.
| Phoenix, Arizona | | 437,000 | | March 31, 2019 |
In February 2017, we entered into a lease for a distribution center located in Fresno, California.
The Fresno distribution center is approximately 671,000 square feet with a lease expiration date of July 31, 2028 and is expected to open in fiscal 2018.
Item 4. Mine Safety Disclosures
7 rewritten, 1 added, 1 removed, 38 unchanged
| Mary N. Dillon | | [removed: 56] [added: 57] | | Chief Executive Officer and member of the Board of Directors |
| Scott M. Settersten | | [removed: 57] [added: 58] | | Chief Financial Officer, Treasurer and Assistant Secretary |
| Jodi J. Caro | | [removed: 52] [added: 53] | | General Counsel, Chief Compliance Officer [removed: &] [added: and] Corporate Secretary |
| Jeffrey J. Childs | | [removed: 60] [added: 61] | | Chief Human Resources Officer |
| David C. Kimbell | | [removed: 51] [added: 52] | | Chief Merchandising and Marketing Officer |
Ms. Dillon serves as a member of the Board of Directors for Starbucks Corporation and [added: KKR & Co. Inc. and] previously served on the board of Target Corporation from 2007 to 2013.
[removed: Prior to] this role, Mr. Settersten served as Vice President of Accounting since 2010 and was responsible for accounting, tax, [added: external reporting and investor relations.]
Prior to
external reporting and investor relations.
Item 5. Market for Registrant’s Common Equity, Related Stockholder Matters and Issuer Purchases of Equity Securities
12 rewritten, 10 added, 27 removed, 33 unchanged
The last reported sale price of our common stock on the NASDAQ Global Select Market on March [removed: 29, 2018] [added: 28, 2019] was [removed: $204.27] [added: $345.23] per share.
As of March [removed: 29, 2018,] [added: 28, 2019,] we had [removed: 42] [added: 38] holders of record of our common stock.
The following table sets forth repurchases of our common stock during the fourth quarter of [removed: fiscal 2017:][added: 2018:]
| | (1) | | There were [removed: 265,596] [added: 881,437] shares repurchased as part of our publicly announced share repurchase program during the [removed: 14] [added: 13] weeks ended February [removed: 3, 2018] [added: 2, 2019] and there were [removed: 163] [added: 794] shares transferred from employees in satisfaction of minimum statutory tax withholding obligations upon the vesting of restricted stock during the period. |
| | (2) | | On March [removed: 9, 2017,] [added: 15, 2018,] we announced our [removed: 2017] [added: 2018] share repurchase program pursuant to which the Company may repurchase up to [removed: $425.0] [added: $625.0] million of the Company’s common stock. The [removed: 2017] [added: 2018] share repurchase program [removed: does] [added: did] not have an expiration date [removed: and may be suspended] [added: but provided for suspension] or [removed: discontinued] [added: discontinuation] at any time. As of February [removed: 3, 2018, $78.6] [added: 2, 2019, $46.1] million remained available under the [removed: $425.0] [added: $625.0] million [removed: 2017] [added: 2018] share repurchase program. On March [removed: 15, 2018,] [added: 14, 2019,] we announced the [removed: 2018] [added: 2019] share repurchase program. For additional information on the [removed: 2018] [added: 2019] share repurchase program see Note [removed: 15] [added: 19] to our consolidated financial statements, “Subsequent event.” |
The following table provides information about Ulta Beauty common stock that may be issued under our equity compensation plans as of February [removed: 3, 2018:][added: 2, 2019:]
| | (2) | | Includes [removed: 765,536] [added: 754,666] shares issuable pursuant to the exercise of outstanding stock options, [removed: 133,705] [added: 167,742] shares issuable pursuant to restricted stock [removed: units] [added: units,] and [removed: 78,235] [added: 94,153] shares issuable pursuant to performance-based units. |
Set forth below is a graph comparing the cumulative total stockholder return on Ulta Beauty’s common stock with the NASDAQ Global Select Market Composite Index (NQGS) and the S&P Retail Index (RLX) for the period covering February [removed: 2, 2013] [added: 1, 2014] through the end of Ulta Beauty’s fiscal year ended February [removed: 3, 2018.][added: 2, 2019.]
The graph assumes an investment of $100 made at the closing of trading on February [removed: 2, 2013] [added: 1, 2014] in (i) Ulta Beauty’s common stock, (ii) the stocks comprising the NQGS and (iii) stocks comprising the RLX.
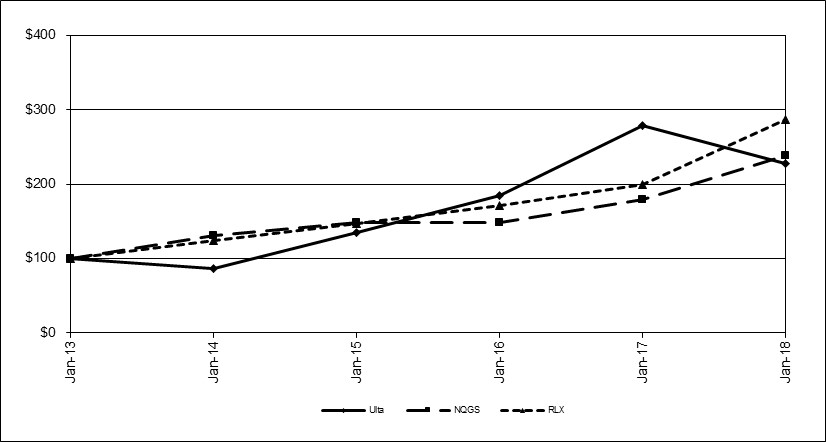][added: 8](https://www.sec.gov/Archives/edgar/data/1403568/000155837019002739/ulta20190202x10k001.jpg)]
| | | February [removed: 2, | | | February] 1, | | | January 31, | | | January 30, | | | January 28, | | | February 3, | | [added: | February 2, | |]
| Company / Index | | [removed: 2013 | | |] 2014 | | | 2015 | | | 2016 | | | 2017 | | | 2018 | | [added: | 2019 | |]
| | | | | | | | | | | |
| Period | | Total number of shares purchased (1) | | Average price paid per share | | | Total number of shares purchased as part of publicly announced plans or programs (2) | | Approximate dollar value of shares that may yet to be purchased under plans or programs (in thousands) (2) | |
| November 4, 2018 to December 1, 2018 | | 150,338 | | $ | 302.49 | | 150,338 | | $ | 237,361 |
| December 2, 2018 to December 29, 2018 | | 393,706 | | | 249.07 | | 393,472 | | | 139,362 |
| December 30, 2018 to February 2, 2019 | | 338,187 | | | 276.30 | | 337,627 | | | 46,065 |
| 13 weeks ended February 2, 2019 | | 882,231 | | | 268.61 | | 881,437 | | | 46,065 |
| Equity compensation plans approved by security holders (1) | | 1,016,561 | | $ | 174.34 | | 3,336,386 |
| Ulta Beauty | | $ | 100.00 | | $ | 154.91 | | $ | 212.72 | | $ | 319.69 | | $ | 260.77 | | $ | 342.75 |
| NQGS | | | 100.00 | | | 113.40 | | | 113.55 | | | 138.09 | | | 182.52 | | | 179.24 |
| RLX | | | 100.00 | | | 118.75 | | | 137.22 | | | 160.31 | | | 230.59 | | | 248.01 |
Our initial public offering was priced at $18.00 per share.
The following table sets forth the high and low sales prices for our common stock on the NASDAQ Global Select Market during fiscal years 2017 and 2016:
| | | | | | | | | | | | | | | | | | | | |
| --- | --- | --- | --- | --- | --- | --- | --- | --- | --- | --- | --- | --- | --- | --- | --- | --- | --- | --- | --- |
| | | Fiscal 2017 | | | | | | | | | Fiscal 2016 | | | | | | | | |
| | | High | | | Low | | | | | | High | | | | | | Low | | |
| First quarter | | $ | 289.27 | | $ | 266.40 | | | | | $ | 212.92 | | | | | $ | 146.77 | |
| Second quarter | | | 314.86 | | | 243.61 | | | | | | 262.12 | | | | | | 202.28 | |
| Third quarter | | | 257.06 | | | 187.96 | | | | | | 278.63 | | | | | | 230.10 | |
| Fourth quarter | | | 249.30 | | | 191.80 | | | | | | 273.99 | | | | | | 225.13 | |
Dividends
No cash dividends were declared on our common stock in fiscal 2017 or fiscal 2016 nor have any decisions been made to pay a dividend in the future.
Our Board of Directors may determine future dividends after giving consideration to our levels of profit and cash flow, capital requirements, current and future liquidity, restrictions as part of our credit facility, as well as financial and other conditions existing at the time.
| | | | | | | | | | Approximate dollar | |
| | | Total | | | | | Total number of | | value of shares that may | |
| | | number of | | | | | shares purchased | | yet to be purchased | |
| | | shares | | Average | | | as part of publicly | | under plans or | |
| | | purchased | | price paid | | | announced plans | | programs | |
| Period | | (1) | | per share | | | or programs (2) | | (in thousands) (2) | |
| October 29, 2017 to November 25, 2017 | | 86,334 | | $ | 203.41 | | 86,334 | | $ | 118,828 |
| November 26, 2017 to December 30, 2017 | | 101,241 | | | 220.08 | | 101,078 | | | 96,582 |
| December 31, 2017 to February 3, 2018 | | 78,184 | | | 230.32 | | 78,184 | | | 78,575 |
| 14 weeks ended February 3, 2018 | | 265,759 | | $ | 217.68 | | 265,596 | | $ | 78,575 |
| Equity compensation plans approved by security holders (1) | | 977,476 | | $ | 147.76 | | 3,726,889 |
| Ulta Beauty | | $ | 100.00 | | $ | 87.07 | | $ | 134.88 | | $ | 185.21 | | $ | 278.35 | | $ | 227.05 |
| NQGS | | | 100.00 | | | 130.22 | | | 147.66 | | | 147.86 | | | 179.82 | | | 237.68 |
| RLX | | | 100.00 | | | 124.27 | | | 147.57 | | | 170.53 | | | 199.22 | | | 286.56 |
Item 6. Selected Financial Data
40 rewritten, 1 added, 2 removed, 21 unchanged
| | | February [added: 2, | | | February] 3, | | | January 28, | | | January 30, | | | January 31, | | [removed: | February 1, | |]
| | | [removed: 2018] [added: 2019] (2) | | | [removed: 2017] [added: 2018 (3)] | | | [removed: 2016] [added: 2017] | | | [removed: 2015] [added: 2016] | | | [removed: 2014] [added: 2015] | |
| | | (In thousands, except per [removed: share, square foot,] [added: share] and [removed: store count] [added: per square foot] data) | | | | | | | | | | | | | |
| Net sales [removed: (2)] | | $ | [removed: 5,884,506] [added: 6,716,615] | | $ | [removed: 4,854,737] [added: 5,884,506] | | $ | [removed: 3,924,116] [added: 4,854,737] | | $ | [removed: 3,241,369] [added: 3,924,116] | | $ | [removed: 2,670,573] [added: 3,241,369] |
| Cost of sales | | | [added: 4,307,304 | | |] 3,787,697 | | | 3,107,508 | | | 2,539,783 | | | 2,104,582 | [removed: | | 1,729,325 |]
| Gross profit | | | [added: 2,409,311 | | |] 2,096,809 | | | 1,747,229 | | | 1,384,333 | | | 1,136,787 | [removed: | | 941,248 |]
| Selling, general and administrative expenses | | | [added: 1,535,464 | | |] 1,287,232 | | | 1,073,834 | | | 863,354 | | | 712,006 | [removed: | | 596,390 |]
| Pre-opening expenses | | | [added: 19,767 | | |] 24,286 | | | 18,571 | | | 14,682 | | | 14,366 | [removed: | | 17,270 |]
| Operating income | | | [added: 854,080 | | |] 785,291 | | | 654,824 | | | 506,297 | | | 410,415 | [removed: | | 327,588 |]
| Interest income, net | | | [added: (5,061) | | |] (1,568) | | | (890) | | | (1,143) | | | (894) | [removed: | | (118) |]
| Income before income taxes | | | [added: 859,141 | | |] 786,859 | | | 655,714 | | | 507,440 | | | 411,309 | [removed: | | 327,706 |]
| Income tax expense [removed: (3)] [added: (4)] | | | [added: 200,582 | | |] 231,625 | | | 245,954 | | | 187,432 | | | 154,174 | [removed: | | 124,857 |]
| Net income | | $ | [removed: 555,234] [added: 658,559] | | $ | [removed: 409,760] [added: 555,234] | | $ | [removed: 320,008] [added: 409,760] | | $ | [removed: 257,135] [added: 320,008] | | $ | [removed: 202,849] [added: 257,135] |
| Basic | | $ | [removed: 9.02] [added: 11.00] | | $ | [removed: 6.55] [added: 9.02] | | $ | [removed: 5.00] [added: 6.55] | | $ | [removed: 4.00] [added: 5.00] | | $ | [removed: 3.17] [added: 4.00] |
| Diluted | | $ | [removed: 8.96] [added: 10.94] | | $ | [removed: 6.52] [added: 8.96] | | $ | [removed: 4.98] [added: 6.52] | | $ | [removed: 3.98] [added: 4.98] | | $ | [removed: 3.15] [added: 3.98] |
| Basic | | | [added: 59,864 | | |] 61,556 | | | 62,519 | | | 63,949 | | | 64,335 | [removed: | | 63,992 |]
| Diluted | | | [added: 60,181 | | |] 61,975 | | | 62,851 | | | 64,275 | | | 64,651 | [removed: | | 64,461 |]
| Comparable sales increase: [removed: (4)] [added: (5)] | | | | | | | | | | | | | | | |
| Retail and salon comparable sales | | | [added: 5.1% | | |] 7.1% | | | 13.4% | | | 10.0% | | | 8.1% | [removed: | | 6.1% |]
| E-commerce comparable sales | | | [added: 35.4% | | |] 59.9% | | | 56.2% | | | 47.5% | | | 56.4% | [removed: | | 76.6% |]
| Total comparable sales increase | | | [added: 8.1% | | |] 11.0% | | | 15.8% | | | 11.8% | | | 9.9% | [removed: | | 7.9% |]
| Number of stores end of year | | | [added: 1,174 | | |] 1,074 | | | 974 | | | 874 | | | 774 | [removed: | | 675 |]
| Total square footage end of year | | | [added: 12,337,145 | | |] 11,300,920 | | | 10,271,184 | | | 9,225,957 | | | 8,182,404 | [removed: | | 7,158,286 |]
| Total square footage per store [removed: (5)] [added: (6)] | | | [added: 10,509 | | |] 10,522 | | | 10,545 | | | 10,556 | | | 10,572 | [removed: | | 10,605 |]
| Average total square footage [removed: (6)] [added: (7)] | | | [added: 11,893,413 | | |] 10,742,874 | | | 9,641,367 | | | 8,724,581 | | | 7,690,742 | [removed: | | 6,555,960 |]
| Capital expenditures | | | [added: 319,400 | | |] 440,714 | | | 373,747 | | | 299,167 | | | 249,067 | [removed: | | 226,024 |]
| Depreciation and amortization | | | [added: 279,472 | | |] 252,713 | | | 210,295 | | | 165,049 | | | 131,764 | [removed: | | 106,283 |]
| Repurchase of common shares | | | [added: 616,194 | | |] 367,581 | | | 344,275 | | | 167,396 | | | 39,923 | [removed: | | 37,337 |]
| Cash and cash equivalents | | $ | [removed: 277,445] [added: 409,251] | | $ | [removed: 385,010] [added: 277,445] | | $ | [removed: 345,840] [added: 385,010] | | $ | [removed: 389,149] [added: 345,840] | | $ | [removed: 419,476] [added: 389,149] |
| Short-term investments | | | [added: – | | |] 120,000 | | | 30,000 | | | 130,000 | | | 150,209 | [removed: | | – |]
| Working capital (8) | | | [added: 1,091,125 | | |] 1,051,577 | | | 1,006,894 | | | 978,946 | | | 900,761 | [removed: | | 735,886 |]
| Property and equipment, net | | | [added: 1,226,029 | | |] 1,189,453 | | | 1,004,358 | | | 847,600 | | | 717,159 | [removed: | | 595,736 |]
| Total assets | | | [added: 3,191,172 | | |] 2,908,687 | | | 2,551,878 | | | 2,230,918 | | | 1,983,170 | [removed: | | 1,602,727 |]
| Total stockholders' equity | | | [added: 1,820,218 | | |] 1,774,217 | | | 1,550,218 | | | 1,442,886 | | | 1,247,509 | [removed: | | 1,003,094 |]
| | [removed: (2)] [added: (3)] | | Fiscal 2017 includes 53 weeks; all other fiscal years reported include 52 weeks. Net sales for the 53rd week of fiscal 2017 were approximately $108.8 million. |
| | [removed: (3)] [added: (4)] | | [removed: Income tax expense of $231.6 million in fiscal 2017 represents an effective tax rate of 29.4% compared to fiscal 2016 tax expense of $246.0 million and an effective tax rate of 37.5%.] On December 22, 2017, the Tax Cuts and Jobs Act was enacted into law. This new legislation reduced the federal corporate tax rate to 21.0% effective January 1, 2018. In accordance with Section 15 of the Internal Revenue Code, the Company [removed: will utilize] [added: utilized] a blended rate of 33.7% for the fiscal 2017 tax year, by applying a prorated percentage of the number of days prior to and subsequent to the January 1, 2018 effective date. [added: Income tax expense in fiscal 2018 reflects the lower federal tax rate for the entire fiscal year.] |
| | [removed: (4)] [added: (5)] | | Comparable sales increase reflects sales for stores beginning on the first day of the 14th month of operation. Remodeled stores are included in comparable sales unless the store was closed for a portion of the current or comparable prior year. |
| | [removed: (5)] [added: (6)] | | Total square footage per store is calculated by dividing total square footage at end of year by number of stores at end of year. |
| | [removed: (6)] [added: (7)] | | Average total square footage represents a weighted average, which reflects the effect of opening stores in different months throughout the year. |
| | (8) | | The Company prospectively adopted Accounting Standards Update No. 2015‑17, Balance Sheet Classification of Deferred Taxes, in the fourth quarter of fiscal 2015. As a result of this adoption, current deferred tax assets were classified as non-current liabilities at February [added: 2, 2019, February] 3, 2018, January 28, 2017, and January 30, 2016. |
| | (2) | | The Company adopted Accounting Standards Codification (ASC) Topic 606, Revenue from Contracts with Customers (ASC 606) using the modified retrospective transition method in fiscal 2018. Results from fiscal years prior to fiscal 2018 have not been recast for the adoption of ASC 606. |
| Retail sales per average total square foot (7) | | $ | 548 | | $ | 504 | | $ | 450 | | $ | 421 | | $ | 407 |
| | (7) | | Retail sales per average total square foot was calculated, for all years presented, by dividing net sales for the year by the average square footage for those stores open during each year. In prior years we calculated this metric using total net sales, excluding e-commerce sales. The Company believes that including e-commerce sales more appropriately reflects the Company’s productivity. Net sales per average square foot calculated using total net sales, excluding e-commerce sales, would have been $495, $468, $424, $402, and $393, for fiscal years 2017, 2016, 2015, 2014, and 2013, respectively. |
Item 9A. Controls and Procedures
5 rewritten, 0 added, 1 removed, 6 unchanged
Based on management’s evaluation as of February [removed: 3, 2018,] [added: 2, 2019,] our Chief Executive Officer and Chief Financial Officer have concluded that our disclosure controls and procedures (as defined in Rules 13a‑15(e) and 15d‑15(e) under the Securities Exchange Act of 1934) are effective to ensure that the information required to be disclosed by us in our reports that we file or submit under the Securities Exchange Act of 1934 is recorded, processed, summarized, and reported within the time periods specified in the SEC’s rules and forms, and that such information is accumulated and communicated to our management, including the Chief Executive Officer and Chief Financial Officer, as appropriate, to allow timely decisions regarding required disclosure.
Under the supervision and with the participation of our principal executive officer and our principal financial officer, management evaluated the effectiveness of our internal control over financial reporting as of February [removed: 3, 2018,] [added: 2, 2019,] based on the criteria established in Internal Control – Integrated Framework issued by the Committee of Sponsoring Organizations of the Treadway Commission (2013 framework) (the COSO).
Based on this evaluation, our principal executive officer and principal financial officer concluded that our internal controls over financial reporting were effective as of February [removed: 3, 2018.][added: 2, 2019.]
Ernst & Young LLP, the independent registered public accounting firm that audited our financial statements included in this Annual Report on Form 10‑K, has audited the effectiveness of our internal control over [added: financial reporting as of February 2, 2019 and has issued the attestation report included in Item 15 of this Annual Report on Form 10‑K.]
There were no changes to our internal controls over financial reporting during the [removed: 14] [added: 13] weeks ended February [removed: 3, 2018] [added: 2, 2019] that have materially affected, or are reasonably likely to materially affect, our internal controls over financial reporting.
financial reporting as of February 3, 2018 and has issued the attestation report included in Item 15 of this Annual Report on Form 10‑K.
Item 9B. Other Information
0 rewritten, 1 added, 11 removed, 1 unchanged
None.
On March 29, 2018, our Board of Directors approved a special retention incentive award for Mary Dillon, our Chief Executive Officer, which will vest based on her continued employment with the Company through September 30, 2021, consisting of:
| | · | | an award of 24,478 restricted stock units (the Time Vested RSUs) which have a grant date fair value equal to $5,000,000; and |
| --- | --- | --- | --- |
| | · | | an award of performance based restricted stock units (the Performance RSUs) which will have a value equal to (a) $5,000,000, if our average closing share price for either the 20 trading days or 30 calendar days preceding September 30, 2021 equals $300, or (b) $10,000,000, if our average closing share price for either the 20 trading days or 30 calendar days preceding September 30, 2021 equals or exceeds $350. If our average closing share price is greater than $300, but less than $350, the value of her shares will be interpolated between the $5,000,000 and $10,000,000 values. To the extent our average closing share price is determined by our Board of Directors in its sole discretion to be (i) falsely depressed by a disruption with respect to our share price or an abnormal market disruption (including, without limitation, a natural disaster or a terrorist attack), or (ii) inflated due to the existence of material non-public information that upon disclosure is expected to have a significant adverse impact on our share price, then our Board of Directors, in its sole discretion, may adjust the measurement period of 20 trading days or 30 calendar days preceding September 30, 2021 to (A) a time period preceding such disruption, (B) shorten or lengthen the measurement period or (C) disregard the period of such disruption. |
Should Ms. Dillon resign with the consent of our Board of Directors or if she is terminated without “Cause” or terminates for “Good Reason” (both as defined in her amended employment letter) prior to September 30, 2021, and she provides a general release of claims, then she will vest in the Time Vested RSUs on such termination and the Performance RSUs will remain eligible to vest on September 30, 2021 depending upon our average closing share price as described above.
Ms. Dillon will be issued the vested Time Vested RSUs and the number of shares with a value equal to the Performance RSUs on September 30, 2021, but she is restricted from selling any such shares until September 30, 2022.
On March 29, 2018, the Compensation Committee of our Board of Directors also amended Ms. Dillon’s severance benefits as originally set forth in her June 20, 2013 employment letter.
As amended, in the event Ms. Dillon’s employment is terminated without “Cause” or she resigns for “Good Reason” (as such terms are defined in her amended employment letter), she will be entitled to the following, subject to her providing a general release of claims:
| | · | | severance pay for a period of 24 months in a monthly amount equal to the sum of (a) her monthly base salary then in effect plus (b) her target bonus for the year of termination divided by 12; and |
| | · | | any bonus actually earned, pro-rated based on the percentage of the fiscal year Ms. Dillon is employed by the Company. |
The forgoing descriptions of Ms. Dillon’s special retention incentive award and amended severance benefits are qualified in their entirety by reference to the full text of the award agreement and the amendment to her employment letter, copies of which are filed herewith as Exhibits 10.17 and 10.18, respectively, and are incorporated herein by reference.
Item 10. Directors, Executive Officers, and Corporate Governance
3 rewritten, 0 added, 0 removed, 2 unchanged
The information required by this item with respect to our executive officers is set forth after Part I, Item 4 of this Annual Report on Form 10‑K under the caption “Executive Officers of the Registrant.” The additional information required by this item is included under the captions “Corporate Governance [removed: and the Board] [added: – Code] of [removed: Directors -] [added: Business Conduct,” “Corporate Governance – Nomination Process – Qualifications,” “Corporate Governance – Proposal One –] Election of Directors,” [removed: “Independent Registered Public Accounting Firm and Audit Committee -] [added: “Corporate Governance – Information About Our Director Nominees,” “Corporate Governance – Information About Our Directors Continuing in Office,” “Corporate Governance –] Audit Committee” and “Stock [removed: -] [added: –] Section 16(a) Beneficial Ownership Reporting Compliance” in our definitive Proxy Statement for our [removed: 2018] [added: 2019] Annual Meeting of Stockholders (the Proxy Statement) and is hereby incorporated herein by reference.
We have posted a copy of our Code of Business Conduct under [removed: “Corporate Governance”] [added: “Governance”] in the Investor Relations section of our website located at http://ir.ultabeauty.com, and such Code of Business Conduct is available in print, without charge, to any stockholder who requests it from our Corporate Secretary.
We intend to satisfy the disclosure requirements under Item 5.05 of Form 8‑K regarding amendments to, or waivers from, the Code of Business Conduct by posting such information under [removed: “Corporate Governance”] [added: “Governance”] in the Investor Relations section of our website located at http://ir.ultabeauty.com.
Item 11. Executive Compensation
1 rewritten, 0 added, 0 removed, 0 unchanged
The information required by this item is included under the captions “Compensation [removed: Committee -] [added: Discussion and Analysis,” “Corporate Governance – Compensation Committee,” “Corporate Governance –] Report of the Compensation Committee of the Board of Directors,” [removed: “Compensation Committee - Compensation Discussion] and [removed: Analysis,” “Compensation Committee - CEO Pay Ratio,” and] “Corporate Governance [removed: and the Board of Directors -] [added: –] Non-Executive Director Compensation for Fiscal [removed: 2017”] [added: 2018”] in the Proxy Statement and is hereby incorporated herein by reference.
Item 12. Security Ownership of Certain Beneficial Owners and Management and Related Stockholder Matters
1 rewritten, 0 added, 0 removed, 1 unchanged
The information required by this item with respect to compensation plans under which our equity securities are authorized for issuance as of February [removed: 3, 2018] [added: 2, 2019] is set forth in Item 5 of this Annual Report on Form 10‑K under the caption “Securities authorized for issuance under equity compensation plans.”
Item 13. Certain Relationships and Related Transactions, and Director Independence
1 rewritten, 0 added, 0 removed, 0 unchanged
The information required by this item is included under the captions “Corporate Governance [removed: and the Board of Directors - Corporate Governance -] [added: –] Independence,” [removed: “Compensation] [added: “Corporate Governance – Compensation] Committee [removed: -] [added: –] Compensation Committee Interlocks and Insider Participation,” and “Certain Relationships and Transactions” in the Proxy Statement and is hereby incorporated by reference.
Item 14. Principal Accountant Fees and Services
1 rewritten, 0 added, 0 removed, 1 unchanged
The information required by this item is included under the caption [removed: “Independent] [added: “Corporate Governance – Proposal Two – Ratification of Appointment of Independent] Registered Public Accounting Firm [removed: and Audit Committee -] [added: –] Fees to Independent Registered Public Accounting Firm” in the Proxy Statement and is hereby incorporated by reference.
Item 15. Exhibits and Financial Statement Schedules
300 rewritten, 241 added, 142 removed, 443 unchanged
| [Reports of Independent Registered Public Accounting Firm](#ReportofIndependentRegisteredPublicAccou) | [removed: 45] [added: 44] |
| [Consolidated Balance Sheets](#Consol_Balance_Sheets) | [removed: 48] [added: 47] |
| [Consolidated Statements of Income](#Consol_Stmnts_Income) | [removed: 49] [added: 48] |
| [Consolidated Statements of Cash Flows](#Consol_Stmnts_Cash_Flows) | [removed: 50] [added: 49] |
| [Consolidated Statements of Stockholders’ Equity](#Consol_Stmnts_Stockhldrs_Equity) | [removed: 51] [added: 50] |
| [Notes to Consolidated Financial Statements](#Notes_to_Consol_Fin_Statements) | [removed: 52] [added: 51] |
| [Schedule II – Valuation and Qualifying Accounts](#Schedule_II) | [removed: 69] [added: 70] |
The [added: Stockholders and the] Board of Directors [removed: and Stockholders][added: of Ulta Beauty, Inc.]
We have audited the accompanying consolidated balance sheets of Ulta Beauty, Inc. (the Company) as of February [added: 2, 2019, and February] 3, 2018, [removed: and January 28, 2017,] the related consolidated statements of income, stockholders’ equity, and cash flows for each of the three years in the period ended February 3, 2018, and the related notes and financial statement schedule listed in the Index at Item 15 (collectively referred to as the “financial statements”).
In our opinion, the financial statements present fairly, in all material respects, the consolidated financial position of the Company at February [removed: 3, 2018] [added: 2, 2019] and [removed: January 28, 2017,] [added: February 3, 2018,] and the consolidated results of its operations and its cash flows for each of the three years in the period ended February [removed: 3, 2018,] [added: 2, 2019,] in conformity with U.S. generally accepted accounting principles.
We also have audited, in accordance with the standards of the Public Company Accounting Oversight Board (United States) (PCAOB), the Company's internal control over financial reporting as of February [removed: 3, 2018,] [added: 2, 2019,] based on criteria established in Internal Control-Integrated Framework issued by the Committee of Sponsoring Organizations of the Treadway Commission (2013 framework) and our report dated April [removed: 3, 2018] [added: 2, 2019] expressed an unqualified opinion thereon.
We have audited Ulta Beauty, Inc.’s internal control over financial reporting as of February [removed: 3, 2018,] [added: 2, 2019,] based on criteria established in Internal Control - Integrated Framework issued by the Committee of Sponsoring Organizations of the Treadway Commission (2013 framework) (the COSO criteria).
In our opinion, Ulta Beauty, Inc. (the Company) maintained, in all material respects, effective internal control over financial reporting as of February [removed: 3, 2018,] [added: 2, 2019,] based on COSO criteria.
We also have audited, in accordance with the standards of the Public Company Accounting Oversight Board (United States) (PCAOB), the consolidated balance sheets of the Company as of February [removed: 3, 2018] [added: 2, 2019] and [removed: January 28, 2017,] [added: February 3, 2018,] the related consolidated statements of income, stockholders’ equity and cash flows for each of the three years in the period ended February [removed: 3, 2018,] [added: 2, 2019,] and the related notes and financial statement schedule listed in the Index at Item 15 and our report dated April [removed: 3, 2018] [added: 2, 2019] expressed an unqualified opinion thereon.
| | | February [added: 2, | | | February] 3, | | | January 28, | |
| (In thousands, except per share data) | | [added: 2019 | | |] 2018 | | | 2017 | |
| Cash and cash equivalents [added: at beginning of year] | | [removed: $] | 277,445 | | [removed: $] | 385,010 | [added: | | 345,840 |]
| Short-term investments | | | [removed: 120,000] [added: —] | | | [removed: 30,000] [added: 120,000] |
| Receivables, net | | | [removed: 99,719] [added: 136,168] | | | [removed: 88,631] [added: 99,719] |
| Merchandise inventories, net | | | [removed: 1,096,424] [added: 1,214,329] | | | [removed: 943,975] [added: 1,096,424] |
| Prepaid expenses and other current assets | | | [removed: 98,666] [added: 138,116] | | | [removed: 88,621] [added: 98,666] |
| Prepaid income taxes | | | [removed: 1,489] [added: 16,997] | | | [removed: —] [added: 1,489] |
| Total current assets | | | [removed: 1,693,743] [added: 1,914,861] | | | [removed: 1,536,237] [added: 1,693,743] |
| Property and equipment, net | | | [removed: 1,189,453] [added: 1,226,029] | | | [removed: 1,004,358] [added: 1,189,453] |
| Deferred compensation plan assets | | | [removed: 16,827] [added: 20,511] | | | [removed: 11,283] [added: 16,827] |
| Other long-term assets | | | [removed: 8,664] [added: 14,584] | | | [removed: —] [added: 8,664] |
| Total assets | | $ | [removed: 2,908,687] [added: 3,191,172] | | $ | [removed: 2,551,878] [added: 2,908,687] |
| Accounts payable | | $ | [removed: 325,758] [added: 404,016] | | $ | [removed: 259,518] [added: 325,758] |
| Accrued income taxes | | | [removed: 14,101] [added: —] | | | [removed: 8,971] [added: 14,101] |
| Total current liabilities | | | [removed: 642,166] [added: 823,736] | | | [removed: 529,343] [added: 642,166] |
| Deferred rent | | | [removed: 407,916] [added: 434,980] | | | [removed: 366,191] [added: 407,916] |
| Deferred income taxes | | | [removed: 59,403] [added: 83,864] | | | [removed: 86,498] [added: 59,403] |
| Other long-term liabilities | | | [removed: 24,985] [added: 28,374] | | | [removed: 19,628] [added: 24,985] |
| Total liabilities | | | [removed: 1,134,470] [added: 1,370,954] | | | [removed: 1,001,660] [added: 1,134,470] |
| Commitments and contingencies (Note [removed: 4)] [added: 8)] | | | | | | |
| Common stock, $0.01 par value, 400,000 shares authorized; [removed: 61,441] [added: 59,232] and [removed: 62,733] [added: 61,441] shares issued; [removed: 60,822] [added: 58,584] and [removed: 62,129] [added: 60,822] shares outstanding; at February [added: 2, 2019 and February] 3, 2018, [removed: and January 28, 2017,] respectively | | | [removed: 614] [added: 592] | | | [removed: 627] [added: 614] |
| Treasury stock-common, at cost | | | [removed: (18,767)] [added: (24,908)] | | | [removed: (14,524)] [added: (18,767)] |
| Additional paid-in capital | | | [removed: 698,917] [added: 738,671] | | | [removed: 658,330] [added: 698,917] |
| Retained earnings | | | [removed: 1,093,453] [added: 1,105,863] | | | [removed: 905,785] [added: 1,093,453] |
| Total stockholders’ equity | | | [removed: 1,774,217] [added: 1,820,218] | | | [removed: 1,550,218] [added: 1,774,217] |
April 2, 2019
The Stockholders’ and the Board of Directors Ulta Beauty, Inc.
April 2, 2019
| | | February 2, | | | February 3, | |
| (In thousands, except per share data) | | 2019 | | | 2018 | |
| Cash and cash equivalents | | $ | 409,251 | | $ | 277,445 |
| Goodwill | | | 10,870 | | | — |
| Other intangible assets, net | | | 4,317 | | | — |
| Accrued liabilities | | | 220,666 | | | 189,171 |
| Deferred revenue | | | 199,054 | | | 113,136 |
| Acquisitions, net of cash acquired | | | (13,606) | | | — | | | — |
| Purchases of equity investments | | | (2,101) | | | — | | | — |
| Net income | | \- | | | \- | | \- | | | \- | | | \- | | | 658,559 | | | 658,559 |
| Adoption of accounting standards (Note 4) | | \- | | | \- | | \- | | | \- | | | \- | | | (29,980) | | | (29,980) |
| Repurchase of common shares | | (2,464) | | | (25) | | \- | | | \- | | | \- | | | (616,169) | | | (616,194) |
| Balance – February 2, 2019 | | 59,232 | | $ | 592 | | (648) | | $ | (24,908) | | $ | 738,671 | | $ | 1,105,863 | | $ | 1,820,218 |
As of February 2, 2019, the Company operated 1,174 stores across 50 states.
The Company has one reportable segment, which includes retail stores, salon services, and e-commerce.
Reclassifications
Certain prior year amounts have been reclassified to conform to the current year presentation.
Cash equivalents also include amounts due from third-party financial institutions for credit card and debit card transactions.
These receivables typically settle in five days or less with little or no default risk.
Amounts from third-party financial institutions for credit card and debit card transactions were $57,698 and $60,773 as of February 2, 2019 and February 3, 2018, respectively.
The receivable for landlord allowances was $19,746 and $12,729 as of February 2, 2019 and February 3, 2018, respectively.
The inventory reserve was $36,640 and $24,804 as of February 2, 2019 and February 3, 2018, respectively.
value of the assets over the fair value of such assets.
Goodwill
Goodwill represents the excess of cost over the fair value of net assets acquired.
The Company reviews the recoverability of goodwill annually during the fourth quarter or more frequently if an event occurs or circumstances change that would indicate that impairment may exist (see Note 6, “Goodwill”).
Other intangible assets
Other definite-lived intangible assets are amortized over their useful lives.
The Company reviews the recoverability of long-lived assets whenever events or changes in circumstances indicate the carrying amount of such assets may not be recoverable (see Note 7, “Other intangible assets”).
Points earned are valid for at least one year.
The loyalty program represents a material right to the customer and points may be redeemed on future products and services.
The relative standalone selling price of points earned by members is included in deferred revenue on the consolidated balance sheets based on the percentage of points expected to be redeemed.
The expected redemption percentage is based on historical redemption patterns and considers current information or trends.
When a guest redeems points or the points expire, the Company recognizes revenue in net sales on the consolidated statements of income.
Prior to fiscal 2018, loyalty program revenue was recorded using the incremental cost method within cost of sales on the consolidated statements of income.
The Company’s performance obligation is to maintain the Ultamate Rewards loyalty program as only guests enrolled in the loyalty program can apply for the Credit Cards.
The third parties reimburse the Company for certain credit card program costs such as advertising and loyalty points, which help promote the credit card program.
Ulta Beauty, Inc.
April 3, 2018
| Accrued liabilities | | | 302,307 | | | 260,854 |
| | | | | | | | | | | |
| --- | --- | --- | --- | --- | --- | --- | --- | --- | --- | --- |
| Cash and cash equivalents at beginning of year | | | 385,010 | | | 345,840 | | | 389,149 |
| Balance – January 31, 2015 | | 64,762 | | $ | 647 | | (578) | | $ | (9,713) | | $ | 576,982 | | $ | 679,593 | | $ | 1,247,509 |
| Net income | | \- | | | \- | | \- | | | \- | | | \- | | | 320,008 | | | 320,008 |
| Excess tax benefits from stock-based compensation | | \- | | | \- | | \- | | | \- | | | 9,497 | | | \- | | | 9,497 |
| Repurchase of common shares | | (1,034) | | | (10) | | \- | | | \- | | | \- | | | (167,386) | | | (167,396) |
As of February 3, 2018, the Company operated 1,074 stores in 48 states and the District of Columbia.
The Company has determined its operating segments on the same basis that it uses to internally evaluate performance.
The Company has combined its three operating segments, retail stores, salon services, and e-commerce, into one reportable segment because they have a similar class of consumer, economic characteristics, nature of products, and distribution methods.
The Company offers a balanced portfolio across five primary categories: (1) cosmetics; (2) skincare, bath and fragrance; (3) haircare products and styling tools; (4) salon services; and (5) other, which includes nail products and accessories.
liabilities at the date of the consolidated financial statements and the reported amounts of revenues and expenses during the accounting period.
Cash equivalents include amounts due from third-party credit card receivables because such amounts generally convert to cash within one to three days with little or no default risk.
The Company’s vendors are producers of consumer products and landlords.
Ultamate Rewards enables customers to earn points based on their purchases.
Points earned by members are valid for at least one year and may be redeemed on any product the Company sells.
The Company accrues the cost of anticipated redemptions related to this program at the time of the initial purchase based on historical experience.
The accrued liability related to this loyalty program at February 3, 2018 and January 28, 2017 was $42,219 and $30,244, respectively.
The cost of this program, which was $106,598, $77,145, and $54,464 in fiscal 2017, 2016, and 2015, respectively, is included in cost of sales in the consolidated statements of income.
The Company receives payments and reimbursements of expenses in accordance with the Agreements and based on usage of the Credit Cards.
A majority of the funds received are recorded as a reduction of SG&A expenses, and the remaining portion is recognized as a reduction to cost of sales in the consolidated statements of income.
Consistent with the current accounting for the customer loyalty program, the Company accrues the cost of anticipated redemptions of points at the time of the initial purchase and costs are included in cost of sales in the consolidated statements of income.
the lease term or 10 years.
E-commerce sales are recognized based on delivery of merchandise to the customer.
Gift card breakage is recognized over the same performance period, and in the same proportion, that the Company’s data has demonstrated that gift cards are redeemed.
Deferred gift card revenue was $63,139 and $46,268 at February 3, 2018 and January 28, 2017, respectively, and is included in accrued liabilities on the consolidated balance sheets.
insurance, licenses, and cleaning expenses; salon payroll and benefits; customer loyalty program expense; and shrink and inventory valuation reserves.
The new revenue recognition standard provides a five-step analysis of transactions to determine when and how revenue is recognized.
The core principle is that the Company will recognize revenue when the transfer of promised
In August 2015, the FASB issued ASU 2015‑14 Revenue from Contracts with Customers (Topic 606), which delayed the effective date of ASU 2014‑09 by one year.
With the deferral, the revenue recognition standard is effective for annual reporting periods beginning after December 15, 2017, including interim reporting periods, with early adoption permitted.
This standard and subsequent amendments allow for either full retrospective or modified retrospective adoption.
ASU 2014‑09 will impact the recognition timing or classification of revenues and expenses for the loyalty program (by using the deferred revenue method instead of the incremental cost method), private label credit card and co-branded credit card programs (by recognizing amounts earned under the programs as revenue instead of as a reduction of SG&A expenses), gift card breakage (by including breakage within net sales instead of SG&A expenses under the proportional model), sales refund reserve (by grossing up the balance sheet to record a refund obligation and right of return asset instead of recognizing revenue net of returns), and e-commerce operations (by recognizing revenue upon shipment, when control of the merchandise transfers to the customer, instead of upon receipt by the customer).
Upon adoption, the Company will recognize the cumulative effect of adopting this standard as an adjustment to the opening balance of retained earnings.
Prior periods will not be retrospectively adjusted.
The Company expects this adjustment will decrease the fiscal 2018 opening balance of retained earnings by $15,000 to $20,000, which is primarily related to the change in accounting for the loyalty program from the incremental cost method to the deferred revenue method as required by this standard.
This standard will change the way all leases of one year or more are treated.
An excerpt. Shown here: 40 of 300 rewritten, 40 of 241 added and 40 of 142 removed. The counts are complete. For every sentence, read Item 15. Exhibits and Financial Statement Schedules in the FY2019 filing and the FY2018 filing.
Item 16. Form 10-K Summary
11 rewritten, 1 added, 5 removed, 37 unchanged
Pursuant to the requirements of Section 13 or 15(d) of the Securities Exchange Act of 1934, the registrant has duly caused this report to be signed on its behalf by the undersigned, thereunto duly authorized, in the City of Bolingbrook, State of Illinois, on April [removed: 3, 2018.][added: 2, 2019.]
| /s/ Mary N. Dillon | | Chief Executive Officer and | | April [removed: 3, 2018] [added: 2, 2019] |
| /s/ Scott M. Settersten | | Chief Financial Officer, Treasurer | | April [removed: 3, 2018] [added: 2, 2019] |
| /s/ Sally E. Blount | | Director | | April [removed: 3, 2018] [added: 2, 2019] |
| /s/ Michelle L. Collins | | Director | | April [removed: 3, 2018] [added: 2, 2019] |
| /s/ Dennis K. Eck | | Director | | April [removed: 3, 2018] [added: 2, 2019] |
| /s/ Catherine Halligan | | Director | | April [removed: 3, 2018] [added: 2, 2019] |
| /s/ Charles Heilbronn | | Director | | April [removed: 3, 2018] [added: 2, 2019] |
| /s/ Michael R. MacDonald | | Director | | April [removed: 3, 2018] [added: 2, 2019] |
| /s/ George Mrkonic | | Director | | April [removed: 3, 2018] [added: 2, 2019] |
| /s/ Lorna E. Nagler | | Director | | April [removed: 3, 2018] [added: 2, 2019] |
| /s/ Robert F. DiRomualdo | | Chairperson of the Board of Directors | | April 2, 2019 |
| /s/ Robert F. DiRomualdo | | Director | | April 3, 2018 |
| /s/ Charles J. Philippin | | Chairman of the Board of Directors | | April 3, 2018 |
| Charles J. Philippin | | | | |
| /s/ Vanessa A. Wittman | | Director | | April 3, 2018 |
| Vanessa A. Wittman | | | | |