 filings.tools
Vulcan Materials (VMC) 10-K risk factor changes: FY2017 vs FY2016
The 2017-12-31 10-K against the 2016-12-31 one, compared heading by heading and sentence by sentence. One of these filings carries no fiscal year tag, so its year is the calendar year of the period end.
Item 1A12 rewritten15 added1 removed96 unchanged
All filing items1,183 rewritten793 added562 removed2,655 unchanged
Summary
counted, not written
- Item 1A headings could not be compared: only 0 carried over between the two years, which usually means one filing was read wrongly, so none is reported as new or removed.
- Sentence by sentence, 793 added, 562 removed, 1,183 rewritten and 2,655 unchanged across 21 items that differ.
Sentences by item
22 items, with every count and a link to each item that changed
Underlined words on a shaded ground are new in FY2017; struck-through words were in FY2016. Sentences that are wholly new or wholly gone are labelled rather than marked.
Item 1A. RISK FACTORS
12 rewritten, 15 added, 1 removed, 96 unchanged
Changes in legal requirements and governmental policies concerning zoning, land use, [removed: environmental, international trade] [added: environmental] and other areas of the law may result in additional liabilities, a reduction in operating hours and additional capital expenditures — Our operations are affected by numerous federal, state and local laws and regulations related to zoning, land [removed: use, environmental,] [added: use] and [removed: international trade] [added: environmental] matters.
Stricter laws and regulations, or more stringent interpretations of existing laws or regulations, may impose new liabilities, taxes or tariffs on us, reduce operating hours, require additional investment by us in pollution control equipment, [added: create restrictions on our products] or impede our opening new or expanding existing plants or facilities.
These risks may include [removed: restrictive] [added: changes in international] trade policies, [added: such as the North American Free Trade Agreement,] imposition of duties, taxes or government [removed: royalties] [added: royalties, arbitrary changes to permits, zoning classifications] or [added: operating agreements, or] overt acts by foreign governments.
The expanded use of aggregates substitutes could have a material adverse effect on our business, financial condition and results of operations — Recycled concrete and asphalt [removed: mix] are increasingly being used in a number of our markets, particularly urban markets, as a substitute for aggregates.
The expanded use of recycled concrete and asphalt [removed: mix] could cause a significant reduction in the demand for aggregates.
Additionally, with regard to the acquisitions [added: (including Aggregates USA acquired in December 2017)] we are able to complete, our future results will depend in part on our ability to successfully integrate these businesses with our existing operations.
While we have not identified any events or changes in circumstances since our annual impairment test on November 1, [removed: 2016] [added: 2017] that indicate the fair value of any of our reporting units is below its carrying value, a significant downturn in the construction industry may have a material effect on the fair value of our reporting units.
A deterioration in our credit ratings and/or the state of the capital markets could negatively impact our business — We currently have [removed: $2] [added: $2.9] billion of debt with maturities between 2018 and [removed: 2037.][added: 2047.]
While we do not anticipate a credit ratings downgrade, and plan to manage [removed: the] [added: our] capital structure consistent with investment\-grade credit metrics, we cannot assure our current credit ratings.
| | § | | environmental compliance [added: costs] |
| Part I | [removed: 21] [added: 18] |
The costs of transporting our products could be negatively affected by factors outside of our control, including rail service interruptions or rate increases, tariffs, rising fuel [removed: costs] [added: costs, truck/railcar/barge shortages] and capacity constraints.
Our business may be materially affected by changes to fiscal and tax policies — The Tax Cuts and Jobs Act (TCJA) was enacted on December 22, 2017.
As explained in Note 9 “Income Taxes” in Item 8 “Financial Statements and Supplementary Data,” we have included provisional adjustments in the financial statements for certain projected impacts of the legislation and no adjustments for certain other aspects.
Our accounting for these items could be adjusted during the measurement period, which could be as late as December 2018.
In 2017, three state legislatures in Vulcan-served areas — California, Tennessee and South Carolina — passed new long-term highway funding legislation.
In 2016, three states saw one-time revenue increases for transportation and numerous ballot measures were passed to increase investment in several Vulcan-served areas including northern and southern California, Georgia, North Carolina and South Carolina.
The federal FAST Act, a five year, fully-funded road, bridge and public transportation authorization law, is providing assistance to state DOTs and metro areas.
However, given varying state and local budgetary situations and the associated pressure on infrastructure spending, we cannot be entirely assured of the existence, amount and timing of appropriations for future public infrastructure projects.
| | § | | business combinations and purchase price allocation |
| --- | --- | --- | --- |
Disputes with organized labor could disrupt our business operations — Labor unions represent approximately 11% of our workforce.
Disputes with our trade unions, or the inability to renew our labor agreements, may lead to strikes or other actions that could disrupt our business operations leading to higher costs and/or reduced revenues resulting in lower earnings.
Our construction paving business may subject us to contractually imposed penalties or lost profits — As a result of a 2017 acquisition, we operate a construction paving business in Tennessee.
In some instances, including many of our fixed price paving contracts, we agree to complete a project by a certain date.
If we fail to complete the project as scheduled, we may be held responsible for costs resulting from the delay.
Consequently, the total project cost could exceed our original estimate and we could experience reduced profits or even a loss on the project.
Although Congress passed and President Obama signed a five-year, fully\-funded bill into law to invest in roads, bridges and public transportation in 2015, and in 2016, three state legislatures in Vulcan\-served areas passed one-time revenue increases for transportation and ballot measures were also passed to increase investment transportation infrastructure in several Vulcan-served areas including northern and southern California, Georgia, North Carolina and South Carolina, given varying state and local budgetary situations and the associated pressure on infrastructure spending, we cannot be entirely assured of the existence, amount and timing of appropriations for future public infrastructure projects.
Item 7. MANAGEMENT'S DISCUSSION AND ANALYSIS OF FINANCIAL CONDITION AND RESULTS OF OPERATIONS
265 rewritten, 292 added, 224 removed, 664 unchanged
FINANCIAL SUMMARY FOR [removed: 2016] [added: 2017] (compared to [removed: 2015)][added: 2016)]
| | § | | Total revenues increased [removed: $170.5] [added: $297.6] million, or [removed: 5%,] [added: 8%,] to [removed: $3,592.7] [added: $3,890.3] million |
| | § | | Aggregates segment sales increased [removed: $184.1] [added: $134.3] million, or [removed: 7%,] [added: 5%,] to [removed: $2,961.8] [added: $3,096.1] million |
| | § | | Aggregates segment freight-adjusted revenues increased [removed: $181.8] [added: $98.5] million, or [removed: 9%,] [added: 4%,] to [removed: $2,294.2] [added: $2,392.7] million |
| | § | | Shipments increased [removed: 2%,] [added: 1%,] or [removed: 3.1] [added: 1.8] million tons, to [removed: 181.4] [added: 183.2] million tons |
| | § | | Freight-adjusted sales price increased [removed: 7%] [added: 3%, or $0.41 per ton] |
| | § | | Segment gross profit [removed: increased $117.5 million, or 16%, to $873.1 million and segment gross profit] margin was [added: 27.8%, compared to] 29.5% |
| [added: freight-adjusted revenues] | [removed: §] | | [removed: Incremental gross profit as a percentage of freight-adjusted revenues was] [added: n/a | | |] 64.6% | [added: | | | |]
| | § | | [removed: Asphalt Mix,] [added: Asphalt,] Concrete and Calcium segment gross profit increased [removed: $25.8] [added: $12.8] million, [added: or 10%, to $140.5 million,] collectively |
| | § | | [removed: SAG] [added: Selling, administrative and general (SAG) expenses] increased [removed: $28.1] [added: 3% to $323.9] million and [removed: 0.4] [added: decreased 0.45] percentage points [removed: (40] [added: (45] basis points) as a percentage of total revenues |
| | § | | Earnings from continuing operations were [removed: $422.4] [added: $593.4] million, or [removed: $3.11] [added: $4.40] per diluted share, compared to [removed: earnings of $232.9] [added: $422.4] million, or [removed: $1.72] [added: $3.11] per diluted share |
| | § | | Discrete items in [removed: 2015] [added: 2017] include: |
| | § | | Net earnings were [removed: $419.5] [added: $601.2] million, an increase of [removed: $198.3] [added: $181.7] million, or [removed: 90%] [added: 43%] |
| | § | | Adjusted EBITDA was [removed: $966.0] [added: $981.9] million, an increase of [removed: $131.1] [added: $15.9] million, or [removed: 16%] [added: 2%] |
| | § | | [removed: Increased return of] [added: Returned] capital to shareholders via [removed: higher] dividends [removed: ($106.3] [added: ($132.3] million versus [removed: $53.2] [added: $106.3] million) and share repurchases [removed: ($161.5] [added: ($60.3] million versus [removed: $21.5] [added: $161.5] million) |
][added: 9](https://www.sec.gov/Archives/edgar/data/1396009/000139600918000011/vmc-20171231x10kg007.jpg)]
][added: 37](https://www.sec.gov/Archives/edgar/data/1396009/000139600918000011/vmc-20171231x10kg018.jpg)]
[removed: SELLING, ADMINISTRATIVE AND GENERAL (SAG) PRODUCTIVITY][added: | Selling, administrative and general expenses | | | $ 323.9 | | | $ 315.0 | | | $ 286.8 | |]
Over [removed: the years, nearly] [added: our more than] six [removed: decades,] [added: decades as a public company,] we have built a strong, resilient and vital business on this foundation of doing things the right way.
| | § | | [removed: Asphalt Mix, Concrete and Calcium segment] [added: High single-digit] gross profit growth [removed: of approximately 15%] [added: in Asphalt, Concrete and Calcium segments, collectively] |
[removed: | | § | | Core] [added: We expect core] capital spending [removed: of approximately $300 million] [added: (necessary] to support [removed: the] [added: an] increased level of shipments and further improve production costs and operating [removed: efficiencies |][added: efficiencies) of approximately $250 million.]
| | § | | Depreciation, depletion, accretion and amortization expense of approximately [removed: $300] [added: $340] million |
| | § | | [removed: Effective] [added: An effective] tax rate of [removed: 28%] [added: approximately 20%] |
][added: 38](https://www.sec.gov/Archives/edgar/data/1396009/000139600918000011/vmc-20171231x10kg019.jpg)]
| dollars in millions | | | [removed: 2016] [added: 2017] | | | [removed: 2015] [added: 2016] | | | [removed: 2014] [added: 2015] | |
| Gross profit | | | $ [removed: 1,000.8] [added: 1,000.6] | | | $ [removed: 857.5] [added: 1,000.8] | | | $ [removed: 587.6] [added: 857.5] | |
| Total revenues | | | $ [removed: 3,592.7] [added: 3,890.3] | | | $ [removed: 3,422.2] [added: 3,592.7] | | | $ [removed: 2,994.2] [added: 3,422.2] | |
| Gross profit margin | | | [removed: 27.9%] [added: 25.7%] | | | [removed: 25.1%] [added: 27.9%] | | | [removed: 19.6%] [added: 25.1%] | |
| Freight and delivery revenues 1 | | | [removed: 536.0] [added: 528.9] | | | [removed: 538.1] [added: 536.0] | | | [removed: 473.1] [added: 538.1] | |
| Total revenues excluding freight and delivery revenues | | | $ [removed: 3,056.7] [added: 3,361.4] | | | $ [removed: 2,884.1] [added: 3,056.7] | | | $ [removed: 2,521.1] [added: 2,884.1] | |
| Gross profit margin excluding freight and delivery revenues | | | [removed: 32.7%] [added: 29.8%] | | | [removed: 29.7%] [added: 32.7%] | | | [removed: 23.3%] [added: 29.7%] | |
| Gross profit | | | $ [removed: 873.1] [added: 860.0] | | | $ [removed: 755.7] [added: 873.1] | | | $ [removed: 544.1] [added: 755.7] | |
| Segment sales | | | $ [removed: 2,961.8] [added: 3,096.1] | | | $ [removed: 2,777.8] [added: 2,961.8] | | | $ [removed: 2,346.4] [added: 2,777.8] | |
| Gross profit margin | | | [removed: 29.5%] [added: 27.8%] | | | [removed: 27.2%] [added: 29.5%] | | | [removed: 23.2%] [added: 27.2%] | |
| Incremental gross profit margin | | | [removed: 63.8%] [added: n/a] | | | [removed: 49.1%] [added: 63.8%] | | | | |
| Freight, delivery and transportation revenues 1 | | | [removed: 651.9] [added: 670.7] | | | [removed: 644.7] [added: 651.9] | | | [removed: 532.2] [added: 644.7] | |
| Other revenues | | | [removed: 15.7] [added: 32.7] | | | [removed: 20.6] [added: 15.7] | | | [removed: 20.2] [added: 20.6] | |
| Freight-adjusted revenues | | | $ [removed: 2,294.2] [added: 2,392.7] | | | $ [removed: 2,112.5] [added: 2,294.2] | | | $ [removed: 1,794.0] [added: 2,112.5] | |
| freight-adjusted revenues | | | [removed: 38.1%] [added: 35.9%] | | | [removed: 35.8%] [added: 38.1%] | | | [removed: 30.3%] [added: 35.8%] | |
[removed: Cash] [added: Aggregates segment cash] gross profit per ton is computed by dividing [added: Aggregates segment] cash gross profit by tons shipped.
| | § | | Gross profit decreased $0.3 million to $1,000.6 million |
| | § | | Segment gross profit decreased $13.1 million, or 2%, to $860.0 million |
| | § | | Operating earnings decreased $32.5 million, or 5%, to $647.1 million |
| | § | | $297.0 million of net tax benefits (including $268.2 million related to the Tax Cuts and Jobs Act (TCJA) and a $28.8 million partial release of a net operating loss (NOL) carryforward valuation allowance) |
| | § | | pretax interest charges of $153.1 million related to the July and December debt purchases ($148.0 million) and carried interest on the March debt issuance ($5.1 million) |
| | § | | pretax gains of $10.5 million for the sale of real estate and businesses |
| | § | | pretax charges of $4.3 million for property donation |
| | § | | pretax charges of $18.1 million for divested operations |
| | § | | pretax charges of $6.7 million for one-time employee bonuses |
| | § | | pretax charges of $3.1 million associated with business development, net of an asset purchase agreement termination fee |
| | § | | pretax charges of $1.9 million for restructuring |
| | § | | $11.3 million of tax benefits |
| | § | | pretax gains of $16.2 million on the sale of real estate |
| | § | | pretax gains of $11.0 million for business interruption claims |
| | § | | pretax charges of $16.9 million for divested operations |
2017 results were negatively impacted by unusually harsh weather: severe flooding in California during the first quarter; extreme rainfall in core Southeastern markets (Alabama, Florida, Georgia, Louisiana and Mississippi) during the second quarter; and hurricanes (Harvey and Irma)/tropical storm (Nate) conditions across our Florida, Georgia, Gulf Coast, North Carolina, South Carolina and coastal Texas markets during the third quarter; and their lingering effects on costs into the fourth quarter.
| Part II | 28 |
We closed the acquisition of Aggregates USA on December 29, 2017 for $616 million (net of $287 million immediately disposed and including $6 million of liabilities assumed).
This transaction complements and expands our service offerings in Georgia, South Carolina and Florida with 3 granite quarries and 16 rail distribution yards.
The integration is proceeding as planned.
Although full synergy capture will require at least 18 to 24 months, we still expect this acquisition to be accretive to 2018 earnings ($50 million of EBITDA).
For the full year, capital expenditures were $464.2 million.
This amount included $296.5 million of core operating and maintenance capital investments to improve or replace existing property, plant & equipment, in line with expectations.
In addition, we invested $167.7 million in internal growth projects to secure new aggregates reserves, develop new production sites, enhance our distribution capabilities and support the targeted growth of our asphalt and concrete operations.
At the end of the fourth quarter, total debt was $2,854.9 million and cash and cash equivalents was $141.6 million.
In 2017, we early retired $1,087.4 million of notes due in 2021 and 2018 for $1,228.2 million.
One-time interest charges related to these early debt retirements were $148.0 million.
In December, we also entered into a 6-month $350.0 million term loan that we refinanced on a long-term basis in February 2018.
Our record safety performance in 2017 reinforces our confidence that our core operating disciplines remain strong.
2017 ACQUISITIONS
We continue to pursue opportunities for value-creating acquisitions, swaps and greenfield investments.
We completed a number of important bolt-on acquisitions, making attractive additions to our coast-to-coast footprint in states ranging from Georgia to California and up to Illinois and Virginia.
Of particular note was the acquisition of Aggregates USA, which added approximately 460 million tons of proven and probable reserves to our leading reserve base and further strengthened our best-in-class distribution network, adding 16 new rail distribution yards in our Florida, Georgia and South Carolina markets.
We will continue to make disciplined investments in organic and acquisition-led growth, while continuing to emphasize capital returns and cost control.
We are completely focused on actions that improve returns to our shareholders.
We seek continuous, compounding improvement, generating big results through small actions.
| | § | | deploying operating capital to sustain our franchise |
| | § | | maintaining the financial strength and flexibility needed through the cycle |
| | § | | strategic growth through mergers and acquisitions and internal development |
| | § | | returning excess cash to shareholders through a healthy mix of sustainable dividend growth and stock repurchases |
| | § | | Gross profit increased $143.3 million, or 17%, to $1,000.8 million |
| | § | | $36.1 million of tax benefits (including $24.8 million of excess tax benefits for share-based compensation), a pretax gain of $16.2 million on the sale of real estate, a pretax gain of $11.0 million for business interruption claims, pretax charges of $16.9 million for divested operations and pretax losses of $10.5 million from asset impairment |
| | § | | a $6.5 million tax charge for a foreign tax credit carryforward impairment, a $4.7 million tax benefit for a partial release of the Alabama NOL carryforward valuation allowance, a pretax charge of $67.1 million for debt purchase costs, a pretax gain of $6.3 million for the sale of real estate and businesses, a pretax charge of $7.1 million for divested operations, a pretax loss of $5.2 million for asset impairment and a pretax charge of $5.0 million for restructuring |
KEY DRIVERS OF VALUE CREATION
*Source: Moody's Analytics
OUR FIVE CORE DISCIPLINES
1.
SALES AND MARKETING EXCELLENCE
Goal: Remain the market supplier of choice in order to increase our market share while earning full and fair value for our products and services.
Execution: We are winning more than our fair share of large project bids by leveraging our scale and extensive strong customer relationships.
2.
OPERATIONAL EXCELLENCE
Goal: Run the industry’s safest and most efficient operations by successfully leveraging and driving cost efficiencies to achieve 60% flow through of incremental aggregates freight-adjusted revenues.
Execution: We are driving our cost of revenues down by leveraging our purchasing power and multi-modal logistics network and by better managing inventory levels.
In 2016 and 2015, we exceeded our long-term flow through goal of 60% by achieving 65% and 67%, respectively, flow through of incremental aggregates freight-adjusted revenues.
3.
Goal: Continue to leverage SAG in order to achieve 6% of total revenues.
Execution: We are leveraging our recently implemented common ERP platform and reorganized central shared services to reduce administrative expenses and enable rapid integration of acquired operations.
As a result, SAG as a percentage of total revenues has decreased from 9.1% in 2014 to 8.8% in 2016.
4.
CAPITAL PRODUCTIVITY
Goal: Drive improvement in capital turnover while maintaining the longer term health of our asset base.
Execution: We are improving capital turnover by maximizing the lifecycle value of land holdings and optimizing working capital and inventory levels.
5.
PORTFOLIO MANAGEMENT
Goal: Continue to pursue attractive bolt-on acquisitions and selectively enter new markets that meet our growth profile while divesting non-core businesses.
Execution: In 2016, we expanded our aggregates distribution capabilities in Georgia and completed two strategic bolt-on acquisitions in New Mexico and Texas.
In 2015, we completed a swap of twelve ready-mixed concrete plants in California for thirteen asphalt plants primarily in Arizona.
We also acquired three aggregates facilities and seven ready-mixed concrete plants in Arizona and New Mexico.
We believe our ability to succeed stems directly from these commitments.
We expect this to continue for the decades to come.
2016 ACQUISITIONS
During 2016, we acquired the assets of the following businesses for total consideration of $33.3 million:
| | § | | an asphalt plant in New Mexico |
| | § | | an aggregates facility in Texas |
| | § | | a distribution business in Georgia to complement our aggregates logistics and distribution activities |
The strong fundamentals of our aggregates-focused business and the outstanding improvement in our core profitability have led to strong earnings growth during the last three years of recovery.
In 2017, we expect continued growth across the vast majority of our markets and across each of the end use segments we serve.
Our expectation for full year Adjusted EBITDA of $1.125 to $1.225 billion is driven by a continuing recovery in shipments, with higher levels of publicly funded construction activity just beginning to join the ongoing recovery in private demand, as well as a favorable pricing environment.
The following assumptions support our outlook for strong year-over-year growth in Adjusted EBITDA in 2017:
An excerpt. Shown here: 40 of 265 rewritten, 40 of 292 added and 40 of 224 removed. The counts are complete. For every sentence, read Item 7. MANAGEMENT'S DISCUSSION AND ANALYSIS OF FINANCIAL CONDITION AND RESULTS OF OPERATIONS in the FY2017 filing and the FY2016 filing.
Item 7A. QUANTITATIVE AND QUALITATIVE DISCLOSURES ABOUT MARKET RISK
5 rewritten, 0 added, 0 removed, 18 unchanged
In addition to floating-rate [removed: borrowings under our line of credit,] [added: borrowings,] we at times use interest rate swaps to manage the mix of fixed-rate and floating-rate debt.
[removed: Since 2002,] [added: Over time,] our EBITDA and [removed: Operating] [added: operating] income are positively correlated to floating interest rates (as measured by 3-month LIBOR).
At December 31, [removed: 2016,] [added: 2017,] the estimated fair value of our long-term debt including current maturities was [removed: $2,243.4] [added: $3,024.8] million compared to a book value of [removed: $1,982.9] [added: $2,854.9] million.
The effect of a decline in interest rates of one percentage point would increase the fair value of our debt by approximately [removed: $104.9] [added: $236.9] million.
The impact of a change in these assumptions on our annual pension and other postretirement [removed: benefit] [added: benefits] costs is discussed in greater detail within the Critical Accounting Policies section of this Annual Report.
Item 1. BUSINESS
70 rewritten, 36 added, 76 removed, 335 unchanged
][added: 13](https://www.sec.gov/Archives/edgar/data/1396009/000139600918000011/vmc-20171231x10kg001.jpg)]
Vulcan-served states are estimated to generate 79% of the total growth in U.S. population and [removed: 71%] [added: 70%] of the total growth in U.S. household formations between [removed: 2015] [added: 2018] and [removed: 2025.][added: 2028.]
| | VULCAN’S TOP TEN REVENUE PRODUCING STATES IN [removed: 2016] [added: 2017] | | | | | | | | | | | |
| | [removed: 2.] [added: 3.] | [removed: California] [added: Virginia] | | | | [removed: 7.] [added: 8.] | | North Carolina | | | | |
| | 4. | [removed: Georgia] [added: Tennessee] | | | | 9. | | South Carolina | | | | |
| | 5. | [removed: Florida] [added: Georgia] | | | | 10. | | Illinois | | | | |
Our top ten revenue producing states accounted for [removed: 84%] [added: 85%] of our [removed: 2016] [added: 2017] revenues while our top five accounted for [removed: 59%.][added: 60%.]
Approximately 80% of our total aggregates shipments are delivered exclusively from the producing location to the customer by truck, and another [removed: 16%] [added: 15%] are delivered by truck after reaching a sales yard by rail or water.
The remaining [removed: 4%] [added: 5%] of aggregates shipments are delivered directly to the customer by rail or water.
BUSINESS STRATEGY [removed: AND COMPETITIVE ADVANTAGE]
Our downstream businesses (asphalt [removed: mix] and concrete) use Vulcan-produced aggregates almost exclusively.
We are the largest aggregates supplier in the U.S. Our [removed: 337] [added: 375] active aggregates facilities as of December 31, [removed: 2016,] [added: 2017,] provide opportunities to standardize operating practices and procure equipment (fixed and mobile), parts, supplies and services in an efficient and cost-effective manner, both regionally and nationally.
[removed: ][added: 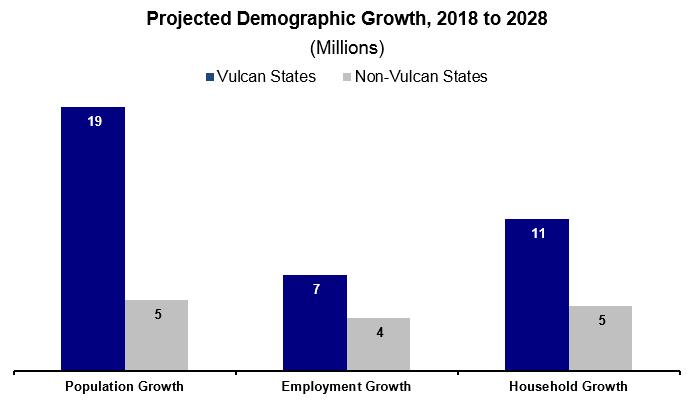]
Strategic acquisitions AND DISPOSITIONS: Since becoming a public company in [removed: 1956,] [added: 1957,] Vulcan has principally grown by mergers and acquisitions.
| | § | | Reinvestment opportunities with high returns: Demand for our products is dependent on construction activity and correlates positively with changes in population growth, household formation and employment. During the period [removed: 2015] [added: 2018] - [removed: 2025,] [added: 2028,] Moody's Analytics projects that 79% of the U.S. population growth, [removed: 71%] [added: 70%] of household formation and [removed: 63%] [added: 64%] of new jobs will occur in Vulcan-served states. The close proximity of our production facilities and our aggregates reserves to this projected population growth creates many opportunities to invest capital in high-return projects — projects that will add reserves, increase production capacity and [removed: improve] [added: decrease] costs. |
][added: 11](https://www.sec.gov/Archives/edgar/data/1396009/000139600918000011/vmc-20171231x10kg003.jpg)]
Source: Moody’s Analytics as of December [removed: 12, 2016][added: 13, 2017]
][added: 5](https://www.sec.gov/Archives/edgar/data/1396009/000139600918000011/vmc-20171231x10kg004.jpg)]
| | § | | Price for Service — We seek to receive full and fair value for the quality of products and [removed: service] [added: services] we provide. We should be paid appropriately for helping our customers be successful. [added: Our expanding margins will continue to benefit from the compounding pricing gains associated with cyclical recoveries.] |
| | § | | Operating Efficiency and Leverage — We focus on rigorous cost management throughout the economic cycle. Small savings per ton add up to significant cost reductions. [added: We are operating a capital-intensive business well below full capacity and are extremely well positioned to further leverage fixed costs to sales as we move forward.] |
| | § | | Sales and Production Mix — We adjust production levels to meet varying market conditions. Managing inventories responsibly results in improved cost performance and an improved return on capital. [added: As the recovery continues and as we see a larger portion of new construction activity in the end-use mix, we will sell the entire production mix much more efficiently and at fuller value.] |
][added: 12](https://www.sec.gov/Archives/edgar/data/1396009/000139600918000011/vmc-20171231x10kg005.jpg)]
| | 4. | | Calcium – less than 1% of [removed: 2016’s] [added: 2017’s] total revenues [added: and less than 1% of gross profit] |
| | § | | Local markets: Aggregates have a high weight-to-value ratio and, in most cases, must be produced near where they are used; if not, transportation can cost more than the materials, rendering them uncompetitive compared to locally produced materials. Exceptions to this typical market structure include areas along the U.S. Gulf Coast and the Eastern Seaboard where there are limited supplies of locally available high-quality aggregates. We serve these markets from quarries that have access to [added: cost-effective] long-haul transportation — shipping by barge and rail — and from our quarry on Mexico’s Yucatan Peninsula with our fleet of Panamax-class, self-unloading ships. |
| | § | | Location [removed: and quality] of reserves: We currently have [removed: 15.5] [added: 16.0] billion tons of permitted and proven or probable aggregates reserves. The bulk of these reserves are located in areas where we expect greater than average rates of growth in population, jobs and households, which require new infrastructure, housing, offices, schools and other development. Zoning and permitting regulations in some markets have made it increasingly difficult for the aggregates industry to expand existing quarries or to develop new quarries. These restrictions curtail expansion in certain areas, but they also increase the value of our reserves at existing locations. |
| | § | | Highly fragmented industry: The U.S. aggregates industry is composed of over [removed: 6,000] [added: 5,700] companies that manage more than [removed: 11,000] [added: 10,000] operations. This fragmented structure provides many opportunities for consolidation. Companies in the industry commonly enter new markets or expand positions in existing markets through the acquisition of existing facilities. |
In [removed: 2016,] [added: 2017,] publicly funded construction accounted for approximately [removed: 47%] [added: 46%] of our total aggregates shipments, and approximately [removed: 26%] [added: 24%] of our aggregates sales by volume were used in highway construction projects.
| | § | | Public Sector Funding: Generally, public sector construction spending is more stable than private sector construction spending; public sector spending is less sensitive to interest rates and spending has historically been supported by multi-year laws, which provide certainty [removed: and] [added: in] funding amounts, program structures, and rules and regulations. Federal spending is governed by authorization, budget and appropriations laws. The level of state and local spending on infrastructure varies across the United States and depends on individual state needs and economies. [removed: Since 2013, seventeen states have increased taxes on] [added: In 2017, seven state legislatures voted to raise] motor fuel [removed: to support needed] [added: taxes for] transportation [removed: investments.] [added: investments, bringing the total to 31 states since 2012. States are also raising revenues through one-time increases in revenues outside of fuel taxes.] In [removed: 2016, five state legislatures] [added: the 2017 general election, voters in twenty states] approved [removed: one-time funding for transportation, and three state legislatures passed bills providing recurring funding resources. To cap off state and] [added: more than 80% of] local [removed: action, 2016 was another banner election year for transportation-related measures at the] [added: transportation investment] ballot [removed: box:] [added: measures; since 2007,] 74% of [removed: local and state] [added: more than 1,200] measures [removed: passed — consistent with the trend of the last 10 years.] [added: have been approved.] |
The long-term nature of the FAST [removed: Act, which authorizes federal funding through FFY 2020,] [added: Act] is important.
| | § | | WATER INFRASTRUCTURE: The Water Infrastructure Improvements for the Nation Act of 2016 (WIIN), which we and numerous other business allies strongly supported, was signed into law in December 2016. This law is the successor to the Water Resources Reform and Development Act of 2014 (WRRDA). It reauthorizes needed investment in America’s ports, channels, locks, dams, and other infrastructure that supports the maritime and waterways transportation system and provides flood protection for communities. It also provides funding to the Water Infrastructure Financing and Innovation Act (WIFIA), which was modeled after the highly popular TIFIA program in the surface transportation sector. Created in [removed: WRRDA 2014,] [added: WRRDA,] WIFIA will allow for federal credit assistance to water resources projects in the form of low-cost loans, loan guarantees and lines of credit. |
In [removed: 2016,] [added: 2017,] privately-funded construction accounted for approximately [removed: 53%] [added: 54%] of our total aggregates shipments.
Nonresidential construction is expected to continue to be a stable source of volume growth in [removed: 2017] [added: 2018] based on the following assumptions: (1) continuing employment growth should provide support, as it has in the past, (2) current backlogs that our customers, industry groups and outside economists are reporting should continue to be a source of [removed: demand in 2017,] [added: demand,] and (3) [removed: growing state and local] [added: with a stable] tax [removed: revenues should provide] [added: base,] local governments [removed: with the] [added: should use] funds to make capital investments in schools and other public nonresidential facilities to meet the needs of a growing population.
| | § | | Residential Construction: [added: Household formations in our markets continue to outpace household formations in the rest of the United States.] The majority of residential construction is for single-family housing with the remainder consisting of multi-family construction (i.e., two family houses, apartment buildings and condominiums). Public housing comprises only a small portion of housing demand. [removed: Household formations in our markets continue to outpace household formations in the rest of the United States.] Construction activity in this end market is influenced by the cost and availability of mortgage financing and builders’ ability to maintain skilled labor. |
U.S. housing starts, as measured by Dodge [added: Data &] Analytics data, peaked in early 2006 at over 2 million units annually.
Housing [removed: growth was] [added: starts were] particularly robust in our markets, which grew at almost twice the rate of the nation as a whole.
While aggregates is our focus and primary business, we believe vertical integration between aggregates and downstream products, such as asphalt mix and ready-mixed concrete, can be managed effectively in certain markets [removed: to generate] [added: generating] acceptable financial [removed: returns.][added: returns and enhancing financial returns in our core Aggregates segment.]
We produce and sell asphalt mix and/or ready-mixed concrete primarily in our mid-Atlantic, Georgia, [removed: Southwestern] [added: Southwestern, Tennessee] and Western markets.
ASPHALT [removed: MIX]
We produce and sell asphalt mix in Arizona, California, New [removed: Mexico] [added: Mexico, Tennessee] and Texas.
We meet the aggregates requirements for our Asphalt [removed: Mix] segment primarily through our Aggregates segment.
Delivered by trucks, ships, barges and trains, our products are the indispensable materials building homes, offices, places of worship, schools, hospitals and factories, as well as vital infrastructure including highways, bridges, roads, ports and harbors, water systems, campuses, dams, airports and rail networks.
As of December 31, 2017, we had 375 active aggregates facilities, 64 asphalt facilities and 57 concrete facilities.
In 2017, we made a number of bolt-on acquisitions, making attractive additions to our coast-to-coast footprint in states ranging from Georgia to California and up to Illinois and Virginia.
We added approximately 615 million tons of proven and probable reserves to our leading reserve base, further strengthened our best-in-class aggregates distribution network (adding 16 new rail yards in our Florida, Georgia and South Carolina markets) and added asphalt operations in Tennessee to take further advantage of our strong aggregates position.
We own or lease well over 200,000 acres of land, and we manage it carefully throughout all phases of its productive use.
As a land-based company, we feel a special responsibility to the environment and the communities around us.
| | 1. | California | | | | 6. | | Florida | | | | |
| | 2. | Texas | | | | 7. | | Arizona | | | | |
In 2017, we swapped our concrete operations in Arizona for strategic asphalt operations also in Arizona.
Additionally, we strengthened our positions in our top ten revenue producing states via bolt-on acquisitions in California, Texas, Virginia, Tennessee, Georgia, Florida, Arizona, South Carolina and Illinois.
| | 1. | | Aggregates – 73% of 2017’s total revenues and 86% of gross profit |
| | 2. | | Asphalt – 16% of 2017’s total revenues and 9% of gross profit |
| | 3. | | Concrete – 11% of 2017’s total revenues and 5% of gross profit |
| | § | | power plants |
Through strategic acquisitions and investments, we have developed an unmatched coast-to-coast footprint of strategically located permitted reserves concentrated in and serving the nation’s key growth centers.
We have over 20,000 customers in 20 states, the District of Columbia, Mexico and the Bahamas.
The drivers underpinning demand recovery — and sustained, multi-year volume and pricing growth — remain firmly in place, in both the public and private sectors of the economy.
They include: population growth; gains in total employment and in household income and wages; a continuing increase in household formations; the growing need for additional housing stock and housing demand; a multi-year federal transportation law in place and continuing increases in transportation funding at state and local levels; record state tax receipts; public investment in infrastructure that is still well below the long-term trend-line, and increasing political awareness and acceptance of the need to invest in infrastructure.
In 2017, total annual housing starts in the U.S. reached almost 1.3 million units.
In December 2017, we strengthened our asphalt position in Arizona by swapping ready-mixed concrete operations for an asphalt mix operation.
In January 2017, we entered the Tennessee market through the acquisition of several asphalt mix operations and a construction paving business.
As noted above, in December 2017 we exited the Arizona ready-mixed concrete market via a swap for an asphalt mix operation continuing our strategy to focus on asphalt mix in that market.
In March 2017, we reentered the California ready-mixed concrete market through an acquisition.
Our Calcium segment is composed of a single calcium operation in Brooksville, Florida.
We generally ship our products upon receipt of a purchase order or in some cases simply a price quote.
Therefore, we do not have a significant order backlog.
| Thompson S. Baker II | Senior Vice President | 59 |
| 1 | These Division Presidents are designated as Executive Officers as a result of their significant policy-making function and direct reporting relationship to J. Thomas Hill. | |
Thompson S.
Baker II was elected Senior Vice President in March 2017.
He served in a number of positions with Vulcan, including President – Florida Rock Division, prior to serving as Chief Executive Officer of FRP Holdings, Inc. from October 2010 to March 2017 and President and Chief Executive Officer of Patriot Transportation Holding, Inc. from December 2014 to March 2017.
| Vulcan Materials Company | | | | | | $ 100.00 | | | $ 114.20 | | | $ 126.76 | | | $ 183.93 | | | $ 244.08 | | | $ 252.38 | |
| S&P 500 | | | | | | $ 100.00 | | | $ 132.40 | | | $ 150.54 | | | $ 152.65 | | | $ 170.96 | | | $ 208.23 | |
| Wilshire 5000 M&S | | | | | | $ 100.00 | | | $ 136.20 | | | $ 147.50 | | | $ 154.58 | | | $ 172.21 | | | $ 219.74 | |
| | | |
| --- | --- | --- |
As of December 31, 2016, we had 337 active aggregates facilities.
VULCAN’S VALUE PROPOSITION
We are the largest supplier of construction aggregates in the country with coast-to-coast aggregates operations.
Our leading position is based upon:
| | § | | a favorable geographic footprint serving nearly all key growth corridors and the most rapidly growing population centers |
| --- | --- | --- | --- |
| | § | | a pure-play aggregates business with one of the largest proven and probable reserve bases in the U.S. |
| | § | | strong local leadership and autonomy coupled with company-wide performance goals and improvement |
These factors, together with our strong operating expertise and price discipline, allowed us to deliver a 14% increase ($4.81 compared to $4.24) in Aggregates segment unit gross profit per ton in 2016.
| | 1. | Texas | | | | 6. | | Tennessee | | | | |
| | 3. | Virginia | | | | 8. | | Arizona | | | | |
| | |
| --- | --- |
In 2016, we expanded our aggregates distribution capabilities in Georgia and completed two strategic bolt-on acquisitions in New Mexico and Texas.
COAST-TO-COAST FOOTPRINT
In 2014, we completed eight transactions that expanded our aggregates business in Arizona, California, New Mexico, Texas, Virginia and Washington D.C. and our asphalt mix business in Arizona and New Mexico.
In 2015, we completed an asset exchange transaction in which we exited our ready-mixed concrete business in California and further expanded our asphalt mix business in Arizona.
For example, in 2016 we completed strategic bolt-on acquisitions in New Mexico and Texas.
The following graphic illustrates the projected growth (2015 – 2025) by key demographics for Vulcan-served states:
Source: Moody’s Analytics as of December 12, 2016.
Aggregates segment gross profit has grown at a significantly greater rate than volume over the past few years and we expect continuing improvement in unit profitability.
| | § | | On Price for Service — Our expanding margins will continue to benefit from the compounding pricing gains associated with cyclical recoveries. |
| | § | | On Operating Efficiency and Leverage — We are operating a capital-intensive business well below full capacity and are extremely well positioned to further leverage fixed costs to sales as we move forward. |
| | § | | On Sales and Production Mix — As the recovery continues and as we see a larger portion of new construction activity in the end-use mix, we will sell the entire production mix much more efficiently and at fuller value. |
COMPETITIVE ADVANTAGes
The competitive advantages of our aggregates focused business strategy include:
| | § | | largest aggregates supplier in the U.S. |
| | § | | high-growth markets requiring large amounts of aggregates to meet construction demand |
| | § | | diversified regional exposure |
| | § | | complementary asphalt mix and concrete businesses in select markets |
BETTER SALES AND SERVICE
| | § | | empowered local leadership teams with intimate knowledge of local markets, leveraged with the strength and knowledge of the largest aggregates supplier in the U.S. |
| | § | | extensive and advantaged logistics network (as shown on map on page 9) |
| | § | | benefits of scale in operations, procurement and administrative support |
| | § | | effective post-mining land management to generate significant additional value |
| | § | | tightly managed operational and overhead costs |
STRATEGICALLY LOCATED ASSETS
| | § | | reserves are primarily located in high-growth markets that require large amounts of aggregates to meet demand |
| | § | | zoning and permitting regulations in many metropolitan markets have made it increasingly difficult to expand existing quarries or to develop new quarries |
| | § | | such regulations, while potentially curtailing expansion in certain areas, could also increase the value of our reserves at existing locations |
An excerpt. Shown here: 40 of 70 rewritten, all 36 added and 40 of 76 removed. The counts are complete. For every sentence, read Item 1. BUSINESS in the FY2017 filing and the FY2016 filing.
Item 3. LEGAL PROCEEDINGS
1 rewritten, 0 added, 0 removed, 6 unchanged
We were not subject to any penalties in [removed: 2016] [added: 2017] for failure to disclose transactions identified by the Internal Revenue Service as abusive under Internal Revenue Code Section 6707A.
Cover and table of contents
25 rewritten, 6 added, 2 removed, 87 unchanged
| UNITED STATES SECURITIES AND EXCHANGE COMMISSION Washington, D.C. 20549 FORM 10-K ANNUAL REPORT PURSUANT TO SECTION 13 OR 15(d) OF THE SECURITIES EXCHANGE ACT OF 1934 For the Fiscal Year Ended December 31, [removed: 2016] [added: 2017] Commission file number: 001-33841 VULCAN MATERIALS COMPANY (Exact Name of Registrant as Specified in Its Charter) | | |
| Indicate by check mark if the registrant is a well-known seasoned issuer, as defined in Rule 405 of the Securities Act. Yes ☒ No ☐ Indicate by check mark if the registrant is not required to file reports pursuant to Section 13 or [removed: section] [added: Section] 15(d) of the Act. Yes ☐ No ☒ Indicate by check mark whether the registrant: (1) has filed all reports required to be filed by Section 13 or 15(d) of the Securities Exchange Act of 1934 during the preceding 12 months (or for such shorter period that the registrant was required to file such reports), and (2) has been subject to such filing requirements for the past 90 days. Yes ☒ No ☐ Indicate by check mark whether the registrant has submitted electronically and posted on its corporate Web site, if any, every Interactive Data File required to be submitted and posted pursuant to Rule 405 of Regulation S-T [removed: (§232.405 of this chapter)] during the preceding 12 months (or for such shorter period that the registrant was required to submit and post such files). Yes ☒ No ☐ Indicate by check mark if disclosure of delinquent filers pursuant to Item 405 of Regulation S-K [removed: (§229.405)] is not contained herein, and will not be contained, to the best of registrant’s knowledge, in definitive proxy or information statements incorporated by reference in Part III of this Form 10-K or any amendment to this Form 10-K. ☒ Indicate by check mark whether the registrant is a large accelerated filer, an accelerated filer, a non-accelerated [removed: filer or] [added: filer,] a smaller reporting [added: company or an emerging growth] company. See the definitions of "large accelerated filer," "accelerated filer," [removed: and] "smaller reporting company" [added: and “emerging growth company”] in Rule 12b-2 of the Exchange Act (Check one): Large accelerated filer ☒ Accelerated filer ☐ [removed: Non-accelerated filer ☐] Smaller reporting company ☐ [added: Non-accelerated filer ☐] (Do not check if a smaller reporting company) [added: Emerging growth company ☐ If an emerging growth company, indicate by check mark if the registrant has elected not to use the extended transition period for complying with any new or revised financial accounting standards provided pursuant to Section 13(a) of the Exchange Act. ☐] Indicate by check mark whether the registrant is a shell company (as defined in Rule 12b-2 of the Act). Yes ☐ No ☒ | | |
| Aggregate market value of voting and non-voting common stock held by non-affiliates as of June 30, [removed: 2016:] [added: 2017:] | [removed: $15,976,104,960] [added: $16,712,817,912] |
| Number of shares of common stock, $1.00 par value, outstanding as of February [removed: 14, 2017:] [added: 13, 2018:] | [removed: 132,355,703] [added: 132,482,375] |
| Portions of the registrant’s annual proxy statement for the annual meeting of its shareholders to be held on May [removed: 12, 2017,] [added: 11, 2018,] are incorporated by reference into Part III of this Annual Report on Form 10-K. | |
| VULCAN MATERIALS COMPANY ANNUAL REPORT ON FORM 10-k fISCAL YEAR ENDED DECEMBER 31, [removed: 2016] [added: 2017] CONTENTs | | | |
| | 1A | [Risk Factors](#PartI_Item1A) | [removed: 19] [added: 18] |
| | 1B | [Unresolved Staff Comments](#PartI_Item1B) | [removed: 22] [added: 21] |
| | 2 | [Properties](#PartI_Item2) | [removed: 23] [added: 22] |
| | 3 | [Legal Proceedings](#PartI_Item3) | [removed: 26] [added: 25] |
| | 4 | [Mine Safety Disclosures](#PartI_Item4) | [removed: 26] [added: 25] |
| II | 5 | [Market for the Registrant’s Common Equity, Related Stockholder Matters and Issuer Purchases of Equity Securities](#PartII_Item5) | [removed: 27] [added: 26] |
| | 6 | [Selected Financial Data](#PartII_Item6) | [removed: 28] [added: 27] |
| | 7 | [Management’s Discussion and Analysis of Financial Condition and Results of Operations](#PartII_Item7) | [removed: 29] [added: 28] |
| | 9 | [Changes in and Disagreements with Accountants on Accounting and Financial Disclosure](#PartII_Item9) | [removed: 113] [added: 116] |
| | 9A | [Controls and Procedures](#PartII_Item9A) | [removed: 113] [added: 116] |
| | 9B | [Other Information](#PartII_Item9B) | [removed: 115] [added: 118] |
| III | 10 | [Directors, Executive Officers and Corporate Governance](#PartIII_Item10) | [removed: 116] [added: 119] |
| | 11 | [Executive Compensation](#PartIII_Item11) | [removed: 116] [added: 119] |
| | 12 | [Security Ownership of Certain Beneficial Owners and Management and Related Stockholder Matters](#PartIII_Item12) | [removed: 116] [added: 119] |
| | 13 | [Certain Relationships and Related Transactions, and Director Independence](#PartIII_Item13) | [removed: 116] [added: 119] |
| | 14 | [Principal Accounting Fees and Services](#PartIII_Item14) | [removed: 116] [added: 119] |
| IV | 15 | [Exhibits and Financial Statement Schedules](#PartIV_Item15) | [removed: 117] [added: 120] |
| | 16 | [Form 10-K Summary](#PartIV_Item16) | [removed: 117] [added: 120] |
| | § | | the impact of future regulatory or legislative actions, including those relating to climate change, [added: wetlands,] greenhouse gas [removed: emissions or] [added: emissions,] the definition of [removed: minerals] [added: minerals, tax policy or international trade] |
10-K 1 vmc-20171231x10k.htm 10-K
| | — | [Signatures](#Signatures) | 121 |
| | § | | the effect of changes in tax laws, guidance and interpretations, including those related to the Tax Cuts and Jobs Act that was enacted on December 22, 2017 |
| | § | | changing technologies could disrupt the way we do business and how our products are distributed |
| --- | --- | --- | --- |
| --- | --- | --- | --- |
10-K 1 vmc-20161231x10k.htm 10-K
| | — | [Signatures](#Signatures) | 118 |
Item 1B. UNRESOLVED STAFF COMMENTS
1 rewritten, 0 added, 0 removed, 4 unchanged
| Part I | [removed: 22] [added: 21] |
Item 2. PROPERTIES
28 rewritten, 18 added, 16 removed, 58 unchanged
[removed: ][added: 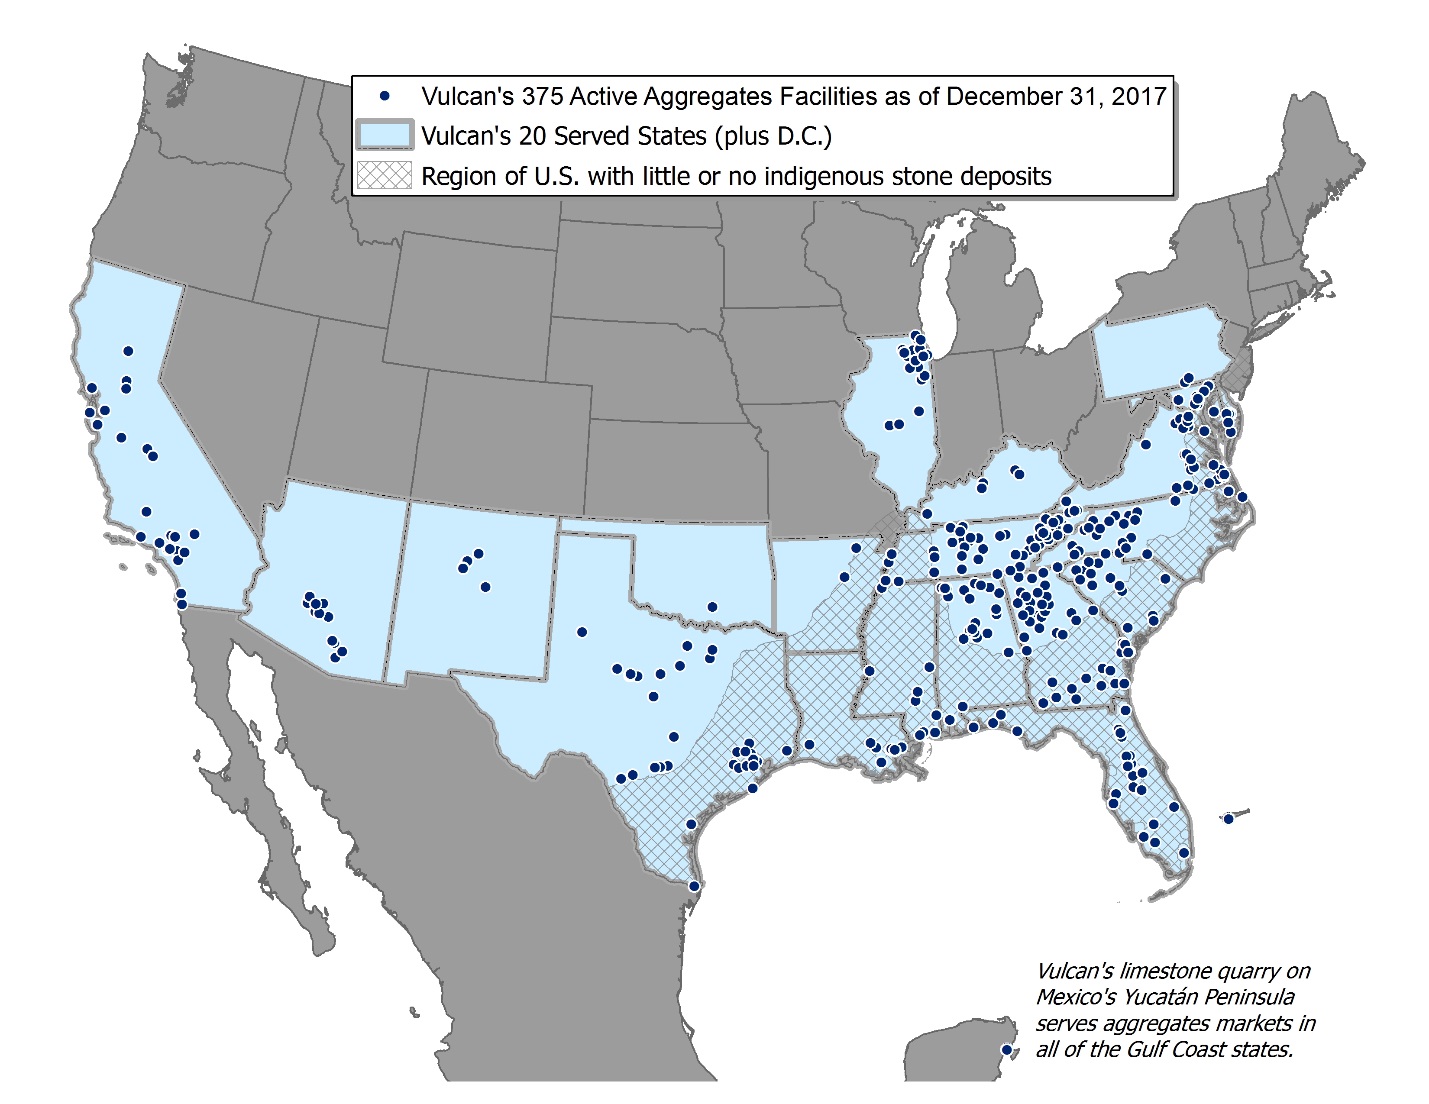]
Our current estimate of [removed: 15.5] [added: 16.0] billion tons of proven and probable aggregates reserves reflects [removed: a decrease] [added: an increase] of [removed: 0.2] [added: 0.5] billion tons from the prior year’s estimate.
The [removed: 15.5] [added: 16.0] billion tons of estimated proven and probable aggregates reserves reported at the end of [removed: 2016] [added: 2017] include reserves at inactive and greenfield (undeveloped) sites.
The table below presents, by division, the tons of proven and probable aggregates reserves as of December 31, [removed: 2016] [added: 2017] and the types of facilities operated.
| | | | Aggregates Reserves | | | | | | | | | [removed: 2016] [added: 2017] | | | | | | Sand and | | | | |
| 2 | In addition to the facilities included in the table above, we operated [removed: 29] [added: 36] recycled concrete plants which are not dependent on reserves. | |
| 3 | Includes a maximum of [removed: 364.0] [added: 352.0] million tons of reserves encumbered by volumetric production payments as defined in Note 1 "Summary of Significant Accounting Policies" in Item 8 "Financial Statements and Supplementary Data" under the caption Deferred Revenue. | |
Of the [removed: 15.5] [added: 16.0] billion tons of aggregates reserves at December 31, [removed: 2016, 8.7] [added: 2017, 8.9] billion tons or 56% are located on owned land and [removed: 6.8] [added: 7.1] billion tons or 44% are located on leased land.
None of our aggregates facilities, other than Playa del Carmen, contributed more than 5% to our total revenues in [removed: 2016.][added: 2017.]
| Playa del Carmen (Cancun), Mexico | | | | | | | | | | [removed: 578.3] [added: 566.8] | | | 0.0 | | | [removed: 578.3] [added: 566.8] | | | [removed: 13.7] [added: 11.5] | |
| DeKalb (Chicago), Illinois | | | | | | | | | | [removed: 161.3] [added: 108.1] | | | [removed: 193.7] [added: 150.0] | | | [removed: 355.0] [added: 258.1] | | | 0.3 | |
| Gold Hill (Charlotte), North Carolina | | | | | | | | | | [removed: 150.6] [added: 149.7] | | | 121.2 | | | [removed: 271.8] [added: 270.9] | | | 1.0 | |
| San Emidio (Bakersfield), California | | | | | | | | | | 250.0 | | | 0.0 | | | 250.0 | | | [removed: 1.4] [added: 1.3] | |
| Norcross (Atlanta), Georgia | | | | | | | | | | [removed: 192.8] [added: 189.7] | | | 27.7 | | | [removed: 220.5] [added: 217.4] | | | [removed: 2.5] [added: 3.0] | |
[removed: ASPHALT MIX,] [added: ASPHALT,] CONCRETE AND CALCIUM
As of December 31, [removed: 2016,] [added: 2017,] we operated a number of facilities producing asphalt mix, ready-mixed concrete and calcium in several of our divisions as reflected in the table below:
| | | | | | | | | | | | | | | | Asphalt [removed: Mix] [added: 2] | | | Concrete [removed: 2] [added: 3] | | | Calcium [removed: 3] [added: 4] | |
| Mideast | | | | | | | | | | | | | | | 0 | | | [removed: 33] [added: 32] | | | 0 | |
| Mountain West | | | | | | | | | | | | | | | [removed: 19] [added: 21] | | | [removed: 4] [added: 2] | | | 0 | |
| Southeast | | | | | | | | | | | | | | | 0 | | | [removed: 14] [added: 10] | | | 1 | |
| Western | | | | | | | | | | | | | | | [removed: 23] [added: 22] | | | [removed: 0] [added: 5] | | | 0 | |
| 1 | [removed: International, Central] [added: International] and Southern Gulf Coast Divisions have no [removed: asphalt mix,] [added: asphalt,] concrete or calcium facilities. |
| [removed: 2] [added: 3] | [removed: Comprised] [added: Southeast Division Concrete is comprised] of ready-mixed concrete facilities and 1 block [removed: plant in the Southeast Division.] [added: plant.] |
| [removed: 3] [added: 4] | Comprised of a ground calcium plant. |
The asphalt [removed: mix] and concrete facilities are able to meet their needs for raw material inputs with a combination of internally sourced and purchased raw materials.
| Brooksville | | | | | | | | | | | | [removed: 5.6] [added: 5.3] | | | 7.1 | | | [removed: 12.7] [added: 12.4] | | | 0.3 | |
The Brooksville limestone quarry has an average calcium carbonate (CaCO3) content of [removed: 98%.][added: 95%.]
| Part I | [removed: 25] [added: 22] |
| Central | | | 2,942.2 | | | 894.2 | | | 3,836.4 | | | 34.8 | | | 58 | | | 5 | | | 12 | |
| International | | | 566.8 | | | 0.0 | | | 566.8 | | | 11.5 | | | 1 | | | 0 | | | 0 | |
| Mideast | | | 2,443.2 | | | 1,003.7 | | | 3,446.9 | | | 35.3 | | | 35 | | | 6 | | | 23 | |
| Mountain West | | | 183.5 | | | 126.6 | | | 310.1 | | | 7.6 | | | 2 | | | 15 | | | 2 | |
| Southeast 3 | | | 3,109.4 | | | 871.5 | | | 3,980.9 | | | 41.5 | | | 43 | | | 13 | | | 24 | |
| Southern Gulf Coast | | | 1,252.3 | | | 30.3 | | | 1,282.6 | | | 13.2 | | | 20 | | | 1 | | | 23 | |
| Southwest | | | 1,229.5 | | | 9.5 | | | 1,239.0 | | | 20.7 | | | 15 | | | 1 | | | 19 | |
| Western | | | 797.5 | | | 503.7 | | | 1,301.2 | | | 20.4 | | | 6 | | | 13 | | | 2 | |
| Total | | | 12,524.4 | | | 3,439.5 | | | 15,963.9 | | | 185.0 | | | 180 | | | 54 | | | 105 | |
| | | | | | | | | | | Reserves at 12/31/2017 | | | | | | | | | 2017 | |
| Hanover (Harrisburg), Pennsylvania | | | | | | | | | | 229.1 | | | 236.4 | | | 465.5 | | | 2.8 | |
| McCook (Chicago), Illinois | | | | | | | | | | 110.3 | | | 266.5 | | | 376.8 | | | 4.0 | |
| Corona (Los Angeles), California | | | | | | | | | | 15.0 | | | 321.5 | | | 336.5 | | | 2.2 | |
| Postell (Macon), Georgia | | | | | | | | | | 199.1 | | | 72.3 | | | 271.4 | | | 5.0 | |
| Macon, Georgia | | | | | | | | | | 121.0 | | | 128.0 | | | 249.0 | | | 1.8 | |
| Central | | | | | | | | | | | | | | | 10 | | | 0 | | | 0 | |
| 2 | Central Division Asphalt is comprised of asphalt mix facilities and a construction paving business. |
| | | | | | | | | | | | | Reserves at 12/31/2017 | | | | | | | | | 2017 | |
| Central | | | 3,042.2 | | | 917.9 | | | 3,960.1 | | | 37.3 | | | 57 | | | 3 | | | 11 | |
| International | | | 578.3 | | | 0.0 | | | 578.3 | | | 13.7 | | | 1 | | | 0 | | | 0 | |
| Mideast | | | 2,416.5 | | | 1,057.3 | | | 3,473.8 | | | 33.4 | | | 35 | | | 3 | | | 23 | |
| Mountain West | | | 175.2 | | | 127.8 | | | 303.0 | | | 6.8 | | | 1 | | | 13 | | | 2 | |
| Southeast 3 | | | 2,697.0 | | | 827.3 | | | 3,524.3 | | | 38.8 | | | 40 | | | 14 | | | 8 | |
| Southern Gulf Coast | | | 1,182.4 | | | 30.5 | | | 1,212.9 | | | 13.0 | | | 22 | | | 0 | | | 21 | |
| Southwest | | | 1,122.6 | | | 10.1 | | | 1,132.7 | | | 20.2 | | | 17 | | | 1 | | | 17 | |
| Western | | | 818.5 | | | 509.5 | | | 1,328.0 | | | 20.3 | | | 5 | | | 13 | | | 1 | |
| Total | | | 12,032.7 | | | 3,480.4 | | | 15,513.1 | | | 183.5 | | | 178 | | | 47 | | | 83 | |
| | | | | | | | | | | Reserves at 12/31/2016 | | | | | | | | | 2016 | |
| Hanover (Harrisburg), Pennsylvania | | | | | | | | | | 270.5 | | | 274.4 | | | 544.9 | | | 2.7 | |
| McCook (Chicago), Illinois | | | | | | | | | | 101.1 | | | 271.2 | | | 372.3 | | | 7.7 | |
| Corona (Los Angeles), California | | | | | | | | | | 17.1 | | | 321.6 | | | 338.7 | | | 2.4 | |
| Macon, Georgia | | | | | | | | | | 122.7 | | | 128.0 | | | 250.7 | | | 1.4 | |
| 1604 Stone (San Antonio), Texas | | | | | | | | | | 216.0 | | | 0.0 | | | 216.0 | | | 2.9 | |
| | | | | | | | | | | | | Reserves at 12/31/2016 | | | | | | | | | 2016 | |
Item 4. MINE SAFETY DISCLOSURES
1 rewritten, 0 added, 0 removed, 5 unchanged
| Part I | [removed: 26] [added: 25] |
Item 5. MARKET FOR REGISTRANT'S COMMON EQUITY, RELATED STOCKHOLDER MATTERS
12 rewritten, 9 added, 10 removed, 27 unchanged
As of February [removed: 14, 2017,] [added: 13, 2018,] the number of shareholders of record was [removed: 2,843.][added: 2,714.]
The prices in the following table represent the high and low sales prices for our common stock as reported on the New York Stock Exchange and the quarterly dividends declared by our Board of Directors in [removed: 2016] [added: 2017] and [removed: 2015.][added: 2016.]
On February [removed: 10, 2017,] [added: 9, 2018,] our Board declared a dividend of [removed: twenty-five] [added: 28] cents per share for the first quarter of [removed: 2017.][added: 2018.]
This represents a [removed: five] [added: 3] cent [added: (12%)] per share increase over the prior quarter.
Purchases of our equity securities during the quarter ended December 31, [removed: 2016] [added: 2017] are summarized below.
| | [added: Total] | | | | | | Purchased as | | | Shares that [added: May] | |
| | Number of | | | Average | | | [removed: Announced] [added: Part of Publicly] | | | [added: Yet Be] Purchased | |
| | Shares | | | Price Paid | | | [added: Announced] Plans [removed: or] | | | Under the Plans | |
| Period | Purchased | | | Per Share | | | [added: or] Programs | | | or Programs 1 | |
| 1 | On February 10, 2006, our Board of Directors authorized us to purchase up to 10,000,000 [removed: shares. As] [added: shares] of [removed: December 31, 2016,] [added: our common stock. On February 10, 2017,] there were 1,756,757 shares remaining under this [removed: authorization. On February 10, 2017,] [added: authorization, and] our Board of Directors authorized us to purchase an additional 8,243,243 shares to refresh the number of shares we are authorized to purchase to 10,000,000. [added: As of December 31, 2017, there were 9,489,717 shares remaining under this authorization.] Depending upon market, business, legal and other conditions, we may purchase shares from time to time through the open market (including plans designed to comply with Rule 10b5-1 of the Securities Exchange Act of 1934) and/or through privately negotiated transactions. The authorization has no time limit, does not obligate us to purchase any specific number of shares, and may be suspended or discontinued at any time. | |
We did not have any unregistered sales of equity securities during the fourth quarter of [removed: 2016.][added: 2017.]
| Part II | [removed: 27] [added: 26] |
| 2017 | | | | | | | | |
| First quarter | $ 136.82 | | | $ 108.95 | | | $ 0.25 | |
| Second quarter | $ 134.92 | | | $ 116.26 | | | $ 0.25 | |
| Third quarter | $ 130.12 | | | $ 111.77 | | | $ 0.25 | |
| Fourth quarter | $ 129.63 | | | $ 115.01 | | | $ 0.25 | |
| 2017 | | | | | | | | | | | |
| Oct 1 - Oct 31 | 0 | | | $ 0.00 | | | 0 | | | 9,489,717 | |
| Nov 1 - Nov 30 | 0 | | | $ 0.00 | | | 0 | | | 9,489,717 | |
| Dec 1 - Dec 31 | 0 | | | $ 0.00 | | | 0 | | | 9,489,717 | |
| 2015 | | | | | | | | |
| First quarter | $ 86.25 | | | $ 64.28 | | | $ 0.10 | |
| Second quarter | $ 93.07 | | | $ 80.58 | | | $ 0.10 | |
| Third quarter | $ 102.65 | | | $ 84.10 | | | $ 0.10 | |
| Fourth quarter | $ 106.84 | | | $ 87.40 | | | $ 0.10 | |
| | Total | | | | | | Part of Publicly | | | May Yet Be | |
| 2016 | | | | | | | | | | | |
| Oct 1 - Oct 31 | 0 | | | $ 0.00 | | | 0 | | | 1,756,757 | |
| Nov 1 - Nov 30 | 0 | | | $ 0.00 | | | 0 | | | 1,756,757 | |
| Dec 1 - Dec 31 | 0 | | | $ 0.00 | | | 0 | | | 1,756,757 | |
Item 6. SELECTED FINANCIAL DATA
22 rewritten, 0 added, 0 removed, 17 unchanged
| | | | | [added: 2017 | | |] 2016 | | | 2015 | | | 2014 | | | 2013 | | [removed: | 2012 | |]
| Total revenues | | | $ | [removed: 3,592.7] [added: 3,890.3] | | $ | [removed: 3,422.2] [added: 3,592.7] | | $ | [removed: 2,994.2] [added: 3,422.2] | | $ | [removed: 2,770.7] [added: 2,994.2] | | $ | [removed: 2,567.3] [added: 2,770.7] | |
| Gross profit | | | $ | [removed: 1,000.8] [added: 1,000.6] | | $ | [removed: 857.5] [added: 1,000.8] | | $ | [removed: 587.6] [added: 857.5] | | $ | [removed: 426.9] [added: 587.6] | | $ | [removed: 334.0] [added: 426.9] | |
| Gross profit margin | | | | [added: 25.7% | | |] 27.9% | | | 25.1% | | | 19.6% | | | 15.4% | | [removed: | 13.0% | |]
| Earnings [removed: (loss)] from continuing operations 1 | | | $ | [removed: 422.4] [added: 593.4] | | $ | [removed: 232.9] [added: 422.4] | | $ | [removed: 207.1] [added: 232.9] | | $ | [removed: 20.8] [added: 207.1] | | $ | [removed: (53.9)] [added: 20.8] | |
| net of tax 2 | | | $ | [removed: (2.9)] [added: 7.8] | | $ | [removed: (11.7)] [added: (2.9)] | | $ | [removed: (2.2)] [added: (11.7)] | | $ | [removed: 3.6] [added: (2.2)] | | $ | [removed: 1.3] [added: 3.6] | |
| Net earnings [removed: (loss)] | | | $ | [removed: 419.5] [added: 601.2] | | $ | [removed: 221.2] [added: 419.5] | | $ | [removed: 204.9] [added: 221.2] | | $ | [removed: 24.4] [added: 204.9] | | $ | [removed: (52.6)] [added: 24.4] | |
| Continuing operations | | | $ | [removed: 3.17] [added: 4.48] | | $ | [removed: 1.75] [added: 3.17] | | $ | [removed: 1.58] [added: 1.75] | | $ | [removed: 0.16] [added: 1.58] | | $ | [removed: (0.42)] [added: 0.16] | |
| Discontinued operations | | | | [added: 0.06 | | |] (0.02) | | | (0.09) | | | (0.02) | | | 0.03 | | [removed: | 0.01 | |]
| Basic net earnings (loss) per share | | | $ | [removed: 3.15] [added: 4.54] | | $ | [removed: 1.66] [added: 3.15] | | $ | [removed: 1.56] [added: 1.66] | | $ | [removed: 0.19] [added: 1.56] | | $ | [removed: (0.41)] [added: 0.19] | |
| Continuing operations | | | $ | [removed: 3.11] [added: 4.40] | | $ | [removed: 1.72] [added: 3.11] | | $ | [removed: 1.56] [added: 1.72] | | $ | [removed: 0.16] [added: 1.56] | | $ | [removed: (0.42)] [added: 0.16] | |
| Discontinued operations | | | | [added: 0.06 | | |] (0.02) | | | (0.08) | | | (0.02) | | | 0.03 | | [removed: | 0.01 | |]
| Diluted net earnings (loss) per share | | | $ | [removed: 3.09] [added: 4.46] | | $ | [removed: 1.64] [added: 3.09] | | $ | [removed: 1.54] [added: 1.64] | | $ | [removed: 0.19] [added: 1.54] | | $ | [removed: (0.41)] [added: 0.19] | |
| Cash and cash equivalents | | | $ | [removed: 259.0] [added: 141.6] | | $ | [removed: 284.1] [added: 259.0] | | $ | [removed: 141.3] [added: 284.1] | | $ | [removed: 193.7] [added: 141.3] | | $ | [removed: 275.5] [added: 193.7] | |
| Total assets | | | $ | [removed: 8,471.5] [added: 9,504.9] | | $ | [removed: 8,301.6] [added: 8,471.5] | | $ | [removed: 8,041.1] [added: 8,301.6] | | $ | [removed: 8,233.1] [added: 8,041.1] | | $ | [removed: 8,095.4] [added: 8,233.1] | |
| Working capital | | | $ | [removed: 764.9] [added: 737.2] | | $ | [removed: 731.1] [added: 764.9] | | $ | [removed: 468.6] [added: 731.1] | | $ | [removed: 652.4] [added: 468.6] | | $ | [removed: 548.6] [added: 652.4] | |
| Current maturities and short-term debt | | | $ | [removed: 0.1] [added: 41.4] | | $ | 0.1 | | $ | [removed: 150.1] [added: 0.1] | | $ | [removed: 0.2] [added: 150.1] | | $ | [removed: 150.6] [added: 0.2] | |
| Long-term debt | | | $ | [removed: 1,982.8] [added: 2,813.5] | | $ | [removed: 1,980.3] [added: 1,982.8] | | $ | [removed: 1,834.6] [added: 1,980.3] | | $ | [removed: 2,496.2] [added: 1,834.6] | | $ | [removed: 2,495.2] [added: 2,496.2] | |
| Equity | | | $ | [removed: 4,572.5] [added: 4,968.9] | | $ | [removed: 4,454.2] [added: 4,572.5] | | $ | [removed: 4,176.7] [added: 4,454.2] | | $ | [removed: 3,938.1] [added: 4,176.7] | | $ | [removed: 3,761.1] [added: 3,938.1] | |
| Cash dividends declared per share | | | $ | [removed: 0.80] [added: 1.00] | | $ | [removed: 0.40] [added: 0.80] | | $ | [removed: 0.22] [added: 0.40] | | $ | [removed: 0.04] [added: 0.22] | | $ | 0.04 | |
| 1 | Earnings from continuing operations for [added: 2017 include pretax interest changes of $148.0 million referable to debt purchases and $297.0 million of discrete net tax benefits. Earnings from continuing operations for] 2014 include a pretax gain of $211.4 million [removed: (net of $16.5 million of disposition related charges)] referable to the sale of our cement and concrete businesses in the Florida [removed: area as described in Note 19 “Acquisitions and Divestitures” in Item 8 “Financial Statements and Supplementary Data.”] [added: area.] |
| Part II | [removed: 28] [added: 27] |
Item 8. FINANCIAL STATEMENTS AND SUPPLEMENTARY DATA
661 rewritten, 391 added, 220 removed, 1,241 unchanged
To the [added: shareholders and the] Board of Directors [removed: and Shareholders] of Vulcan Materials Company:
We have audited the accompanying consolidated balance sheets of Vulcan Materials Company and subsidiaries (the "Company") as of December 31, [removed: 2016 and 2015,] [added: 2017] and [added: 2016,] the related consolidated statements of comprehensive income, equity, and cash [removed: flows] [added: flows,] for each of the three years in the period ended December 31, [removed: 2016.][added: 2017, and the related notes (collectively referred to as the “financial statements”).]
Our responsibility is to express an opinion on [removed: these] [added: the Company’s] financial statements based on our audits.
We conducted our audits in accordance with the standards of the [removed: Public Company Accounting Oversight Board (United States).][added: PCAOB.]
Those standards require that we plan and perform the audit to obtain reasonable assurance about whether the financial statements are free of material [removed: misstatement.][added: misstatement, whether due to error or fraud.]
[removed: An audit includes] [added: Such procedures included] examining, on a test basis, evidence [removed: supporting] [added: regarding] the amounts and disclosures in the financial statements.
[removed: An audit] [added: Our audits] also [removed: includes assessing] [added: included evaluating] the accounting principles used and significant estimates made by management, as well as evaluating the overall [added: presentation of the] financial [removed: statement presentation.][added: statements.]
In our opinion, [removed: such consolidated] [added: the] financial statements present fairly, in all material respects, the financial position of [removed: Vulcan Materials] [added: the] Company [removed: and its subsidiary companies] as of December 31, [removed: 2016] [added: 2017] and [removed: 2015,] [added: 2016,] and the results of [removed: their] [added: its] operations and [removed: their] [added: its] cash flows for each of the three years in the period ended December 31, [removed: 2016] [added: 2017,] in conformity with accounting principles generally accepted in the United States of America.
We have also audited, in accordance with the standards of the Public Company Accounting Oversight Board (United [removed: States),] [added: States) (PCAOB),] the Company's internal control over financial reporting as of December 31, [removed: 2016,] [added: 2017,] based on the criteria established in Internal Control — Integrated Framework (2013) issued by the Committee of Sponsoring Organizations of the Treadway Commission and our report dated February [removed: 24, 2017] [added: 27, 2018] expressed an unqualified opinion on the Company's internal control over financial reporting.
][added: 8](https://www.sec.gov/Archives/edgar/data/1396009/000139600918000011/vmc-20171231x10kg024.jpg)]
| | [removed: 2016] [added: 2017] | | | [removed: 2015] [added: 2016] | | | [removed: 2014] [added: 2015] | |
| Total revenues | $ [removed: 3,592,667] [added: 3,890,296] | | | $ [removed: 3,422,181] [added: 3,592,667] | | | $ [removed: 2,994,169] [added: 3,422,181] | |
| Cost of revenues | [removed: 2,591,850] [added: 2,889,735] | | | [removed: 2,564,648] [added: 2,591,850] | | | [removed: 2,406,587] [added: 2,564,648] | |
| Gross profit | [removed: 1,000,817] [added: 1,000,561] | | | [removed: 857,533] [added: 1,000,817] | | | [removed: 587,582] [added: 857,533] | |
| Selling, administrative and general expenses | [removed: 314,986] [added: 323,918] | | | [removed: 286,844] [added: 314,986] | | | [removed: 272,288] [added: 286,844] | |
| Gain on sale of property, plant & equipment and businesses | [removed: 15,431] [added: 17,827] | | | [removed: 9,927] [added: 15,431] | | | [removed: 244,222] [added: 9,927] | |
| Other operating expense, net | [removed: (22,826)] [added: (47,362)] | | | [removed: (25,648)] [added: (21,680)] | | | [removed: (18,283)] [added: (30,838)] | |
| Operating earnings | [removed: 679,582] [added: 647,108] | | | [removed: 549,778] [added: 679,582] | | | [removed: 538,138] [added: 549,778] | |
| Other nonoperating income (expense), net | [removed: 944] [added: 5,293] | | | [removed: (1,678)] [added: 944] | | | [removed: 3,107] [added: (1,678)] | |
| Interest income | [removed: 807] [added: 4,437] | | | [removed: 345] [added: 807] | | | [removed: 960] [added: 345] | |
| Interest expense | [removed: 134,076] [added: 295,522] | | | [removed: 220,588] [added: 134,076] | | | [removed: 243,367] [added: 220,588] | |
| Earnings from continuing operations before income taxes | [removed: 547,257] [added: 361,316] | | | [removed: 327,857] [added: 547,257] | | | [removed: 298,838] [added: 327,857] | |
| Income tax expense [added: (benefit)] | | | | | | | | |
| Current | [removed: 94,254] [added: 354] | | | [removed: 89,340] [added: 94,254] | | | [removed: 74,039] [added: 89,340] | |
| Deferred | [removed: 30,597] [added: (232,429)] | | | [removed: 5,603] [added: 30,597] | | | [removed: 17,653] [added: 5,603] | |
| Total income tax expense [added: (benefit)] | [removed: 124,851] [added: (232,075)] | | | [removed: 94,943] [added: 124,851] | | | [removed: 91,692] [added: 94,943] | |
| Earnings from continuing operations | [removed: 422,406] [added: 593,391] | | | [removed: 232,914] [added: 422,406] | | | [removed: 207,146] [added: 232,914] | |
| [removed: Loss] [added: Earnings (loss)] on discontinued operations, net of tax (Note 2) | [removed: (2,915)] [added: 7,794] | | | [removed: (11,737)] [added: (2,915)] | | | [removed: (2,223)] [added: (11,737)] | |
| Net earnings | $ [removed: 419,491] [added: 601,185] | | | $ [removed: 221,177] [added: 419,491] | | | $ [removed: 204,923] [added: 221,177] | |
| Reclassification adjustment for cash flow hedges | [removed: 1,194] [added: 1,862] | | | [removed: 5,828] [added: 1,194] | | | [removed: 4,856] [added: 5,828] | |
| Adjustment for funded status of benefit plans | [removed: (20,583)] [added: (14,106)] | | | [removed: 23,832] [added: (20,583)] | | | [removed: (69,051)] [added: 23,832] | |
| Amortization of actuarial loss and prior service cost for benefit plans | [removed: 82] [added: 2,154] | | | [removed: 11,985] [added: 82] | | | [removed: 2,112] [added: 11,985] | |
| Other comprehensive income (loss) | [removed: (19,307)] [added: (10,090)] | | | [removed: 41,645] [added: (19,307)] | | | [removed: (62,083)] [added: 41,645] | |
| Comprehensive income | $ [removed: 400,184] [added: 591,095] | | | $ [removed: 262,822] [added: 400,184] | | | $ [removed: 142,840] [added: 262,822] | |
| Continuing operations | $ [removed: 3.17] [added: 4.48] | | | $ [removed: 1.75] [added: 3.17] | | | $ [removed: 1.58] [added: 1.75] | |
| Discontinued operations | [removed: (0.02)] [added: 0.06] | | | [removed: (0.09)] [added: (0.02)] | | | [removed: (0.02)] [added: (0.09)] | |
| Net earnings | $ [removed: 3.15] [added: 4.54] | | | $ [removed: 1.66] [added: 3.15] | | | $ [removed: 1.56] [added: 1.66] | |
| Continuing operations | $ [removed: 3.11] [added: 4.40] | | | $ [removed: 1.72] [added: 3.11] | | | $ [removed: 1.56] [added: 1.72] | |
| Discontinued operations | [removed: (0.02)] [added: 0.06] | | | [removed: (0.08)] [added: (0.02)] | | | [removed: (0.02)] [added: (0.08)] | |
| Net earnings | $ [removed: 3.09] [added: 4.46] | | | $ [removed: 1.64] [added: 3.09] | | | $ [removed: 1.54] [added: 1.64] | |
Opinion on the Financial Statements
Basis for Opinion
We are a public accounting firm registered with the PCAOB and are required to be independent with respect to the Company in accordance with the U.S. federal securities laws and the applicable rules and regulations of the Securities and Exchange Commission and the PCAOB.
Our audits included performing procedures to assess the risks of material misstatement of the financial statements, whether due to error or fraud, and performing procedures that respond to those risks.
February 27, 2018
We have served as the Company’s auditor since 1956.
| | 2017 | | | 2016 | |
| 2017 — $2,649; 2016 — $2,813 | 434,089 | | | 398,488 | |
| Net earnings | $ 601,185 | | | $ 419,491 | | | $ 221,177 | |
| Net cash used for investing activities | $ (1,269,491) | | | $ (357,194) | | | $ (308,592) | |
| Payment of short-term debt | (5,000) | | | (3,000) | | | (206,000) | |
| Net increase (decrease) in cash and cash equivalents and restricted cash | (121,373) | | | (17,191) | | | 143,937 | |
| Cash and cash equivalents and restricted cash at end of year | $ 146,646 | | | $ 268,019 | | | $ 285,210 | |
| | | | | | | | | | | | | | | |
| --- | --- | --- | --- | --- | --- | --- | --- | --- | --- | --- | --- | --- | --- | --- |
| | | | | | | | | | | | | | | |
| Purchase and retirement of | | | | | | | | | | | | | | |
| Net earnings | 0 | | 0 | | | 0 | | 601,185 | | 0 | | | 601,185 | |
| Share-based compensation plans, | | | | | | | | | | | | | | |
| net of shares withheld for taxes | 495 | | 495 | | | (29,168) | | 0 | | 0 | | | (28,673) | |
| Purchase and retirement of | | | | | | | | | | | | | | |
| common stock | (510) | | (510) | | | 0 | | (59,793) | | 0 | | | (60,303) | |
| Cash dividends on common stock | | | | | | | | | | | | | | |
| ($1.00 per share) | 0 | | 0 | | | 0 | | (132,335) | | 0 | | | (132,335) | |
| Other | 0 | | 0 | | | 125 | | (127) | | 0 | | | (2) | |
| Balances at December 31, 2017 | 132,324 | | $ 132,324 | | | $ 2,805,587 | | $ 2,180,448 | | $ (149,466) | | | $ 4,968,893 | |
We operate primarily in the United States and our principal product — aggregates — is used in virtually all types of public and private construction projects and in the production of asphalt mix and ready-mixed concrete.
Partially-owned affiliates are either consolidated or accounted for at cost or as equity investments depending on the level of ownership interest or our ability to exercise control over the affiliates’ operations.
The purchase price is determined based on the fair value of consideration transferred to and liabilities assumed from the seller as of the date of acquisition.
We allocate the purchase price to the fair values of the tangible and identifiable intangible assets acquired and liabilities assumed as of the date of acquisition.
Goodwill is recorded for the excess of the purchase price over the net of the fair value of the identifiable assets acquired and liabilities assumed.
Fair value is the price that would be received to sell an asset or paid to transfer a liability in an orderly transaction, and therefore represents an exit price.
A fair value measurement assumes the highest and best use of the asset by market participants.
We may adjust the amounts recognized in an acquisition during a measurement period after the acquisition date.
Any such adjustments are the result of subsequently obtaining additional information that existed at the acquisition date regarding the assets acquired or the liabilities assumed.
Measurement period adjustments are generally recorded as increases or decreases to goodwill, if any, recognized in the transaction.
The cumulative impact of measurement period adjustments on depreciation, amortization and other income statement items are recognized in the period the adjustment is determined.
| in thousands | | | 2017 | | | 2016 | |
During 2017, we recorded no loss on impairment of long-lived assets.
We received net cash proceeds from the sale of the VPPs of $226,926,000.
February 24, 2017
| Business interruption claims recovery | 11,652 | | | 0 | | | 0 | |
| Impairment of long-lived assets | (10,506) | | | (5,190) | | | (3,095) | |
| 2016 — $2,813; 2015 — $5,576 | 398,488 | | | 397,287 | |
| Increase in restricted cash | (7,883) | | | (1,150) | | | 0 | |
| Net cash provided by (used for) investing activities | $ (365,077) | | | $ (309,742) | | | $ 238,331 | |
| Payment of line of credit | (3,000) | | | (206,000) | | | (93,000) | |
| Proceeds from issuance of common stock | 0 | | | 0 | | | 30,620 | |
| Net increase (decrease) in cash and cash equivalents | (25,074) | | | 142,787 | | | (52,465) | |
| Cash and cash equivalents at end of year | $ 258,986 | | | $ 284,060 | | | $ 141,273 | |
| | | | | | | | | | | | | | |
| --- | --- | --- | --- | --- | --- | --- | --- | --- | --- | --- | --- | --- | --- |
| Balances at December 31, 2013 | 130,200 | | $ 130,200 | | | $ 2,611,703 | | $ 1,295,834 | | $ (99,631) | | $ 3,938,106 | |
| Acquisitions | 715 | | 715 | | | 44,470 | | 0 | | 0 | | 45,185 | |
| 401(k) Trustee (Note 13) | 485 | | 485 | | | 30,135 | | 0 | | 0 | | 30,620 | |
| shares withheld for taxes | 507 | | 507 | | | 20,982 | | 0 | | 0 | | 21,489 | |
| ($0.22 per share) | 0 | | 0 | | | 0 | | (28,884) | | 0 | | (28,884) | |
| Other | 0 | | 0 | | | 23 | | (28) | | 0 | | (5) | |
| Other | 0 | | 0 | | | 53 | | (54) | | 0 | | (1) | |
The 2016 decrease of $3,967,000 in total Rabbi Trust asset fair values is primarily due to several retired executives receiving distributions from the nonqualified retirement and deferred compensation plans.
The second step of the quantitative impairment test compares the implied fair value of the reporting unit goodwill with the carrying amount of that goodwill.
The implied fair value of goodwill is determined by hypothetically allocating the fair value of the reporting unit to its identifiable assets and liabilities in a manner consistent with a business combination, with any excess fair value representing implied goodwill.
If the carrying value of the reporting unit goodwill exceeds the implied fair value of that goodwill, an impairment loss is recognized in an amount equal to that excess.
During 2014, we recorded a $3,095,000 impairment loss related primarily to assets retained in the divestiture of our cement and concrete businesses in the Florida area (see Note 19).
We received net cash proceeds from the sale of the VPPs of $153,282,000 and $73,644,000 for the 2013 and 2012 transactions, respectively.
| Cash received and revenue deferred | 0 | | | 0 | | | 187 | |
| SOSARs 1 | | $ 4,899 | | | 1.8 | |
| Performance shares | | 20,965 | | | 2.4 | |
Before the adoption of this standard, excess tax benefits were recorded directly to equity (APIC).
Upon the adoption of this ASU, we revised our dilutive share calculation to exclude the assumption that proceeds from excess tax benefits would be used to purchase shares, resulting in an increase in dilutive shares as of December 31, 2016 of 773,101.
ASU 2016-09 requires that the cash paid for shares withheld to satisfy statutory income tax withholding obligations be classified as a financing activity in the statement of cash flows.
As a result, we revised our accompanying Statements of Cash Flows for prior years to conform to the 2016 presentation as follows: 2015 — increased operating cash flows $16,160,000 with a corresponding decrease in financing cash flows, and 2014 — increased operating cash flows $671,000 with a corresponding decrease in financing cash flows.
| 2017 | $ 74,027 | |
| 2018 | 13,599 | |
| 2019 | 8,767 | |
| 2020 | 5,461 | |
| 2021 | 3,716 | |
During 2016, we early adopted ASU 2016-09, “Improvement to Employee Share-Based Payment Accounting,” resulting in adjustments to our prior financial statements as noted in the caption Share-based Compensation above.
SHARE-BASED PAYMENTS As of December 31, 2016, we early adopted Accounting Standards Update (ASU) 2016-09, “Improvement to Employee Share-Based Payment Accounting,” which amends several aspects of the accounting for employee share-based payment transactions.
Most significantly, the income tax effects of awards are recognized in the income statement when the awards vest or are settled (the use of APIC pools is eliminated).
An excerpt. Shown here: 40 of 661 rewritten, 40 of 391 added and 40 of 220 removed. The counts are complete. For every sentence, read Item 8. FINANCIAL STATEMENTS AND SUPPLEMENTARY DATA in the FY2017 filing and the FY2016 filing.
Item 9A. CONTROLS AND PROCEDURES
14 rewritten, 8 added, 4 removed, 26 unchanged
Our Chief Executive Officer and Chief Financial Officer, with the participation of other management officials, evaluated the effectiveness of the design and operation of the disclosure controls and procedures as of December 31, [removed: 2016.][added: 2017.]
Based upon that evaluation, our Chief Executive Officer and Chief Financial Officer concluded that our disclosure controls and procedures were effective as of December 31, [removed: 2016.][added: 2017.]
No material changes were made during the fourth quarter of [removed: 2016] [added: 2017] to our internal [removed: controls] [added: control] over financial reporting, nor have there been other factors that materially affect these controls.
Based on this evaluation, management concluded that our internal control over financial reporting was effective as of December 31, [removed: 2016.][added: 2017.]
Deloitte & Touche LLP, an independent registered public accounting firm, as auditors of our consolidated financial statements, has issued an attestation report on the effectiveness of our internal control over financial reporting as of December 31, [removed: 2016.][added: 2017.]
In designing and evaluating [removed: the] [added: our] disclosure controls and procedures, management recognizes that any controls and procedures, no matter how well designed and operated, can provide only reasonable assurance of achieving the desired control objectives.
To the [added: shareholders and] Board of Directors [removed: and Shareholders] of Vulcan Materials Company:
We have audited the internal control over financial reporting of Vulcan Materials Company and subsidiaries (the "Company") as of December 31, [removed: 2016] [added: 2017,] based on criteria established in Internal Control — Integrated Framework (2013) issued by the Committee of Sponsoring Organizations of the Treadway [removed: Commission.][added: Commission (COSO).]
We conducted our audit in accordance with the standards of the [removed: Public Company Accounting Oversight Board (United States).][added: PCAOB.]
A company's internal control over financial reporting is a process designed [removed: by, or under the supervision of, the company's principal executive and principal financial officers, or persons performing similar functions, and effected by the company's board of directors, management, and other personnel] to provide reasonable assurance regarding the reliability of financial reporting and the preparation of financial statements for external purposes in accordance with generally accepted accounting principles.
Also, projections of any evaluation of the effectiveness [removed: of the internal control over financial reporting] to future periods are subject to the risk that the controls may become inadequate because of changes in conditions, or that the degree of compliance with the policies or procedures may deteriorate.
In our opinion, the Company maintained, in all material respects, effective internal control over financial reporting as of December 31, [removed: 2016] [added: 2017,] based on [removed: the] criteria established in Internal Control — Integrated Framework (2013) issued by [removed: the Committee of Sponsoring Organizations of the Treadway Commission.][added: COSO.]
We have also audited, in accordance with the standards of the Public Company Accounting Oversight Board (United [removed: States),] [added: States) (PCAOB),] the consolidated financial statements as of and for the year ended December 31, [removed: 2016] [added: 2017,] of the Company and our report dated February [removed: 24, 2017] [added: 27, 2018,] expressed an unqualified opinion on those financial statements.
| ] [added: 17](https://www.sec.gov/Archives/edgar/data/1396009/000139600918000011/vmc-20171231x10kg024.jpg)] |
| Part II | 116 |
Opinion on Internal Control over Financial Reporting
Basis for Opinion
We are a public accounting firm registered with the PCAOB and are required to be independent with respect to the Company in accordance with the U.S. federal securities laws and the applicable rules and regulations of the Securities and Exchange Commission and the PCAOB.
Definition and Limitations of Internal Control over Financial Reporting
Because of the inherent limitations, internal control over financial reporting may not prevent or detect misstatements.
| February 27, 2018 |
| Part II | 117 |
| Part II | 113 |
Because of the inherent limitations of internal control over financial reporting, including the possibility of collusion or improper management override of controls, material misstatements due to error or fraud may not be prevented or detected on a timely basis.
| February 24, 2017 |
| Part II | 114 |
Item 9B. OTHER INFORMATION
0 rewritten, 1 added, 1 removed, 6 unchanged
| Part II | 118 |
| Part II | 115 |
Item 10. DIRECTORS, EXECUTIVE OFFICERS AND CORPORATE GOVERNANCE
2 rewritten, 0 added, 0 removed, 2 unchanged
On or about March [removed: 29, 2017,] [added: 26, 2018,] we expect to file a definitive proxy statement with the Securities and Exchange Commission pursuant to Regulation 14A (our [removed: “2017] [added: “2018] Proxy Statement”).
The information under the headings “Proposal 1 - Election of Directors,” “Corporate Governance of our Company and Practices of our Board of Directors,” and “General Information - Section 16(a) Beneficial Ownership Reporting Compliance” included in [removed: the 2017] [added: our 2018] Proxy Statement is incorporated herein by reference.
Item 11. EXECUTIVE COMPENSATION
1 rewritten, 0 added, 0 removed, 1 unchanged
The information under the headings “Compensation Discussion and Analysis,” “Director Compensation,” “Executive Compensation,” “Corporate Governance of our Company and Practices of our Board of Directors,” and “Compensation Committee Report” included in our [removed: 2017] [added: 2018] Proxy Statement is incorporated herein by reference.
Item 12. SECURITY OWNERSHIP OF CERTAIN BENEFICIAL OWNERS AND MANAGEMENT AND RELATED
1 rewritten, 0 added, 0 removed, 2 unchanged
The information under the headings “Security Ownership of Certain Beneficial Owners and Management,” “Equity Compensation Plans” and “Executive Compensation — Payments Upon Termination or Change in Control” included in our [removed: 2017] [added: 2018] Proxy Statement is incorporated herein by reference.
Item 13. CERTAIN RELATIONSHIPS AND RELATED TRANSACTIONS, AND DIRECTOR INDEPENDENCE
1 rewritten, 0 added, 0 removed, 1 unchanged
The information under the heading “Corporate Governance of our Company and Practices of our Board of Directors” included in our [removed: 2017] [added: 2018] Proxy Statement is incorporated herein by reference.
Item 14. PRINCIPAL ACCOUNTING FEES AND SERVICES
2 rewritten, 1 added, 1 removed, 4 unchanged
The information under the heading entitled “Independent Registered Public Accounting Firm” included in our [removed: 2017] [added: 2018] Proxy Statement is incorporated herein by reference.
| Part III | [removed: 116] [added: 119] |
| 8 | |
| | |
Item 15. EXHIBITS AND FINANCIAL STATEMENT SCHEDULES
1 rewritten, 0 added, 0 removed, 18 unchanged
| | Notes to Consolidated Financial Statements | [removed: 66-112] [added: 66-115] | |
Item 16. FORM 10-K SUMMARY
58 rewritten, 16 added, 7 removed, 35 unchanged
Pursuant to the requirements of Section 13 or 15(d) of the Securities Exchange Act of 1934, the registrant has duly caused this report to be signed on its behalf by the undersigned, thereunto duly authorized on February [removed: 24, 2017.][added: 27, 2018.]
| | ] [added: 1](https://www.sec.gov/Archives/edgar/data/1396009/000139600918000011/vmc-20171231x10kg025.jpg)] J. Thomas Hill Chairman, President and Chief Executive Officer |
| ] [added: 3](https://www.sec.gov/Archives/edgar/data/1396009/000139600918000011/vmc-20171231x10kg025.jpg)] J. Thomas Hill | Chairman, President and Chief Executive Officer (Principal Executive Officer) | February [removed: 24, 2017] [added: 27, 2018] |
| ] [added: 1](https://www.sec.gov/Archives/edgar/data/1396009/000139600918000011/vmc-20171231x10kg026.jpg)] John R. McPherson | Executive Vice President and Chief Financial and Strategy Officer (Principal Financial Officer) | February [removed: 24, 2017] [added: 27, 2018] |
| [removed: ] [added: ] ______________________________________________ Ejaz A. Khan | Vice President, Controller and Chief Information Officer (Principal Accounting Officer) | February [removed: 24, 2017] [added: 27, 2018] |
| The following directors: Thomas A. Fanning O. B. Grayson Hall, Jr. Cynthia L. Hostetler [removed: Douglas J. McGregor] Richard T. O'Brien James T. Prokopanko [added: Kathleen L. Quirk] David P. Steiner Lee J. Styslinger, III [removed: Vincent J. Trosino] Kathleen Wilson-Thompson | Director Director Director Director Director Director Director Director Director [removed: Director] | |
| ] [added: line](https://www.sec.gov/Archives/edgar/data/1396009/000139600918000011/vmc-20171231x10kg028.jpg)] Michael R. Mills Attorney-in-Fact | | February [removed: 24, 2017] [added: 27, 2018] |
| Exhibit 3(a) | | | [removed: Certificate] [added: [Certificate] of Incorporation (Restated 2007) of the Company (formerly known as Virginia Holdco, Inc.), filed as Exhibit 3.1 to the Company’s Current Report on Form 8-K on November 16, 2007 [removed: 1] [added: 1](http://www.sec.gov/Archives/edgar/data/1396009/000095012307015677/y42706kexv3w1.htm)] | | |
| Exhibit 3(b) | | | [removed: Amended] [added: [Amended] and Restated By-Laws of the Company (as amended through February 13, 2015) filed as Exhibit 3(b) to the Company’s Annual Report on Form [removed: 10\-K] [added: 10-K] filed on February 27, 2015 [removed: 1] [added: 1](http://www.sec.gov/Archives/edgar/data/1396009/000139600915000005/vmc-20141231ex3b9f70846.htm)] | | |
| Exhibit [removed: 4(a)] [added: 4(j)] | | | [removed: Supplemental] [added: [Supplemental] Indenture No. 1, dated as of November 16, 2007, among the Company, Legacy Vulcan Corp. and The Bank of New [removed: York Trust Company, N.A.,] [added: York,] as [removed: Trustee] [added: Trustee,] filed as Exhibit 4.1 to the Company’s Current Report on Form 8-K [added: filed] on November 21, 2007 [removed: 1] [added: 1](http://www.sec.gov/Archives/edgar/data/1396009/000095012307015875/y427068kexv4w1.htm)] | | |
| Exhibit [removed: 4(b)] [added: 4(a)] | | | [removed: Senior] [added: [Senior] Debt Indenture, dated as of December 11, 2007, between the Company and Wilmington Trust Company, as Trustee, filed as Exhibit 4.1 to the Company’s Current Report on Form 8-K on December 11, 2007 [removed: 1] [added: 1](http://www.sec.gov/Archives/edgar/data/1396009/000095012307016528/y43970exv4w1.htm)] | | |
| Exhibit [removed: 4(c)] [added: 4(b)] | | | [removed: First] [added: [First] Supplemental Indenture, dated as of December 11, 2007, between Vulcan Materials Company and Wilmington Trust Company, as Trustee, to that certain Senior Debt Indenture, dated as of December 11, 2007, between the Company and Wilmington Trust Company, as Trustee, filed as Exhibit 4.2 to the Company’s Current Report on Form 8-K on December 11, 2007 [removed: 1] [added: 1](http://www.sec.gov/Archives/edgar/data/1396009/000095012307016528/y43970exv4w2.htm)] | | |
| Exhibit [removed: 4(d)] [added: 4(c)] | | | [removed: Second] [added: [Second] Supplemental Indenture, dated June 20, 2008 between the Company and Wilmington Trust Company, as Trustee, to that certain Senior Debt Indenture dated as of December 11, 2007, filed as Exhibit 4.1 to the Company's Current Report on Form 8-K filed on June 20, 2008 [removed: 1] [added: 1](http://www.sec.gov/Archives/edgar/data/1396009/000095012308007104/y61418exv4w1.htm)] | | |
| Exhibit [removed: 4(e)] [added: 4(d)] | | | [removed: Third] [added: [Third] Supplemental Indenture, dated February 3, 2009, between the Company and Wilmington Trust Company, as Trustee, to that certain Senior Debt Indenture dated as of December 11, 2007 filed as Exhibit 10(f) to the Company's Annual Report on Form 10-K filed on March 2, 2009 [removed: 1] [added: 1](http://www.sec.gov/Archives/edgar/data/1396009/000095014409001772/g17356exv10wxfy.htm)] | | |
| Exhibit [removed: 4(f)] [added: 4(e)] | | | [removed: Fourth] [added: [Fourth] Supplemental Indenture, dated June 14, 2011, between the Company and Wilmington Trust Company, as Trustee, filed as Exhibit 4.1 to the Company's Current Report on Form 8-K filed on June 15, 2011 [removed: 1] [added: 1](http://www.sec.gov/Archives/edgar/data/1396009/000114420411035837/v225938_ex4-1.htm)] | | |
| Exhibit [removed: 4(g)] [added: 4(f)] | | | [removed: Fifth] [added: [Fifth] Supplemental Indenture, dated March 30, 2015, between the Company and Regions Bank, as Trustee, filed as Exhibit 4.1 to the Company's Current Report on Form 8-K filed on March 30, 2015 [removed: 1] [added: 1](http://www.sec.gov/Archives/edgar/data/1396009/000119312515112082/d900347dex41.htm)] | | |
| Exhibit [removed: 4(h)] [added: 4(i)] | | | Indenture, dated as of May 1, 1991, by and between Legacy Vulcan Corp. (formerly Vulcan Materials Company) and First Trust of New York (as successor trustee to Morgan Guaranty Trust Company of New York) filed as Exhibit 4 to the Form S-3 on May 2, 1991 (Registration No. 33-40284) 1 | | |
| Exhibit [removed: 4(i)] [added: 4(k)] | | | [removed: Supplemental] [added: [Supplemental] Indenture No. [removed: 1,] [added: 2,] dated as of [removed: November 16, 2007, among the Company,] [added: June 30, 2015, between] Legacy [removed: Vulcan Corp.] [added: Vulcan, LLC] and The Bank of New [removed: York,] [added: York Mellon Trust Company, N.A.,] as Trustee, filed as Exhibit [removed: 4.1] [added: 4(a)] to the Company’s [removed: Current] [added: Quarterly] Report on Form [removed: 8-K] [added: 10-Q] filed on [removed: November 21, 2007 1] [added: August 5, 2015 1](http://www.sec.gov/Archives/edgar/data/1396009/000139600915000030/vmc-20150630ex4a14b97ea.htm)] | | |
| Exhibit 10(a) | | | [removed: Credit] [added: [Credit] Agreement dated as of June 19, 2015 among the Company and SunTrust Bank as Administrative Agent, and other parties named therein filed as Exhibit 10.1 to the Company’s Current Report on Form 8-K filed on June 25, 2015 [removed: 1] [added: 1](http://www.sec.gov/Archives/edgar/data/1396009/000114420415038932/v414020_ex10-1.htm)] | | |
| Exhibit 10(b) | | | [removed: Credit] [added: [Credit] Agreement dated as of December 21, 2016 among the Company and SunTrust Bank, as Administrative Agent, and the Lenders and other parties named therein filed as Exhibit 10.1 to the Company’s Current Report on Form 8-K filed on December 22, 2016 [removed: 1] [added: 1](http://www.sec.gov/Archives/edgar/data/1396009/000114420416141021/v455520_ex10-1.htm)] | | |
| Exhibit 10(c) | | | [removed: Unfunded] [added: [Unfunded] Supplemental Benefit Plan for Salaried Employees, as amended, filed as Exhibit 10.4 to the Company's Current Report on Form 8-K filed on December 17, 2008 [removed: 1,2] [added: 1,2](http://www.sec.gov/Archives/edgar/data/1396009/000095014408009390/g17056exv10w4.htm)] | | |
| Exhibit 10(d) | | | [removed: Amendment] [added: [Amendment] No. 1 to the Unfunded Supplemental Benefit Plan for Salaried Employees filed as Exhibit 10.1 to [removed: its] [added: the Company’s] Current Report on Form 8-K on January 7, 2014 [removed: 1,2] [added: 1,2](http://www.sec.gov/Archives/edgar/data/1396009/000114420414000953/v364833_ex10-1.htm)] | | |
| Exhibit 10(e) | | | [removed: Deferred] [added: [Deferred] Compensation Plan for Directors Who Are Not Employees of the Company, as amended, filed as Exhibit 10.5 to the Company's Current Report on Form 8-K filed on December 17, 2008 [removed: 1,2] [added: 1,2](http://www.sec.gov/Archives/edgar/data/1396009/000095014408009390/g17056exv10w5.htm)] | | |
| Exhibit 10(f) | | | [removed: The] [added: [The] 2006 Omnibus Long-Term Incentive Plan of the Company filed as Appendix C to Legacy Vulcan Corp.’s 2006 Proxy Statement on Schedule 14A filed on April 13, 2006 [removed: 1,2] [added: 1,2](http://www.sec.gov/Archives/edgar/data/103973/000010397306000088/proxy2006.htm)] | | |
| Exhibit 10(g) | | | [removed: Amendment] [added: [Amendment] to the 2006 Omnibus Long-Term Incentive Plan of the Company filed as Appendix A to the Company’s 2011 Proxy Statement on Schedule 14A filed March 31, 2011 [removed: 1,2] [added: 1,2](http://www.sec.gov/Archives/edgar/data/1396009/000114420411019107/v216860-def14a.htm)] | | |
| Exhibit 10(h) | | | [removed: Amendment] [added: [Amendment] to the 2006 Omnibus Long-Term Incentive Plan of the Company dated February 9, 2012, filed as Exhibit 10(l) to the Company’s Annual Report on Form 10-K for the year ended December 31, [removed: 2001] [added: 2011] filed on February [removed: 9,] [added: 29,] 2012 [removed: 1,2] [added: 1,2](http://www.sec.gov/Archives/edgar/data/1396009/000119312512089430/d257544dex10i.htm)] | | |
| Exhibit 10(i) | | | [removed: Deferred] [added: [Deferred] Stock Plan for Nonemployee Directors of the Company filed as Exhibit 10(f) to Legacy Vulcan Corp.’s Annual Report on Form 10-K for the year ended December 31, 2001 filed on March 27, 2002 [removed: 1,2] [added: 1,2](http://www.sec.gov/Archives/edgar/data/103973/000010397302000007/exh10f-10k.htm)] | | |
| Exhibit 10(j) | | | [removed: Restricted] [added: [Restricted] Stock Plan for Nonemployee Directors of the Company, as amended, filed as Exhibit 10.6 to the Company's Current Report on Form 8-K filed on December 17, 2008 [removed: 1,2] [added: 1,2](http://www.sec.gov/Archives/edgar/data/1396009/000095014408009390/g17056exv10w6.htm)] | | |
| Exhibit 10(k) | | | [removed: Executive] [added: [Executive] Deferred Compensation Plan, as amended, filed as Exhibit 10.1 to the Company's Current Report on Form 8-K filed on December 17, 2008 [removed: 1,2] [added: 1,2](http://www.sec.gov/Archives/edgar/data/1396009/000095014408009390/g17056exv10w1.htm)] | | |
| Exhibit [removed: 10(m)] [added: 10(l)] | | | [removed: Form] [added: [Form] of Change of Control Employment Agreement dated January 1, 2016, filed as Exhibit 10.1 to the Company's Current Report on Form 8-K filed on January 7, 2016 [removed: 1,2] [added: 1,2](http://www.sec.gov/Archives/edgar/data/1396009/000114420416074571/v428515_ex10-1.htm)] | | |
| Exhibit [removed: 10(n)] [added: 10(m)] | | | [removed: Vulcan] [added: [Vulcan] Materials Company Change of Control Severance Plan for Senior Officers, effective January 1, 2016, filed as Exhibit 10(m) to the Company’s Annual Report on Form 10-K filed on February 25, 2016 [removed: 1,2] [added: 1,2](http://www.sec.gov/Archives/edgar/data/1396009/000139600916000044/vmc-20151231ex10ma03dee.htm)] | | |
| Exhibit [removed: 10(o)] [added: 10(n)] | | | [removed: Executive] [added: [Executive] Incentive Plan of the Company, as amended, filed as Exhibit 10.2 to the Company's Current Report on Form 8-K filed on December 17, 2008 [removed: 1,2] [added: 1,2](http://www.sec.gov/Archives/edgar/data/1396009/000095014408009390/g17056exv10w2.htm)] | | |
| Exhibit [removed: 10(p)] [added: 10(o)] | | | [removed: Supplemental] [added: [Supplemental] Executive Retirement Agreement filed as Exhibit 10 to Legacy Vulcan Corp.’s Quarterly Report on Form 10-Q for the quarter ended September 30, 2001 filed on November 2, 2001 [removed: 1,2] [added: 1,2](http://www.sec.gov/Archives/edgar/data/103973/000010397301500050/sera-dmj.htm)] | | |
| Exhibit [removed: 10(q)] [added: 10(p)] | | | [removed: Form] [added: [Form] of Stock Option Agreement filed as Exhibit 10(o) to Legacy Vulcan Corp.’s Report on Form 8-K filed on December 20, 2005 [removed: 1,2] [added: 1,2](http://www.sec.gov/Archives/edgar/data/103973/000010397305000308/stockoptionagt.htm)] | | |
| Exhibit [removed: 10(r)] [added: 10(q)] | | | [removed: Form] [added: [Form] of Director Deferred Stock Unit Agreement filed as Exhibit 10.9 to the Company's Current Report on Form 8-K filed on December 17, 2008 [removed: 1,2] [added: 1,2](http://www.sec.gov/Archives/edgar/data/1396009/000095014408009390/g17056exv10w9.htm)] | | |
| Exhibit [removed: 10(s)] [added: 10(r)] | | | [removed: Form] [added: [Form] of Performance Share Unit Agreement filed as Exhibit 10.1 to the Company's Current Report on Form 8-K filed on March 11, 2010 [removed: 1,2] [added: 1,2](http://www.sec.gov/Archives/edgar/data/1396009/000114420410012797/v177024_ex10-1.htm)] | | |
| Exhibit [removed: 10(t)] [added: 10(s)] | | | [removed: Form] [added: [Form] of Performance Share Unit Agreement (2012) filed as Exhibit 10.1 to the Company’s Current Report on Form 8-K filed on February 14, 2012 [removed: 1,2] [added: 1,2](http://www.sec.gov/Archives/edgar/data/1396009/000114420412009141/v302778_ex10-1.htm)] | | |
| Exhibit [removed: 10(u)] [added: 10(t)] | | | [removed: Form] [added: [Form] of Stock-Only Stock Appreciation Rights Agreement filed as Exhibit [removed: 10(p)] [added: 10(q)] to Legacy Vulcan Corp.’s Report on Form 10-K filed on February 26, 2007 [removed: 1,2] [added: 1,2](http://www.sec.gov/Archives/edgar/data/103973/000095014407001601/g05561exv10wxqy.htm)] | | |
| Exhibit [removed: 10(v)] [added: 10(u)] | | | [removed: Stock-Only] [added: [Stock-Only] Stock Appreciation Rights Agreement between the Company and John R. McPherson dated November 9, 2011, filed as Exhibit 10(a) to the Company’s Current Report on Form 8-K filed on November 15, 2011 [removed: 1,2] [added: 1,2](http://www.sec.gov/Archives/edgar/data/1396009/000114420411065033/v240795_ex10-a.htm)] | | |
| Exhibit [removed: 10(w)] [added: 10(v)] | | | [removed: Form] [added: [Form] of Employee Deferred Stock Unit Amended Agreement filed as Exhibit 10.7 to the Company's Current Report on Form 8-K filed on December 17, 2008 [removed: 1,2] [added: 1,2](http://www.sec.gov/Archives/edgar/data/1396009/000095014408009390/g17056exv10w7.htm)] | | |
| Part IV | 120 |
| Signatures | 121 |
| Exhibit 2 | | | [Membership Interest Purchase Agreement, dated as of May 24, 2017, by and among Vulcan Construction Materials, LLC, Aggregates USA Holdings Sub, LLC, Aggregates USA, LLC, solely for limited purposes, SPO Partners II, L.P., and, solely for limited purposes, Vulcan Materials Company, filed as Exhibit 2.1 to the Company’s Current Report on Form 8-K filed on May 25, 2017](http://www.sec.gov/Archives/edgar/data/1396009/000110465917035006/a17-14163_1ex2d1.htm) 1, 3 | | |
| Exhibit 4(g) | | | [Sixth Supplemental Indenture, dated March 14, 2017, between the Company and Regions Bank, as Trustee, filed as Exhibit 4.1 to the Company’s Current Report on Form 8-K filed on March 14, 2017 1](http://www.sec.gov/Archives/edgar/data/1396009/000119312517082077/d314722dex41.htm) | | |
| Exhibit 4(h) | | | [Seventh Supplemental Indenture, dated as of June 15, 2017, between Vulcan Materials Company and Regions Bank, as Trustee, filed as Exhibit 4.1 to the Company’s Current Report on Form 8-K filed on June 15, 2017](http://www.sec.gov/Archives/edgar/data/1396009/000119312517204791/d404900dex41.htm) 1 | | |
| Exhibit 4(l) | | | [Term Loan Note, dated December 17, 2017, between Vulcan Materials Company and Bank of America, N.A., filed as Exhibit 10.1 to the Company’s Current Report on Form 8-K filed on December 21, 2017 1](http://www.sec.gov/Archives/edgar/data/1396009/000119312517376623/d423227dex101.htm) | | |
| Exhibit 4(m) | | | [Guaranty Agreement, dated December 21, 2017, by each of the parties identified therein as Guarantors, each other subsidiary of Vulcan Materials Company that becomes a party thereto, and Bank of America, N.A., filed as Exhibit 10.2 to the Company’s Current Report on Form 8-K filed on December 21, 2017 1](http://www.sec.gov/Archives/edgar/data/1396009/000119312517376623/d423227dex102.htm) | | |
| Exhibit 21 | | | [List of the Company's material subsidiaries as of January 31, 2018](https://www.sec.gov/Archives/edgar/data/1396009/000139600918000011/vmc-20171231xex21.htm) | | |
| Exhibit 24 | | | [Powers of Attorney](https://www.sec.gov/Archives/edgar/data/1396009/000139600918000011/vmc-20171231xex24.htm) | | |
| Exhibit 95 | | | [MSHA Citations and Litigation](https://www.sec.gov/Archives/edgar/data/1396009/000139600918000011/vmc-20171231xex95.htm) | | |
| --- | --- | --- | --- |
| 3 | The schedules and exhibits to the Purchase Agreement have been omitted pursuant to Item 601(b)(2) of Regulation S-K. Vulcan agrees to furnish supplementally a copy of such schedules and exhibits, or any section thereof, to the SEC upon request. | | |
| | |
| --- | --- |
| | |
| | E-4 |
| Part IV | 117 |
| Signatures | 118 |
| Exhibit 4(j) | | | Supplemental Indenture No. 2, dated as of June 30, 2015, between Legacy Vulcan, LLC and The Bank of New York Mellon Trust Company, N.A., as Trustee, filed as Exhibit 4(a) to the Company’s Quarterly Report on Form 10-Q filed on August 5, 2015 1 | | |
| Exhibit 10(l) | | | Independent Contractor Consulting Agreement dated March 26, 2015, between the Company and Danny R. Shepherd, filed as Exhibit 10(a) to the Company’s Quarterly Report on Form 10-Q filed on May 6, 2015 1,2 | | |
| Exhibit 21 | | | List of the Company's material subsidiaries as of January 31, 2017 | | |
| Exhibit 24 | | | Powers of Attorney | | |
| Exhibit 95 | | | MSHA Citations and Litigation | | |
An excerpt. Shown here: 40 of 58 rewritten, all 16 added and all 7 removed. The counts are complete. For every sentence, read Item 16. FORM 10-K SUMMARY in the FY2017 filing and the FY2016 filing.