 filings.tools
Item 2. PROPERTIES
12K characters. Original on sec.gov · Markdown
Item 2. PROPERTIES
PROPERTIES
AGGREGATES
As the largest U.S. supplier of construction aggregates, we have operating facilities across the U.S. and in Mexico and the Bahamas. We principally serve markets in 20 states, Washington D.C. and the local markets surrounding our operations in Mexico and the Bahamas. Our primary focus is serving states and metropolitan markets in the U.S. that are expected to experience the most significant growth in population, households and employment. These three demographic factors are significant drivers of demand for aggregates.
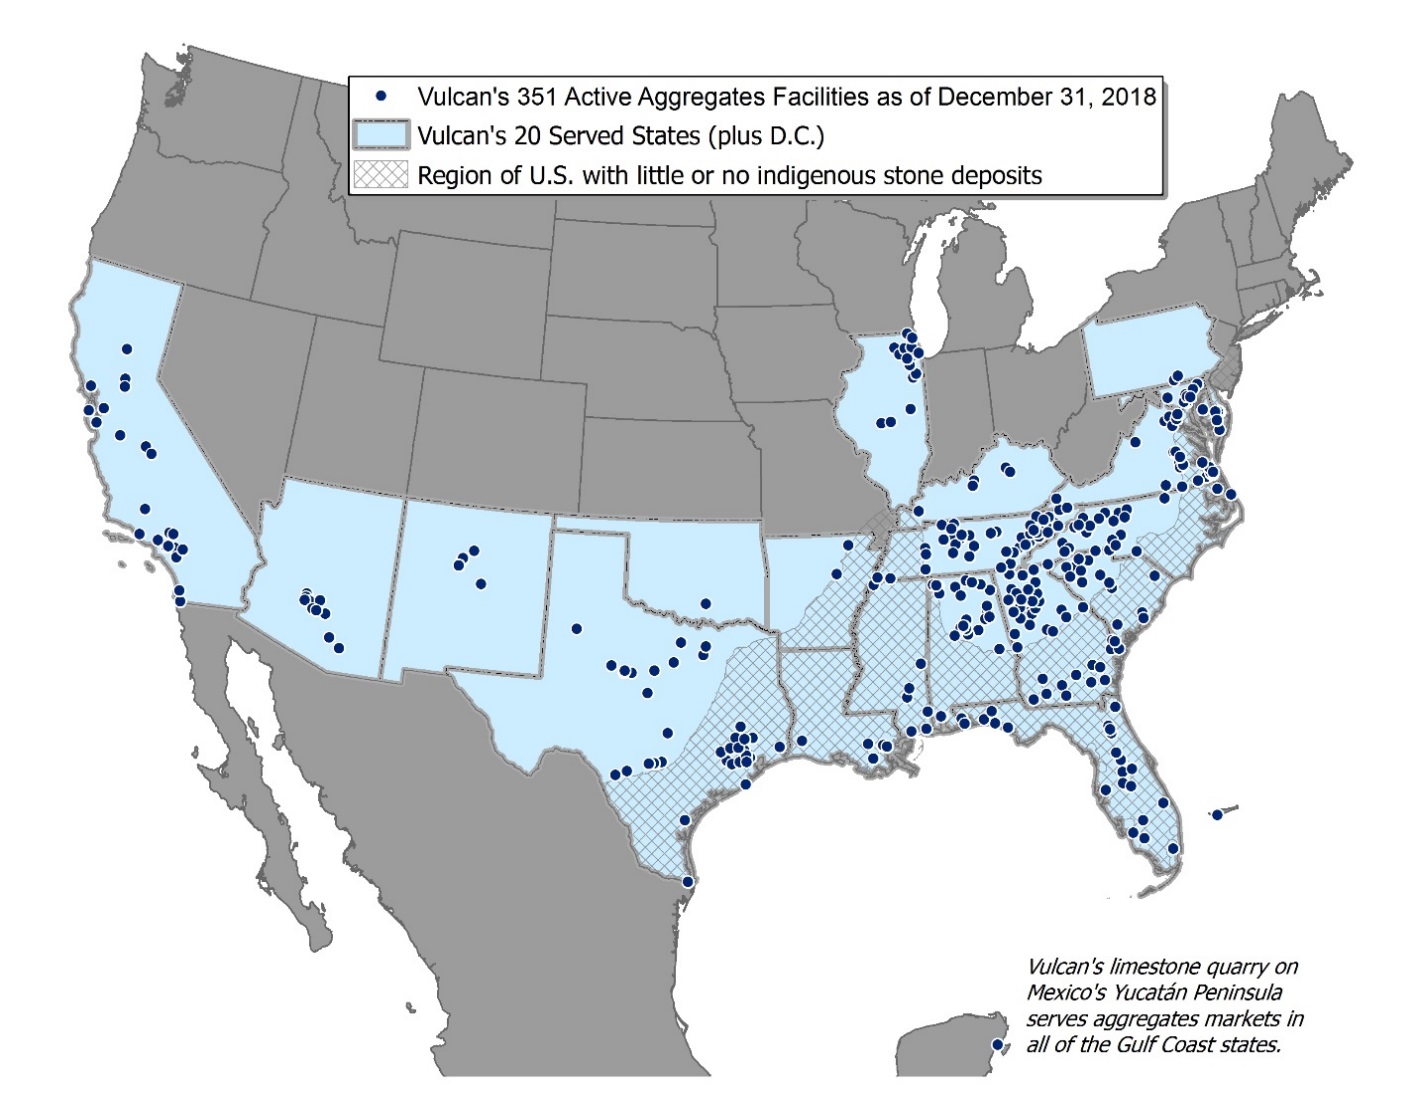
Our current estimate of 16.3 billion tons of proven and probable aggregates reserves reflects an increase of 0.3 billion tons from the prior year’s estimate. Estimates of reserves are of recoverable stone, sand and gravel of suitable quality for economic extraction, based on drilling and studies by our geologists and engineers, recognizing reasonable economic and operating constraints as to maximum depth of overburden and stone excavation, and subject to permit or other restrictions.
Proven, or measured, reserves are those reserves for which the quantity is computed from dimensions revealed by drill data, together with other direct and measurable observations, such as outcrops, trenches and quarry faces. The grade and quality of those reserves are computed from the results of detailed sampling, and the sampling and measurement data are spaced so closely and the geologic character is so well defined that size, shape, depth and mineral content of reserves are well established. Probable, or indicated, reserves are those reserves for which quantity, grade and quality are computed partly from specific measurements and partly from projections based on reasonable, though not drilled, geologic evidence. The degree of assurance, although lower than that for proven reserves, is high enough to assume continuity between points of observation.
| Part I | 21 |
Reported proven and probable reserves include only quantities that are owned in fee or under lease, and for which all appropriate zoning and permitting have been obtained through permit, contract or grandfathered status. Leases, zoning, permits, reclamation plans and other government or industry regulations often set limits on the areas, depths and lengths of time allowed for mining, stipulate setbacks and slopes that must be left in place, and designate which areas may be used for surface facilities, berms, and overburden or waste storage, among other requirements and restrictions. Our reserve estimates take into account these factors. Technical and economic factors also affect the estimates of reported reserves regardless of what might otherwise be considered proven or probable based on a geologic analysis. For example, excessive overburden or weathered rock, rock quality issues, excessive mining depths, groundwater issues, overlying wetlands, endangered species habitats, and rights of way or easements may effectively limit the quantity of reserves considered proven and probable. In addition, computations for reserves in-place are adjusted for estimates of unsaleable sizes and materials as well as pit and plant waste.
The 16.3 billion tons of estimated proven and probable aggregates reserves reported at the end of 2018 include reserves at inactive and greenfield (undeveloped) sites. The table below presents, by division, the tons of proven and probable aggregates reserves as of December 31, 2018 and the types of facilities operated.
| (millions of tons) | Count of Aggregates Operating Facilities 2 | |||||||||||||||||||||
| Aggregates Reserves | 2018 | Sand and | ||||||||||||||||||||
| Division 1 | Proven | Probable | Total | Production | Stone | Gravel | Sales Yards | |||||||||||||||
| Central | 2,875.6 | 859.9 | 3,735.5 | 38.3 | 53 | 5 | 9 | |||||||||||||||
| International | 554.2 | 0.0 | 554.2 | 12.7 | 1 | 0 | 0 | |||||||||||||||
| Mideast | 2,519.9 | 988.8 | 3,508.7 | 35.4 | 34 | 5 | 22 | |||||||||||||||
| Mountain West | 177.0 | 125.8 | 302.8 | 9.4 | 2 | 12 | 2 | |||||||||||||||
| Southeast 3 | 3,067.1 | 882.5 | 3,949.6 | 49.8 | 43 | 11 | 22 | |||||||||||||||
| Southern Gulf Coast | 1,326.8 | 45.4 | 1,372.2 | 16.3 | 22 | 0 | 19 | |||||||||||||||
| Southwest | 1,322.4 | 0.0 | 1,322.4 | 22.5 | 15 | 1 | 23 | |||||||||||||||
| Western | 1,033.6 | 504.1 | 1,537.7 | 22.2 | 5 | 13 | 2 | |||||||||||||||
| Total | 12,876.6 | 3,406.5 | 16,283.1 | 206.6 | 175 | 47 | 99 |
| 1 | The divisions are defined by states/countries as follows: Central Division — Arkansas, Illinois, Kentucky and Tennessee International Division — Mexico Mideast Division — Delaware, Maryland, North Carolina, Pennsylvania, Virginia and Washington D.C. Mountain West Division — Arizona and New Mexico Southeast Division — Florida (excluding panhandle), Georgia, South Carolina and the Bahamas Southern Gulf Coast Division — Alabama, Florida Panhandle, Louisiana and Mississippi Southwest Division — Oklahoma and Texas Western Division — California | |
| 2 | In addition to the facilities included in the table above, we operated 30 recycled concrete plants which are not dependent on reserves. | |
| 3 | Includes a maximum of 340.1 million tons of reserves encumbered by volumetric production payments as defined in Note 2 “Revenues” in Item 8 “Financial Statements and Supplementary Data.” |
Of the 16.3 billion tons of aggregates reserves at December 31, 2018, 9.0 billion tons or 55% are located on owned land and 7.3 billion tons or 45% are located on leased land.
| Part I | 22 |
The following table lists our ten largest active aggregates facilities based on the total proven and probable reserves at the sites. None of our aggregates facilities, other than Playa del Carmen, contributed more than 5% to our total revenues in 2018.
| (millions of tons) | ||||||||||||||||||||
| Reserves at 12/31/2018 | 2018 | |||||||||||||||||||
| Location (nearest major metropolitan area) | Proven | Probable | Total | Production | ||||||||||||||||
| Playa del Carmen (Cancun), Mexico | 554.2 | 0.0 | 554.2 | 12.7 | ||||||||||||||||
| Hanover (Harrisburg), Pennsylvania | 226.3 | 236.4 | 462.7 | 2.7 | ||||||||||||||||
| McCook (Chicago), Illinois | 105.8 | 266.5 | 372.3 | 5.0 | ||||||||||||||||
| Corona (Los Angeles), California | 12.5 | 321.8 | 334.3 | 2.2 | ||||||||||||||||
| Gold Hill (Charlotte), North Carolina | 148.6 | 121.2 | 269.8 | 1.0 | ||||||||||||||||
| Postell (Macon), Georgia | 195.3 | 72.3 | 267.6 | 3.8 | ||||||||||||||||
| San Emidio (Bakersfield), California | 250.0 | 0.0 | 250.0 | 1.4 | ||||||||||||||||
| Macon, Georgia | 119.2 | 128.0 | 247.2 | 1.8 | ||||||||||||||||
| Norcross (Atlanta), Georgia | 186.9 | 27.7 | 214.6 | 2.8 | ||||||||||||||||
| 1604 Stone (San Antonio), Texas | 208.1 | 0.0 | 208.1 | 1.4 |
ASPHALT, CONCRETE AND CALCIUM
As of December 31, 2018, we operated a number of facilities producing asphalt mix, ready-mixed concrete and calcium in several of our divisions as reflected in the table below:
| Asphalt 2 | Concrete 3 | Calcium 4 | ||||||||||||||||||||
| Division 1 | Facilities | Facilities | Facilities | |||||||||||||||||||
| Central | 10 | 0 | 0 | |||||||||||||||||||
| Mideast | 0 | 31 | 0 | |||||||||||||||||||
| Mountain West | 21 | 2 | 0 | |||||||||||||||||||
| Southeast | 0 | 1 | 1 | |||||||||||||||||||
| Southern Gulf Coast | 3 | 0 | 0 | |||||||||||||||||||
| Southwest | 13 | 7 | 0 | |||||||||||||||||||
| Western | 20 | 5 | 0 | |||||||||||||||||||
| Total | 67 | 46 | 1 |
| 1 | International Division has no asphalt, concrete or calcium facilities. |
| 2 | Asphalt facilities for the Central, Southern Gulf Coast and Southwest Divisions are comprised of asphalt mix facilities and construction paving businesses. |
| 3 | Southeast Division Concrete is comprised of a ready-mixed concrete plant in the Bahamas. |
| 4 | Comprised of a ground calcium plant. |
The asphalt and concrete facilities are able to meet their needs for raw material inputs with a combination of internally sourced and purchased raw materials.
| Part I | 23 |
Our Calcium segment operates a quarry at Brooksville, Florida which provides feedstock for the ground calcium operation.
| (millions of tons) | ||||||||||||||||||||||
| Reserves at 12/31/2018 | 2018 | |||||||||||||||||||||
| Location | Proven | Probable | Total | Production | ||||||||||||||||||
| Brooksville | 5.0 | 7.2 | 12.2 | 0.3 |
Our Brooksville limestone quarry is mined and processed primarily as a supplement for end-use products, such as animal feed and plastics. High purity limestone is inert and relatively inexpensive compared to the other components used in these end-use products. The Brooksville limestone quarry has an average calcium carbonate (CaCO3) content of 97%.
HEADQUARTERS
Our headquarters are located in an office complex in Birmingham, Alabama. The office space consists of approximately 184,410 square feet and is leased through December 31, 2023, with three five-year renewal periods thereafter. The annual rental cost for the current term of the lease is approximately $3.6 million.
Previous: Item 1B. UNRESOLVED STAFF COMMENTS · Next: Item 3. LEGAL PROCEEDINGS