 filings.tools
Vulcan Materials 10-K 2020-12-31
Filed 2021-02-25. 21 sections, 447K characters. Original on sec.gov · Markdown · JSON
Cover and table of contents
| UNITED STATES SECURITIES AND EXCHANGE COMMISSION Washington, D.C. 20549 FORM 10-K | |||||
| þ | ANNUAL REPORT PURSUANT TO SECTION 13 OR 15(d) OF THE SECURITIES EXCHANGE ACT OF 1934 For the Fiscal Year Ended December 31**, 2020** OR | ||||
| o | TRANSITION REPORT PURSUANT TO SECTION 13 OR 15(d) OF THE SECURITIES EXCHANGE ACT OF 1934 For the Transition Period From to | ||||
| Commission file number: 001-33841 VULCAN MATERIALS COMPANY (Exact Name of Registrant as Specified in Its Charter) | |||||
| New Jersey (State or other jurisdiction of incorporation or organization) | 20-8579133 (I.R.S. Employer Identification No.) | ||||
| 1200 Urban Center Drive**,** Birmingham**,** Alabama (Address of Principal Executive Offices) | 35242 (Zip Code) | ||||
| (205) 298-3000 (Registrant’s telephone number, including area code) | |||||
| Securities registered pursuant to Section 12(b) of the Act: | |||||
| Title of each class Common Stock, $1 par value | Trading Symbol VMC | Name of each exchange on which registered New York Stock Exchange | |||
| Securities registered pursuant to Section 12(g) of the Act: None | |||||
| Indicate by check mark if the registrant is a well-known seasoned issuer, as defined in Rule 405 of the Securities Act. Yes þ No o Indicate by check mark if the registrant is not required to file reports pursuant to Section 13 or Section 15(d) of the Act. Yes o No þ Indicate by check mark whether the registrant: (1) has filed all reports required to be filed by Section 13 or 15(d) of the Securities Exchange Act of 1934 during the preceding 12 months (or for such shorter period that the registrant was required to file such reports), and (2) has been subject to such filing requirements for the past 90 days. Yes þ No o Indicate by check mark whether the registrant has submitted electronically every Interactive Data File required to be submitted pursuant to Rule 405 of Regulation S-T during the preceding 12 months (or for such shorter period that the registrant was required to submit such files). Yes þ No o Indicate by check mark whether the registrant is a large accelerated filer, an accelerated filer, a non-accelerated filer, a smaller reporting company or an emerging growth company. See the definitions of “large accelerated filer,” “accelerated filer,” “smaller reporting company” and “emerging growth company” in Rule 12b-2 of the Exchange Act. | |||||
| Large accelerated filer þ Non-accelerated filer o | Accelerated filer o Smaller reporting company o Emerging growth company o | ||||
| If an emerging growth company, indicate by check mark if the registrant has elected not to use the extended transition period for complying with any new or revised financial accounting standards provided pursuant to Section 13(a) of the Exchange Act. o | |||||
| Indicate by check mark whether the registrant has filed a report on and attestation to its management’s assessment of the effectiveness of its internal control over financial reporting under Section 404(b) of the Sarbanes-Oxley Act (15 U.S.C. 7262(b)) by the registered public accounting firm that prepared or issued its audit report. þ | |||||
| Indicate by check mark whether the registrant is a shell company (as defined in Rule 12b-2 of the Act). | Yes o No þ |
| Aggregate market value of voting and non-voting common stock held by non-affiliates as of June 30, 2020: | $15,315,526,050 |
| Number of shares of common stock, $1.00 par value, outstanding as of February 12, 2021: | 132,547,092 |
| DOCUMENTS INCORPORATED BY REFERENCE | |
| Portions of the registrant’s annual proxy statement for the annual meeting of its shareholders to be held on May 14, 2021, are incorporated by reference into Part III of this Annual Report on Form 10-K. |
Unless otherwise stated or the context otherwise requires, references in this report to “Vulcan,” the “Company,” “we,” “our,” or “us” refer to Vulcan Materials Company and its consolidated subsidiaries.
| Table of Contents | i |
PART I
“SAFE HARBOR” STATEMENT UNDER THE PRIVATE SECURITIESLITIGATION REFORM ACT OF 1995
Certain of the matters and statements made herein or incorporated by reference into this report constitute forward-looking statements within the meaning of Section 21E of the Securities Exchange Act of 1934. All such statements are made pursuant to the safe harbor provisions of the Private Securities Litigation Reform Act of 1995. These statements reflect our intent, belief or current expectation. Often, forward-looking statements can be identified by the use of words, such as “anticipate,” “may,” “believe,” “estimate,” “project,” “expect,” “intend” and words of similar import. In addition to the statements included in this report, we may from time to time make other oral or written forward-looking statements in other filings under the Securities Exchange Act of 1934 or in other public disclosures. Forward-looking statements are not guarantees of future performance, and actual results could differ materially from those indicated by the forward-looking statements. All forward-looking statements involve certain assumptions, risks and uncertainties that could cause actual results to differ materially from those included in or contemplated by the statements. These assumptions, risks and uncertainties include, but are not limited to:
general economic and business conditions
a pandemic, epidemic or other public health emergency, such as the recent outbreak of COVID-19
our dependence on the construction industry, which is subject to economic cycles
the timing and amount of federal, state and local funding for infrastructure
changes in the level of spending for private residential and private nonresidential construction
changes in our effective tax rate
the increasing reliance on information technology infrastructure, including the risks that the infrastructure does not work as intended, experiences technical difficulties or is subjected to cyber-attacks
the impact of the state of the global economy on our businesses and financial condition and access to capital markets
the highly competitive nature of the construction industry
the impact of future regulatory or legislative actions, including those relating to climate change, wetlands, greenhouse gas emissions, the definition of minerals, tax policy or international trade
the outcome of pending legal proceedings
pricing of our products
weather and other natural phenomena, including the impact of climate change and availability of water
energy costs
costs of hydrocarbon-based raw materials
healthcare costs
the amount of long-term debt and interest expense we incur
changes in interest rates
the impact of a discontinuation of the London Interbank Offered Rate (LIBOR)
volatility in pension plan asset values and liabilities, which may require cash contributions to the pension plans
the impact of environmental cleanup costs and other liabilities relating to existing and/or divested businesses
our ability to secure and permit aggregates reserves in strategically located areas
our ability to manage and successfully integrate acquisitions
the effect of changes in tax laws, guidance and interpretations
significant downturn in the construction industry may result in the impairment of goodwill or long-lived assets
changes in technologies, which could disrupt the way we do business and how our products are distributed
the risks set forth in Item 1A “Risk Factors,” Item 3 “Legal Proceedings,” Item 7 “Management’s Discussion and Analysis of Financial Condition and Results of Operations,” and Note 12 “Commitments and Contingencies” to the consolidated financial statements in Item 8 “Financial Statements and Supplementary Data,” all as set forth in this report
| Part I | 1 |
other assumptions, risks and uncertainties detailed from time to time in our filings made with the Securities and Exchange Commission
All forward-looking statements are made as of the date of filing or publication. We undertake no obligation to publicly update any forward-looking statements, whether as a result of new information, future events or otherwise, except to the extent required by law. Investors are cautioned not to rely unduly on such forward-looking statements when evaluating the information presented in our filings, and are advised to consult any of our future disclosures in filings made with the Securities and Exchange Commission and our press releases with regard to our business and consolidated financial position, results of operations and cash flows.
| Part I | 2 |
Item 1. BUSINESS
BUSINESS
Vulcan Materials Company operates primarily in the U.S. and is the nation’s largest supplier of construction aggregates (primarily crushed stone, sand and gravel), a major producer of asphalt mix and ready-mixed concrete, and a supplier of construction paving services. We provide the basic materials for the infrastructure needed to maintain and expand the U.S. economy. Delivered by trucks, ships, barges and trains, our products are the indispensable materials building homes, offices, places of worship, schools, hospitals and factories, as well as vital infrastructure including highways, bridges, roads, ports and harbors, water systems, campuses, dams, airports and rail networks. As of December 31, 2020, we had 380 active aggregates facilities, 70 asphalt facilities and 46 concrete facilities.
BUSINESS STRATEGY
Our strategy and competitive advantage are based on our strength in aggregates which are used in most types of construction and in the production of asphalt mix and ready-mixed concrete. Our strategy for long-term value creation is built on: (1) an aggregates-focused business, (2) a disciplined approach to growth management and capital allocation, (3) a focus on continuous compounding improvement in profitability, (4) a holistic approach to land management, and (5) our commitment to safety, health and the environment.
1. AGGREGATES FOCUS
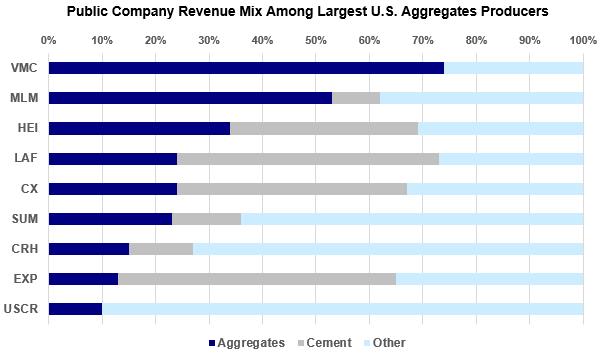
Aggregates are used in virtually all types of public and private construction, practically no substitutes for quality aggregates exist, and significant barriers to entry exist in most markets. Vulcan is uniquely positioned as the largest aggregates supplier in the U.S. and the most aggregates-focused public company.
Source: 2019 reported financial information and Company estimates
Given our focus on aggregates, we:
n****TAKE ADVANTAGE OF SIZE AND SCALE: While certain aspects of each aggregates operation are unique, such as its location within a local market and its particular geological characteristics, every operation uses a similar group of assets to produce saleable aggregates and provide customer service. Our 380 active aggregates facilities as of December 31, 2020 provide opportunities to share and scale best practices across our operations and to procure equipment (fixed and mobile), parts, supplies and services in an efficient and cost-effective manner, both regionally and nationally. Additionally, we are able to share best practices across the organization and leverage our size for administrative support, customer service, accounting, procurement, technical support and engineering.
| Part I | 3 |
BUILD AND HOLD SUBSTANTIAL RESERVES: Our reserves are critical to our long-term success. We currently have 15.9 billion tons of permitted and proven or probable aggregates reserves. They are strategically located throughout the United States in high-growth areas that are expected to require large amounts of aggregates to meet future construction demand. Moreover, there are significant barriers to entry in many metropolitan markets due to stringent zoning and permitting regulations. These restrictions curtail expansion in certain areas, but they also increase the value of our reserves at existing locations.
2. Growth management AND CAPITAL ALLOCATION
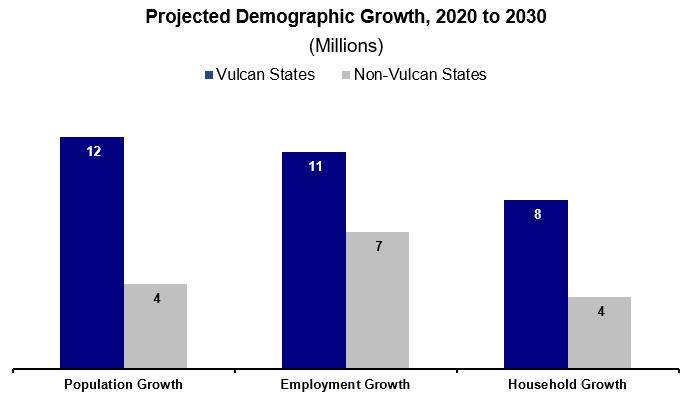
growth management: Demand for our products is dependent on construction activity and correlates positively with changes in population growth, household formation and employment. As such, we have pursued a strategy to increase our presence in U.S. metropolitan areas that are expected to grow the most rapidly and to divest assets that are no longer considered part of our long-term growth strategy. During the period 2020 - 2030, Moody's Analytics projects that 73% of the U.S. population growth, 70% of household formation and 61% of new jobs will occur in Vulcan-served states. Our coast-to-coast footprint serves 19 of the top 25 highest-growth metropolitan statistical areas in 20 states plus the District of Columbia. The close proximity of our aggregates reserves and our production facilities to this projected population growth creates many opportunities to invest capital in high-return projects.
Source: Moody’s Analytics as of December 10, 2020
Our top ten revenue producing states accounted for 88% of our 2020 revenues while our top five accounted for 61%.
| VULCAN’S TOP TEN REVENUE PRODUCING STATES IN 2020 | ||||||||||||
| 1. | Texas | 6. | Florida | |||||||||
| 2. | California | 7. | Arizona | |||||||||
| 3. | Tennessee | 8. | Alabama | |||||||||
| 4. | Georgia | 9. | North Carolina | |||||||||
| 5. | Virginia | 10. | South Carolina |
| Part I | 4 |
Since becoming a public company in 1956, Vulcan has principally grown by mergers and acquisitions. For example, in 1999 we acquired CalMat Co., thereby expanding our aggregates operations into California and Arizona and making us one of the nation’s leading producers of asphalt mix. In 2007, we acquired Florida Rock Industries, Inc., expanding our aggregates business in Florida and our aggregates and ready-mixed concrete businesses in other Mid-Atlantic and Southeastern states. In 2017, we acquired Aggregates USA, greatly expanding our ability to serve customers in Florida, Georgia and South Carolina. Additionally, throughout our history we have completed many bolt-on aggregates acquisitions that have contributed significantly to our growth. For example, during 2019 we acquired aggregates operations that strengthened our position in Tennessee.
While an aggregates-focused business, we selectively make investments in downstream products that drive local market profitability. Our downstream businesses (asphalt and concrete) use Vulcan-produced aggregates almost exclusively. In 2017, we entered the asphalt market in Tennessee through the acquisition of several asphalt mix operations and a construction paving business. In 2018, we entered the asphalt mix and construction paving markets in Alabama and expanded our asphalt operations and service offerings in Texas through the acquisition of several asphalt mix operations and construction paving businesses. Additionally, throughout our history we have completed many bolt-on downstream acquisitions that have contributed significantly to our growth. For example, during 2020 we acquired asphalt operations in Texas expanding our already strong presence in that market. From 2018 to 2020, we invested over $300 million in acquisitions as outlined in Note 19 “Acquisitions and Divestitures” in Item 8 “Financial Statements and Supplementary Data.”
capital allocation: Our long-term capital allocation strategy is focused on the following priorities:
Operating Capital (maintain and grow the value of our franchise)
Growth Capital (including greenfields and acquisitions)
Dividend Growth (with a keen focus on sustainability)
Return Excess Cash to Shareholders (primarily via share repurchases)
Our strategic priorities have given us the ability to leverage decisions we have made over the past few years. During 2020, we reinvested $360.8 million into core operating & maintenance capital and internal growth capital, in addition to $384.1 million and $469.1 million reinvested in 2019 and 2018, respectively. These investments are fundamental actions that sustain and strengthen the business. They improve the longer-term efficiency, capacity and flexibility of our production, and they support our strong commitment to superior customer service.
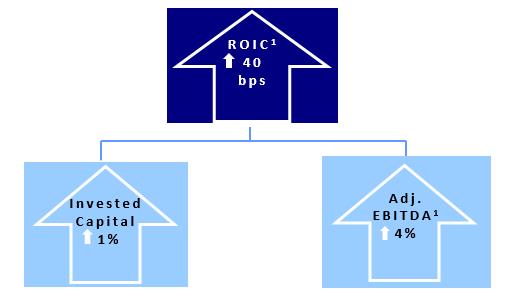
As illustrated below, our annual Return on Invested Capital (ROIC) increased 0.4 percentage points (40 basis points) in 2020 as a 4% increase in Adjusted EBITDA (net earnings decreased 5% in 2020) was leveraged with disciplined capital management (average invested capital only increased 1%).
| 1 | ROIC and Adjusted EBITDA are Non-GAAP financial measures. Non-GAAP financial measures are defined and reconciled within Item 7 under the caption Reconciliation of Non-GAAP Financial Measures. |
| Part I | 5 |
3. compounding improvement in profitability
Our focus on the following four strategic disciplines has made us one of the most profitable public companies in the industry (as measured by aggregates gross profit per ton).
Operational Excellence — Continuous and sustainable improvements in both our operating disciplines and our industry-leading safety performance coupled with better asset utilization through improved availability and throughput leads to effective cost control.
Strategic Sourcing — Leveraging common practices and innovation leads to more time in our plants and with our suppliers to deliver the right parts and services at the right time and optimize the total cost of ownership.
Commercial Excellence — Clearly defined roles and responsibilities together with access to real time, forward-looking metrics leads to our sales teams spending less time on non-selling activities and more time responding to our customers’ needs.
Logistics Innovation – Partnering with our customers (truck drivers and contractors) to provide a bundled logistics solution with digital shipping records and on-site, mobile visibility leads to streamlined scheduling, speed and accuracy of delivery, and efficient back-office processes.
We manage these disciplines locally and align our talent and incentives accordingly. Our knowledgeable and experienced workforce and our flexible production capabilities allow us to manage operational and overhead costs aggressively.
4**.** LA****ND MANAGEMENT
With approximately 240,000 acres in our land portfolio, a long-term holistic approach to preserving land and water is integral to sustaining our success. From pre-mining to mining to reclamation, we are actively managing the entire life cycle of our land, creating maximum value for the business, our shareholders and our communities.
We are putting land to use before we mine by creating opportunities for agriculture and timber development. After mining, our land and water assets will be converted to other valuable uses including drinking water reservoirs, aquifer recharge basins, public parks, habitat mitigation banks, wetlands, productive farmland and residential and commercial developments.
Because of the evolving needs of our communities, we listen to and collaborate with our neighbors to prepare the land for its highest and best use after mining is complete. Our work with state, regional and local governments to develop solutions today will benefit future generations.
5**.** SAFETY, HEALTH AND THE ENVIRONMENT
A strategy for sustainable, long-term value creation must include doing right by your employees, your neighbors and the environment in which you operate. We are a leader in our industry in safety performance by applying the shared experiences, expertise and resources at each of our locally led sites with an emphasis on taking care of one another. We focus on our environmental stewardship programs with the same intensity that we bring to our health and safety initiatives. And, our community relations programs serve our neighbors while ensuring that we grow and thrive in the communities where we operate.
| Part I | 6 |
PRODUCT LINES
Our products are used to build the roads, tunnels, bridges, railroads and airports that connect us, and to build the hospitals, schools, shopping centers, factories and places of worship that are essential to our lives, our communities and the economy. We have four operating (and reportable) segments (Aggregates, Asphalt, Concrete and Calcium) organized around our principal product lines.
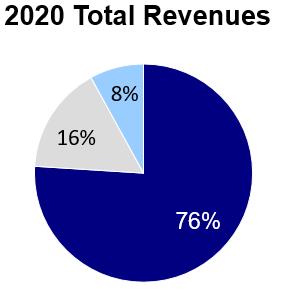
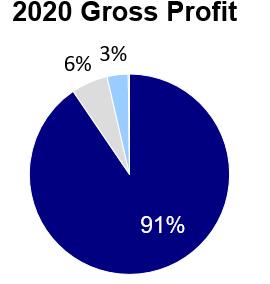
Our 2020 total revenues and gross profit by segment are illustrated as follows (Calcium revenues and gross profit were less than one percent):
 |  |
 |
For actual amounts, see Note 15 “Segment Reporting” in Item 8 “Financial Statements and Supplementary Data.”
We generally ship our products upon receipt of a purchase order or in some cases simply a price quote. Therefore, we do not have a significant order backlog.
1. AGGREGATES
Our construction aggregates are used in a number of ways:
as a base material underneath highways, walkways, airport runways, parking lots and railroads
to aid in water filtration, purification and erosion control
as a raw material used in combination with other resources to construct many of the items we rely on to sustain our quality of life including:
houses and apartments
roads, bridges and parking lots
schools and hospitals
commercial buildings and retail space
sewer systems
power plants
airports and runways
| Part I | 7 |
AGGREGATES INDUSTRY
Factors that affect the U.S. aggregates industry and our business include:
Location and transportation of reserves: Aggregates have a high weight-to-value ratio and, in most cases, must be produced near where they are used; if not, transportation can cost more than the materials, rendering them uncompetitive compared to locally produced materials. Where practical, we have operations located close to our local markets because the cost of trucking materials long distances is prohibitive. Approximately 80% of our total aggregates shipments are delivered exclusively from the producing location to the customer by truck.
Exceptions to this typical market structure include areas along the U.S. Gulf Coast and the Eastern Seaboard where there are limited supplies of locally available, high-quality aggregates. We serve these markets from quarries that have access to cost-effective long-haul transportation — shipping by barge and rail — and from our quarry on Mexico’s Yucatan Peninsula with our fleet of Panamax-class, self-unloading ships. Approximately 17% of our total aggregates shipments are delivered by truck to the customer after reaching a sales yard by rail or water. The remaining 3% of aggregates shipments are delivered directly to the customer by rail or water.
Limited product substitution: There are limited substitutes for quality aggregates. Recycled concrete and asphalt have certain applications as a lower-cost alternative to virgin aggregates. However, many types of construction projects cannot be served by recycled concrete and require the use of virgin aggregates to meet technical specifications and performance-based criteria for durability, strength and other qualities. Likewise, the amount of recycled asphalt included in asphalt mix as a substitute for aggregates is limited due to specifications.
Highly fragmented industry: The U.S. aggregates industry is composed of over 5,000 companies that manage close to 11,000 operations. This fragmented structure provides many opportunities for consolidation. Companies in the industry commonly enter new markets or expand positions in existing markets through the acquisition of existing facilities.
Through strategic acquisitions and investments, we have developed an unmatched coast-to-coast footprint of strategically located permitted reserves concentrated in and serving the nation’s key growth centers. We have over 23,000 customers in 20 states, the District of Columbia and Mexico.
Flexible production capabilities: The production of aggregates is a mechanical process in which stone is crushed and, through a series of screens, separated into various sizes depending on how it will be used. Production capacity is flexible by adjusting operating hours to meet changing market demand. We are currently operating considerably below full capacity, making us extremely well positioned to further benefit from economies of scale when additional growth materializes.
raw material inputs largely ControlLED: Unlike typical industrial manufacturing industries, the aggregates industry does not require the input of raw material beyond owned or leased aggregates reserves. Stone, sand and gravel are naturally occurring resources. However, production does require the use of explosives, hydrocarbon fuels and electric power.
Demand cycles: Long-term growth in demand for aggregates is largely driven by growth in population, jobs and households. While short-term and medium-term demand for aggregates fluctuates with economic cycles, declines have historically been followed by strong recoveries.
The drivers underpinning long-term demand and sustained pricing growth remain firmly in place, in both the public and private sectors of the economy. They include: population growth; gains in total employment (short-term disruption due to COVID-19 pandemic) and in household income and wages; a continuing increase in household formations; the growing need for additional housing stock and housing demand; a multi-year federal transportation law in place and continuing increases in transportation funding at state and local levels; stable state tax receipts; public investment in infrastructure that is still well below the long-term trend-line; and increasing political awareness and acceptance of the need to invest in infrastructure.
| Part I | 8 |
AGGREGATES MARKETS
We focus on the U.S. markets with above-average long-term expected population growth and where construction is expected to expand. Because transportation is a significant part of the delivered cost of aggregates, our facilities are typically located in the markets they serve or have access to economical transportation via rail, barge or ship to a particular end market. We serve both the public and the private sectors.
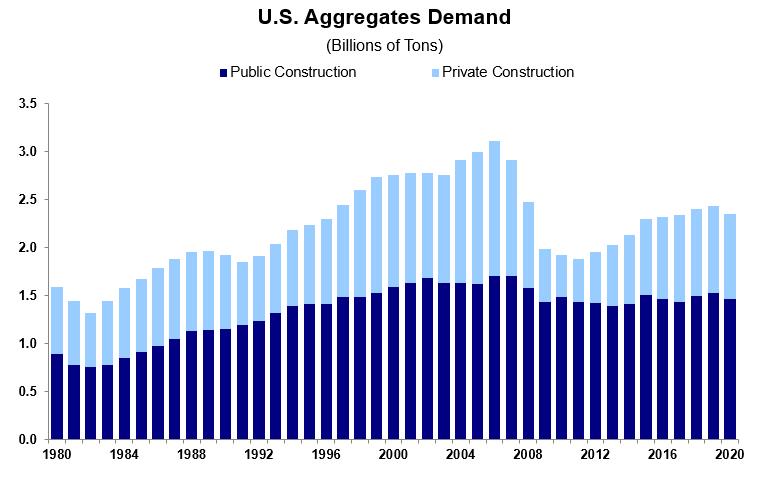
Public sector construction activity has historically been more stable and less cyclical than privately-funded construction, and it generally requires more aggregates per dollar of construction spending. Private sector construction (primarily residential and nonresidential buildings) typically is more affected by general economic cycles than publicly-funded projects (particularly highways, roads and bridges), which tend to receive more consistent levels of funding throughout economic cycles.
**Source: Company estimates
| Part I | 9 |
PUBLIC SECTOR CONSTRUCTION MARKET
Public sector construction includes spending by federal, state, and local governments for highways, bridges, buildings, airports, schools, prisons, sewer and waste disposal systems, water supply systems, dams, reservoirs and other public construction projects. Construction for power plants and other utilities is funded from both public and private sources. In 2020, publicly-funded construction accounted for approximately 43% of our total aggregates shipments, and approximately 23% of our aggregates sales by volume were used in highway construction projects.
Public Sector Funding: Generally, public sector construction spending is more stable than private sector construction spending; public sector spending is less sensitive to interest rates and has historically been supported by multi-year laws, which provide certainty in funding amounts, program structures, rules and regulations. Federal spending is governed by authorization, budget and appropriations laws. The level of state and local spending on infrastructure varies across the United States and depends on individual state needs and economies.
STATE AND LOCAL TRANSPORTATION FUNDING: Since 2012, 32 states have increased or adjusted taxes on motor fuel to increase revenues available for transportation investment. Most recently, in 2020 the Virginia legislature raised its statewide gas tax, and voters in Arkansas renewed a ½ cent sales tax measure originally approved in 2012, to provide significant revenue for highway construction and maintenance through motor fuel tax increases. Other states have increased revenues outside of fuel taxes or made one-time increases. Since 2012, eleven Vulcan-served states representing over 87% of our 2020 total revenues have averaged a 69% increase in their states’ revenues for highways.
In addition, we benefit from state and local transportation funding ballot measures. Major transportation funding measures in Vulcan-served areas approved in 2020 are estimated to result in $2.575 billion in revenues and bond proceeds primarily dedicated to roads, streets and bridges. Across the United States, voters in 18 states approved 94% of 322 measures in 2020, which will generate $14.1 billion in new and recurring transportation investment. This represents a record high approval rate and continues a trend in which voters have approved 83% of nearly 2,300 transportation investment ballot measures since 2010.
federal highway funding****: In December 2015, President Obama signed a new, long-term federal highway and transit authorization bill, Fixing America’s Surface Transportation Infrastructure Act (FAST Act), into law after the final legislation received strong, bipartisan support in both the House and the Senate. The FAST Act provides multi-year funding to state and local governments in support of road, bridge, intermodal and public transportation projects. President Trump signed a one-year extension of the FAST Act into law in 2020.
The FAST Act increases Federal-Aid Highway Program funding from $41 billion in the federal fiscal year (FFY) 2015 to $47 billion in FFY 2021. The Bipartisan Budget Act of 2018 added approximately $2 billion per year to base highway programs in 2018 and 2019. In addition, for FFY 2021, state departments of transportation were allocated $10 billion in emergency aid from the $900 billion Coronavirus Response and Relief Supplemental Appropriations Act, a COVID-19 relief measure passed by Congress in December 2020 as part of a final year-end legislative package.
The long-term nature of the FAST Act is important. The Federal-Aid Highway Program is the largest component of the law and has provided, on average, 52% of all state capital investment in roads and bridges over the last 10 years. This multi-year authorization and the associated dedicated funding provides state departments of transportation with the ability to plan and execute long-range, complex highway projects.
The FAST Act also contains important policy changes. To further accelerate the project delivery process, it augments the environmental review and permitting process reforms contained in the prior law, Moving Ahead for Progress in the 21st Century Act (MAP-21). The FAST Act also provides assistance for states making investments in major capital projects — particularly freight projects. In states where we operate, we are well positioned to serve the large general contractors who will compete for new freight and other major capacity projects that will move forward with FAST Act funding and policy implementation.
Project financing remains an important additional component of overall surface transportation spending, with the Transportation Infrastructure Finance & Innovation Act (TIFIA) program authorized at $275 million (in line with the previous program outlays) and growing to $300 million by 2020. The FAST Act also created a new National Surface Transportation and Innovative Finance Bureau to provide technical assistance to states seeking to pursue public-private partnerships and other financing arrangements for transportation projects.
| Part I | 10 |
The FAST Act extension expires on September 30, 2021. Congress is in the process of developing policy and funding legislative proposals for FAST Act reauthorization. It would not be atypical for additional extensions of current law to be required to provide Congress with adequate time to complete the reauthorization process. Historically, there is minimal disruption to the flow of federal funding to state and local projects due to extensions.
FEDERAL WATER INFRASTRUCTURE: In December 2020, President Trump signed the Water Resources Development Act of 2020 (WRDA 2020) into law, enacting the fourth consecutive biennial authorization for the U.S. Army Corps of Engineers (Army Corps) since 2014. WRDA 2020 reauthorizes needed investment in America’s ports, channels, locks, dams, and other infrastructure that supports the maritime and waterways transportation system and provides flood protection for communities. It also improves the United States Environmental Protection Agency’s (EPA) programs for storm water, water recycling, and sewer overflow projects. The FFY 2021 appropriations for the Corps, also passed as part of the year-end legislative package, funds for the first time the Army Corps Water Infrastructure Financing Program (CWIFP), which was authorized in the Water Resources Reform and Development Act of 2014 (WRRDA 2014). Modeled after the highly popular TIFIA program in the surface transportation sector, CWIFP will accelerate non-federal investments in water resources infrastructure by providing long-term, low-cost loans to creditworthy borrowers.
P****rivate sector CONSTRUCTION MARKET
The private sector construction markets include both nonresidential building construction and residential construction and are considerably more cyclical than public construction. In 2020, privately-funded construction accounted for approximately 57% of our total aggregates shipments.
Nonresidential Construction: Private nonresidential building construction includes a wide array of projects. Such projects generally are more aggregates intensive than residential construction. Overall demand in private nonresidential construction generally is driven by job growth, vacancy rates, private infrastructure needs and demographic trends. The growth of the private workforce creates demand for offices, hotels and restaurants. Likewise, population growth generates demand for stores, shopping centers, warehouses and parking decks as well as hospitals, places of worship and entertainment facilities. Large industrial projects, such as a new manufacturing facility, can increase the need for other manufacturing plants to supply parts and assemblies. Construction activity in this end market is influenced by a firm's ability to finance a project and the cost of such financing. This end market also includes capital investments in public nonresidential facilities to meet the needs of a growing population.
Residential Construction: Household formations in Vulcan-served states continue to outpace household formations in the rest of the United States. The majority of residential construction is for single-family housing with the remainder consisting of multi-family construction (i.e., two family houses, apartment buildings and condominiums). Public housing comprises only a small portion of housing demand. Construction activity in this end market is influenced by the cost and availability of mortgage financing and builders’ ability to maintain skilled labor.
U.S. housing starts, as measured by Dodge Data & Analytics data, peaked in early 2006 at over 2 million units annually. By the end of 2009, total housing starts had declined to less than 0.6 million units, well below prior historical lows of approximately 1 million units annually. In 2020, total annual housing starts in the U.S. reached 1.475 million units.
ADDITIONAL AGGREGATES PRODUCTS AND MARKETS
We sell aggregates that are used as ballast for construction and maintenance of railroad tracks. We also sell riprap and jetty stone for erosion control along roads and waterways. In addition, stone can be used as a feedstock for cement and lime plants and for making a variety of adhesives, fillers and extenders. Coal-burning power plants use limestone in scrubbers to reduce harmful emissions. Limestone that is crushed to a fine powder can be sold as agricultural lime.
We sell a relatively small amount of construction aggregates outside of the United States, principally in the areas surrounding our large quarry on the Yucatan Peninsula in Mexico. Nondomestic sales and long-lived assets outside the United States are reported in Note 15 “Segment Reporting” in Item 8 “Financial Statements and Supplementary Data.”
| Part I | 11 |
VERTICAL INTEGRATION
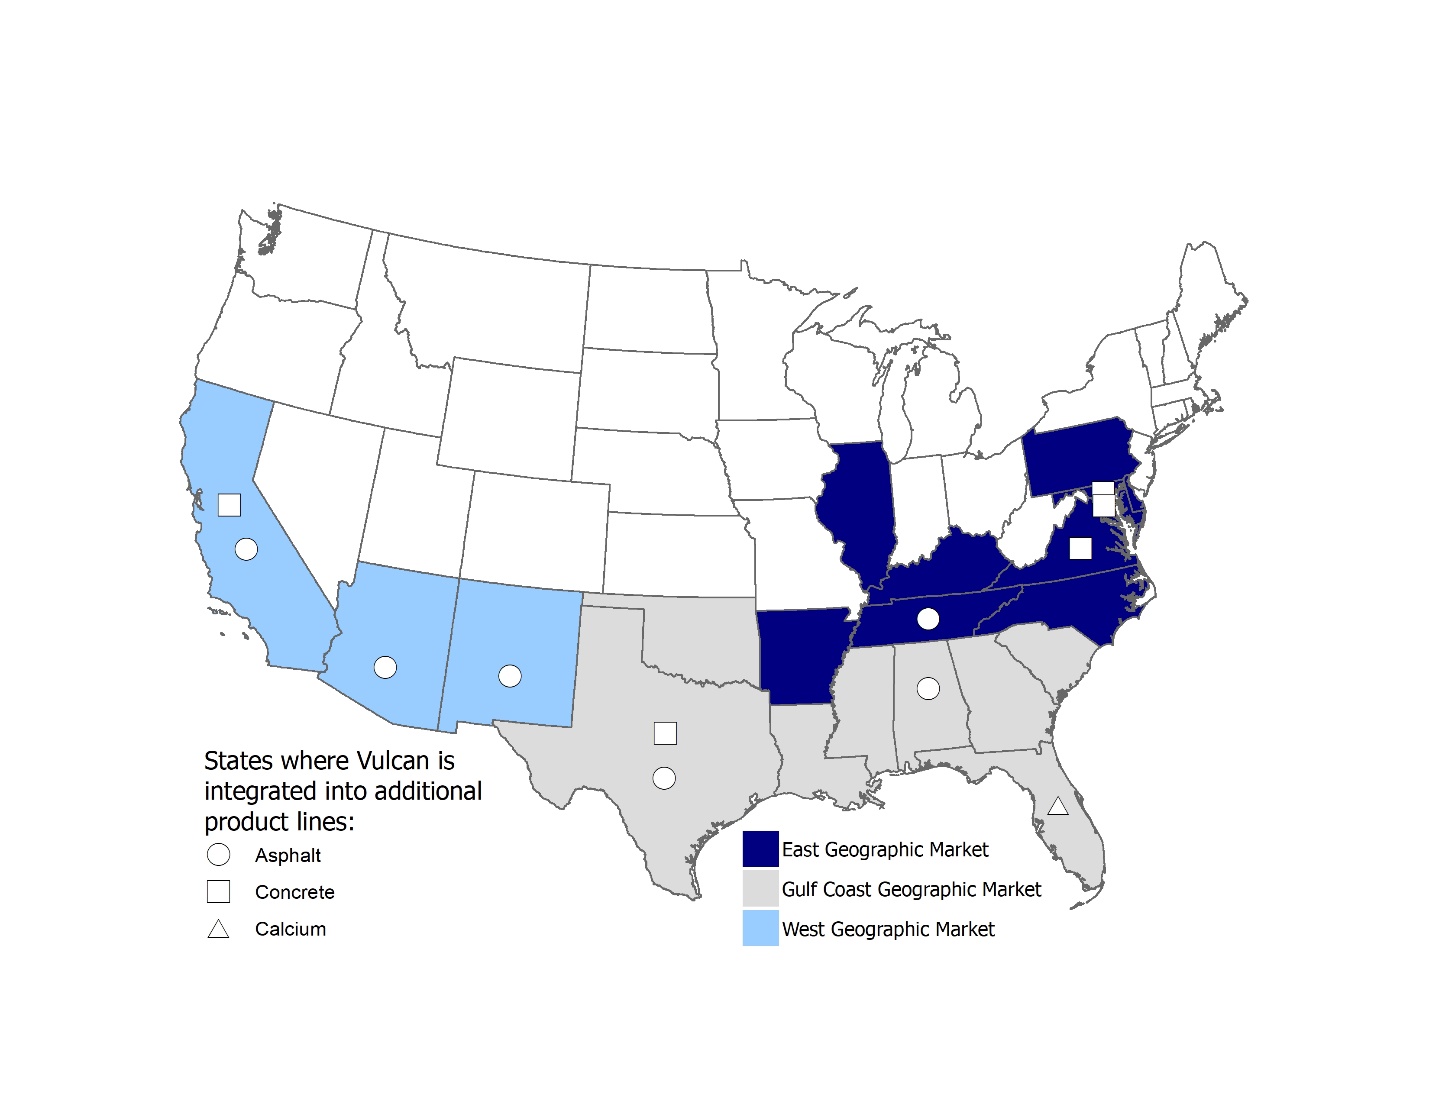
While aggregates is our focus and primary business, we believe vertical integration between aggregates and downstream products, such as asphalt mix and ready-mixed concrete, can be managed effectively in certain markets to generate attractive financial returns and enhance financial returns in our core Aggregates segment. We produce and sell asphalt mix and/or ready-mixed concrete within each of our three geographic markets, as noted below. Aggregates comprise approximately 95% of asphalt mix by weight and 80% of ready-mixed concrete by weight. In both of these downstream businesses, aggregates are primarily supplied from our operations.
| Part I | 12 |
2. ASPHALT
We produce and sell asphalt mix in Alabama, Arizona, California, New Mexico, Tennessee and Texas. In October 2020, we strengthened our asphalt position in Texas by acquiring additional asphalt operations. In June 2018, we acquired additional asphalt mix operations and a construction paving business in Texas. In March 2018, we entered the Alabama asphalt market through the acquisition of an aggregates, asphalt mix and construction paving business. For additional details, see Note 19 “Acquisitions and Divestitures” in Item 8 “Financial Statements and Supplementary Data.”
This segment relies on our reserves of aggregates, functioning essentially as a customer to our aggregates operations. Aggregates are a major component in asphalt mix, comprising approximately 95% by weight of this product. We meet the aggregates requirements for our Asphalt segment primarily through our Aggregates segment. These product transfers are made at local market prices for the particular grade and quality of material required.
Because asphalt mix hardens rapidly, delivery typically is within close proximity to the producing facility. The asphalt mix production process requires liquid asphalt cement, which we purchase from third-party producers. We do not anticipate any significant difficulties in obtaining the raw materials necessary for this segment to operate. We serve our Asphalt segment customers directly from our local production facilities.
3. CONCRETE
We produce and sell ready-mixed concrete in California, Maryland, Texas, Virginia and Washington D.C. In April 2020, we exited the New Mexico ready-mixed concrete market (we retained the concrete plants and mobile fleet which is leased to the buyer and obtained a 20-year aggregates supply agreement). In October 2019, we expanded our ready-mixed concrete operations in Virginia via an acquisition. In March 2018, we exited the Georgia ready-mixed concrete market (we retained all real property which is leased to the buyer and obtained a long-term aggregates supply agreement). For additional details see Note 19 “Acquisitions and Divestitures” in Item 8 “Financial Statements and Supplementary Data.”
This segment relies on our reserves of aggregates, functioning essentially as a customer to our aggregates operations. Aggregates are a major component in ready-mixed concrete, comprising approximately 80% by weight of this product. We meet the aggregates requirements of our Concrete segment primarily through our Aggregates segment. These product transfers are made at local market prices for the particular grade and quality of material required.
Because ready-mixed concrete hardens rapidly, delivery typically is within close proximity to the producing facility. Ready-mixed concrete production also requires cement which we purchase from third-party producers. We do not anticipate any significant difficulties in obtaining the raw materials necessary for this segment to operate. We serve our Concrete segment customers from our local production facilities or by truck.
4. CALCIUM
Our Calcium segment is composed of a single calcium operation in Brooksville, Florida. This facility produces calcium products for the animal feed, plastics and water treatment industries with high-quality calcium carbonate material mined at the Brooksville quarry.
| Part I | 13 |
OTHER BUSINESS-RELATED ITEMS
SEASONALITY AND CYCLICAL NATURE OF OUR BUSINESS
Almost all of our products are produced and consumed outdoors. Seasonal changes and other weather-related conditions can affect the production and sales volumes of our products. Therefore, the financial results for any quarter do not necessarily indicate the results expected for the year. Normally, the highest sales and earnings are in the third quarter and the lowest are in the first quarter. Furthermore, our sales and earnings are sensitive to national, regional and local economic conditions, demographic and population fluctuations, and particularly to cyclical swings in construction spending, primarily in the private sector.
COMPETITORS
We operate in a fragmented industry with a large number of small, privately-held companies. We estimate that the ten largest aggregates producers accounted for 31% of the total U.S. aggregates production in 2020. Despite being the industry leader, Vulcan’s total U.S. market share is less than 10%. Other publicly traded companies among the ten largest U.S. aggregates producers include the following:
Cemex S.A.B. de C.V.
CRH plc
HeidelbergCement AG
LafargeHolcim
Martin Marietta Materials, Inc.
MDU Resources Group, Inc.
Summit Materials, Inc.
Because the U.S. aggregates industry is highly fragmented, with over 5,000 companies managing close to 11,000 operations during 2020, many opportunities for consolidation exist. Therefore, companies in the industry tend to grow by acquiring existing facilities to enter new markets or extend their existing market positions.
CUSTOMERS
No material part of our business depends upon any single customer whose loss would have a significant adverse effect on our business. In 2020, our five largest customers accounted for 7.5% of our total revenues, and no single customer accounted for more than 1.8% of our total revenues. Although approximately 45% to 55% of our aggregates shipments have historically been used in publicly-funded construction, such as highways, airports and government buildings, a relatively small portion of our sales are made directly to federal, state, county or municipal governments/agencies. Therefore, although reductions in state and federal funding can curtail publicly-funded construction, the vast majority of our business is not directly subject to renegotiation of profits or termination of contracts with local, state or federal governments. In addition, our sales to government entities span several hundred entities coast-to-coast, ensuring that negative changes to various government budgets would have a muted impact across such a diversified set of government customers.
| Part I | 14 |
ENVIRONMENTAL COSTS AND GOVERNMENTAL REGULATION
We are subject to a wide variety of federal, state and local laws and regulations in the communities where we conduct business. Compliance with these laws and regulations often requires the time and effort of our employees, as well as financial resources. The following describes certain significant regulations that may impact our business. For additional information about our risks related to government regulations, see Item 1A “Risk Factors.”
Our operations are subject to numerous laws and regulations relating to the protection of the environment and worker health and safety; including regulation of facility air emissions and water discharges, waste management, protection of wetlands, listed and threatened species, noise and dust exposure control for workers, and safety regulations under both Mine Safety and Health Administration (MSHA) and Occupational Safety and Health Administration (OSHA). Compliance with these various regulations requires capital investment, and ongoing expenditures for the operation and maintenance of systems and implementation of programs. We estimate that capital expenditures for environmental control facilities in 2021 and 2022 will be $11.3 million and $7.5 million, respectively. These anticipated expenditures are not material to our earnings or competitive position.
We have received notices from the EPA or similar state or local agencies that we are considered a potentially responsible party (PRP) at a limited number of sites under the Comprehensive Environmental Response, Compensation and Liability Act (CERCLA or Superfund) or similar state and local environmental laws. Generally we share the cost of remediation at these sites with other PRPs or alleged PRPs in accordance with negotiated or prescribed allocations. There is inherent uncertainty in determining the potential cost of remediating a given site and in determining any individual party's share in that cost. As a result, estimates can change substantially as additional information becomes available about the nature or extent of site contamination, remediation methods, other PRPs and their probable level of involvement, and actions by or against governmental agencies or private parties.
Frequently, we are required by state and local regulations or contractual obligations to reclaim our former mining sites. These reclamation liabilities are recorded at fair value in our financial statements at the time the obligation arises. To determine the fair value, we estimate the cost for a third party to perform the legally required reclamation, which is adjusted for inflation and risk and includes a reasonable profit margin. Reclaimed quarries often have potential for use in commercial or residential development or as reservoirs or landfills. However, no projected cash flows from these anticipated uses have been considered to offset or reduce the estimated reclamation liability.
For additional information about environmental matters and reclamation obligations, see Notes 12 and 17, respectively, to the consolidated financial statements in Item 8 “Financial Statements and Supplementary Data.”
HUMAN CAPITAL
As of January 1, 2021, we employed 8,431 people in the United States. Of these employees, 651 are represented by labor unions. Also, as of that date, we employed 415 people in Mexico and 1 person in the Bahamas, and of these employees, 339 are represented by labor unions. We do not anticipate any significant issues with any unions in 2021.
Vulcan’s commitment to our people has played a key role in the ongoing success and growth of our company throughout our long history. We are dedicated to fostering a culture of mutual respect, integrity, teamwork and trust among our workforce. Our people share a competitive drive to be the best they can be and do the right thing, which benefits all our stakeholders.
Diversity and inclusion are important values at Vulcan. Our continued investment in people and strong commitment to diversity and inclusion will help us attract, grow and retain the best talent possible. In 2015, we escalated and formalized our efforts in this area with the launch of our Diversity and Inclusion Council to promote an open workplace where everyone, regardless of background, race, or other factors is free to contribute and grow. In 2019, we signed the CEO Action for Diversity & InclusionTM pledge and we forged a long-term partnership with Historically Black Colleges and Universities (HBCUs) to support our future leaders in our communities and on our team.
As a result of our commitment to diversity and inclusion we have:
Cultivated a diverse talent pipeline of next generation leaders through our operations/sales trainee program
Expanded the diversity of our workforce at middle management and higher levels
Increased the number of female hires and promotions in senior leadership roles
Developed a five-year strategy through our Diversity and Inclusion Council
Built partnerships with HBCUs to recruit talented minority students for internships and management training roles
| Part I | 15 |
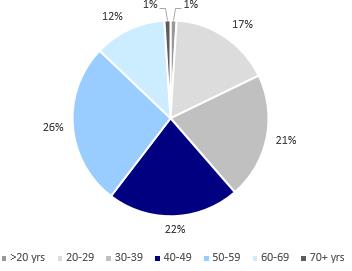
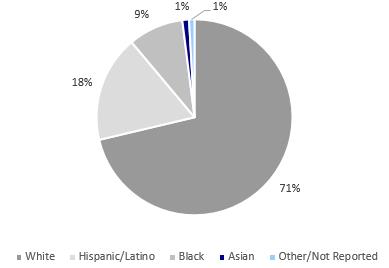
Today, approximately 38% of our workforce is diverse, and we have a number of initiatives to continue building a diverse and inclusive workforce. We have more than doubled the number of diverse Division and Corporate officers since 2013. Our Board of Directors is 36% diverse; and, we earned recognition in 2017 by 2020 Women on Boards for having 20% or more of our board seats held by women.
We believe that learning is fundamental to every job and we encourage our people to expand and explore their capabilities for continued growth. Our industry-leading training and development programs encourage collaboration and enable people to innovate and flourish on the job and in the community. These programs:
Provide our employees with a Tuition Reimbursement Program which pays up to 100% of tuition costs based on academic performance
Encourage personal and professional growth through our mentoring program which has graduated more than 1,906 employees
Prepare future senior-level leaders through our Leadership 2022 series in partnership with the University of North Carolina, Chapel Hill
Offer mini MBA programs and other continuing education opportunities
The result is strong employee engagement that puts Vulcan in the top 10% in our most recent McKinsey & Company’s Organizational Health Index cycle (2017), which benchmarked Vulcan against over 5 million respondents from 1,700 companies.
| Employee Tenure | Employees by Age Group |
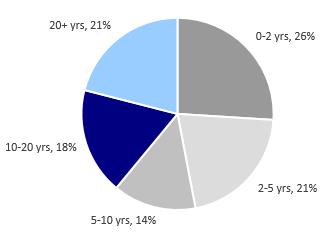 |  |
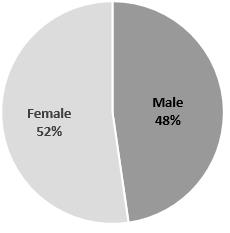
| Workforce Racial/Ethnic Diversity | Salaried Non-Exempt Employees by Gender |
 |  |
| Part I | 16 |
shareholder return performance
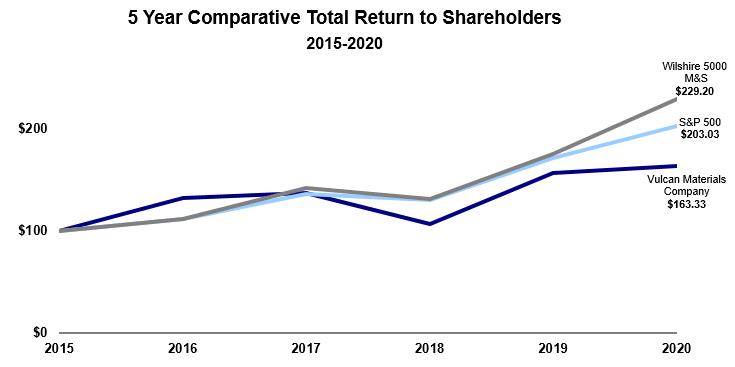
Below is a graph comparing the performance of our common stock, with dividends reinvested, to that of the Standard & Poor’s 500 Stock Index (S&P 500) and the Materials and Services Sector of the Wilshire 5000 Index (Wilshire 5000 M&S) from December 31, 2015 to December 31, 2020. The Wilshire 5000 M&S is a market capitalization weighted sector containing public equities of firms in the Materials and Services sector, which includes our company and approximately 1,300 other companies.
| 2015 | 2016 | 2017 | 2018 | 2019 | 2020 | |||||||||||||||||
| Comparative Total Return 1 | ||||||||||||||||||||||
| Vulcan Materials Company | $ 100.00 | $ 132.69 | $ 137.21 | $ 106.66 | $ 156.86 | $ 163.33 | ||||||||||||||||
| S&P 500 | $ 100.00 | $ 111.96 | $ 136.40 | $ 130.43 | $ 171.48 | $ 203.03 | ||||||||||||||||
| Wilshire 5000 M&S | $ 100.00 | $ 111.39 | $ 142.11 | $ 131.47 | $ 175.29 | $ 229.20 |
| 1 | Assumes an initial investment at December 31, 2015 of $100 in each stock/index, with quarterly reinvestment of dividends. |
| Part I | 17 |
INVESTOR INFORMATION
We make available on our website, www.vulcanmaterials.com, free of charge, copies of our:
Annual Report on Form 10-K
Quarterly Reports on Form 10-Q
Current Reports on Form 8-K
Our website also includes amendments to those reports filed with or furnished to the Securities and Exchange Commission (SEC) pursuant to Section 13(a) or 15(d) of the Securities Exchange Act of 1934 as well as all Forms 3, 4 and 5 filed with the SEC by our executive officers and directors, as soon as the filings are made publicly available by the SEC on its EDGAR database (www.sec.gov).
In addition to accessing copies of our reports online, you may request a copy of our Annual Report on Form 10-K, including financial statements, by writing to Denson N. Franklin III, Senior Vice President, General Counsel and Secretary, Vulcan Materials Company, 1200 Urban Center Drive, Birmingham, Alabama 35242.
We have a:
Business Conduct Policy applicable to all employees and directors
Code of Ethics for the CEO and Senior Financial Officers
Copies of the Business Conduct Policy and the Code of Ethics are available on our website under the heading “Corporate Governance” under the “Investor Relations” tab. If we make any amendment to, or waiver of, any provision of the Code of Ethics, we will disclose such information on our website as well as through filings with the SEC.
Our Board of Directors has also adopted:
Corporate Governance Guidelines
Charters for our Audit, Compensation, Executive, Finance, Governance and Safety, Health & Environmental Affairs Committees
These documents meet all applicable SEC and New York Stock Exchange (NYSE) regulatory requirements.
The Charters of the Audit, Compensation and Governance Committees are available on our website under the heading “Corporate Governance” under the “Investor Relations” tab or you may request a copy of any of these documents by writing to Denson N. Franklin III, Senior Vice President, General Counsel and Secretary, Vulcan Materials Company, 1200 Urban Center Drive, Birmingham, Alabama 35242.
Information included on our website is not incorporated into, or otherwise made a part of, this report.
CERTIFICATIONS AND ASSERTIONS
The certifications of our Chief Executive Officer and Chief Financial Officer made pursuant to Section 302 of the Sarbanes-Oxley Act of 2002 are included as exhibits to this Annual Report on Form 10-K. Additionally, on June 4, 2020 our Chief Executive Officer submitted to the NYSE the annual written affirmation required by the rules of the NYSE certifying that he was not aware of any violations of Vulcan Materials Company of NYSE corporate governance listing standards.
| Part I | 18 |
Item 1A. RISK FACTORS
RISK FACTORS
The following risks could materially and adversely affect our business, financial condition and results of operations, and cause the trading price of our common stock to decline. These risk factors do not identify all risks that we face; our operations could also be affected by factors that are not presently known to us or that we currently consider to be immaterial to our operations. Due to risks and uncertainties, known and unknown, our past financial results may not be a reliable indicator of future performance and historical trends should not be used to anticipate results or trends in future periods. You should also refer to the other information set forth in this Annual Report on Form 10-K, including Item 7 “Management’s Discussion and Analysis of Financial Condition and Results of Operations” and Item 8 “Financial Statements and Supplementary Data.”
ECONOMIC/POLITICAL RISKS
Our business is dependent on the construction industry and is subject to economic cycles — Our products are principally sold to the U.S. construction industry. Since our business is dependent on spending in both the public and private sector construction markets, our profits are sensitive to the underlying national, regional, and local economic conditions. Construction spending, which is cyclical, is affected by general economic conditions, changes in interest rates, demographic shifts, industry cycles, employment levels, inflation and other business, economic and financial factors that are beyond our control. A downturn in construction activities or spending in Vulcan-served markets, particularly in our top revenue-generating markets, could have a material adverse effect on our business, financial condition, and results of operations.
A pandemic, epidemic or other public health emergency, such as the recent outbreak of the current coronavirus (COVID-19) pandemic, could have a material adverse effect on our business, results of operations, financial condition and cash flows — Our operations expose us to risks associated with pandemics, epidemics or other public health emergencies, such as the COVID-19 pandemic. In March 2020, the World Health Organization characterized COVID-19 as a pandemic, and the President of the United States declared the COVID-19 outbreak a national emergency. The outbreak has resulted in governments around the world implementing or reimplementing strict measures to help control the spread of the virus, including quarantines, “shelter in place” and “stay at home” orders, travel restrictions, business curtailments, school closures, and other measures. In addition, governments and central banks in several parts of the world have enacted fiscal and monetary stimulus measures to counteract the impacts of the COVID-19 pandemic, and may take further action as circumstances warrant.
Consistent with federal guidelines and with state and local orders to date, we currently continue to operate across our footprint as an essential business. Notwithstanding our continued operations and an economic environment that has shown signs of improvement, the COVID-19 pandemic has had and may have further negative impacts on our operations, supply chain, transportation networks and customers, which may lower our revenues and EBITDA, including as a result of preventative and precautionary measures that we, other businesses and governments are taking. The COVID-19 pandemic is a widespread public health crisis that is adversely affecting the economies and financial markets of many countries. Any resulting economic downturn could adversely affect demand for our products and contribute to volatile supply and demand conditions affecting prices and volumes in the markets for our products and services. The progression of this matter has and may continue to negatively impact our business or results of operations by affecting the health of our employees and through the temporary closure of our operating locations or those of our customers or suppliers. The extent to which the COVID-19 outbreak impacts our business, results of operations, financial condition or cash flows will depend on future developments, which remain highly uncertain and cannot be predicted, including, but not limited to, the duration and geographic spread of the outbreak, its severity, the actions to contain the virus or treat its impact including the reimplementation of restrictions on economic activity following new outbreaks, the long-term impacts of the virus on transportation revenues, government budgets and other funding priorities and the extent and pace at which normal economic and operating conditions can resume. There can be no assurance that we will not be impacted by adverse consequences that may be brought about by pandemics on global financial markets, which may reduce resources, share prices and financial liquidity and may severely limit the availability of financing capital.
| Part I | 19 |
Changes in legal requirements and governmental policies concerning zoning, land use, environmental and other areas of the law may result in additional liabilities, a reduction in operating hours and additional capital expenditures — Our operations are affected by numerous federal, state and local laws and regulations related to zoning, land use and environmental matters. Despite our compliance efforts, we have an inherent risk of liability in the operation of our business. These potential liabilities could have an adverse impact on our operations and profitability. In addition, our operations require numerous governmental approvals and permits, which often require us to make significant capital and operating expenditures to comply with the applicable requirements. Stricter laws and regulations, or more stringent interpretations of existing laws or regulations, may impose new liabilities, taxes or tariffs on us, reduce operating hours, require additional investment by us in pollution control equipment, create restrictions on our products or impede our access to reserves or opening new or expanding existing plants or facilities.
Our business is dependent on the timing and amount of federal, state and local funding for infrastructure — Our products are used in a variety of public infrastructure projects that are funded and financed by federal, state and local governments. In 2020, voters in local jurisdictions in Arizona, California, Florida, Georgia, North Carolina, South Carolina, Texas and Virginia, among others, approved bond and revenue-raising measures to provide additional resources for transportation projects. In 2020, Virginia passed new long-term highway funding legislation and voters in Arkansas made permanent a ½ cent gas tax increase first approved in 2012. The federal FAST Act, a five year, fully-funded road, bridge and public transportation authorization law, was extended for a year, and continues to provide assistance to state DOTs and metro areas while Congress contemplates new long-term highway and transit legislation in 2021. However, given varying state and local budgetary situations and the associated pressure on infrastructure spending, we cannot be entirely assured of the existence, amount and timing of appropriations for future public infrastructure projects.
Climate change and climate change legislation or regulations may adversely impact our business — A number of governmental bodies have introduced or are contemplating legislative and regulatory change in response to the potential impacts of climate change. Such legislation or regulation, if enacted, potentially could include provisions for a “cap and trade” system of allowances and credits or a carbon tax, among other provisions.
Other potential impacts of climate change include physical impacts, such as disruption in production and product distribution due to impacts from major storm events, shifts in regional weather patterns and intensities, availability of water and potential impacts from sea level changes. There is also a potential for climate change legislation and regulation to adversely impact the cost of purchased energy and electricity. A number of our facilities are located in desert climates, and while we have not experienced any significant shortages of energy or water in the past, we cannot guarantee that we will not in the future. Furthermore, public expectations for reductions in greenhouse gas emissions could result in increased energy, transportation and raw material costs, and may require us to make additional investments in facilities and equipment.
The impacts of climate change on our operations and the company overall are highly uncertain and difficult to estimate. However, climate change legislation and regulation concerning greenhouse gases could have a material adverse effect on our future financial position, results of operations or cash flows.
We are subject to various risks arising from our international business operations and relationships, which could adversely affect our business — We have international operations and are subject to both the risks of conducting international business and the requirements of the Foreign Corrupt Practices Act of 1977 (the FCPA). We face political and other risks associated with our international operations, including our largest production facility located in Playa del Carmen, Mexico. These risks may include changes in international trade policies, such as the United States - Mexico - Canada Agreement (USMCA), imposition of duties, taxes or government royalties, arbitrary changes to permits, zoning classifications or operating agreements, or overt acts by foreign governments, including expropriations and other forms of takings of property. In addition, failure to comply with the FCPA may result in legal claims against us.
GROWTH AND COMPETITIVE RISKS
Within our local markets, we operate in a highly competitive industry which may negatively impact prices, volumes and costs — The construction aggregates industry is highly fragmented with a large number of independent local producers in a number of our markets. Additionally, in most markets, we also compete against large private and public companies, some of which are significantly vertically integrated. Therefore, there is intense competition in a number of markets in which we operate. This significant competition could lead to lower prices and lower sales volumes in some markets, negatively affecting our earnings and cash flows.
| Part I | 20 |
The expanded use of aggregates substitutes could have a material adverse effect on our business, financial condition and results of operations — Recycled concrete and asphalt are increasingly being used in a number of our markets, particularly urban markets, as a substitute for aggregates. The expanded use of recycled concrete and asphalt could cause a significant reduction in the demand for aggregates.
Our long-term success depends upon securing and permitting aggregates reserves in strategically located areas**. If we are unable to secure and permit such reserves it could negatively affect our future earnings** — Construction aggregates are bulky and heavy and, therefore, difficult to transport efficiently. Because of the nature of the products, the freight costs can quickly surpass the production costs. Therefore, except for geographic regions that do not possess commercially viable deposits of aggregates and are served by rail, barge or ship, the markets for our products tend to be localized around our quarry sites and are served by truck. New quarry sites often take years to develop; therefore, our strategic planning and new site development must stay ahead of actual growth. Additionally, in a number of urban and suburban areas in which we operate, it is increasingly difficult to permit new sites or expand existing sites due to community resistance. Therefore, our future success is dependent, in part, on our ability to accurately forecast future areas of high growth in order to locate optimal facility sites and on our ability to secure operating and environmental permits to operate at those sites.
Our future growth depends in part on acquiring other businesses in our industry and successfully integrating them with our existing operations**. If we are unable to integrate acquisitions successfully, it could lead to higher costs and could negatively affect our earnings —** The expansion of our business is dependent in part on the acquisition of existing businesses that own or control aggregates reserves. Disruptions in the availability of financing could make it more difficult to capitalize on potential acquisitions. Additionally, with regard to the acquisitions we are able to complete, our future results will depend in part on our ability to successfully integrate these businesses with our existing operations.
FINANCIAL/ACCOUNTING RISKS
Our industry is capital intensive, resulting in significant fixed and semi-fixed costs**. Therefore, our earnings are highly sensitive to changes in product shipments —** Due to the high levels of fixed capital required for extracting and producing construction aggregates, our profits are negatively affected by significant decreases in shipments.
Significant downturn in the construction industry may result in an impairment of our goodwill — We test goodwill for impairment on an annual basis or more frequently if events or circumstances change in a manner that would more likely than not reduce the fair value of a reporting unit below its carrying value. While we have not identified any events or changes in circumstances since our annual impairment test on November 1, 2020 that indicate the fair value of any of our reporting units is below its carrying value, a significant downturn in the construction industry may have a material effect on the fair value of our reporting units. A significant decrease in the estimated fair value of one or more of our reporting units could result in the recognition of a material, noncash write-down of goodwill.
A deterioration in our credit ratings and/or the state of the capital markets could negatively impact the cost and/or availability of financing — We currently have $3.36 billion of debt with maturities between 2021 and 2048. Given our current credit metrics and ratings, together with other factors, we expect to refinance our nearer term debt maturities rather than repay them when due. Furthermore, we expect to finance acquisitions with a combination of cash flows from existing operations, additional debt and/or additional equity. The mix of financing sources for acquisitions will be situationally dependent.
A deterioration in our credit ratings, regardless of the cause, could limit our debt financing options and increase the cost of such debt financing. While we do not anticipate a credit ratings downgrade, and plan to manage our capital structure consistent with investment-grade credit metrics, we cannot assure our current credit ratings.
A deterioration in the state of the capital markets, regardless of our credit ratings, could impact our access to, and cost of, new debt or equity capital.
| Part I | 21 |
We use estimates in accounting for a number of significant items**. Changes in our estimates could adversely affect our future financial results —** As discussed more fully in “Critical Accounting Policies” under Item 7 “Management’s Discussion and Analysis of Financial Condition and Results of Operations,” we use significant judgment in accounting for:
goodwill impairment
impairment of long-lived assets excluding goodwill
business combinations and purchase price allocation
pension and other postretirement benefits
environmental compliance costs
claims and litigation including self-insurance
income taxes
These assumptions and estimates could change significantly in the future and could adversely affect our financial position, results of operations, or cash flows.
The phase-out of LIBOR, or the replacement of LIBOR with a different reference rate or modification of the method used to calculate LIBOR, may adversely affect interest rates — LIBOR is an interest rate benchmark used as a reference rate for a wide range of financial transactions. In July 2017, the United Kingdom’s Financial Conduct Authority, which regulates LIBOR, announced that it intends to stop compelling banks to submit LIBOR rates after 2021. It is unclear whether LIBOR will cease to exist at that time (and if so, what reference rate will replace it) or if new methods of calculating LIBOR will be established such that it continues to exist after 2021. The Alternative Reference Rates Committee (ARRC) has proposed the Secured Overnight Financing Rate (SOFR) as the alternative to U.S. LIBOR. ARRC has proposed a paced market transition plan to SOFR from LIBOR, and organizations are currently working on industry wide and company specific transition plans. Uncertainty exists as to the transition process and broad acceptance of SOFR as the primary alternative to LIBOR. We have two material debt instruments with LIBOR as a reference rate: 1) $500.0 million floating-rate notes due March 2021, and 2) $1,000.0 million line of credit (none outstanding at December 31, 2020) due September 2025. At this time, we cannot predict the impact of a departure from LIBOR as a reference rate.
PERSONNEL RISKS
Our future success greatly depends upon attracting and retaining qualified personnel, particularly in sales and operations — A significant factor in our future profitability is our ability to attract, develop and retain qualified personnel. Our success in attracting qualified personnel, particularly in the areas of sales and operations, is affected by changing demographics of the available pool of workers with the training and skills necessary to fill the available positions, the impact on the labor supply due to general economic conditions, and our ability to offer competitive compensation and benefit packages.
Disputes with organized labor could disrupt our business operations — Labor unions represent approximately 11% of our workforce. Disputes with our trade unions, or the inability to renew our labor agreements, may lead to strikes or other actions that could disrupt our business operations leading to higher costs and/or reduced revenues.
| Part I | 22 |
GENERAL RISK FACTORS
A significant interruption of our information technology systems or the loss of confidential or other sensitive data could have a material adverse impact on our operations and financial results — Given our reliance on information technology (our own and that of our service providers’ such as Amazon Web Services), a significant interruption in the availability of information technology or the loss of confidential, personal, or proprietary information (whether our own, our employees’, our suppliers’, or our customers’), regardless of the cause, could negatively impact our operations and financial results. We have a dedicated information security team that executes, and updates as warranted based on emerging risk and new risk management technology, our information security program. The Audit Committee, which has oversight responsibility for our information security program, is briefed on such program at least twice annually, and our Chief Financial Officer is briefed on such program at least quarterly. While we have invested in the protection of our data and information technology and routinely test the security of our information systems network, we cannot be assured that our efforts will prevent breakdowns or breaches in our systems that could adversely affect our business.
Weather can materially affect our operating results — Almost all of our products are consumed outdoors in the public or private construction industry, and our production and distribution facilities are located outdoors. Inclement weather affects both our ability to produce and distribute our products and affects our customers’ short-term demand because their work also can be hampered by weather.
Our products are transported by truck, rail, barge or ship, often by third-party providers. Significant delays or increased costs affecting these transportation methods could materially affect our operations and earnings — Our products are distributed either by truck to local markets or by rail, barge or oceangoing vessel to remote markets. The costs of transporting our products could be negatively affected by factors outside of our control, including rail service interruptions or rate increases, tariffs, rising fuel costs, truck/railcar/barge shortages, truck driver and rail crew shortages, capacity constraints and minimum tonnage requirements. Additionally, inclement weather, including hurricanes, tornadoes and other weather events, can negatively impact our distribution network.
We use large amounts of electricity, diesel fuel, liquid asphalt and other petroleum-based resources that are subject to potential supply constraints and significant price fluctuation**, which could affect our operating results and profitability** — In our production and distribution processes, we consume significant amounts of electricity, diesel fuel, liquid asphalt and other petroleum-based resources. The availability and pricing of these resources are subject to market forces that are beyond our control. Our suppliers contract separately for the purchase of such resources, and our sources of supply could be interrupted should our suppliers not be able to obtain these materials due to higher demand or other factors that interrupt their availability. Variability in the supply and prices of these resources could materially affect our operating results from period to period, and rising costs could erode our profitability.
Aggregates resources and reserves calculations are estimates only, and are subject to uncertainty due to factors including the inherent variability of the deposit and recoverability of saleable material in the mining process — The calculation of mineral resources and reserves are estimates and depend upon geological interpretation and statistical inferences or assumptions drawn from drilling and sampling analysis, which may prove to be unpredictable. Until mineral reserves are actually mined and processed, the quantity must be considered as an estimate only.
We are involved in a number of legal proceedings. We cannot predict the outcome of litigation and other contingencies with certainty — We are involved in several complex litigation proceedings, some arising from our previous ownership and operation of a Chemicals business. Although we divested the Chemicals business in June 2005, we retained certain liabilities related to the business. As required by generally accepted accounting principles (GAAP), we establish reserves when a loss is determined to be probable and the amount can be reasonably estimated. Our assessment of probability and loss estimates are based on the facts and circumstances known to us at a particular point in time. Subsequent developments in legal proceedings may affect our assessment and estimates of a loss contingency, and could result in an adverse effect on our financial position, results of operations or cash flows. For a description of our current significant legal proceedings see Note 12 “Commitments and Contingencies” in Item 8 “Financial Statements and Supplementary Data.”
| Part I | 23 |
Our construction paving business may subject us to contractually imposed penalties or lost profits — We operate construction paving businesses in Alabama, Tennessee and Texas. In some instances, including many of our fixed price paving contracts, we agree to complete a project by a certain date. If we fail to complete the project as scheduled, we may be held responsible for costs resulting from the delay. Consequently, the total project cost could exceed our original estimate, and we could experience reduced profits or even a loss on the project.
We are involved in certain environmental matters. We cannot predict the outcome of these contingencies with certainty — We are involved in environmental investigations and cleanups at sites that we own or owned, where we operate or have operated or where we sent materials for recycling or disposal, as well as related offsite investigations and cleanups. As required by GAAP, we establish reserves when a loss is determined to be probable and the amount can be reasonably estimated. Our assessment of probability and loss estimates are based on the facts and circumstances known to us at a particular point in time. Subsequent developments related to these matters may affect our assessment and estimates of loss contingency, and could result in an adverse effect on our financial position, results of operations or cash flows. For a description of our current significant environmental matters see Note 12 “Commitments and Contingencies” in Item 8 “Financial Statements and Supplementary Data.”
Item 1B. UNRESOLVED STAFF COMMENTS
UNRESOLVED STAFF COMMENTS
We have not received any written comments from the Securities and Exchange Commission staff regarding our periodic or current reports under the Exchange Act of 1934 that remain unresolved.
| Part I | 24 |
Item 2. PROPERTIES
PROPERTIES
AGGREGATES
As the largest U.S. supplier of construction aggregates, we serve markets in twenty states, Washington D.C. and the local market surrounding our operation in Mexico. Our primary focus is serving states and metropolitan markets in the U.S. that are expected to experience the most significant growth in population, households and employment. These three demographic factors are significant drivers of demand for aggregates.
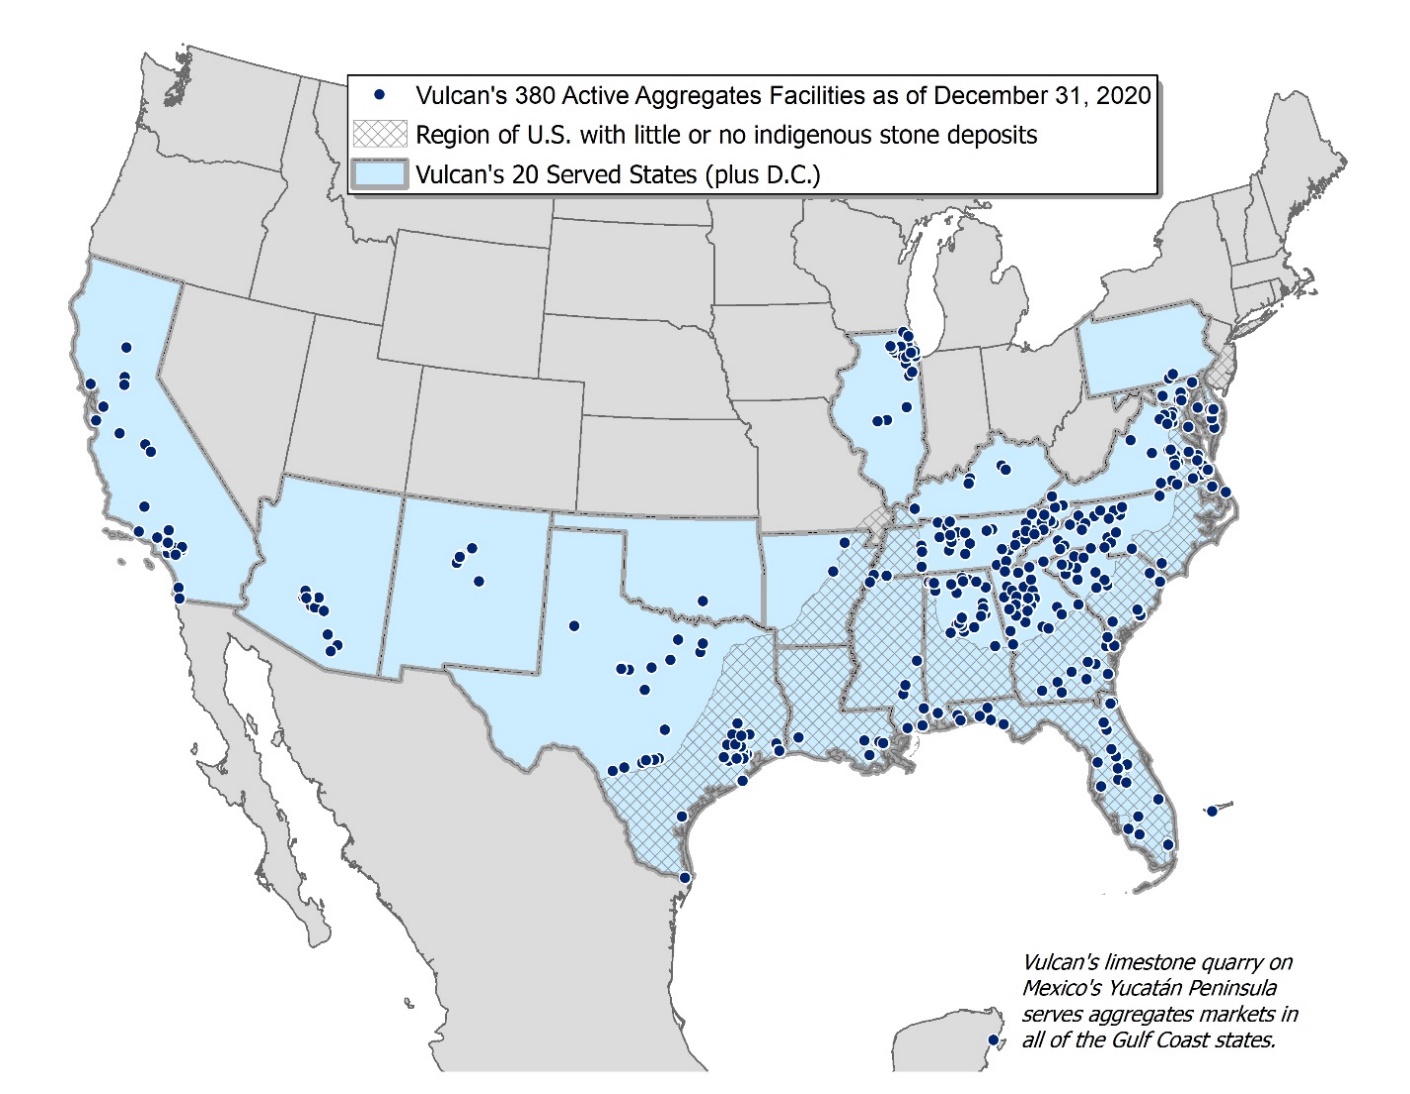
Our current estimate of 15.9 billion tons of proven and probable aggregates reserves reflects a decrease of 0.3 billion tons from the prior year’s estimate. Estimates of reserves are of recoverable stone, sand and gravel of suitable quality for economic extraction, based on drilling and studies by our geologists and engineers, recognizing reasonable economic and operating constraints as to maximum depth of overburden and stone excavation, and subject to permit or other restrictions,.
Proven, or measured, reserves are those reserves for which the quantity is computed from dimensions revealed by drill data, together with other direct and measurable observations, such as outcrops, trenches and quarry faces. The grade and quality of those reserves are computed from the results of detailed sampling, and the sampling and measurement data are spaced so closely and the geologic character is so well defined that size, shape, depth and mineral content of reserves are well established. Probable, or indicated, reserves are those reserves for which quantity, grade and quality are computed partly from specific measurements and partly from projections based on reasonable, though not drilled, geologic evidence. The degree of assurance, although lower than that for proven reserves, is high enough to assume continuity between points of observation.
| Part I | 25 |
Reported proven and probable reserves include only quantities that are owned in fee or under lease, and for which all appropriate zoning and permitting have been obtained through permit, contract or grandfathered status. Leases, zoning, permits, reclamation plans and other government or industry regulations often set limits on the areas, depths and lengths of time allowed for mining, stipulate setbacks and slopes that must be left in place, and designate which areas may be used for surface facilities, berms, and overburden or waste storage, among other requirements and restrictions. Our reserve estimates take into account these factors. Technical and economic factors also affect the estimates of reported reserves regardless of what might otherwise be considered proven or probable based on a geologic analysis. For example, excessive overburden or weathered rock, rock quality issues, excessive mining depths, groundwater issues, overlying wetlands, endangered species habitats, and rights of way or easements may effectively limit the quantity of reserves considered proven and probable. In addition, computations for reserves in-place are adjusted for estimates of unsaleable sizes and materials as well as pit and plant waste.
The 15.9 billion tons of estimated proven and probable aggregates reserves reported at the end of 2020 include reserves at inactive and greenfield (undeveloped) sites. The table below presents, by division, the tons of proven and probable aggregates reserves as of December 31, 2020 and the types of facilities operated.
| (millions of tons) | Count of Aggregates Operating Facilities 2 | |||||||||||||||||||||
| Aggregates Reserves | 2020 | Sand and | ||||||||||||||||||||
| Division 1 | Proven | Probable | Total | Production | Stone | Gravel | Sales Yards | |||||||||||||||
| Central | 2,301.3 | 820.4 | 3,121.7 | 32.7 | 55 | 5 | 8 | |||||||||||||||
| International | 529.5 | 0.0 | 529.5 | 11.4 | 1 | 0 | 0 | |||||||||||||||
| Mideast | 2,422.8 | 981.2 | 3,404.0 | 34.0 | 37 | 4 | 24 | |||||||||||||||
| Mountain West | 216.1 | 112.8 | 328.9 | 8.7 | 2 | 13 | 2 | |||||||||||||||
| Southeast 3 | 2,952.9 | 871.7 | 3,824.6 | 50.1 | 45 | 8 | 24 | |||||||||||||||
| Southern Gulf Coast | 1,804.1 | 52.4 | 1,856.5 | 23.1 | 24 | 0 | 19 | |||||||||||||||
| Southwest | 1,377.8 | 0.0 | 1,377.8 | 24.3 | 16 | 1 | 24 | |||||||||||||||
| Western | 761.9 | 737.4 | 1,499.3 | 18.8 | 5 | 12 | 1 | |||||||||||||||
| Total | 12,366.4 | 3,575.9 | 15,942.3 | 203.1 | 185 | 43 | 102 |
| 1 | The divisions are defined by states/countries as follows: Central Division — Arkansas, Illinois, Kentucky and Tennessee International Division — Mexico Mideast Division — Delaware, Maryland, North Carolina, Pennsylvania, Virginia and Washington D.C. Mountain West Division — Arizona and New Mexico Southeast Division — Florida (excluding panhandle), Georgia and South Carolina Southern Gulf Coast Division — Alabama, Florida Panhandle, Louisiana and Mississippi Southwest Division — Oklahoma and Texas Western Division — California | |
| 2 | In addition to the aggregates facilities included in the table above, we operated 50 recycled concrete plants which are not dependent on reserves. | |
| 3 | Includes a maximum of 314.2 million tons of reserves encumbered by volumetric production payments as defined in Note 2 “Revenues” in Item 8 “Financial Statements and Supplementary Data.” |
Of the 15.9 billion tons of aggregates reserves at December 31, 2020, 9.2 billion tons or 58% are located on owned land and 6.7 billion tons or 42% are located on leased land.
| Part I | 26 |
The following table lists our ten largest active aggregates facilities based on the total proven and probable reserves at the sites. None of our aggregates facilities contributed more than 5% to our total revenues in 2020.
| (millions of tons) | ||||||||||||||||||||
| Reserves at 12/31/2020 | 2020 | |||||||||||||||||||
| Location (nearest major metropolitan area) | Proven | Probable | Total | Production | ||||||||||||||||
| Playa del Carmen (Cancun), Mexico | 529.5 | 0.0 | 529.5 | 11.4 | ||||||||||||||||
| Hanover (Harrisburg), Pennsylvania | 221.5 | 236.4 | 457.9 | 2.0 | ||||||||||||||||
| McCook (Chicago), Illinois | 96.8 | 266.5 | 363.3 | 4.4 | ||||||||||||||||
| Corona (Los Angeles), California | 10.0 | 320.0 | 330.0 | 2.1 | ||||||||||||||||
| Gold Hill (Charlotte), North Carolina | 146.7 | 121.2 | 267.9 | 0.9 | ||||||||||||||||
| Postell (Macon), Georgia | 186.5 | 72.3 | 258.8 | 4.6 | ||||||||||||||||
| San Emidio (Bakersfield), California | 28.5 | 221.5 | 250.0 | 0.9 | ||||||||||||||||
| Medina (San Antonio), Texas | 244.6 | 0.0 | 244.6 | 2.8 | ||||||||||||||||
| Macon, Georgia | 115.4 | 128.0 | 243.4 | 2.0 | ||||||||||||||||
| Norcross (Atlanta), Georgia | 180.2 | 27.7 | 207.9 | 3.4 |
ASPHALT, CONCRETE AND CALCIUM
As of December 31, 2020, we operated a number of facilities producing asphalt mix, ready-mixed concrete and calcium in several of our divisions as reflected in the table below:
| Asphalt 2 | Concrete | Calcium 3 | ||||||||||||||||||||
| Division 1 | Facilities | Facilities | Facilities | |||||||||||||||||||
| Central | 10 | 0 | 0 | |||||||||||||||||||
| Mideast | 0 | 36 | 0 | |||||||||||||||||||
| Mountain West | 21 | 0 | 0 | |||||||||||||||||||
| Southeast | 0 | 0 | 1 | |||||||||||||||||||
| Southern Gulf Coast | 2 | 0 | 0 | |||||||||||||||||||
| Southwest | 15 | 7 | 0 | |||||||||||||||||||
| Western | 22 | 3 | 0 | |||||||||||||||||||
| Total | 70 | 46 | 1 |
| 1 | International Division has no asphalt, concrete or calcium facilities. |
| 2 | Asphalt facilities for the Central, Southern Gulf Coast and Southwest Divisions are c**omprised of asphalt mix facilities and construction paving businesses*.* |
| 3 | Comprised of a ground calcium plant. |
The asphalt and concrete facilities are able to meet their needs for raw material inputs with a combination of internally sourced and purchased raw materials.
| Part I | 27 |
Our Calcium segment operates a quarry at Brooksville, Florida which provides feedstock for the ground calcium operation. The Brooksville quarry is not individually material to our business. Calcium resources and reserves are outlined in the table below:
| (millions of tons) | ||||||||||||||||||||||
| Reserves at 12/31/2020 | 2020 | |||||||||||||||||||||
| Location | Proven | Probable | Total | Production | ||||||||||||||||||
| Brooksville | 4.5 | 7.1 | 11.6 | 0.3 |
Our Brooksville limestone quarry is mined and processed primarily as a supplement for end-use products, such as animal feed and plastics. High purity limestone is inert and relatively inexpensive compared to the other components used in these end-use products. The Brooksville limestone quarry has an average calcium carbonate (CaCO3) content of 98.0%.
HEADQUARTERS
Our headquarters are located in an office complex in Birmingham, Alabama. The office space consists of approximately 184,410 square feet and is leased through December 31, 2023, with three five-year renewal periods thereafter. The annual rental cost for the current term of the lease is approximately $3.7 million.
Item 3. LEGAL PROCEEDINGS
LEGAL PROCEEDINGS
We are subject to occasional governmental proceedings and orders pertaining to occupational safety and health or to protection of the environment, such as proceedings or orders relating to noise abatement, air emissions or water discharges. As part of our continuing program of stewardship in safety, health and environmental matters, we have been able to resolve such proceedings and to comply with such orders without any material adverse effects on our business.
We are a defendant in various lawsuits in the ordinary course of business. It is not possible to determine with precision the outcome of, or the amount of liability, if any, under these lawsuits, especially where the cases involve possible jury trials with as yet undetermined jury panels.
We were not subject to any penalties in 2020 for failure to disclose transactions identified by the Internal Revenue Service as abusive under Internal Revenue Code Section 6707A.
See Note 12 “Commitments and Contingencies” in Item 8 “Financial Statements and Supplementary Data” for a discussion of our material legal proceedings.
Item 4. MINE SAFETY DISCLOSURES
MINE SAFETY DISCLOSURES
The information concerning mine safety violations or other regulatory matters required by Section 1503(a) of the Dodd-Frank Wall Street Reform and Consumer Protection Act and Item 104 of Regulation S-K is included in Exhibit 95 of this report.
| Part I | 28 |
INFORMATION ABOUT OUR EXECUTIVE OFFICERS
The names, positions and ages, as of February 20, 2021, of our executive officers are as follows:
| __ | ||
|---|---|---|
| Name | Position | Age |
| J. Thomas Hill | Chairman, President and Chief Executive Officer | 61 |
| Suzanne H. Wood | Senior Vice President and Chief Financial Officer | 60 |
| Stanley G. Bass | Chief Strategy Officer | 59 |
| Thompson S. Baker II | Chief Operating Officer | 62 |
| David P. Clement | Senior Vice President, Mountain West and Western Divisions | 60 |
| Denson N. Franklin III | Senior Vice President, General Counsel and Secretary | 57 |
| Jerry F. Perkins Jr. | Senior Vice President, Southern & Gulf Coast and Southwest Divisions | 51 |
| Jason P. Teter | Senior Vice President, Mideast and Southeast Divisions | 46 |
| Randy L. Pigg | Vice President, Controller and Principal Accounting Officer | 48 |
The principal occupations of the executive officers during the past five years are set forth below:
J. Thomas Hill was elected Chairman of the Board of Directors effective January 1, 2016 and President and Chief Executive Officer in July 2014. Previously, he served as Executive Vice President and Chief Operating Officer from January 2014 to July 2014, and Senior Vice President – South Region from December 2011 to December 2013. Prior to that, he served in a number of positions with Vulcan including President, Florida Rock Division from September 2010 to December 2011.
Suzanne H. Wood was elected Senior Vice President, Chief Financial Officer effective September 2018 and also served as Secretary from September 2019 to December 2019. From 2012 to 2018, she served as Group Finance Director and Chief Financial Officer of Ashtead Group plc, a FTSE 50 international equipment rental company serving the construction industry and other markets. Prior to that, she was Executive Vice President and Chief Financial Officer of Sunbelt Rentals, Inc., the North American subsidiary of Ashtead Group plc. A certified public accountant, she also previously held Chief Financial Officer positions at Tultex Corporation and Oakwood Homes Corporation. She currently serves on the board of directors and is chair of the audit committee of RELX Group, a FTSE 50 global professional information and analytics company. She also serves on the board of directors, audit committee and nominations committee of Ferguson plc, the FTSE 100 leading distributor of plumbing and heating products.
Stanley G. Bass was elected Chief Strategy Officer in February 2021. Prior to that he served as Chief Growth Officer as of February 2016. He served as Senior Vice President – Western and Mountain West Divisions from January 2015 to February 2016, and Senior Vice President – West Region from September 2013 to December 2014. Prior to that, he served as Senior Vice President – Central and West Regions from February 2013 to September 2013 and Senior Vice President – Central Region from December 2011 to February 2013. Prior to that, he served in a number of positions with Vulcan including President, Midsouth and Southwest Divisions from September 2010 to December 2011.
Thompson S. Baker II was appointed Chief Operating Officer effective May 2019. He previously served as Senior Vice President from March 2017 to April 2019. Prior to that, he served in a number of positions with Vulcan, including President – Florida Rock Division, before serving as Chief Executive Officer of FRP Holdings, Inc. from October 2010 to March 2017 and President and Chief Executive Officer of Patriot Transportation Holding, Inc. from December 2014 to March 2017.
David P. Clement was appointed Senior Vice President of the Mountain West and Western Divisions in March 2020. He first joined the organization as an operations management trainee in 1983 and progressed to the position of area production manager in 1993. After spending a few years at Pioneer Mid-Atlantic and working as a consultant, he rejoined Vulcan in 2004 as vice president and general manager of the Midwest Division. He has held the positions of vice president of operations for the Midwest Division, vice president and general manager of the Central Region, senior vice president of the Central Region, and most recently as president of the Central Division.
Denson N. Franklin III joined us in December 2019 as Senior Vice President, General Counsel and Secretary. Prior to that he was a partner at Bradley Arant Boult Cummings LLP, a law firm based in Birmingham, Alabama. While at Bradley, he served as Vulcan’s primary outside counsel for more than 20 years and advised other companies in the construction materials, building and engineering industries.
| Part I | 29 |
Jerry F. Perkins Jr. was appointed Senior Vice President of the Southern & Gulf Coast and Southwest Divisions in March 2020. Prior to his current position, he was president of the Southern and Gulf Coast Division. He also served as general counsel and corporate secretary and held various legal leadership roles for Vulcan. Before joining Vulcan in 2002, he worked as a certified public accountant (CPA) at a global accounting firm and was an attorney with Burr & Forman LLP in Birmingham, Alabama.
Jason P. Teter was appointed Senior Vice President of the Mideast and Southeast Divisions in March 2020. Prior to his current position, he was president of the Southeast Division. He joined Vulcan in 2013 as vice president of business development. He also served as vice president of finance for Vulcan and president of the Southern and Gulf Coast Division. Before joining Vulcan, he spent ten years in various finance, business development and general management positions with Lafarge North America.
Randy L. Pigg was elected Vice President, Controller and Principal Accounting Officer in April 2018. He served as Vice President, Accounting since June 2016, and prior to that served as Director, Financial Shared Services since April 2014. Prior to that, he served in a number of positions with Vulcan, including Manager Financial Research & Reporting and Finance Director – Central Region.
| Part I | 30 |
PART II
Item 5. MARKET FOR REGISTRANT'S COMMON EQUITY, RELATED STOCKHOLDER MATTERS AND ISSUER PURCHASES OF EQUITY SECURITIES
MARKET FOR REGISTRANT'S COMMON EQUITY, RELATED STOCKHOLDER MATTERS**** AND ISSUER PURCHASES OF EQUITY SECURITIES
Our common stock is traded on the New York Stock Exchange (ticker symbol VMC). As of February 12, 2021, the number of shareholders of record was 2,379.
ISSUER PURCHASES OF EQUITY SECURITIES
Purchases of our equity securities during the quarter ended December 31, 2020 are summarized below.
| Total Number | Maximum | ||||||||||
| of Shares | Number of | ||||||||||
| Total | Purchased as | Shares that May | |||||||||
| Number of | Average | Part of Publicly | Yet Be Purchased | ||||||||
| Shares | Price Paid | Announced Plans | Under the Plans | ||||||||
| Period | Purchased | Per Share | or Programs | or Programs 1 | |||||||
| 2020 | |||||||||||
| Oct 1 - Oct 31 | 0 | $ 0.00 | 0 | 8,064,851 | |||||||
| Nov 1 - Nov 30 | 0 | $ 0.00 | 0 | 8,064,851 | |||||||
| Dec 1 - Dec 31 | 0 | $ 0.00 | 0 | 8,064,851 | |||||||
| Total | 0 | $ 0.00 | 0 |
| 1 | In February 2017, our Board of Directors authorized us to purchase up to 10,000,000 shares of our common stock. As of December 31, 2020, there were 8,064,851 shares remaining under this authorization*. Depending upon market, business, legal and other conditions, we may purchase shares* from time to time through the open market (including plans designed to comply with Rule 10b5-1 of the Securities Exchange Act of 1934*) and/or through* *privately negotiated transactions.* The authorization has no time limit, does not obligate us to purchase any specific number of shares, and may be suspended or discontinued at any time. |
We did not have any unregistered sales of equity securities during the fourth quarter of 2020.
| Part II | 31 |
Item 7. MANAGEMENT'S DISCUSSION AND ANALYSIS OF FINANCIAL CONDITION AND RESULTS OF OPERATIONS
MANAGEMENT'S DISCUSSION AND ANALYSIS OF FINANCIAL CONDITION AND RESULTS OF OPERATIONS
Management’s discussion and analysis is intended to help investors understand our operations and current business environment. The following discussion should be read in conjunction with the consolidated financial statements and the accompanying notes contained in this Annual Report. The following generally includes a comparison of our results of operations and liquidity and capital resources for 2020 and 2019. For the discussion of changes from 2018 to 2019 and other financial information related to 2018, refer to Part II, Item 7. Management’s Discussion and Analysis of Financial Condition and Results of Operations, of our Form 10-K for the year ended December 31, 2019 filed with the Securities and Exchange Commission on February 26, 2020.
EXECUTIVE SUMMARY
FINANCIAL SUMMARY FOR 2020 (compared to 2019)
Total revenues decreased $72.3 million, or 1.5%, to $4,856.8 million
Gross profit increased $25.6 million, or 2%, to $1,281.5 million
Aggregates segment sales decreased $46.0 million, or 1%, to $3,944.3 million
Aggregates segment freight-adjusted revenues decreased $6.5 million, or less than 1%, to $3,007.6 million
Shipments decreased 3%, or 7.2 million tons, to 208.3 million tons
Freight-adjusted sales price increased 3.2%, or $0.45 per ton to $14.44
Segment gross profit increased $12.5 million, or 1%, to $1,159.2 million
Asphalt, Concrete and Calcium segment gross profit increased $13.1 million, or 12%, to $122.3 million, collectively
Selling, administrative and general (SAG) expenses decreased 3% to $359.8 million and decreased 0.1 percentage points (10 basis points) as a percentage of total revenues
Operating earnings increased $18.3 million, or 2%, to $895.7 million
Earnings from continuing operations before income taxes were $743.8 million compared to $757.7 million
Earnings from continuing operations were $588.0 million, or $4.41 per diluted share, compared to $622.5 million, or $4.67 per diluted share
Discrete items in 2020 include:
pretax charges of $6.9 million for divested operations
pretax charges of $7.3 million associated with non-routine business development
pretax charges of $10.2 million for COVID-19 pandemic direct incremental costs
pretax charges of $22.7 million for pension settlement
pretax charges of $1.3 million for restructuring
Discrete items in 2019 include:
pretax gains of $13.4 million for the sale of businesses and property donation
pretax charges of $10.8 million for property donation
pretax charges of $3.0 million for divested operations
pretax charges of $1.7 million associated with non-routine business development
pretax charges of $6.5 million for restructuring
Adjusted (for the discrete pretax items noted above) earnings from continuing operations were $4.68 per diluted share, compared to $4.70 per diluted share
Net earnings were $584.5 million, a decrease of $33.2 million, or 5%
Adjusted EBITDA was $1,323.5 million, an increase of $53.5 million, or 4%
Returned capital to shareholders via dividends ($180.2 million versus $164.0 million) and share repurchases ($26.1 million versus $2.6 million)
| Part II | 32 |
Our best-in-class aggregates business, along with the efforts and dedication of our employees, allowed us to overcome COVID-19 related disruptions in 2020. As we saw in 2020, demand for our products can be subject to market fluctuations outside of our control. We remain focused on the factors within our control, including our pricing and cost actions, both of which contributed to further improvement in our industry-leading unit margins in 2020. Most impressive, we delivered year-over-year gains in aggregates unit profitability throughout each quarter in 2020. Our ability to leverage our four strategic disciplines — Commercial and Operational Excellence, Logistics Innovation and Strategic Sourcing — enabled us to expand unit margins, deliver improved cash flows, and increase returns on invested capital. Our team’s hard work along with our leading market positions and strong financial foundation will enable us to capitalize on an improving demand outlook in 2021.
Our operating plans are underpinned by our aforementioned four strategic disciplines, a healthy balance sheet, strong liquidity, and the engagement of our people. 2020 revenues were $4,856.8 million, 1% lower than the prior year, while gross profit margins expanded across each segment. Effective cost management throughout the organization and aggregates price growth helped drive margin expansion. Net earnings were $584.5 million and Adjusted EBITDA was a record $1,323.5 million.
At year end, total debt to 2020 Adjusted EBITDA was 2.5 times or 1.6 times on a net debt basis reflecting $1,198.0 million of cash on hand — approximately $500.0 million will be used to pay off certain debt maturities due in March 2021. Our weighted-average debt maturity was 13 years, and the effective weighted-average interest rate was 4.1%.
Return on invested capital increased 0.4 percentage points (40 basis points) from the prior year to 14.3%. Operating cash flows were $1,070.4 million, up 9% versus the previous year. Solid operating earnings growth coupled with disciplined capital management led to these results.
CAPITAL ALLOCATION
Our balanced approach to capital allocation remains unchanged. Through economic cycles we intend to balance reinvestment in our business, growth through acquisitions, and return of capital to shareholders while maintaining financial strength and flexibility evidenced by our strong balance sheet and investment-grade credit ratings. Our capital allocation priorities are, as follows:
1.Operating Capital (maintain and grow the value of our franchise)
2.Growth Capital (including greenfields and acquisitions)
3.Dividend Growth (with a keen focus on sustainability)
4.Return Excess Cash to Shareholders (primarily via share repurchases)
Our first priority is to maintain and protect our valuable franchise by keeping our operations in good working order to ensure the production of high quality materials and timely delivery of goods and services to our customers. This capital requirement expands and contracts as production and shipment levels change. During 2020, we invested $239.3 million to replace or improve existing property, plant & equipment.
Our second priority is to grow our franchise through internal growth projects and business acquisitions. Internal growth projects have generally been among our highest returning projects. During 2020, we invested $122.9 million in internal growth projects to secure new aggregates reserves, develop new production and/or distribution sites, enhance our distribution capabilities and support the targeted growth of our asphalt and concrete operations. During the fourth quarter of 2020, we restarted planned growth projects that were put on hold in March 2020 as a result of the pandemic. For business acquisitions, we tend to look for bolt-on acquisitions which are easy to integrate and will pursue large business combinations that are the right fit and the right price. We use strategic and returns-based criteria to price potential acquisitions and are disciplined in our approach. We look at a lot of potential acquisitions and only make offers on a few. We closed two business acquisitions during 2020 for total consideration of $73.4 million.
Our third priority is growing the dividend with a keen focus on sustainability through the economic cycle. During 2020, we paid a dividend per share of $1.36 and paid total dividends of $180.2 million.
| Part II | 33 |
And finally, if there is excess cash after fulfilling the prior capital allocation priorities, we will consider returning cash to shareholders via share repurchases. During 2020, we returned $26.1 million to our shareholders through share re
Showing the first 8K of 102K characters. Open the full section
Item 7A. QUANTITATIVE AND QUALITATIVE DISCLOSURES ABOUT MARKET RISK
QUANTITATIVE AND QUALITATIVE DISCLOSURES ABOUT MARKET RISK
MARKET RISK
We are exposed to certain market risks arising from transactions that are entered into in the normal course of business. To manage these market risks, we may use derivative financial instruments. We do not enter into derivative financial instruments for trading or speculative purposes.
As discussed in the Liquidity and Financial Resources section of Item 7 “Management’s Discussion and Analysis of Financial Condition and Results of Operations,” we actively manage our capital structure and resources to balance the cost of capital and risk of financial stress. Such activity includes balancing the cost and risk of interest expense. In addition to floating-rate borrowings, we at times use interest rate swaps to manage the mix of fixed-rate and floating-rate debt.
At December 31, 2020, the estimated fair value of our long-term debt including current maturities was $3,959.0 million compared to a face value of $3,357.9 million. The estimated fair value was determined by averaging several asking price quotes for the publicly traded notes and assuming par value for the remainder of the debt. The fair value estimate is based on information available as of the balance sheet date. The effect of a decline in interest rates of one percentage point would increase the fair value of our debt by approximately $414.9 million.
We are exposed to certain economic risks related to the costs of our pension and other postretirement benefit plans. These economic risks include changes in the discount rate for high-quality bonds and the expected return on plan assets. The impact of a change in these assumptions on our annual pension and other postretirement benefits costs is discussed in greater detail within the Critical Accounting Policies section of this Annual Report.
| Part II | 67 |
Item 8. FINANCIAL STATEMENTS AND SUPPLEMENTARY DATA
FINANCIAL STATEMENTS AND SUPPLEMENTARY DATA
REPORT OF INDEPENDENT REGISTERED PUBLIC ACCOUNTING FIRM
To the shareholders and the Board of Directors of Vulcan Materials Company:
Opinion on the Financial Statements
We have audited the accompanying consolidated balance sheets of Vulcan Materials Company and subsidiaries (the “Company”) as of December 31, 2020 and 2019, the related consolidated statements of comprehensive income, equity, and cash flows, for each of the three years in the period ended December 31, 2020, and the related notes (collectively referred to as the “financial statements”). In our opinion, the financial statements present fairly, in all material respects, the financial position of the Company as of December 31, 2020 and 2019, and the results of its operations and its cash flows for each of the three years in the period ended December 31, 2020, in conformity with accounting principles generally accepted in the United States of America.
We have also audited, in accordance with the standards of the Public Company Accounting Oversight Board (United States) (PCAOB), the Company's internal control over financial reporting as of December 31, 2020, based on the criteria established in Internal Control — Integrated Framework (2013) issued by the Committee of Sponsoring Organizations of the Treadway Commission and our report dated February 25, 2021 expressed an unqualified opinion on the Company's internal control over financial reporting.
Basis for Opinion
These financial statements are the responsibility of the Company's management. Our responsibility is to express an opinion on the Company’s financial statements based on our audits. We are a public accounting firm registered with the PCAOB and are required to be independent with respect to the Company in accordance with the U.S. federal securities laws and the applicable rules and regulations of the Securities and Exchange Commission and the PCAOB.
We conducted our audits in accordance with the standards of the PCAOB. Those standards require that we plan and perform the audit to obtain reasonable assurance about whether the financial statements are free of material misstatement, whether due to error or fraud. Our audits included performing procedures to assess the risks of material misstatement of the financial statements, whether due to error or fraud, and performing procedures that respond to those risks. Such procedures included examining, on a test basis, evidence regarding the amounts and disclosures in the financial statements. Our audits also included evaluating the accounting principles used and significant estimates made by management, as well as evaluating the overall presentation of the financial statements. We believe that our audits provide a reasonable basis for our opinion.
Critical Audit Matter
The critical audit matter communicated below is a matter arising from the current-period audit of the financial statements that was communicated or required to be communicated to the audit committee and that (1) relates to accounts or disclosures that are material to the financial statements and (2) involved our especially challenging, subjective, or complex judgments. The communication of critical audit matters does not alter in any way our opinion on the financial statements, taken as a whole, and we are not, by communicating the critical audit matter below, providing a separate opinion on the critical audit matter or on the accounts or disclosures to which it relates.
| Part II | 68 |
Hewitt Landfill Environmental Matter – Refer to Note 12 to the consolidated financial statements
Critical Audit Matter Description
The Company is subject to governmental proceedings and orders pertaining to the protection of the environment. Specific to the Hewitt Landfill Environmental Matter, management is engaged in groundwater testing, certain remedial procedures and ongoing dialogue with federal and local agencies such as the Environmental Protection Agency (EPA), Los Angeles Regional Water Quality Control Board (RWQCB) and the Los Angeles Department of Water and Power (LADWP) as well as other interested parties. The testing and dialogue is related to the Company’s potential contribution to soil, soil vapor and/or groundwater contamination in the former Hewitt Landfill in Los Angeles and the potential contribution of the Hewitt Landfill to groundwater contamination in the North Hollywood Operable Unit (NHOU) of the San Fernando Valley Superfund Site.
The groundwater treatment system for the Hewitt Landfill on-site remediation reached mechanical completion during 2020. The incurred and anticipated costs have been fully accrued for based on facts and circumstances known to the Company at this time. The Company has disclosed facts and circumstances that led to the accrual and the inherent uncertainty that exists in the timing and recognition of potential incremental responsibility or share of costs for the Hewitt Landfill on-site remediation or the NHOU. Due to these uncertainties, future amounts recorded related to the ultimate resolution of claims and assessments could be material in a given period to the Company’s results of operations or cash flows.Evaluating the estimate of the liability and the extent and sufficiency of related disclosures is subjective in nature and as such requires significant audit effort, involves especially subjective auditing judgements, and requires the use of our environmental specialists.
How the Critical Audit Matter Was Addressed in the Audit
Our audit procedures related to the uncertainty in the timing, recognition and disclosure of the Company’s responsibility and potential share of remediation costs, specifically as they relate to the Hewitt Landfill and NHOU (collectively the Hewitt Landfill Environmental Matter) include the following, among others:
We tested the effectiveness of controls over the identification and evaluation of information available to assess potential responsibility or share of remediation costs for the Hewitt Landfill Environmental Matter, as well as controls over the adequacy of the related financial statement footnote disclosures.
With the assistance of our environmental specialists, we evaluated the accuracy and completeness of management’s recorded liabilities for the Hewitt Landfill Environmental Matter by:
Obtaining letters from internal and external counsel as to the matter’s status, probability of an unfavorable outcome, and the amount or range of potential loss should the outcome be unfavorable.
Independently obtaining and reading correspondence from the EPA, RWQCB and LADWP regarding the Hewitt Landfill Environmental Matter.
Obtaining an understanding of the change in estimate of remediation costs, as applicable, and performing procedures to evaluate the appropriateness and sufficiency of the estimate at year-end.
We read and compared the Company’s footnote disclosure to evidential matter obtained during our audit.
/s/ DELOITTE & TOUCHE LLP
Birmingham, Alabama
February 25, 2021
We have served as the Company’s auditor since 1956.
| Part II | 69 |
VULCAN MATERIALS COMPANY AND SUBSIDIARY COMPANIES
CONSOLIDATED STATEMENTS OF COMPREHENSIVE INCOME
| 2020 | 2019 | 2018 | ||||||
| For the years ended December 31 | ||||||||
| in thousands, except per share data | ||||||||
| Total revenues | $ 4,856,826 | $ 4,929,103 | $ 4,382,869 | |||||
| Cost of revenues | 3,575,345 | 3,673,202 | 3,281,924 | |||||
| Gross profit | 1,281,481 | 1,255,901 | 1,100,945 | |||||
| Selling, administrative and general expenses | 359,772 | 370,548 | 333,371 | |||||
| Gain on sale of property, plant & equipment |
Showing the first 8K of 205K characters. Open the full section
Item 9. CHANGES IN AND DISAGREEMENTS WITH ACCOUNTANTS ON ACCOUNTING AND FINANCIAL DISCLOSURE
CHANGES IN AND DISAGREEMENTS WITH ACCOUNTANTS ON ACCOUNTING AND FINANCIAL DISCLOSURE
None.
Item 9A. CONTROLS AND PROCEDURES
CONTROLS AND PROCEDURES
DISCLOSURE CONTROLS AND PROCEDURES
We maintain a system of controls and procedures designed to ensure that information required to be disclosed in reports we file with the SEC is recorded, processed, summarized and reported within the time periods specified by the SEC's rules and forms. These disclosure controls and procedures (as defined in the Securities Exchange Act of 1934 Rules 13a - 15(e) or 15d - 15(e)), include, without limitation, controls and procedures designed to ensure that such information is accumulated and communicated to our management, including our Chief Executive Officer and Chief Financial Officer, to allow timely decisions regarding required disclosure. Our Chief Executive Officer and Chief Financial Officer, with the participation of other management officials, evaluated the effectiveness of the design and operation of the disclosure controls and procedures as of December 31, 2020. Based upon that evaluation, our Chief Executive Officer and Chief Financial Officer concluded that our disclosure controls and procedures were effective as of December 31, 2020.
Due to the COVID-19 pandemic, we have implemented remote work arrangements for support functions and restricted business travel effective mid-March 2020. To date, these arrangements have not materially affected our ability to maintain our business operations, including the operation of financial reporting systems, internal control over financial reporting, and disclosure controls and procedures. We are continually assessing the potential effects of the pandemic on the design and operating effectiveness of our internal control over financial reporting and if necessary, will take appropriate actions.
No material changes were made during the fourth quarter of 2020 to our internal control over financial reporting, nor have there been other factors that materially affect these controls.
MANAGEMENT'S REPORT ON INTERNAL CONTROL OVER FINANCIAL REPORTING
Our management is responsible for establishing and maintaining an adequate system of internal control over financial reporting as required by the Sarbanes-Oxley Act of 2002 and as defined in Securities Exchange Act Rule 13a-15(f).
Under management's supervision, an evaluation of the design and effectiveness of our internal control over financial reporting was conducted based on the framework in Internal Control — Integrated Framework (2013) issued by the Committee of Sponsoring Organizations of the Treadway Commission. Based on this evaluation, management concluded that our internal control over financial reporting was effective as of December 31, 2020.
Deloitte & Touche LLP, an independent registered public accounting firm, as auditors of our consolidated financial statements, has issued an attestation report on the effectiveness of our internal control over financial reporting as of December 31, 2020. Deloitte & Touche LLP's report, which expresses an unqualified opinion on the effectiveness of our internal control over financial reporting, follows this report.
LIMITATIONS OF EFFECTIVENESS OF CONTROLS AND PROCEDURES
In designing and evaluating our disclosure controls and procedures, management recognizes that any controls and procedures, no matter how well designed and operated, can provide only reasonable assurance of achieving the desired control objectives. In addition, the design of disclosure controls and procedures must reflect the fact that there are resource constraints and that management is required to apply its judgment in evaluating the benefits of possible controls and procedures relative to their costs.
| Part II | 123 |
REPORT OF INDEPENDENT REGISTERED PUBLIC ACCOUNTING FIRM – INTERNAL CONTROL OVER FINANCIAL REPORTING
To the shareholders and Board of Directors of Vulcan Materials Company:
Opinion on Internal Control over Financial Reporting
We have audited the internal control over financial reporting of Vulcan Materials Company and subsidiaries (the “Company”) as of December 31, 2020, based on criteria established in Internal Control — Integrated Framework (2013) issued by the Committee of Sponsoring Organizations of the Treadway Commission (COSO). In our opinion, the Company maintained, in all material respects, effective internal control over financial reporting as of December 31, 2020, based on criteria established in Internal Control — Integrated Framework (2013) issued by COSO.
We have also audited, in accordance with the standards of the Public Company Accounting Oversight Board (United States) (PCAOB), the consolidated financial statements as of and for the year ended December 31, 2020, of the Company and our report dated February 25, 2021, expressed an unqualified opinion on those financial statements.
Basis for Opinion
The Company’s management is responsible for maintaining effective internal control over financial reporting and for its assessment of the effectiveness of internal control over financial reporting, included in the accompanying Management’s Report on Internal Control over Financial Reporting. Our responsibility is to express an opinion on the Company’s internal control over financial reporting based on our audit. We are a public accounting firm registered with the PCAOB and are required to be independent with respect to the Company in accordance with the U.S. federal securities laws and the applicable rules and regulations of the Securities and Exchange Commission and the PCAOB.
We conducted our audit in accordance with the standards of the PCAOB. Those standards require that we plan and perform the audit to obtain reasonable assurance about whether effective internal control over financial reporting was maintained in all material respects. Our audit included obtaining an understanding of internal control over financial reporting, assessing the risk that a material weakness exists, testing and evaluating the design and operating effectiveness of internal control based on the assessed risk, and performing such other procedures as we considered necessary in the circumstances. We believe that our audit provides a reasonable basis for our opinion.
Definition and Limitations of Internal Control over Financial Reporting
A company's internal control over financial reporting is a process designed to provide reasonable assurance regarding the reliability of financial reporting and the preparation of financial statements for external purposes in accordance with generally accepted accounting principles. A company's internal control over financial reporting includes those policies and procedures that (1) pertain to the maintenance of records that, in reasonable detail, accurately and fairly reflect the transactions and dispositions of the assets of the company; (2) provide reasonable assurance that transactions are recorded as necessary to permit preparation of financial statements in accordance with generally accepted accounting principles, and that receipts and expenditures of the company are being made only in accordance with authorizations of management and directors of the company; and (3) provide reasonable assurance regarding prevention or timely detection of unauthorized acquisition, use, or disposition of the company's assets that could have a material effect on the financial statements.
Because of the inherent limitations, internal control over financial reporting may not prevent or detect misstatements. Also, projections of any evaluation of the effectiveness to future periods are subject to the risk that the controls may become inadequate because of changes in conditions, or that the degree of compliance with the policies or procedures may deteriorate.
| /s/ DELOITTE & TOUCHE LLP |
| Birmingham, Alabama |
| February 25, 2021 |
| Part II | 124 |
Item 9B. OTHER INFORMATION
OTHER INFORMATION
None.
| Part II | 125 |
PART III
Item 10. DIRECTORS, EXECUTIVE OFFICERS AND CORPORATE GOVERNANCE
DIRECTORS, EXECUTIVE OFFICERS AND CORPORATE GOVERNANCE
On or about March 29, 2021, we expect to file a definitive proxy statement with the Securities and Exchange Commission pursuant to Regulation 14A (our “2021 Proxy Statement”). The information under the headings “Proposal 1 - Election of Directors,” “Corporate Governance – Policies,” “Corporate Governance – Director Nomination Process,” “Corporate Governance – Committees of the Board of Directors” and “Delinquent Section 16(a) Reports” (to the extent reported therein) included in our 2021 Proxy Statement is incorporated herein by reference. See also the information about our executive officers and governance policies set forth above in Part I of this report.
Item 11. EXECUTIVE COMPENSATION
EXECUTIVE COMPENSATION
The information under the headings “Compensation Discussion and Analysis,” “Director Compensation,” “Executive Compensation,” “Corporate Governance – Compensation Committee Interlocks and Insider Participation,” and “Compensation Committee Report” included in our 2021 Proxy Statement is incorporated herein by reference.
Item 12. SECURITY OWNERSHIP OF CERTAIN BENEFICIAL OWNERS AND MANAGEMENT AND RELATED
SECURITY OWNERSHIP OF CERTAIN BENEFICIAL OWNERS AND MANAGEMENT AND RELATED
STOCKHOLDER MATTERS
The information under the headings “Security Ownership of Certain Beneficial Owners and Management,” and “Equity Compensation Plans” included in our 2021 Proxy Statement is incorporated herein by reference.
Item 13. CERTAIN RELATIONSHIPS AND RELATED TRANSACTIONS, AND DIRECTOR INDEPENDENCE
CERTAIN RELATIONSHIPS AND RELATED TRANSACTIONS, AND DIRECTOR INDEPENDENCE
The information under the headings “Corporate Governance – Director Independence,” and “Corporate Governance – Transactions with Related Persons” included in our 2021 Proxy Statement is incorporated herein by reference.
Item 14. PRINCIPAL ACCOUNTING FEES AND SERVICES
PRINCIPAL ACCOUNTING FEES AND SERVICES
The information under the heading “Independent Registered Public Accounting Firm” included in our 2021 Proxy Statement is incorporated herein by reference.
| 1208 | |
|---|---|
| Part III | 126 |
PART IV
Item 15. EXHIBITS AND FINANCIAL STATEMENT SCHEDULES
EXHIBITS AND FINANCIAL STATEMENT SCHEDULES
(a) (1) Financial statements
The following financial statements are included herein on the pages shown below:
| Page in Report | |||
| Report of Independent Registered Public Accounting Firm | 68 - 69 | ||
| Consolidated Statements of Comprehensive Income | 70 | ||
| Consolidated Balance Sheets | 71 | ||
| Consolidated Statements of Cash Flows | 72 | ||
| Consolidated Statements of Equity | 73 | ||
| Notes to Consolidated Financial Statements | 74 -122 |
(a) (2) Financial statement schedules
Financial statement schedules are omitted because of the absence of conditions under which they are required or because the required information is provided in the financial statements or notes thereto.
Financial statements (and summarized financial information) of 50% or less owned entities accounted for by the equity method have been omitted because they do not, considered individually or in the aggregate, constitute a significant subsidiary.
(a) (3) Exhibits
| Part IV | 127 |
| Part IV | 128 |
| Part IV | 129 |
| Part IV | 130 |
| Exhibit 101 | The following financial information from this Annual Report on Form 10-K for the year ended December 31, 2020 are formatted in iXBRL (Inline eXtensible Business Reporting Language): (i) the Consolidated Statements of Comprehensive Income, (ii) the Consolidated Balance Sheets, (iii) the Consolidated Statements of Cash Flows, (iv) the Consolidated Statements of Equity and (v) the Notes to Consolidated Financial Statements. | ||
|---|---|---|---|
| Exhibit 104 | Cover Page Interactive Data File – the cover page from this Annual Report on Form 10-K for the year ended December 31, 2020 is formatted in iXBRL (contained in Exhibit 101). | ||
| 1 | Incorporated by reference. | ||
| 2 | Management contract or compensatory plan. |
Our SEC file number for documents filed with the SEC pursuant to the Securities Exchange Act of 1934, as amended, is 001-33841.
| Part IV | 131 |
Item 16. FORM 10-K SUMMARY
FORM 10-K SUMMARY
We have chosen not to include an optional summary of the information required by this Form 10-K.
| Part IV | 132 |
SIGNATURES
Pursuant to the requirements of Section 13 or 15(d) of the Securities Exchange Act of 1934, the registrant has duly caused this report to be signed on its behalf by the undersigned, thereunto duly authorized on February 25, 2021.
| VULCAN MATERIALS COMPANY | |
 J. Thomas Hill Chairman, President and Chief Executive Officer J. Thomas Hill Chairman, President and Chief Executive Officer |
Pursuant to the requirements of the Securities Exchange Act of 1934, this report has been signed below by the following persons on behalf of the registrant and in the capacities and on the dates indicated.
| Signature | Title | Date |
| J. Thomas Hill | Chairman, President and Chief Executive Officer (Principal Executive Officer) | February 25, 2021 |
 Suzanne H. Wood Suzanne H. Wood | Senior Vice President and Chief Financial Officer (Principal Financial Officer) | February 25, 2021 |
 Randy L. Pigg Randy L. Pigg | Vice President, Controller (Principal Accounting Officer) | February 25, 2021 |
| The following directors: Melissa H. Anderson Thomas A. Fanning O. B. Grayson Hall, Jr. Cynthia L. Hostetler Richard T. O'Brien James T. Prokopanko Kathleen L. Quirk David P. Steiner Lee J. Styslinger, III George Willis | Director Director Director Director Director Director Director Director Director Director | |
 Denson N. Franklin III Attorney-in-Fact Denson N. Franklin III Attorney-in-Fact | February 25, 2021 |
| Part IV | 133 |