 filings.tools
Item 5. MARKET FOR REGISTRANT’S COMMON EQUITY, RELATED STOCKHOLDER MATTERS AND ISSUER PURCHASES OF EQUITY SECURITIES
6K characters. Original on sec.gov · Markdown
Item 5. MARKET FOR REGISTRANT’S COMMON EQUITY, RELATED STOCKHOLDER MATTERS AND ISSUER PURCHASES OF EQUITY SECURITIES
Price Range of Common Stock
Our common stock is traded on the NASDAQ Global Select Market under the symbol “VRSN.” The following table sets forth, for the periods indicated, the high and low sales prices per share for our common stock as reported by the NASDAQ Global Select Market:
| Price Range | ||||||||
| High | Low | |||||||
| Year ended December 31, 2017: | ||||||||
| Fourth Quarter | $ | 118.28 | $ | 106.17 | ||||
| Third Quarter | $ | 106.81 | $ | 92.91 | ||||
| Second Quarter | $ | 94.93 | $ | 87.01 | ||||
| First Quarter | $ | 88.08 | $ | 76.45 | ||||
| Year ended December 31, 2016: | ||||||||
| Fourth Quarter | $ | 86.98 | $ | 74.46 | ||||
| Third Quarter | $ | 87.19 | $ | 74.01 | ||||
| Second Quarter | $ | 91.99 | $ | 80.47 | ||||
| First Quarter | $ | 90.61 | $ | 70.26 |
On February 9, 2018, there were 426 holders of record of our common stock. We cannot estimate the number of beneficial owners since many brokers and other institutions hold our stock on behalf of stockholders. On February 9, 2018, the reported last sale price of our common stock was $109.09 per share as reported by the NASDAQ Global Select Market.
We have not declared or paid any cash dividends on our common stock or any other securities in the last six years. We continually evaluate the overall cash and investing needs of the business and consider the best uses for our cash, including investments in the strengthening of our infrastructure and growth opportunities for our business, as well as potential share repurchases.
For information regarding securities authorized for issuance under our equity compensation plans, see Note 8, “Employee Benefits and Stock-based Compensation,” of our Notes to Consolidated Financial Statements in Item 15 of this Form 10-K.
Share Repurchases
The following table presents the share repurchase activity during the three months ended December 31, 2017:
| Total Number of Shares Purchased | Average Price Paid per Share | Total Number of Shares Purchased as Part of Publicly Announced Plans or Programs | Approximate Dollar Value of Shares That May Yet Be Purchased Under the Plans or Programs (1)(2) | ||||||||||
| (Shares in thousands) | |||||||||||||
| October 1 – 31, 2017 | 468 | $108.28 | 468 | $ | 571.8 | million | |||||||
| November 1 – 30, 2017 | 433 | $111.64 | 433 | $ | 523.5 | million | |||||||
| December 1 – 31, 2017 | 403 | $114.32 | 403 | $ | 477.4 | million | |||||||
| 1,304 | 1,304 |
| (1) | Effective February 9, 2017, our Board authorized the repurchase of approximately $640.9 million of our common stock, in addition to the $359.1 million of our common stock remaining available for repurchase under the previous share repurchase program, for a total repurchase authorization of up to $1.0 billion of our common stock. |
| (2) | Effective February 8, 2018, our Board authorized the repurchase of approximately $585.8 million of our common stock, in addition to the $414.2 million of our common stock remaining available for repurchase under the previous share repurchase program, for a total repurchase authorization of up to $1.0 billion of our common stock. The share repurchase program has no expiration date. Purchases made under the program could be effected through open market transactions, block purchases, accelerated share repurchase agreements or other negotiated transactions. |
Performance Graph
The information contained in the Performance Graph shall not be deemed to be “soliciting material” or “filed” with the SEC or subject to the liabilities of Section 18 of the Exchange Act, except to the extent that we specifically incorporate it by reference into a document filed under the Securities Act of 1933, as amended (the “Securities Act”), or the Exchange Act.
The following graph compares the cumulative total stockholder return on our common stock, the Standard and Poor’s (“S&P”) 500 Index, and the S&P 500 Information Technology Index. The graph assumes that $100 (and the reinvestment of any dividends thereafter) was invested in our common stock, the S&P 500 Index and the S&P 500 Information Technology Index on December 31, 2012, and calculates the return annually through December 31, 2017. The stock price performance on the following graph is not necessarily indicative of future stock price performance.
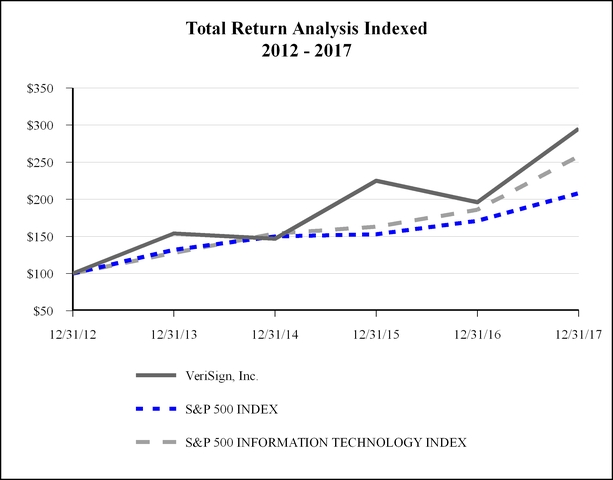
| 12/31/12 | 12/31/13 | 12/31/14 | 12/31/15 | 12/31/16 | 12/31/17 | |||||||||||||
| VeriSign, Inc | $ | 100 | $ | 154 | $ | 147 | $ | 225 | $ | 196 | $ | 295 | ||||||
| S&P 500 Index | $ | 100 | $ | 132 | $ | 150 | $ | 153 | $ | 171 | $ | 208 | ||||||
| S&P 500 Information Technology Index | $ | 100 | $ | 128 | $ | 154 | $ | 163 | $ | 186 | $ | 258 |
Previous: Item 4. MINE SAFETY DISCLOSURES · Next: Item 6. SELECTED FINANCIAL DATA