 filings.tools
Item 5. MARKET FOR REGISTRANT'S COMMON EQUITY, RELATED STOCKHOLDER MATTERS AND ISSUER PURCHASES OF EQUITY SECURITIES
3K characters. Original on sec.gov · Markdown
Item 5. MARKET FOR REGISTRANT'S COMMON EQUITY, RELATED STOCKHOLDER MATTERS AND ISSUER PURCHASES OF EQUITY SECURITIES
Vistra Energy's authorized capital stock consists of 1,800,000,000 shares of common stock with a par value of $0.01 per share.
Since May 10, 2017, Vistra Energy's common stock has been listed on the NYSE under the symbol "VST". Upon Emergence and through May 9, 2017, Vistra Energy's common stock was listed on the OTCQX U.S. under the symbol "VSTE".
As of February 21, 2018, there were 428,447,631 shares of common stock issued and outstanding and 123 shareholders of record.
The following table sets forth the per share high and low closing prices and per share cash dividends declared per common share for the periods presented.
| 2017 | 2016 | ||||||||||||||||||
| Fourth Quarter | Third Quarter | Second Quarter | First Quarter | Fourth Quarter | |||||||||||||||
| High price | $ | 20.49 | $ | 18.70 | $ | 16.86 | $ | 17.95 | $ | 16.40 | |||||||||
| Low price | $ | 17.24 | $ | 15.88 | $ | 14.59 | $ | 15.36 | $ | 13.60 | |||||||||
| Dividends per common share | $ | — | $ | — | $ | — | $ | — | $ | 2.32 |
Other than a one-time dividend in the aggregate amount of approximately $1 billion ($2.32 per share of common stock) to holders of record of our common stock on December 19, 2016, Vistra Energy has never paid a dividend on our common stock, and the Board has no present intention to declare or pay dividends in the future. For additional details, see Item 1A. Risk Factors and Note 14 to the Financial Statements
Subject to limitations under applicable Delaware law, preferences that may apply to any outstanding shares of our preferred stock and contractual restrictions, holders of our common stock are entitled to receive dividends or other distributions ratably, when, as and if declared by the Board. The ability of the Board to declare dividends with respect to our common stock, however, will be subject to such limitations, preferences and restrictions and the availability of sufficient funds under the Delaware General Corporation Law (DGCL) to pay such dividends.
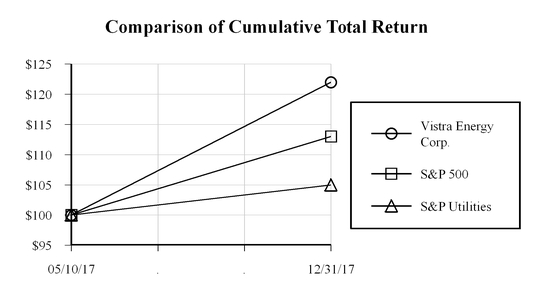
Stock Performance Graph
The performance graph below compares Vistra Energy's cumulative total return on common stock for the period from May 10, 2017 through December 31, 2017 with the cumulative total returns of the S&P 500 Stock Index (S&P 500) and the S&P Utility Index (S&P Utilities). The graph below compares the return in each period assuming that $100 was invested at May 10, 2017 in Vistra Energy's common stock, the S&P 500 and the S&P Utilities, and that all dividends were reinvested.
Previous: Item 4. MINE SAFETY DISCLOSURES · Next: Item 6. SELECTED FINANCIAL DATA