 filings.tools
Item 5. Market for Registrant’s Common Equity, Related Stockholder Matters and Issuer Purchases of Equity Securities
9K characters. Original on sec.gov ·
Item 5. Market for Registrant’s Common Equity, Related Stockholder Matters and Issuer Purchases of Equity Securities
| --- | --- |
The Company’s common stock is registered under the Exchange Act, and is listed on the New York Stock Exchange under the symbol WAT. As of February 17, 2017, the Company had 100 common stockholders of record. The Company has not declared or paid any dividends on its common stock in its past three fiscal years. The Company has not made any sales of unregistered equity securities in the years ended December 31, 2016, 2015 or 2014.
Securities Authorized for Issuance under Equity Compensation Plans
Equity compensation plan information is incorporated by reference from Part III, Item 12, Security Ownership of Certain Beneficial Owners and Management and Related Stockholder Matters, of this document and should be considered an integral part of this Item 5.
Table of Contents
Stock Price Performance Graph
The following performance graph and related information shall not be deemed to be “soliciting material” or to be “filed” with the SEC, nor shall such information be incorporated by reference into any future filing under the Securities Act of 1933, as amended, or the Exchange Act, except to the extent that the Company specifically incorporates it by reference into such filing.
The following graph compares the cumulative total return on $100 invested as of December 31, 2011 (the last day of public trading of the Company’s common stock in fiscal year 2011) through December 31, 2016 (the last day of public trading of the common stock in fiscal year 2016) in the Company’s common stock, the NYSE Market Index, the SIC Code 3826 Index and the S&P 500 Index. The return of the indices is calculated assuming reinvestment of dividends during the period presented. The Company has not paid any dividends since its IPO. The stock price performance shown on the graph below is not necessarily indicative of future price performance.
COMPARISON OF CUMULATIVE TOTAL RETURN SINCE DECEMBER 31, 2011
AMONG WATERS CORPORATION, NYSE MARKET INDEX, SIC CODE 3826 INDEX –
LABORATORY ANALYTICAL INSTRUMENTS AND S&P 500 INDEX
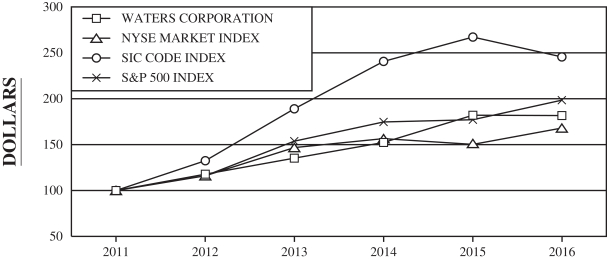
| 2011 | 2012 | 2013 | 2014 | 2015 | 2016 | |||||||||||||||||||
| WATERS CORPORATION | $ | 100.00 | $ | 117.65 | $ | 135.04 | $ | 152.22 | $ | 181.74 | $ | 181.49 | ||||||||||||
| NYSE MARKET INDEX | $ | 100.00 | $ | 115.99 | $ | 146.47 | $ | 156.36 | $ | 149.97 | $ | 167.87 | ||||||||||||
| SIC CODE INDEX | $ | 100.00 | $ | 132.41 | $ | 188.94 | $ | 240.66 | $ | 267.00 | $ | 245.55 | ||||||||||||
| S&P 500 INDEX | $ | 100.00 | $ | 116.00 | $ | 153.58 | $ | 174.60 | $ | 177.01 | $ | 198.18 |
Table of Contents
Market for Registrant’s Common Equity
The quarterly range of high and low sales prices for the Company’s common stock as reported by the New York Stock Exchange is as follows:
| Price Range | ||||||||
| For the Quarter Ended | High | Low | ||||||
| April 4, 2015 | $ | 125.86 | $ | 111.77 | ||||
| July 4, 2015 | $ | 137.39 | $ | 120.79 | ||||
| October 3, 2015 | $ | 136.17 | $ | 113.98 | ||||
| December 31, 2015 | $ | 136.95 | $ | 115.21 | ||||
| April 2, 2016 | $ | 133.60 | $ | 112.00 | ||||
| July 2, 2016 | $ | 143.73 | $ | 128.90 | ||||
| October 1, 2016 | $ | 162.53 | $ | 140.76 | ||||
| December 31, 2016 | $ | 160.00 | $ | 133.35 |
Purchases of Equity Securities by the Issuer
The following table provides information about purchases by the Company during the three months ended December 31, 2016 of equity securities registered by the Company under the Exchange Act (in thousands, except per share data):
| Period | Total Number of Shares Purchased (1) | Average Price Paid per Share | Total Number of Shares Purchased as Part of Publicly Announced Programs (2) | Maximum Dollar Value of Shares that May Yet Be Purchased Under the Programs (2) | ||||||||||||
| October 2 to October 29, 2016 | 35 | $ | 140.11 | 35 | $ | 200,676 | ||||||||||
| October 30 to November 26, 2016 | 345 | $ | 138.99 | 345 | $ | 152,724 | ||||||||||
| November 27 to December 31, 2016 | 227 | $ | 136.48 | 215 | $ | 123,413 | ||||||||||
| Total | 607 | $ | 138.12 | 595 | $ | 123,413 | ||||||||||
| (1) | The Company repurchased $8 million of common stock related to the vesting of restricted stock units during 2016. |
|---|
| (2) | The Company purchased an aggregate of 2.3 million shares of its outstanding common stock in 2016 in open market transactions pursuant to a repurchase program that was announced in May 2014 (the “2014 Program”). The 2014 Program authorized the repurchase of up to $750 million of common stock in open market transactions over a three-year period. |
|---|
Table of Contents
| Item 6: Selected | Financial Data |
|---|
The following table sets forth selected historical consolidated financial and operating data for the periods indicated. The statement of operations and balance sheet data is derived from audited financial statements for the years 2016, 2015, 2014, 2013 and 2012. The Company’s financial statements as of December 31, 2016 and 2015, and for each of the three years in the period ended December 31, 2016 are included in Item 8, Financial Statements and Supplementary Data, in Part II of this Form 10-K.
| In thousands, except per share and employees data | 2016 | 2015 | 2014 | 2013 | 2012 | |||||||||||||||
| STATEMENT OF OPERATIONS DATA: | ||||||||||||||||||||
| Net sales | $ | 2,167,423 | $ | 2,042,332 | $ | 1,989,344 | $ | 1,904,218 | $ | 1,843,641 | ||||||||||
| Income from operations before income taxes | $ | 600,114 | $ | 541,919 | $ | 490,740 | $ | 490,105 | $ | 487,625 | ||||||||||
| Net income | $ | 521,503 | $ | 469,053 | $ | 431,620 | $ | 450,003 | $ | 461,443 | ||||||||||
| Net income per basic common share | $ | 6.46 | $ | 5.70 | $ | 5.12 | $ | 5.27 | $ | 5.25 | ||||||||||
| Weighted-average number of basic common shares | 80,786 | 82,336 | 84,358 | 85,426 | 87,841 | |||||||||||||||
| Net income per diluted common share | $ | 6.41 | $ | 5.65 | $ | 5.07 | $ | 5.20 | $ | 5.19 | ||||||||||
| Weighted-average number of diluted common shares and equivalents | 81,417 | 83,087 | 85,151 | 86,546 | 88,979 | |||||||||||||||
| BALANCE SHEET AND OTHER DATA: | ||||||||||||||||||||
| Cash, cash equivalents and investments | $ | 2,813,032 | $ | 2,399,263 | $ | 2,055,388 | $ | 1,803,670 | $ | 1,539,025 | ||||||||||
| Working capital, including current maturities of debt* | $ | 3,115,124 | $ | 2,649,457 | $ | 2,236,558 | $ | 2,038,100 | $ | 1,701,784 | ||||||||||
| Total assets* | $ | 4,662,059 | $ | 4,268,677 | $ | 3,874,690 | $ | 3,580,106 | $ | 3,181,597 | ||||||||||
| Long-term debt* | $ | 1,701,966 | $ | 1,493,027 | $ | 1,237,463 | $ | 1,188,162 | $ | 1,042,559 | ||||||||||
| Stockholders’ equity | $ | 2,301,949 | $ | 2,058,851 | $ | 1,894,666 | $ | 1,763,173 | $ | 1,467,357 | ||||||||||
| Employees | 6,899 | 6,594 | 6,161 | 5,965 | 5,860 |
| * | In 2015, the Company adopted new accounting guidance related to the presentation of debt issuance costs and deferred income taxes, both standards have been applied above retrospectively. Certain debt issuance costs have been reclassified from intangible assets and are presented as a direct deduction from the carrying value of the associated debt. Current deferred tax assets and liabilities have been reclassified as non-current deferred tax assets and liabilities. |
|---|
Previous: Item 4. Mine Safety Disclosures · Next: Item 7. Management’s Discussion and Analysis of Financial Condition and Results of Operations