 filings.tools
Waters 2016 10-K Annual Report
WAT · CIK 1000697 · Form 10-K · Fiscal year ended December 31, 2016 · Filed February 24, 2017
Revenue rose 6.1% to $2.17 billion. Operating margin was 28.8%, against 27.8% the year before.
20 sections, 393K characters. Original on sec.gov · ·
| Measure | Year ended Dec 31, 2016 | Year ended Dec 31, 2015 | Change |
|---|---|---|---|
| Revenue | $2.17B | $2.04B | +6.1% |
| Operating income | $624M | $567M | +10.0% |
| Diluted EPS | $6.41 | $5.65 | +13.5% |
| Cash and equivalents | $506M | $488M | +3.7% |
| Operating margin* | 28.8% | 27.8% | +1.0 pts |
From the XBRL facts tagged to this filing; both columns are as reported in this filing. * Computed by filings.tools: free cash flow is operating cash flow less capital spending; operating margin is operating income over revenue.
Cover and table of contents
10-K 1 d268303d10k.htm 10-K
Table of Contents
UNITED STATES SECURITIES AND EXCHANGE COMMISSION
Washington, D.C. 20549
Form 10-K
| ☑ | ANNUAL REPORT PURSUANT TO SECTION 13 OR 15(d) |
|---|
| OF THE SECURITIES EXCHANGE ACT OF 1934 |
|---|
For the fiscal year ended December 31, 2016
or
| ☐ | TRANSITION REPORT PURSUANT TO SECTION 13 OR 15(d) |
|---|
| OF THE SECURITIES EXCHANGE ACT OF 1934 |
|---|
Commission File Number: 01-14010
Waters Corporation
(Exact name of registrant as specified in its charter)
| Delaware | 13-3668640 | |
| (State or other jurisdiction of incorporation or organization) | (I.R.S. Employer Identification No.) |
34 Maple Street
Milford, Massachusetts 01757
(Address, including zip code, of principal executive offices)
(508) 478-2000
(Registrant’s telephone number, including area code)
| Securities registered pursuant to Section 12(b) of the Act: | Common Stock, par value $0.01 per share | |
| New York Stock Exchange, Inc. | ||
| Securities registered pursuant to Section 12(g) of the Act: | None |
Indicate by check mark if the registrant is a well-known seasoned issuer, as defined in Rule 405 of the Securities Act. Yes ☑ No ☐
Indicate by check mark if the registrant is not required to file reports pursuant to Section 13 or Section 15(d) of the Act. Yes ☐ No ☑
Indicate by check mark whether the registrant (1) has filed all reports required to be filed by Section 13 or 15(d) of the Securities Exchange Act of 1934 during the preceding 12 months (or for such shorter period that the registrant was required to file such reports), and (2) has been subject to such filing requirements for the past 90 days. Yes ☑ No ☐
Indicate by check mark whether the registrant has submitted electronically and posted on its corporate website, if any, every Interactive Data File required to be submitted and posted pursuant to Rule 405 of Regulation S-T (§232.405 of this chapter) during the preceding 12 months (or for such shorter period that the registrant was required to submit and post such files). Yes ☑ No ☐
Indicate by check mark if disclosure of delinquent filers pursuant to Item 405 of Regulation S-K (§229.405 of this chapter) is not contained herein, and will not be contained, to the best of registrant’s knowledge, in definitive proxy or information statements incorporated by reference in Part III of this Form 10-K or any amendment to this Form 10-K. ☑
Indicate by check mark whether the registrant is a large accelerated filer, an accelerated filer, a non-accelerated filer, or smaller reporting company. See the definition of “large accelerated filer”, “accelerated filer” and “smaller reporting company” in Rule 12b-2 of the Exchange Act. (Check one):
| Large accelerated filer ☑ | Accelerated filer ☐ | Non-accelerated filer ☐ | Smaller reporting company ☐ | |||
| (Do not check if a smaller reporting company) |
Indicate by check mark whether the registrant is a shell company (as defined in Rule 12b-2 of the Act). Yes ☐ No ☑
State the aggregate market value of the registrant’s common stock held by non-affiliates of the registrant as of July 2, 2016: $11,522,067,374.
Indicate the number of shares outstanding of the registrant’s common stock as of February 17, 2017: 80,085,831
DOCUMENTS INCORPORATED BY REFERENCE
Portions of the registrant’s definitive proxy statement that will be filed for the 2017 Annual Meeting of Stockholders are incorporated by reference in Part III.
Table of Contents
WATERS CORPORATION AND SUBSIDIARIES
ANNUAL REPORT ON FORM 10-K
INDEX
Table of Contents
PART I
Item 1. Business
| --- | --- |
General
Waters Corporation (the “Company”) is an analytical instrument manufacturer that primarily designs, manufactures, sells and services high performance liquid chromatography (“HPLC”), ultra performance liquid chromatography (“UPLC®” and together with HPLC, referred to as “LC”) and mass spectrometry (“MS”) technology systems and support products, including chromatography columns, other consumable products and comprehensive post-warranty service plans. These systems are complementary products that are frequently employed together (“LC-MS”) and sold as integrated instrument systems using a common software platform. In addition, the Company designs, manufactures, sells and services thermal analysis, rheometry and calorimetry instruments through its TA® product line. The Company is also a developer and supplier of software-based products that interface with the Company’s instruments, as well as other suppliers’ instruments, and are typically purchased by customers as part of the instrument system.
The Company’s products are used by life science, pharmaceutical, biochemical, industrial, nutritional safety, environmental, academic and governmental customers working in research and development, quality assurance and other laboratory applications. The Company’s LC and LC-MS instruments are utilized in this broad range of industries to detect, identify, monitor and measure the chemical, physical and biological composition of materials, and to purify a full range of compounds. These instruments are used in drug discovery and development, including clinical trial testing, the analysis of proteins in disease processes (known as “proteomics”), nutritional safety analysis and environmental testing. LC-MS instruments combine a liquid phase sample introduction and separation system with mass spectrometric compound identification and quantification. The Company’s thermal analysis, rheometry and calorimetry instruments are used in predicting the suitability and stability of fine chemicals, pharmaceuticals, water, polymers, metals and viscous liquids for various industrial, consumer goods and healthcare products, as well as for life science research.
Waters Corporation, organized as a Delaware corporation in 1991, is a holding company that owns all of the outstanding common stock of Waters Technologies Corporation, its operating subsidiary. Waters Corporation became a publicly-traded company with its initial public offering (“IPO”) in November 1995. Since the IPO, the Company has added two significant and complementary technologies to its range of products with the acquisitions of TA Instruments in May 1996 and Micromass Limited in September 1997.
Business Segments
The Company’s business activities, for which discrete financial information is available, are regularly reviewed and evaluated by the chief operating decision maker. As a result of this evaluation, the Company determined that it has two operating segments: Waters® and TA. The Company operates in the analytical instruments industry by designing, manufacturing, distributing and servicing instrument systems, columns and other chemistry consumables that can be integrated and used along with other analytical instruments. The Company’s two operating segments have similar economic characteristics; product processes; products and services; types and classes of customers; methods of distribution; and regulatory environments. Because of these similarities, the two operating segments have been aggregated into one reporting segment for financial statement purposes.
Information concerning revenues and long-lived assets attributable to each of the Company’s products, services and geographic areas is set forth in Note 16 in the Notes to the Consolidated Financial Statements, which is incorporated herein by reference.
Table of Contents
Waters Products and Markets
High Performance and Ultra Performance Liquid Chromatography
HPLC is a standard technique used to identify and analyze the constituent components of a variety of chemicals and other materials. The Company believes that HPLC’s performance capabilities enable it to separate, identify and quantify approximately 80% of all known chemicals and materials. As a result, HPLC is used to analyze substances in a wide variety of industries for research and development purposes, quality control and process engineering applications.
The most significant end-use markets for HPLC are those served by the pharmaceutical and life science industries. In these markets, HPLC is used extensively to understand diseases, identify new drugs, develop manufacturing methods and assure the potency and purity of new pharmaceuticals. HPLC is also used in a variety of other applications, such as analyses of foods and beverages for nutritional labeling and compliance with safety regulations and the testing of water and air purity within the environmental testing industry, as well as applications in other industries, such as chemical and consumer products. HPLC is also used by universities, research institutions and governmental agencies, such as the United States Food and Drug Administration (“FDA”) and the United States Environmental Protection Agency (“EPA”) and their foreign counterparts that mandate testing requiring HPLC-based methodologies.
In 2004, Waters introduced a novel technology that the Company describes as ultra performance liquid chromatography that utilizes a packing material with small, uniform diameter particles and a specialized instrument, the ACQUITY UPLC®, to accommodate the increased pressure and narrow chromatographic bands that are generated by these small particles. By using the ACQUITY UPLC, researchers and analysts are able to achieve more comprehensive chemical separations and faster analysis times in comparison with many analyses performed by HPLC. In addition, in using the ACQUITY UPLC, researchers have the potential to extend the range of applications beyond that of HPLC, enabling them to uncover more levels of scientific information. While offering significant performance advantages, the ACQUITY UPLC is also compatible with the Company’s software products and the general operating protocols of HPLC. For these reasons, the Company’s customers and field sales and support organizations are well positioned to utilize this new technology and instrument. In 2012, the Company introduced UltraPerformance Convergence Chromatography® (“UPC2®”) with the release of the ACQUITY® UPC2® system. This new technology marries the unrealized potential of supercritical fluid chromatography (“SFC”) with the proven UPLC technology, using carbon dioxide as the primary mobile phase. By varying mobile phase strength, pressure, temperature and stationary phase with UPC2, a user can separate, detect and quantify structural analogs, isomers, enantiomeric and diasteriomeric mixtures — all compounds or samples that challenge today’s laboratories. In 2014, the Company introduced the ACQUITY UPLC® M-Class instrument system. This system delivers the sensitivity to quantify and identify vanishingly small concentrations of key molecules, particularly when used with advanced mass spectrometric characterization. The innovations incorporated into the ACQUITY UPLC M-Class system are led by its internal low-volume design and newly redesigned fluidics that minimize dispersive and adsorptive losses during a chromatographic separation. In 2015, the Company introduced the ACQUITY® Arc System and its enabling Arc Multi-flow pathTM technology, which bridges the gap between HPLC and UPLC by emulating a variety of HPLC systems without altering the method’s gradient table and enabling improved chromatographic performance of methods by leveraging 2.5-2.7 micron particle column technologies.
Waters manufactures LC instruments that are offered in configurations that allow for varying degrees of automation, from component configured systems for academi
Showing the first 8K of 82K characters. Open the full section
Item 1B. Unresolved Staff Comments
| --- | --- |
None.
Item 2. Properties
| --- | --- |
Waters Corporation operates 21 United States facilities and 77 international facilities, including field offices. The Company believes its facilities are suitable and adequate for its current production level and for reasonable growth over the next several years. The Company’s primary facilities are summarized in the table below.
Primary Facility Locations
| Location | Function (1) | Owned/Leased | ||
| Golden, CO | M, R, S, D, A | Leased | ||
| New Castle, DE | M, R, S, D, A | Owned | ||
| Milford, MA | M, R, S, D, A | Owned | ||
| Taunton, MA | M, R | Owned | ||
| Wakefield, MA | M, R, S, D, A | Leased | ||
| Eden Prairie, MN | M, R, S, D, A | Leased | ||
| Nixa, MO | M, S, D, A | Leased | ||
| Sharpsburg, PA | M, R, S, D, A | Leased | ||
| Lindon, UT | M, R, S, D, A | Leased | ||
| New Castle, England | R, S, D, A | Leased | ||
| Solihull, England | M, A | Owned | ||
| Wilmslow, England | M, R, S, D, A | Owned | ||
| St. Quentin, France | S, A | Leased | ||
| Huellhorst, Germany | M, R, S, D, A | Owned | ||
| Bochum, Germany | M, R, S, D, A | Leased | ||
| Budapest, Hungary | R | Leased | ||
| Wexford, Ireland | M, R, D, A | Owned | ||
| Ede, Netherlands | M, R, S, D, A | Leased | ||
| Etten-Leur, Netherlands | S, D, A | Owned | ||
| Brasov, Romania | R, A | Leased | ||
| Singapore | R, S, D, A | Leased |
| (1) | M = Manufacturing; R = Research; S = Sales and Service; D = Distribution; A = Administration |
|---|
Table of Contents
The Company operates and maintains 11 field offices in the United States and 64 field offices abroad in addition to sales offices in the primary facilities listed above. The Company’s field office locations are listed below.
Field Office Locations (2)
| United States | International | |||||
| Irvine, CA | Australia | India | Portugal | |||
| Pleasanton, CA | Austria | Ireland | Poland | |||
| Wood Dale, IL | Belgium | Israel | Puerto Rico | |||
| Columbia, MD | Brazil | Italy | Spain | |||
| Beverly, MA | Canada | Japan | Sweden | |||
| Ann Arbor, MI | Czech Republic | Korea | Switzerland | |||
| Durham, NC | Denmark | Malaysia | Taiwan | |||
| Morrisville, NC | Finland | Mexico | United Kingdom | |||
| Parsippany, NJ | France | Netherlands | ||||
| Plymouth Meeting, PA | Germany | Norway | ||||
| Bellaire, TX | Hungary | People’s Republic of China |
| (2) | The Company operates more than one field office within certain states and foreign countries. |
|---|
Item 3. Legal Proceedings
| --- | --- |
From time to time, the Company and its subsidiaries are involved in various litigation matters arising in the ordinary course of business. The Company believes it has meritorious arguments in its current litigation matters and believes any outcome, either individually or in the aggregate, will not be material to the Company’s financial position or results of operations. In both 2016 and 2015, the Company recorded $4 million of litigation settlement provisions and related costs associated with multiple litigation matters.
Item 4. Mine Safety Disclosures
| --- | --- |
Not applicable.
EXECUTIVE OFFICERS OF THE REGISTRANT
Officers of the Company are elected annually by the Board of Directors and hold office at the discretion of the Board of Directors. The following persons serve as executive officers of the Company:
Christopher J. O’Connell, 50, has served as a Director of the Company since September 2015, when he assumed the position of President and Chief Executive Officer of the Company. Mr. O’Connell served as Executive Vice President and President of Restorative Therapies Group of Medtronic plc from August 2009 to August 2015. From 1994 to August 2009, Mr. O’Connell served in the following positions at Medtronic plc: Senior Vice President and President of Medtronic Diabetes, President of Medtronic Physio-Control, Vice President of Sales and Marketing for the Cardiac Rhythm Management business, Vice President/General Manager of the Patient Management Business, Vice President of Corporate Strategy, Director of Investor Relations and Corporate Development Associate.
Mark T. Beaudouin, 62, was appointed Senior Vice President, General Counsel and Secretary in February 2016 and was Vice President, General Counsel and Secretary of the Company since April 2003. Prior to joining Waters Corporation, he served as Senior Vice President, General Counsel and Secretary of PAREXEL International Corporation, a bio/pharmaceutical services company, from January 2000 to April 2003. Previously, from May 1985 to January 2000, Mr. Beaudouin served in several senior legal management positions, including Vice President, General Counsel and Secretary of BC International, Inc., a development stage biotechnology company, First Senior Vice President, General Counsel and Secretary of J. Baker, Inc., a diversified retail company, and General Counsel and Secretary of GenRad, Inc., a high technology test equipment manufacturer.
Table of Contents
Sherry L. Buck, 53, was appointed Senior Vice President and Chief Financial Officer in January 2017. Previously, Ms. Buck served as the Vice President, Chief Financial Officer of Libbey Inc. since August 2012. From 1993 to 2012, Ms. Buck held several positions at Whirlpool Corporation, including Vice President, Finance/Chief Financial Officer, Global Product and Enterprise Cost Leadership; Vice President, Finance — US; Vice President, Cost Leadership; Vice President, Finance — International; and Vice President, Business Performance Management.
Dr. Michael C. Harrington, 56, was appointed Senior Vice President, Global Markets in February 2016. Dr. Harrington joined Waters Corporation in 1987 and has held several senior positions with Waters Corporation, including Vice President, Europe and Asia Pacific Operations, Senior Director of US Sales Operations, Director of US Chemistry Sales and General Manager of Phase Separations. Prior to joining Waters Corporation, Dr. Harrington held senior sales positions at Celsis, Inc.
Terrance P. Kelly, 54, was appointed Senior Vice President and President, TA Instruments in February 2016. Mr. Kelly has served as President, TA instruments since February 2005. Mr. Kelly started his career in finance and accounting at ICI in 1985. He joined DuPont in 1988. He held various sales and marketing positions with DuPont, and later TA Instruments. Mr. Kelly joined Waters Corporation in 1996, when TA Instruments was acquired.
Dr. Rohit Khanna, 59, was appointed Senior Vice President, Applied Technology in February 2016. Dr. Khanna previously served as Vice President, Worldwide Marketing and Informatics since 2002 and also held several senior positions with Waters Corporation, including Vice-President, Customer Assurance and Vice President, Data Products. Dr. Khanna joined Waters Corporation in 1986 when Dynamic Solutions, a company co-founded and managed by Dr. Khanna, was acquired.
Ian S. King, 60, was appointed Senior Vice President, Instrument Technology in February 2016. Mr. King joined Waters in 1982 and previously served as Vice President, Separations Technologies and Vice President and General Manager of Consumable Division, as well as a variety of scientific and management positions in Waters Corporation’s international subsidiaries. Prior to joining Waters Corporation, Mr. King worked at Edinburgh University as a research scientist.
Elizabeth B. Rae, 59, was appointed Senior Vice President, Global Human Resources in February 2016 and was Vice President of Human Resources since October 2005 and Vice President of Worldwide Compensation and Benefits since January 2002. Ms. Rae joined Waters Corporation in January 1996 as Director of Worldwide Compensation. Prior to joining Waters Corporation, she held senior human resources positions in retail, healthcare and financial services companies.
David A. Terricciano, 61, was appointed Senior Vice President, Global Operations in February 2016. Mr. Terricciano previously served as Vice President of Global Operations since August 2001. Prior to joining Waters Corporation, he worked as Vice President and General Manager of Operations for Perkin-Elmer Instruments. Previously, he held a variety of executive positions at Goodrich Aerospace, Honeywell Aerospace and Textron Corporation.
Table of Contents
PART II
Item 5. Market for Registrant’s Common Equity, Related Stockholder Matters and Issuer Purchases of Equity Securities
| --- | --- |
The Company’s common stock is registered under the Exchange Act, and is listed on the New York Stock Exchange under the symbol WAT. As of February 17, 2017, the Company had 100 common stockholders of record. The Company has not declared or paid any dividends on its common stock in its past three fiscal years. The Company has not made any sales of unregistered equity securities in the years ended December 31, 2016, 2015 or 2014.
Securities Authorized for Issuance under Equity Compensation Plans
Equity compensation plan information is incorporated by reference from Part III, Item 12, Security Ownership of Certain Beneficial Owners and Management and Related Stockholder Matters, of this document and should be considered an integral part of this Item 5.
Table of Contents
Stock Price Performance Graph
The following performance graph and related information shall not be deemed to be “soliciting material” or to be “filed” with the SEC, nor shall such information be incorporated by reference into any future filing under the Securities Act of 1933, as amended, or the Exchange Act, except to the extent that the Company specifically incorporates it by reference into such filing.
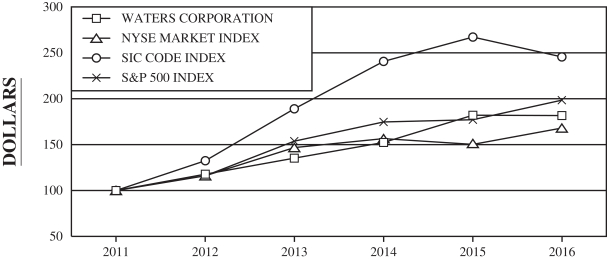
The following graph compares the cumulative total return on $100 invested as of December 31, 2011 (the last day of public trading of the Company’s common stock in fiscal year 2011) through December 31, 2016 (the last day of public trading of the common stock in fiscal year 2016) in the Company’s common stock, the NYSE Market Index, the SIC Code 3826 Index and the S&P 500 Index. The return of the indices is calculated assuming reinvestment of dividends during the period presented. The Company has not paid any dividends since its IPO. The stock price performance shown on the graph below is not necessarily indicative of future price performance.
COMPARISON OF CUMULATIVE TOTAL RETURN SINCE DECEMBER 31, 2011
AMONG WATERS CORPORATION, NYSE MARKET INDEX, SIC CODE 3826 INDEX –
LABORATORY ANALYTICAL INSTRUMENTS AND S&P 500 INDEX
| 2011 | 2012 | 2013 | 2014 | 2015 | 2016 | |||||||||||||||||||
| WATERS CORPORATION | $ | 100.00 | $ | 117.65 | $ | 135.04 | $ | 152.22 | $ | 181.74 | $ | 181.49 | ||||||||||||
| NYSE MARKET INDEX | $ | 100.00 | $ | 115.99 | $ | 146.47 | $ | 156.36 | $ | 149.97 | $ | 167.87 | ||||||||||||
| SIC CODE INDEX | $ | 100.00 | $ | 132.41 | $ | 188.94 | $ | 240.66 | $ | 267.00 | $ | 245.55 | ||||||||||||
| S&P 500 INDEX | $ | 100.00 | $ | 116.00 | $ | 153.58 | $ | 174.60 | $ | 177.01 | $ | 198.18 |
Table of Contents
Market for Registrant’s Common Equity
The quarterly range of high and low sales prices for the Company’s common stock as reported by the New York Stock Exchange is as follows:
| Price Range | ||||||||
| For the Quarter Ended | High | Low | ||||||
| April 4, 2015 | $ | 125.86 | $ | 111.77 | ||||
| July 4, 2015 | $ | 137.39 | $ | 120.79 | ||||
| October 3, 2015 | $ | 136.17 | $ | 113.98 | ||||
| December 31, 2015 | $ | 136.95 | $ | 115.21 | ||||
| April 2, 2016 | $ | 133.60 | $ | 112.00 | ||||
| July 2, 2016 | $ | 143.73 | $ | 128.90 | ||||
| October 1, 2016 | $ | 162.53 | $ | 140.76 | ||||
| December 31, 2016 | $ | 160.00 | $ | 133.35 |
Purchases of Equity Securities by the Issuer
The following table provides information about purchases by the Company during the three months ended December 31, 2016 of equity securities registered by the Company under the Exchange Act (in thousands, except per share data):
| Period | Total Number of Shares Purchased (1) | Average Price Paid per Share | Total Number of Shares Purchased as Part of Publicly Announced Programs (2) | Maximum Dollar Value of Shares that May Yet Be Purchased Under the Programs (2) | ||||||||||||
| October 2 to October 29, 2016 | 35 | $ | 140.11 | 35 | $ | 200,676 | ||||||||||
| October 30 to November 26, 2016 | 345 | $ | 138.99 | 345 | $ | 152,724 | ||||||||||
| November 27 to December 31, 2016 | 227 | $ | 136.48 | 215 | $ | 123,413 | ||||||||||
| Total | 607 | $ | 138.12 | 595 | $ | 123,413 | ||||||||||
| (1) | The Company repurchased $8 million of common stock related to the vesting of restricted stock units during 2016. |
|---|
| (2) | The Company purchased an aggregate of 2.3 million shares of its outstanding common stock in 2016 in open market transactions pursuant to a repurchase program that was announced in May 2014 (the “2014 Program”). The 2014 Program authorized the repurchase of up to $750 million of common stock in open market transactions over a three-year period. |
|---|
Table of Contents
| Item 6: Selected | Financial Data |
|---|
The following table sets forth selected historical consolidated financial and operating data for the periods indicated. The statement of operations and balance sheet data is derived from audited financial statements for the years 2016, 2015, 2014, 2013 and 2012. The Company’s financial statements as of December 31, 2016 and 2015, and for each of the three years in the period ended December 31, 2016 are included in Item 8, Financial Statements and Supplementary Data, in Part II of this Form 10-K.
| In thousands, except per share and employees data | 2016 | 2015 | 2014 | 2013 | 2012 | |||||||||||||||
| STATEMENT OF OPERATIONS DATA: | ||||||||||||||||||||
| Net sales | $ | 2,167,423 | $ | 2,042,332 | $ | 1,989,344 | $ | 1,904,218 | $ | 1,843,641 | ||||||||||
| Income from operations before income taxes | $ | 600,114 | $ | 541,919 | $ | 490,740 | $ | 490,105 | $ | 487,625 | ||||||||||
| Net income | $ | 521,503 | $ | 469,053 | $ | 431,620 | $ | 450,003 | $ | 461,443 | ||||||||||
| Net income per basic common share | $ | 6.46 | $ | 5.70 | $ | 5.12 | $ | 5.27 | $ | 5.25 | ||||||||||
| Weighted-average number of basic common shares | 80,786 | 82,336 | 84,358 | 85,426 | 87,841 | |||||||||||||||
| Net income per diluted common share | $ | 6.41 | $ | 5.65 | $ | 5.07 | $ | 5.20 | $ | 5.19 | ||||||||||
| Weighted-average number of diluted common shares and equivalents | 81,417 | 83,087 | 85,151 | 86,546 | 88,979 | |||||||||||||||
| BALANCE SHEET AND OTHER DATA: | ||||||||||||||||||||
| Cash, cash equivalents and investments | $ | 2,813,032 | $ | 2,399,263 | $ | 2,055,388 | $ | 1,803,670 | $ | 1,539,025 | ||||||||||
| Working capital, including current maturities of debt* | $ | 3,115,124 | $ | 2,649,457 | $ | 2,236,558 | $ | 2,038,100 | $ | 1,701,784 | ||||||||||
| Total assets* | $ | 4,662,059 | $ | 4,268,677 | $ | 3,874,690 | $ | 3,580,106 | $ | 3,181,597 | ||||||||||
| Long-term debt* | $ | 1,701,966 | $ | 1,493,027 | $ | 1,237,463 | $ | 1,188,162 | $ | 1,042,559 | ||||||||||
| Stockholders’ equity | $ | 2,301,949 | $ | 2,058,851 | $ | 1,894,666 | $ | 1,763,173 | $ | 1,467,357 | ||||||||||
| Employees | 6,899 | 6,594 | 6,161 | 5,965 | 5,860 |
| * | In 2015, the Company adopted new accounting guidance related to the presentation of debt issuance costs and deferred income taxes, both standards have been applied above retrospectively. Certain debt issuance costs have been reclassified from intangible assets and are presented as a direct deduction from the carrying value of the associated debt. Current deferred tax assets and liabilities have been reclassified as non-current deferred tax assets and liabilities. |
|---|
Item 7. Management’s Discussion and Analysis of Financial Condition and Results of Operations
Business and Financial Overview
The Company has two operating segments: Waters® and TA®. Waters products and services primarily consist of high performance liquid chromatography (“HPLC”), ultra performance liquid chromatography (“UPLC®” and together with HPLC, referred to as “LC”), mass spectrometry (“MS”) and chemistry consumable products and related services. TA products and services primarily consist of thermal analysis, rheometry and calorimetry instrument systems and service sales. The Company’s products are used by pharmaceutical, biochemical, industrial, nutritional safety, environmental, academic and governmental customers. These customers use the Company’s products to detect, identify, monitor and measure the chemical, physical and biological composition of materials and to predict the suitability and stability of fine chemicals, pharmaceuticals, water, polymers, metals and viscous liquids in various industrial, consumer goods and healthcare products.
Table of Contents
The Company’s operating results are as follows for the years ended December 31, 2016, 2015 and 2014 (in thousands, except per share data):
| Year Ended December 31, | % change | |||||||||||||||||||
| 2016 | 2015 | 2014 | 2016 vs. 2015 | 2015 vs. 2014 | ||||||||||||||||
| Revenues: | ||||||||||||||||||||
| Product sales | $ | 1,460,296 | $ | 1,385,256 | $ | 1,346,729 | 5 | % | 3 | % | ||||||||||
| Service sales | 707,127 | 657,076 | 642,615 | 8 | % | 2 | % | |||||||||||||
| Total net sales | 2,167,423 | 2,042,332 | 1,989,344 | 6 | % | 3 | % | |||||||||||||
| Costs and operating expenses: | ||||||||||||||||||||
| Cost of sales | 891,453 | 842,672 | 824,913 | 6 | % | 2 | % | |||||||||||||
| Selling and administrative expenses | 513,031 | 495,747 | 512,707 | 3 | % | (3 | %) | |||||||||||||
| Research and development expenses | 125,187 | 118,545 | 107,726 | 6 | % | 10 | % | |||||||||||||
| Purchased intangibles amortization | 9,889 | 10,123 | 10,634 | (2 | %) | (5 | %) | |||||||||||||
| Litigation provisions | 3,524 | 3,939 | — | (11 | %) | — | ||||||||||||||
| Acquired in-process research and development | — | 3,855 | 15,456 | (100 | %) | (75 | %) | |||||||||||||
| Operating income | 624,339 | 567,451 | 517,908 | 10 | % | 10 | % | |||||||||||||
| Operating income as a % of sales | 28.8 | % | 27.8 | % | 26.0 | % | ||||||||||||||
| Interest expense, net | (24,225 | ) | (25,532 | ) | (27,168 | ) | (5 | %) | (6 | %) | ||||||||||
| Income from operations before income taxes | 600,114 | 541,919 | 490,740 | 11 | % | 10 | % | |||||||||||||
| Provision for income taxes | 78,611 | 72,866 | 59,120 | 8 | % | 23 | % | |||||||||||||
| Net income | $ | 521,503 | $ | 469,053 | $ | 431,620 | 11 | % | 9 | % | ||||||||||
| Net income per diluted common share | $ | 6.41 | $ | 5.65 | $ | 5.07 | 13 | % | 11 | % |
In 2016, the Company’s sales increased 6% as compared to 2015. The growth was mainly driven by continued strength in our pharmaceutical market followed by growth in our industrial market, which includes sales to industrial chemical, nutritional safety and environmental customers, offset by a decline in sales to our governmental and academic customers. Instrument systems produced mid-single-digit sales growth during 2016 and our chemistry and service businesses continued to generate high-single-digit growth rates due to higher instrument utilization and a growing base of installed instrument systems. Geographically, the Company experienced positive sales growth in all major regions on a world-wide basis, led by Asia, which generated double-digit growth during 2016. This double-digit sales growth rate in Asia was primarily attributed to strong demand for the Company’s products and services in China and a favorable effect of foreign currency translation in Japan. Sales growth in 2016 in Europe and the U.S. was 4% and 1%, respectively. In 2015, the Company’s sales grew 3% as compared to 2014 as the effect of foreign currency translation significantly reduced the sales growth rate experienced by the pharmaceutical and industrial end-markets. The effect of foreign currency translation negatively impacted sales by 1% and 6% across all products and services in 2016 and 2015, respectively. Based on current foreign exchange rates, the Company expects that foreign currency translation may negatively affect sales growth in 2017. Recent acquisitions had a minimal impact on sales growth in both 2016 and 2015.
Sales to pharmaceutical customers grew 9% and 4% in 2016 and 2015, respectively. The increase in 2016 was driven by the increasing need for global access to prescription drugs and the testing of newer and more complex biologic drugs. Geographically, the growth within our pharmaceutical market was driven by double-digit growth in China and Japan, while sales growth in 2015 was driven by double-digit growth in the U.S., China and India offset by the negative effects of foreign currency translation.
Combined sales to industrial customers grew 6% and 4% in 2016 and 2015, respectively. The growth in 2016 was driven by the increasing need for food quality and food safety testing and fine chemical applications. Geographically, industrial market sales growth was highest in Europe, followed by Asia and offset by weakness
Table of Contents
in the U.S. Before the effects of foreign currency translation, the Company’s industrial customer sales in 2015 grew at a higher rate than 2016. This overall weaker demand from the Company’s industrial customers in 2016 was primarily attributed to the decline in TA instrument system sales and the overall soft demand for the Company products and services in the U.S.
Combined sales to governmental and academic customers decreased 4% and 5% in 2016 and 2015, respectively, as a result of these institutions reducing their spending on the Company’s products and the negative effects of foreign currency translation in 2015. In 2016, combined sales to governmental and academic customers grew in China and India but declined in all other regions. In 2015, combined sales to governmental and academic customers grew in the U.S. and China but declined in all other regions.
Instrument system sales increased 4% and 3% in 2016 and 2015, respectively, due to higher demand for LC and LC-MS instrument systems. This strength in demand was driven by HPLC, UPLC®, ACQUITY ArcTM, QDa® and Vion® IMS Q-TofTM instrument systems, as well as other LC-MS systems that incorporate the Company’s benchtop tandem quadrupole technologies. Recurring revenues (combined sales of chemistry consumables and services) increased 8% and 2% in 2016 and 2015, respectively, as a result of a larger installed base of customers and higher billing demand for service sales. Foreign currenc
Showing the first 8K of 76K characters. Open the full section
Item 7A. Quantitative and Qualitative Disclosures About Market Risk
The Company is a global company that operates in over 35 countries and, as a result, the Company’s net sales, cost of sales, operating expenses and balance sheet amounts are significantly impacted by fluctuations in foreign currency exchange rates. The Company is exposed to currency price risk on foreign currency exchange rate fluctuations when it translates its non-U.S. dollar foreign subsidiaries’ financial statements into U.S. dollars, and when any of the Company’s subsidiaries purchase or sell products or services in a currency other than its own currency.
The Company’s principal strategy in managing exposure to changes in foreign currency exchange rates is to naturally hedge the foreign-currency-denominated liabilities on the Company’s balance sheet against corresponding assets of the same currency, such that any changes in liabilities due to fluctuations in foreign currency exchange rates are typically offset by corresponding changes in assets.
The Company does not specifically enter into any derivatives that hedge foreign-currency-denominated assets, liabilities or commitments on its balance sheet, other than a portion of certain third-party accounts receivable and accounts payable, and the Company’s net worldwide intercompany receivables and payables, which are eliminated in consolidation. The Company periodically aggregates its net worldwide balances by currency and then enters into foreign currency exchange contracts that mature within 90 days to hedge a portion of the remaining balance to minimize some of the Company’s currency price risk exposure. The foreign currency exchange contracts are not designated for hedge accounting treatment.
Principal hedged currencies include the Euro, Japanese yen, British pound, Mexican peso and Brazilian real. At December 31, 2016, 2015 and 2014, the Company held foreign currency exchange contracts with notional amounts totaling $120 million, $116 million and $110 million, respectively.
The Company’s foreign currency exchange contracts included in the consolidated balance sheets are classified as follows (in thousands):
| December 31, 2016 | December 31, 2015 | |||||||
| Other current assets | $ | 60 | $ | 616 | ||||
| Other current liabilities | $ | 730 | $ | 402 |
Table of Contents
The following is a summary of the activity included in cost of sales in the statements of operations related to the foreign currency exchange contracts (in thousands):
| Year Ended December 31, | ||||||||||||
| 2016 | 2015 | 2014 | ||||||||||
| Realized (losses) gains on closed contracts | $ | (10,401 | ) | $ | (2,601 | ) | $ | 174 | ||||
| Unrealized (losses) gains on open contracts | (883 | ) | 742 | (1,369 | ) | |||||||
| Cumulative net pre-tax losses | $ | (11,284 | ) | $ | (1,859 | ) | $ | (1,195 | ) | |||
Assuming a hypothetical adverse change of 10% in year-end exchange rates (a strengthening of the U.S. dollar), the fair market value of the foreign currency exchange contracts outstanding as of December 31, 2016 would decrease pre-tax earnings by approximately $12 million.
The Company’s cash and cash equivalents are not subject to significant interest rate risk due to the short maturities of these instruments. The Company’s cash equivalents represent highly liquid investments, with original maturities of 90 days or less, primarily in bank deposits, U.S. treasury bill money market funds and commercial paper. As of December 31, 2016, the carrying value of the Company’s cash and cash equivalents approximated fair value.
The Company is exposed to the risk of interest rate fluctuations from the investments of cash generated from operations. Investments with maturities greater than 90 days are classified as investments, and are held primarily in U.S. treasury bills, U.S. dollar-denominated treasury bills and commercial paper, bank deposits and corporate debt securities. The Company maintains cash balances in various operating accounts in excess of federally insured limits, and in foreign subsidiary accounts in currencies other than the U.S. dollar. As of December 31, 2016 and 2015, $2,766 million out of $2,813 million and $2,346 million out of $2,399 million, respectively, of the Company’s total cash, cash equivalents and investments were held by foreign subsidiaries and may be subject to material tax effects on distribution to U.S. legal entities. In addition, $261 million out of $2,813 million and $248 million out of $2,399 million of cash, cash equivalents and investments were held in currencies other than the U.S. dollar at December 31, 2016 and 2015, respectively. As of December 31, 2016, the Company has no holdings in auction rate securities or commercial paper issued by structured investment vehicles.
Assuming a hypothetical adverse change of 10% in year-end exchange rates (a strengthening of the U.S. dollar), the fair market value of the Company’s cash, cash equivalents and investments held in currencies other than the U.S. dollar as of December 31, 2016 would decrease by approximately $26 million, of which the majority would be recorded to foreign currency translation in other comprehensive income within stockholders’ equity.
Table of Contents
Item 8. Financial Statements and Supplementary Data
Management’s Report on Internal Control Over Financial Reporting
Our management is responsible for establishing and maintaining adequate internal control over financial reporting, as such term is defined in Rules 13a-15(f) or 15d-15(f) under the Exchange Act. Because of its inherent limitations, internal control over financial reporting may not prevent or detect misstatements. Also, projections of any evaluation of effectiveness to future periods are subject to the risk that controls may become inadequate because of changes in conditions, or that the degree of compliance with the policies or procedures may deteriorate.
Under the supervision and with the participation of our management, including our chief executive officer and chief financial officer, we conducted an evaluation of the effectiveness of our internal control over financial reporting based on the framework in Internal Control — Integrated Framework 2013 issued by the Committee of Sponsoring Organizations of the Treadway Commission (COSO). Based on our evaluation under the framework in Internal Control — Integrated Framework 2013, our management, including our chief executive officer and chief financial officer, concluded that our internal control over financial reporting was effective as of December 31, 2016.
The effectiveness of our internal control over financial reporting as of December 31, 2016 has been audited by PricewaterhouseCoopers LLP, an independent registered public accounting firm, as stated in their report which is included herein.
Table of Contents
Report of Independent Registered Public Accounting Firm
To the Board of Directors and Stockholders of Waters Corporation
In our opinion, the accompanying consolidated balance sheets and the related consolidated statements of operations, comprehensive income, stockholders’ equity and cash flows present fairly, in all material respects, the financial position of Waters Corporation and its subsidiaries as of December 31, 2016 and December 31, 2015, and the results of their operations and their cash flows for each of the three years in the period ended December 31, 2016 in conformity with accounting principles generally accepted in the United States of America. In addition, in our opinion, the financial statement schedule of valuation and qualifying accounts appearing in the index appearing under Item 15(a)(2)(c) presents fairly, in all material respects, the information set forth therein when read in conjunction with the related consolidated financial statements. Also in our opinion, the Company maintained, in all material respects, effective internal control over financial reporting as of December 31, 2016, based on criteria established in Internal Control — Integrated Framework (2013) issued by the Committee of Sponsoring Organizations of the Treadway Commission (COSO). The Company’s management is responsible for these financial statements and financial statement schedule, for maintaining effective internal control over financial reporting and for its assessment of the effectiveness of internal control over financial reporting, included in the accompanying Management’s Report on Internal Control over Financial Reporting. Our responsibility is to express opinions on these financial statements, on the financial statement schedule, and on the Company’s internal control over financial reporting based on our integrated audits. We conducted our audits in accordance with the standards of the Public Company Accounting Oversight Board (United States). Those standards require that we plan and perform the audits to obtain reasonable assurance about whether the financial statements are free of material misstatement and whether effective internal control over financial reporting was maintained in all material respects. Our audits of the financial statements included examining, on a test basis, evidence supporting the amounts and disclosures in the financial statements, assessing the accounting principles used and significant estimates made by management, and evaluating the overall financial statement presentation. Our audit of internal control over financial reporting included obtaining an understanding of internal control over financial reporting, assessing the risk that a material weakness exists, and testing and evaluating the design and operating effectiveness of internal control based on the assessed risk. Our audits also included performing such other procedures as we considered necessary in the circumstances. We believe that our audits provide a reasonable basis for our opinions.
A company’s internal control over financial reporting is a process designed to provide reasonable assurance regarding the reliability of financial reporting and the preparation of financial statements for external purposes in accordance with generally accepted accounting principles. A company’s internal control over financial reporting includes those policies and procedures that (i) pertain to the maintenance of records that, in reasonable detail, accurately and fairly reflect the transactions and dispositions of the assets of the company; (ii) provide reasonable assurance that transactions are recorded as necessary to permit preparation of financial statements in accordance with generally accepted accounting principles, and that receipts and expenditures of the company are being made only in accordance with authorizations of management and directors of the company; and (iii) provide reasonable assurance regarding prevention or timely detection of unauthorized acquisition, use, or disposition of the company’s assets that could have a material effect on the financial statements.
Because of its inherent limitations, internal control over financial reporting may not prevent or detect misstatements. Also, projections of any evaluation of effectiveness to future periods are subject to the risk that controls may become inadequate because of changes in conditions, or that the degree of compliance with the policies or procedures may deteriorate.
| /s/ PricewaterhouseCoopers LLP |
| Boston, Massachusetts |
| February 24, 2017 |
Table of Contents
WATERS CORPORATION AND SUBSIDIARIES
CONSOLIDATED BALANCE SHEETS
| December 31, | ||||||||
| 2016 | 2015 | |||||||
| (In thousands, except per share data) | ||||||||
| ASSETS | ||||||||
| Current assets: | ||||||||
| Cash and cash equivalents | $ | 505,631 | $ | 487,665 | ||||
| Investments | 2,307,401 | 1,911,598 | ||||||
| Accounts receivable, net | 489,340 | 468,315 | ||||||
| Inventories | 262,682 | 263,415 | ||||||
| Other current assets | 70,391 | 82,540 | ||||||
| Total current assets | 3,635,445 | 3,213,533 | ||||||
| Property, plant and equipment, net | 337,118 | 333,355 | ||||||
| Intangible assets, net | 207,055 | 218,022 | ||||||
| Goodwill | 352,080 | 356,864 | ||||||
| Other assets | 130,361 | 146,903 | ||||||
| Total assets | $ | 4,662,059 | $ | 4,268,677 | ||||
| LIABILITIES AND STOCKHOLDERS’ EQUITY | ||||||||
| Current liabilities: | ||||||||
| Notes payable and debt | $ | 125,297 | $ | 175,309 | ||||
| Accounts payable | 67,740 | 70,573 | ||||||
| Accrued employee compensation | 57,465 | 54,653 | ||||||
| Deferred revenue and customer advances | 148,837 | 141,505 | ||||||
| Accrued income taxes | 15,244 | 14,894 | ||||||
| Accrued warranty | 13,391 | 13,349 | ||||||
| Other current liabilities | 92,347 | 93,793 | ||||||
| T |
Showing the first 8K of 183K characters. Open the full section
Item 9. Changes in and Disagreements with Accountants on Accounting and Financial Disclosure
None.
Item 9A. Controls and Procedures
Evaluation of Disclosure Controls and Procedures
The Company’s chief executive officer and chief financial officer (principal executive and principal financial officer), with the participation of management, evaluated the effectiveness of the Company’s disclosure controls and procedures (as defined in Rules 13a-15(e) and 15d-15(e) under the Exchange Act) as of the end of the period covered by this annual report on Form 10-K. Based on this evaluation, the Company’s chief executive officer and chief financial officer concluded that the Company’s disclosure controls and procedures were effective as of December 31, 2016 (1) to ensure that information required to be disclosed by the Company, including its consolidated subsidiaries, in the reports that it files or submits under the Exchange Act is accumulated and communicated to the Company’s management, including its chief executive officer and chief financial officer, to allow timely decisions regarding the required disclosure and (2) to provide reasonable assurance that information required to be disclosed by the Company in the reports that it files or submits under the Exchange Act is recorded, processed, summarized and reported within the time periods specified in the SEC’s rules and forms.
Management’s Annual Report on Internal Control Over Financial Reporting
See Management’s Report on Internal Control Over Financial Reporting in Item 8 on page 44 of this Form 10-K.
Report of the Independent Registered Public Accounting Firm
See the report of PricewaterhouseCoopers LLP in Item 8 on page 45 of this Form 10-K.
Changes in Internal Controls Over Financial Reporting
No change was identified in the Company’s internal control over financial reporting (as defined in Rules 13a-15(f) and 15d-15(f) under the Exchange Act) during the quarter ended December 31, 2016 that has materially affected, or is reasonably likely to materially affect, the Company’s internal control over financial reporting.
Item 9B. Other Information
Item 10. Directors, Executive Officers and Corporate Governance
Information regarding the Company’s directors is contained in the definitive proxy statement for the 2017 Annual Meeting of Stockholders under the headings “Election of Directors”, “Directors Meetings and Board Committees”, “Corporate Governance”, “Report of the Audit Committee of the Board of Directors” and “Compensation of Directors and Executive Officers”. Information regarding compliance with Section 16(a) of the Exchange Act is contained in the Company’s definitive proxy statement for the 2017 Annual Meeting of Stockholders under the heading “Section 16(a) Beneficial Ownership Reporting Compliance.” Information regarding the Company’s Audit Committee and Audit Committee Financial Expert is contained in the definitive proxy statement for the 2017 Annual Meeting of Stockholders under the headings “Report of the Audit Committee of the Board of Directors” and “Directors Meetings and Board Committees”. Such information is incorporated herein by reference. Information regarding the Company’s executive officers is contained in Part I of this Form 10-K.
The Company has adopted a Code of Business Conduct and Ethics (the “Code”) that applies to all of the Company’s employees (including its executive officers) and directors and that is in compliance with Item 406 of Regulation S-K. The Code has been distributed to all employees of the Company. In addition, the Code is available on the Company’s website, www.waters.com, under the caption “Governance”. The Company intends to satisfy the disclosure requirement regarding any amendment to, or waiver of a provision of, the Code applicable to any executive officer or director by posting such information on its website. The Company shall also provide to any person without charge, upon request, a copy of the Code. Any such request must be made in writing to the Secretary of the Company, c/o Waters Corporation, 34 Maple Street, Milford, MA 01757.
The Company’s corporate governance guidelines and the charters of the audit committee, compensation committee, and nominating and corporate governance committee of the Board of Directors are available on the Company’s website, www.waters.com, under the caption “Governance”. The Company shall provide to any person without charge, upon request, a copy of any of the foregoing materials. Any such request must be made in writing to the Secretary of the Company, c/o Waters Corporation, 34 Maple Street, Milford, MA 01757.
The Company has not made any material changes to the procedures by which security holders may recommend nominees to the Company’s Board of Directors.
Item 11. Executive Compensation
This information is contained in the Company’s definitive proxy statement for the 2017 Annual Meeting of Stockholders under the headings “Compensation of Directors and Executive Officers”, “Compensation Committee Interlocks and Insider Participation” and “Compensation Committee Report”. Such information is incorporated herein by reference.
Item 12. Security Ownership of Certain Beneficial Owners and Management and Related Stockholder Matters
| --- | --- |
Except for the Equity Compensation Plan information set forth below, this information is contained in the Company’s definitive proxy statement for the 2017 Annual Meeting of Stockholders under the heading “Security Ownership of Certain Beneficial Owners and Management”. Such information is incorporated herein by reference.
Table of Contents
Equity Compensation Plan Information
The following table provides information as of December 31, 2016 about the Company’s common stock that may be issued upon the exercise of options, warrants, and rights under its existing equity compensation plans (in thousands):
| A | B | C | ||||||||||
| Number of Securities to be Issued Upon Exercise of Outstanding Options, Warrants and Rights | Weighted-Average Exercise Price of Outstanding Options, Warrants and Rights | Number of Securities Remaining Available for Future Issuance Under Equity Compensation Plans (excluding securities reflected in column (A)) | ||||||||||
| Equity compensation plans approved by security holders | 2,697 | $ | 106.55 | 3,840 | ||||||||
| Equity compensation plans not approved by security holders | — | — | — | |||||||||
| Total | 2,697 | $ | 106.55 | 3,840 | ||||||||
See Note 12, Stock-Based Compensation, in the Notes to Consolidated Financial Statements for a description of the material features of the Company’s equity compensation plans.
Item 13. Certain Relationships and Related Transactions and Director Independence
This information is contained in the Company’s definitive proxy statement for the 2017 Annual Meeting of Stockholders under the headings “Directors Meetings and Board Committees”, “Corporate Governance” and “Compensation of Directors and Executive Officers”. Such information is incorporated herein by reference.
Item 14. Principal Accountant Fees and Services
This information is contained in the Company’s definitive proxy statement for the 2017 Annual Meeting of Stockholders under the headings “Ratification of Selection of Independent Registered Public Accounting Firm” and “Report of the Audit Committee of the Board of Directors”. Such information is incorporated herein by reference.
Table of Contents
PART IV
Item 15. Exhibits, Financial Statement Schedules
(a) Documents filed as part of this report:
| (1) | Financial Statements: |
|---|
The consolidated financial statements of the Company and its subsidiaries are filed as part of this Form 10-K and are set forth on pages 46 to 89. The report of PricewaterhouseCoopers LLP, an independent registered public accounting firm, dated February 24, 2017, is set forth on page 39 of this Form 10-K.
| (2) | Financial Statement Schedule: |
|---|
See (c) below.
| (3) | Exhibits: |
|---|
| Exhibit Number | Description of Document | |
| 3.1 | Second Amended and Restated Certificate of Incorporation of Waters Corporation.(1) | |
| 3.2 | Certificate of Amendment of Second Amended and Restated Certificate of Incorporation of Waters Corporation, dated as of May 12, 1999.(3) | |
| 3.3 | Certificate of Amendment of Second Amended and Restated Certificate of Incorporation of Waters Corporation, dated as of July 27, 2000.(4) | |
| 3.4 | Certificate of Amendment of Second Amended and Restated Certificate of Incorporation of Waters Corporation, dated as of May 25, 2001.(5) | |
| 3.5 | Amended and Restated Bylaws of Waters Corporation, dated as of October 16, 2013.(20) | |
| 10.1 | Waters Corporation Retirement Plan.(2)(*) | |
| 10.2 | Waters Corporation 2003 Equity Incentive Plan.(6)(*) | |
| 10.3 | First Amendment to the Waters Corporation 2003 Equity Incentive Plan.(7)(*) | |
| 10.4 | Form of Director Stock Option Agreement under the Waters Corporation 2003 Equity Incentive Plan, as amended.(8)(*) | |
| 10.5 | Form of Director Restricted Stock Agreement under the Waters Corporation 2003 Equity Incentive Plan, as amended.(8)(*) | |
| 10.6 | Form of Executive Officer Stock Option Agreement under the Waters Corporation 2003 Equity Incentive Plan, as amended.(8)(*) | |
| 10.7 | Second Amendment to the Waters Corporation 2003 Equity Incentive Plan.(9)(*) | |
| 10.8 | Third Amendment to the Waters Corporation 2003 Equity Incentive Plan.(10)(*) | |
| 10.9 | Amended and Restated Waters 401(k) Restoration Plan, effective January 1, 2008.(11)(*) | |
| 10.10 | Change of Control/Severance Agreement, dated as of February 27, 2008, between Waters Corporation and Mark T. Beaudouin.(12)(*) | |
| 10.11 | Change of Control/Severance Agreement, dated as of February 27, 2008, between Waters Corporation and Arthur G. Caputo.(12)(*) | |
| 10.12 | Change of Control/Severance Agreement, dated as of February 27, 2008, between Waters Corporation and Elizabeth B. Rae.(12)(*) |
Table of Contents
| Exhibit Number | Description of Document | |
| 10.13 | Change of Control/Severance Agreement, dated as of February 27, 2008, between Waters Corporation and Eugene G. Cassis.(23)(*) | |
| 10.14 | Amended and Restated Waters Retirement Restoration Plan, effective January 1, 2008.(13)(*) | |
| 10.15 | Amended and Restated Waters Corporation 1996 Non-Employee Director Deferred Compensation Plan, Effective January 1, 2008.(13)(*) | |
| 10.16 | 2014 Waters Corporation Management Incentive Plan.(23)(*) | |
| 10.17 | Waters Corporation 2009 Employee Stock Purchase Plan.(14)(*) | |
| 10.18 | Note Purchase Agreement, dated as of February 1, 2010, between Waters Corporation and the purchases named therein.(15) | |
| 10.19 | First Amendment to the Note Purchase Agreement, dated as of February 1, 2010.(16) | |
| 10.20 | Note Purchase Agreement, dated March 15, 2011, between Waters Corporation and the purchases named therein.(16) | |
| 10.21 | Waters Corporation 2012 Equity Incentive Plan.(17)(*) | |
| 10.22 | Form of Waters 2012 Stock Option Agreement - Executive Officers.(18)(*) | |
| 10.23 | Form of Waters 2012 Stock Option Agreement - Directors.(18)(*) | |
| 10.24 | Form of Waters 2012 Restricted Stock Agreement - Directors.(18)(*) | |
| 10.25 | Credit Agreement, dated as of June 25, 2013, among Waters Corporation, JPMorgan Chase Bank, N.A., JP Morgan Europe Limited and other Lenders party thereto.(19) | |
| 10.26 | Form of Waters 2012 Restricted Stock Unit Agreement for Executive Officers - Five Year Vesting.(21)(*) | |
| 10.27 | Form of Waters 2012 Restricted Stock Unit Agreement for Executive Officers - One Year Vesting.(21)(*) | |
| 10.28 | Note Purchase Agreement, dated June 30, 2014, between Waters Corporation and the purchases named therein.(22) | |
| 10.29 | Change of Control/Severance Agreement, dated as of April 1, 2015, between Waters Corporation and Michael F. Silveira.(24)(*) | |
| 10.30 | Credit Agreement, dated as of April 23, 2015, among Waters Corporation, JPMorgan Chase Bank, N.A., JP Morgan Europe Limited and other Lenders party thereto.(24) | |
| 10.31 | President and Chief Executive Employment Agreement.(25)(*) | |
| 10.32 | Change of Control/Severance Agreement, dated as of September 8, 2015, between Waters Corporation and Christopher J. O’Connell.(25)(*) | |
| 10.33 | Note Purchase Agreement, dated as of May 12, 2016, between Waters Corporation and the purchasers named therein.(26) | |
| 10.34 | Form of Waters 2012 Performance Stock Unit Award Agreement.(27)(*) | |
| 10.35 | Senior Vice President and Chief Financial Officer Employment Agreement.(*) | |
| 10.36 | Change of Control/Severance Agreement, dated as of January 9, 2017, between Waters Corporation and Sherry L. Buck.(*) |
Table of Contents
| Exhibit Number | Description of Document | |
| 21.1 | Subsidiaries of Waters Corporation. | |
| 23.1 | Consent of PricewaterhouseCoopers LLP, an independent registered public accounting firm. | |
| 31.1 | Chief Executive Officer Certification Pursuant to Section 302 of the Sarbanes-Oxley Act of 2002. | |
| 31.2 | Chief Financial Officer Certification Pursuant to Section 302 of the Sarbanes-Oxley Act of 2002. | |
| 32.1 | Chief Executive Officer Certification Pursuant to 18 U.S.C. Section 1350, as Adopted Pursuant to Section 906 of the Sarbanes-Oxley Act of 2002.(**) | |
| 32.2 | Chief Financial Officer Certification Pursuant to 18 U.S.C. Section 1350, as Adopted Pursuant to Section 906 of the Sarbanes-Oxley Act of 2002.(**) | |
| 101 | The following materials from Waters Corporation’s Annual Report on Form 10-K for the year ended December 31, 2016, formatted in XBRL (Extensible Business Reporting Language): (i) the Consolidated Balance Sheets, (ii) the Consolidated Statements of Operations, (iii) the Consolidated Statements of Comprehensive Income (iv) the Consolidated Statements of Cash Flows, (v) the Consolidated Statements of Stockholders’ Equity and (vi) Notes to Consolidated Financial Statements. |
| (1) | Incorporated by reference to the Registrant’s Report on Form 10-K dated March 29, 1996 (File No. 001-14010). |
|---|
| (2) | Incorporated by reference to the Registrant’s Registration Statement on Form S-1 (File No. 333-96934). |
|---|
| (3) | Incorporated by reference to the Registrant’s Report on Form 10-Q dated August 11, 1999 (File No. 001-14010). |
|---|
| (4) | Incorporated by reference to the Registrant’s Report on Form 10-Q dated August 8, 2000 (File No. 001-14010). |
|---|
| (5) | Incorporated by reference to the Registrant’s Report on Form 10-K dated March 28, 2002 (File No. 001-14010). |
|---|
| (6) | Incorporated by reference to the Registrant’s Report on Form S-8 dated November 20, 2003 (File No. 333-110613). |
|---|
| (7) | Incorporated by reference to the Registrant’s Report on Form 10-K dated March 12, 2004 (File No. 001-14010). |
|---|
| (8) | Incorporated by reference to the Registrant’s Report on Form 10-Q dated November 10, 2004 (File No. 001-14010). |
|---|
| (9) | Incorporated by reference to the Registrant’s Report on Form 10-Q dated August 5, 2005 (File No. 001-14010). |
|---|
| (10) | Incorporated by reference to the Registrant’s Report on Form 10-K dated March 1, 2007 (File No. 001-14010). |
|---|
| (11) | Incorporated by reference to the Registrant’s Report on Form 10-Q dated November 2, 2007 (File No. 001-14010). |
|---|
| (12) | Incorporated by reference to the Registrant’s Report on Form 10-K dated February 29, 2008 (File No. 001-14010). |
|---|
| (13) | Incorporated by reference to the Registrant’s Report on Form 10-K dated February 27, 2009 (File No. 001-14010). |
|---|
Table of Contents
| (14) | Incorporated by reference to the Registrant’s Report on Form S-8 dated July 10, 2009 (File No. 333-160507). |
|---|
| (15) | Incorporated by reference to the Registrant’s Report on Form 10-K dated February 26, 2010 (File No. 001-14010). |
|---|
| (16) | Incorporated by reference to the Registrant’s Report on Form 10-Q dated May 6, 2011 (File No. 001-14010). |
|---|
| (17) | Incorporated by reference to the Registrant’s Report on Form S-8 dated September 5, 2012 (File No. 333-183721). |
|---|
| (18) | Incorporated by reference to the Registrant’s Report on Form 8-K dated December 11, 2012 (File No. 001-14010). |
|---|
| (19) | Incorporated by reference to the Registrant’s Report on Form 10-Q dated August 1, 2013 (File No. 001-14010). |
|---|
| (20) | Incorporated by reference to the Registrant’s Report on Form 10-Q dated November 1, 2013 (File No. 001-14010). |
|---|
| (21) | Incorporated by reference to the Registrant’s Report on Form 8-K dated December 11, 2013 (File No. 001-14010). |
|---|
| (22) | Incorporated by reference to the Registrant’s Report on Form 10-Q dated August 1, 2014 (File No. 001-14010). |
|---|
| (23) | Incorporated by reference to the Registrant’s Report on Form 10-K dated February 27, 2015 (File No. 001-14010). |
|---|
| (24) | Incorporated by reference to the Registrant’s Report on Form 10-Q dated May 8, 2015 (File No. 001-14010). |
|---|
| (25) | Incorporated by reference to the Registrant’s Report on Form 10-Q dated August 7, 2015 (File No. 001-14010). |
|---|
| (26) | Incorporated by reference to the Registrant’s Report on Form 10-Q dated August 5, 2016 (File No. 001-14010). |
|---|
| (27) | Incorporated by reference to the Registrant’s Report on Form 8-K dated December 15, 2016 (File No. 001-14010). |
|---|
| (*) | Management contract or compensatory plan required to be filed as an Exhibit to this Form 10-K. |
|---|
| (**) | This exhibit shall not be deemed “filed” for purposes of Section 18 of the Exchange Act, or otherwise subject to the liability of that section, nor shall it be deemed incorporated by reference into any filing under the Securities Act of 1933, as amended, or the Exchange Act, whether made before or after the date hereof and irrespective of any general incorporation language in any filing, except to the extent the Company specifically incorporates it by reference. |
|---|
| (b) | See Item 15 (a) (3) above. |
|---|
| (c) | Financial Statement Schedule: |
|---|
Table of Contents
The following additional financial statement schedule should be considered in conjunction with the consolidated financial statements. All other schedules have been omitted because the required information is either not applicable or not sufficiently material to require submission of the schedule.
WATERS CORPORATION AND SUBSIDIARIES
SCHEDULE II - VALUATION AND QUALIFYING ACCOUNTS
For each of the three years in the period ended December 31, 2016
| Balance at Beginning of Period | Charged to Provision for Income Taxes* | Other** | Balance at End of Period | |||||||||||||
| Valuation allowance for deferred tax assets: | ||||||||||||||||
| 2016 | $ | 68,595 | $ | (5,473 | ) | $ | (1,897 | ) | $ | 61,225 | ||||||
| 2015 | $ | 82,550 | $ | 1,363 | $ | (15,318 | ) | $ | 68,595 | |||||||
| 2014 | $ | 94,952 | $ | 1,505 | $ | (13,907 | ) | $ | 82,550 |
| * | These amounts have been recorded as part of the income statement provision for income taxes. The income statement effects of these amounts have largely been offset by amounts related to changes in other deferred tax balance sheet accounts. |
|---|
| ** | The change in the valuation allowance during the year ended December 31, 2016 is primarily due to the effect of foreign currency translation on a valuation allowance related to a net operating loss carryforward and the release of a valuation allowance related to a foreign tax credit carryforward due to expiration. The change in the valuation allowance during the year ended December 31, 2015 is primarily due to the effect of foreign currency translation on a valuation allowance related to a net operating loss carryforward. |
|---|
Item 16. Form 10-K Summary
The optional summary in Item 16 has not been included in this Form 10-K.
Table of Contents
SIGNATURES
Pursuant to the requirements of Section 13 or 15(d) of the Securities Exchange Act of 1934, the registrant has duly caused this report to be signed on its behalf by the undersigned, thereunto duly authorized.
| WATERS CORPORATION |
| /S/ SHERRY L. BUCK |
| Sherry L. Buck |
| Senior Vice President and |
| Chief Financial Officer |
Date: February 24, 2017
Pursuant to the requirements of the Securities Exchange Act of 1934, this report has been signed by the following persons on behalf of the registrant and in the capacities indicated on February 24, 2017.
| /S/ CHRISTOPHER J. O’CONNELL | President and Chief Executive Officer | |
| Christopher J. O’Connell | (principal executive officer) | |
| /S/ SHERRY L. BUCK | Senior Vice President and Chief Financial Officer | |
| Sherry L. Buck | (principal financial officer) (principal accounting officer) | |
| /S/ DOUGLAS A. BERTHIAUME | Chairman of the Board of Directors | |
| Douglas A. Berthiaume | ||
| /S/ JOSHUA BEKENSTEIN | Director | |
| Joshua Bekenstein | ||
| /S/ DR. MICHAEL J. BERENDT | Director | |
| Dr. Michael J. Berendt | ||
| /S/ EDWARD CONARD | Director | |
| Edward Conard | ||
| /S/ DR. LAURIE H. GLIMCHER | Director | |
| Dr. Laurie H. Glimcher | ||
| /S/ CHRISTOPHER A. KUEBLER | Director | |
| Christopher A. Kuebler | ||
| /S/ WILLIAM J. MILLER | Director | |
| William J. Miller | ||
| /S/ JOANN A. REED | Director | |
| JoAnn A. Reed | ||
| /S/ THOMAS P. SALICE | Director | |
| Thomas P. Salice |