 filings.tools
Waste Management (WM) 10-K risk factor changes: FY2018 vs FY2017
The 2018-12-31 10-K against the 2017-12-31 one, compared heading by heading and sentence by sentence. One of these filings carries no fiscal year tag, so its year is the calendar year of the period end.
Item 1A51 rewritten27 added10 removed273 unchanged
All filing items1,063 rewritten523 added630 removed2,125 unchanged
Summary
counted, not written
- Item 1A headings could not be compared: only 0 carried over between the two years, which usually means one filing was read wrongly, so none is reported as new or removed.
- Sentence by sentence, 523 added, 630 removed, 1,063 rewritten and 2,125 unchanged across 13 items that differ.
Sentences by item
22 items, with every count and a link to each item that changed
| Item | Added | Removed | Rewritten | Unchanged |
|---|---|---|---|---|
| Item 1A. Risk Factors. | 27 | 10 | 51 | 273 |
| Item 7. Management’s Discussion and Analysis of Financial Condition and Results of Operations. | 174 | 242 | 263 | 311 |
| Item 7A. Quantitative and Qualitative Disclosures about Market Risk. | 0 | 0 | 6 | 17 |
| Item 1. Business. | 36 | 30 | 66 | 202 |
| Item 3. Legal Proceedings. | 0 | 0 | 0 | 1 |
| Cover and table of contents | 1 | 1 | 27 | 59 |
| Item 1B. Unresolved Staff Comments. | 0 | 0 | 0 | 1 |
| Item 2. Properties. | 1 | 1 | 7 | 10 |
| Item 4. Mine Safety Disclosures. | 0 | 0 | 0 | 2 |
| Item 5. Market for Registrant’s Common Equity, Related Stockholder Matters and Issuer Purchases of Equity Securities. | 17 | 33 | 5 | 16 |
| Item 6. Selected Financial Data. | 2 | 0 | 12 | 11 |
| Item 8. Financial Statements and Supplementary Data. | 264 | 267 | 569 | 1,131 |
| Item 9. Changes in and Disagreements with Accountants on Accounting and Financial Disclosure. | 0 | 0 | 0 | 1 |
| Item 9A. Controls and Procedures. | 0 | 0 | 5 | 15 |
| Item 9B. Other Information. | 0 | 0 | 0 | 2 |
| Item 10. Directors, Executive Officers and Corporate Governance. | 0 | 0 | 1 | 3 |
| Item 11. Executive Compensation. | 0 | 0 | 0 | 1 |
| Item 12. Security Ownership of Certain Beneficial Owners and Management and Related Stockholder Matters. | 0 | 0 | 0 | 1 |
| Item 13. Certain Relationships and Related Transactions, and Director Independence. | 0 | 0 | 0 | 1 |
| Item 14. Principal Accounting Fees and Services. | 0 | 0 | 0 | 2 |
| Item 15. Exhibits, Financial Statement Schedules. | 1 | 12 | 39 | 30 |
| Item 16. Form 10-K Summary. | 0 | 34 | 12 | 35 |
Underlined words on a shaded ground are new in FY2018; struck-through words were in FY2017. Sentences that are wholly new or wholly gone are labelled rather than marked.
Item 1A. Risk Factors.
51 rewritten, 27 added, 10 removed, 273 unchanged
Outlined below are some of the risks that we believe could affect our business and financial statements for [removed: 2018] [added: 2019] and beyond and that could cause actual results to be materially different from those that may be set forth in forward-looking statements made by the Company.
[removed: In North America, the] [added: The] industry [removed: consists primarily of three national waste management companies and regional and local companies of varying sizes and financial resources, including] [added: also includes] companies that specialize in certain discrete areas of waste management, operators of alternative disposal [removed: facilities and] [added: facilities,] companies that seek to use parts of the waste stream as feedstock for renewable energy and other [removed: by-products.][added: by-products, and waste brokers that rely upon haulers in local markets to address customer needs.]
We [added: principally] compete with [removed: these companies as well as with] [added: large national waste management companies,] counties and municipalities that maintain their own waste collection and disposal operations and [removed: waste brokers that rely upon haulers in] [added: regional and] local [removed: markets to address customer needs.][added: companies of varying sizes and financial resources.]
[removed: These counties] [added: Counties] and municipalities may have financial competitive advantages because tax revenues are available to them and tax-exempt financing is more readily available to them.
See Item [removed: 7.][added: 1.]
[removed: Management’s Discussion and Analysis of Financial Condition and Results of Operations — Overview] [added: Business] for more information on our business strategy.
| | · | | We may not be able to maintain cost savings achieved through [removed: restructuring] [added: optimization] efforts. |
In addition to the risks set forth above, implementation of our business strategy could also be affected by [removed: a number of] factors beyond our control, such as increased competition, legal developments, government regulation, general economic conditions, increased operating costs or [removed: expenses] [added: expenses, subcontractor costs] and [added: availability and] changes in industry trends.
[removed: A large number of] [added: Many] complex laws, rules, orders and interpretations govern environmental protection, health, safety, land use, zoning, transportation and related matters.
We establish accruals for these estimated costs, but we could underestimate such accruals because of the types of waste collected and manner in which it is transported and disposed of, including actions taken in the past by companies we have acquired or third-party landfill [removed: operators,] [added: operators or due to new information about waste types previously collected,] among other reasons.
[added: The] permits and approvals are often difficult, time consuming and costly to obtain and could contain conditions that limit our operations.
[removed: We cannot predict what impact the current administration will] have on the political and regulatory environment in the U.S., the timing of any such changes, or the impact of any such changes on our business.
Our revenues, earnings and cash flows will fluctuate based on changes in commodity prices, and commodity prices for recyclable materials are particularly susceptible to volatility based on regulations [added: and tariffs] that affect our ability to export products.
[removed: The majority] [added: Most] of the recyclables that we process for sale are paper fibers, including old corrugated cardboard and old newsprint, and a significant portion of the fiber that we market [removed: is] [added: has been] shipped to export markets across the globe, particularly China.
In 2017, the Chinese government announced a ban on certain materials, including mixed waste paper and mixed plastics, effective January 1, 2018, as well as extremely restrictive quality requirements effective March 1, 2018 that [removed: will be] [added: have been] difficult for the industry to achieve.
The use of restrictions on import licenses to restrict flow into China [added: continued in 2018 and] is expected to continue in [removed: 2018.][added: 2019.]
The fluctuations in the market prices or demand for these commodities can affect our operating income and cash flows [added: negatively, as we experienced in 2018 or] positively, as we [added: experienced in 2017 and 2016.]
The increase in market prices in 2017 and 2016 for [added: recycling] commodities resulted in increases in revenue of $237 million and $51 million, respectively.
The decline in market prices in [removed: 2015] [added: 2018] for [added: recycling] commodities resulted in a decrease in revenue of [removed: $138] [added: $273] million.
If the Chinese government’s [removed: regulations, or other similar] regulations [removed: or initiatives, such as increased container weight tracking] and [removed: port fees] [added: tariffs] or [removed: restrictions and] [added: initiatives or other similar regulations,] tariffs [removed: on exporting,] [added: or initiatives] result in [added: further] reduced demand or increased operating costs, [removed: such regulations, initiatives, restrictions and tariffs could have a material adverse effect on] the profitability of our recycling [removed: operations.][added: operations may decline.]
Changes in regulations applicable to oil and gas [removed: drilling and] [added: exploration,] production [added: and disposal] could adversely affect our EES organization.
[removed: EES organization demand] [added: Demand for these services] may [removed: also] be adversely affected if drilling activity slows due to [added: regulation and] industry conditions beyond our control, in addition to changes in oil and gas prices.
There [added: also] remains heightened attention from the public, some states and the EPA to the alleged potential for hydraulic fracturing [added: that occurs during drilling] to impact drinking water supplies.
There is [removed: also] heightened federal regulatory focus on emissions of methane that occur during drilling and [removed: transportation of natural gas with regulations promulgated in 2012 and 2015] [added: transportation,] as well as state attention to protective disposal of drilling residuals.
[removed: Increased regulation of oil and gas exploration and production and] [added: Additionally, any] new [removed: rules] [added: regulations] regarding the treatment and disposal of wastes associated with exploration and production [removed: operations] [added: operations, including through the use of injection wells,] could increase our costs to provide oilfield services and reduce our margins and revenue from such services.
Increasing customer preference for alternatives to landfill disposal [added: and bans on certain types of waste] could reduce our landfill volumes and cause our revenues and operating results to decline.
Under current law, we could also be held liable for damage caused by conditions that existed before we acquired the assets or operations [removed: involved.][added: involved and for conditions resulting from waste types or compounds previously considered non-hazardous but later determined to present possible threat to public health or the environment.]
[removed: This risk is] [added: The risks] of [added: successor liability and emerging contaminants are of] particular concern as we execute our growth strategy, partially though acquisitions, because we may be unsuccessful in identifying and assessing potential liabilities during our due diligence investigations.
Further, the counterparties in such transactions may be unable to perform their [removed: indemnification obligations owed to us.]
A weak economy generally results in decreased consumer spending and decreases in volumes of waste generated, which [removed: decreases our revenues.][added: negatively impacts the ability to grow through new business or service upgrades, and may result in customer turnover and reduction in customers’ waste service needs.]
[removed: A] [added: Additionally, a] weak market for consumer goods can significantly decrease demand by paper mills for recycled corrugated cardboard used in packaging; such decrease in demand can negatively impact commodity prices and our operating income and cash flows.
Consumer uncertainty and the loss of consumer confidence may [removed: limit] [added: also reduce] the number [removed: or amount] [added: and variety] of services requested by customers.
[removed: Economic] [added: A decrease in waste volumes generated results in an increase in competitive pricing pressure, and such economic] conditions may also [removed: limit] [added: interfere with] our ability to implement our pricing strategy.
[removed: For example, many] [added: Many] of our contracts have price adjustment provisions that are tied to an index such as the Consumer Price Index, and our costs may increase [removed: in excess of] [added: more than] the increase, if any, in the Consumer Price Index.
As of December 31, [removed: 2017,] [added: 2018,] we had [removed: $831] [added: $705] million of tax-exempt bonds with term interest rate periods that expire within the next 12 months and [removed: $328] [added: $513] million of variable-rate tax-exempt bonds with interest rates reset on either a daily or a weekly [removed: basis through a remarketing process, which is prior to their scheduled maturities.][added: basis.]
Additionally, if fuel prices increase, our direct operating expenses increase and many of our vendors raise their prices [removed: as a means] to offset their own rising costs.
[removed: We use computers in substantially] [added: Substantially] all aspects of our business [removed: operations.][added: operations rely on digital technology.]
We [removed: also] use [added: computers,] mobile devices, social networking and other online [removed: activities] [added: platforms] to connect with our employees and our customers.
The theft, destruction, loss, misappropriation, or release of sensitive and/or confidential information or intellectual property, or interference with our information technology systems or the technology systems of third parties on which we rely, could result in business disruption, [added: direct financial loss,] negative publicity, brand damage, violation of privacy laws, loss of customers, potential litigation and liability and competitive disadvantage.
In the event of our withdrawal from a Multiemployer Pension Plan, we may incur expenses associated with our obligations for unfunded [removed: vested benefits at the time of the withdrawal.]
We cannot predict what impact the current administration will
Many other markets, both domestic and foreign, have tightened their quality expectations as well.
In addition, other countries have limited or restricted the import of certain recyclables.
The current U.S. presidential administration has made substantial changes to foreign trade policy and imposed increases in tariffs on international trade.
In response, China has imposed new tariffs on the import of recyclable commodities, including wastepaper, plastics and metals.
Our EES organization provides specialized environmental management and disposal services for fluids used and wastes generated by customers engaged in oil and gas exploration and production, and these disposal services include the use of underground injection wells.
Increased regulation of oil and gas exploration and production, including GHG emissions or hydraulic fracturing, could make it more difficult or cost-prohibitive for our EES customers to continue operations, adversely affecting our business.
Conversely, any loosening of regulations regarding how such wastes are handled or disposed of could adversely impact demand for our EES services.
Changes to the regulatory framework related to renewable fuel standards could affect our financial performance in that sector as a renewable fuel producer.
The Company acts as a renewable fuel producer in the RFS program enacted by Congress under the Energy Policy Act and Energy Independence and Security Act.
Oil refiners and importers are required through the RFS program to blend specified volumes of renewable transportation fuels with gasoline or buy credits, referred to as RINs, from renewable fuel producers.
The Company has invested, and continues to invest, in facilities to capture and treat renewable natural gas from the Company’s landfills so that we can participate in the program.
The value of the RINs associated with our landfill gas is set through a market established by the program.
Changes in the RFS market or the structure of the RFS program could reduce the value of landfill gas RINs and negatively impact the financial performance of the facilities constructed to capture and treat the gas.
Additionally, with a heightened awareness of the global problems of plastic waste in the environment, an increasing number of cities across the country have passed ordinances banning certain types of plastics from sale or use.
Bans on single use plastic bags, straws, and polystyrene food containers have been passed in over 350 cities, and a ban on single use plastic bags has been implemented in the State of California.
These bans have increased pressure by manufacturers on our recycling facilities to accept a broader array of materials in curbside recycling programs to alleviate public pressure to ban the sale of those materials.
However, there are currently no viable end markets for recycling these materials and
inclusion of such materials in our recycling stream can increase contamination of the recycling stream and negatively affect the results of our recycling operations.
indemnification obligations owed to us.
This is partially due to our relatively high fixed-cost structure, which is difficult to quickly adjust to match shifting volume levels and vendor costs, which may not correlate with the Consumer Price Index or the waste industry.
We are regularly the target of attempted cyber intrusions, and we must commit substantial resources to continuously monitor and further develop our networks and infrastructure to prevent, detect, and address the risk of unauthorized access, misuse, computer viruses and other events.
Our preventative measures and incident response efforts may not be effective in all cases.
Certain new technologies, such as use of autonomous vehicles, remote-controlled equipment and virtual reality, present new and significant cybersecurity safety risks that must be analyzed and addressed before implementation.
vested benefits at the time of the withdrawal.
As of December 31, 2018, we had C$15 million, or $11 million, of Canadian borrowings outstanding borrowings under this facility.
expanded the EPA’s federal air permitting authority to include the six GHGs.
The industry’s national and regional competitors are often significant competitors in local markets.
The
There is uncertainty about the industry’s ability to adapt to the Chinese government’s regulations.
experienced in 2017 and 2016, or negatively, as we experienced in 2015.
Changes in laws or government regulations regarding GHG emissions from oil and gas operations and/or hydraulic fracturing could increase our customers’ costs of doing business and reduce oil and gas exploration and production by customers.
Additionally, we could be liable if we arrange for the transportation, disposal or treatment of hazardous substances that cause environmental contamination, or if a predecessor owner made such arrangements and, under applicable law, we are treated as a successor to the prior owner.
In addition, we have a relatively high fixed-cost structure, which is difficult to quickly adjust to match shifting volume levels.
Additionally, a prolonged economic downturn in China could significantly impact prices for post-consumer fiber and metals processed by our recycling operations.
Additionally, while we have implemented measures to prevent security breaches and cyber incidents, our preventative measures and incident response efforts may not be entirely effective.
elevated landfill temperatures and increased production of leachate, landfill gas and odors.
An excerpt. Shown here: 40 of 51 rewritten, all 27 added and all 10 removed. The counts are complete. For every sentence, read Item 1A. Risk Factors. in the FY2018 filing and the FY2017 filing.
Item 7. Management’s Discussion and Analysis of Financial Condition and Results of Operations.
263 rewritten, 174 added, 242 removed, 311 unchanged
This section includes a discussion of our results of operations for the three years ended December 31, [removed: 2017.][added: 2018.]
Key items of our [removed: 2017] [added: 2018] financial results include:
| | · | | Revenues of [removed: $14,485] [added: $14,914] million for [removed: 2017] [added: 2018] compared with [removed: $13,609] [added: $14,485] million in [removed: 2016,] [added: 2017,] an increase of [removed: $876] [added: $429] million, or [removed: 6.4%.] [added: 3.0%.] This increase is primarily attributable to (i) [added: higher volumes due to improving market conditions; (ii) increased] yield [removed: and volume growth] in our collection and disposal [removed: lines of business, which contributed $536 million of revenues; (ii) higher] [added: business and (iii) increased recycling brokerage volumes, partially offset by (i) lower] market prices for recycling [removed: commodities, which contributed $237 million of revenue growth in our recycling line of business] [added: commodities] and [removed: (iii) increased fuel surcharge] [added: (ii) fluctuations in foreign currency] and [removed: mandated fees of $73 million;] [added: other;] |
| | · | | Income from operations of [removed: $2,636] [added: $2,789] million, or [removed: 18.2%] [added: 18.7%] of revenues, in [removed: 2017] [added: 2018] compared with [removed: $2,296] [added: $2,636] million, or [removed: 16.9%] [added: 18.2%] of revenues, in [removed: 2016,] [added: 2017,] an increase of [removed: $340] [added: $153] million; |
[removed: | | · | | The recognition of pre-tax] [added: During the year ended December 31, 2016, we recognized net] charges [removed: aggregating to $151] [added: of $112] million, primarily related to (i) [removed: a $43] [added: $44] million [removed: impairment charge due to a loss] of [removed: expected volumes for a landfill; (ii) a $42 million charge] [added: charges] to adjust our subsidiary’s estimated potential share of an environmental remediation liability and related costs for a closed site in Harris County, [removed: Texas; (iii) $41] [added: Texas, as discussed in Note 10 to the Consolidated Financial Statements; (ii) a $43] million [removed: of impairment charges related] [added: charge] to [removed: investments] [added: impair a landfill] in [removed: waste diversion technology companies; (iv)] [added: Tier 3 due to] a [removed: $10] [added: loss of expected volumes; (iii) $12] million [added: of] goodwill impairment [removed: charge] [added: charges primarily] related to our LampTracker® reporting unit and [removed: (v)] [added: (iv)] an $8 million loss on the sale of a majority-owned organics company. [removed: These charges had a negative impact of $0.26 on our diluted earnings per share. |]
[added: We define free cash flow as net cash] provided by operating activities, less capital expenditures, plus proceeds from divestitures of businesses and other assets (net of cash divested).
[removed: Nonetheless,] [added: We believe free cash flow gives investors useful insight into how we view our liquidity, but] the use of free cash flow as a liquidity measure has material limitations because it excludes certain expenditures that are required or that we have committed to, such as declared dividend payments and debt service requirements.
| | [removed: | 2017] [added: 2018] | | | [removed: 2016] [added: 2017] | | | [removed: 2015] [added: 2016] | |
| Net cash provided by operating activities [removed: (a)] | | $ | [removed: 3,180] [added: 3,570] | | $ | [removed: 3,006] [added: 3,180] | | $ | [removed: 2,528] [added: 3,003] |
| Capital expenditures | | | [removed: (1,509)] [added: (1,694)] | | | [removed: (1,339)] [added: (1,509)] | | | [removed: (1,233)] [added: (1,339)] |
| Proceeds from divestitures of businesses and other assets (net of cash divested) | | | [removed: 99] [added: 208] | | | [removed: 43] [added: 99] | | | [removed: 145] [added: 43] |
| Free cash flow (a) | | $ | [removed: 1,770] [added: 2,084] | | $ | [removed: 1,710] [added: 1,770] | | $ | [removed: 1,440] [added: 1,707] |
| | (a) | | Prior year information [removed: has been] [added: was] revised to reflect the adoption of [removed: Accounting Standards Update (“ASU”) 2016‑09, which is discussed below in Adoption of New Accounting Standards,] [added: ASU 2016‑18] and conform to our current year presentation. See Note 2 to the Consolidated Financial Statements. |
Our [removed: net] [added: operating] cash flows [removed: provided by operating activities] increased by [removed: $174] [added: $177] million for the year ended December 31, [removed: 2017] [added: 2017, as] compared with [removed: 2016, impacted by (i)] [added: the prior year period, as a result of] higher earnings from our Traditional Solid Waste [added: business] and recycling [removed: businesses and (ii) favorable changes in assets and liabilities, net of effects] [added: line] of [removed: acquisitions and divestitures.][added: business.]
[added: Net Cash Provided by Operating Activities —] Our [removed: net] [added: operating] cash flows [removed: provided by operating activities] increased by [removed: $478] [added: $390] million for the year ended December 31, [removed: 2016] [added: 2018, as] compared with [removed: 2015, impacted by] [added: the prior year period, as a result of] (i) higher earnings from our Traditional Solid Waste [added: business] and [removed: recycling businesses;] (ii) [removed: cash proceeds of $67 million from the termination of our cross-currency swaps in 2016; (iii) Multiemployer Pension Plan settlement payments of approximately $60 million in 2015 and (iv)] lower [removed: annual incentive plan cash] [added: income tax] payments of [removed: $46 million in 2016; partially offset] [added: $213 million, driven] by [removed: higher] [added: enactment of tax reform and timing of] income tax payments [added: partially offset by lower earnings from our recycling line] of [removed: $23 million in 2016.][added: business.]
[added: | | · | | Capital Expenditures — We used $1,694 million, $1,509 million and $1,339 million for capital expenditures in 2018, 2017 and 2016, respectively.] The Company continues to maintain a disciplined focus on capital management and fluctuations in our capital expenditures are a result of new business opportunities, growth in our existing business, [added: the] timing of replacement of aging assets and investment in assets that support our strategy of continuous improvement through efficiency and innovation. [added: |]
[added: |] Acquisitions [added: | | | 2 | | | — | | | 2 |]
[removed: Adoption of] New Accounting [removed: Standards][added: Standard Pending Adoption]
Each of these items is discussed in additional detail [removed: below.][added: below and in Note 3 to the Consolidated Financial Statements.]
[removed: The remaining permitted airspace] is determined by an annual survey, which is used to compare the existing landfill topography to the expected final landfill topography.
First, to include airspace associated with an expansion effort, we must generally expect the initial expansion permit application to be submitted within one [removed: year,] [added: year] and the final expansion permit to be received within five years.
For unpermitted airspace to be initially included in our estimate of remaining permitted and expansion airspace, the expansion effort must meet all [removed: of] the criteria listed above.
[removed: Most significantly, if it is determined that] expansion capacity should no longer be considered in calculating the recoverability of a landfill asset, we may be required to recognize an asset impairment or incur significantly higher amortization expense.
[added: These liabilities include PRP investigations, settlements,] and [added: certain legal and] consultant fees, as well as costs directly associated with site investigation and clean up, such as materials, external contractor costs and incremental internal costs directly related to the remedy.
If necessary, impairments are recorded in [removed: (income) expense] [added: (gain) loss] from divestitures, asset impairments and unusual items, net in our Consolidated Statement of Operations.
The assessment of impairment indicators and the recoverability of our capitalized costs associated with landfills and related expansion projects require significant judgment due to the unique nature of the waste industry, the highly regulated [removed: permitting process and the sensitive estimates involved.]
Indefinite-Lived Intangible Assets, Including Goodwill — At least annually, and more frequently if warranted, we assess the indefinite-lived intangible [removed: assets,] [added: assets] including the goodwill of our reporting units for impairment using Level 3 inputs.
[removed: Our quantitative] [added: If the] assessment [removed: identifies potential impairments by] [added: indicated a possible impairment, we completed a quantitative review,] comparing the estimated fair value of a reporting unit to its carrying amount, including goodwill.
An impairment charge [removed: is] [added: was] recognized if the asset’s estimated fair value [removed: is] [added: was] less than its carrying amount.
Management’s Discussion and Analysis of Financial Condition and Results of Operations — [removed: (Income) Expense] [added: (Gain) Loss] from Divestitures, Asset Impairments and Unusual Items, Net and Note 6 to the Consolidated Financial Statements for information related to goodwill impairments recognized during the reported periods.
WM will pay an annual premium to the insurance captive, typically in the first quarter of the [removed: year comprised of equal parts cash and an intercompany note,] [added: year,] for the estimated losses based on the external actuarial analysis.
Revenues from our collection operations are influenced by factors such as collection frequency, type of collection equipment furnished, type and volume or weight of the waste collected, distance to the disposal facility or [removed: MRF][added: material recovery facility and our disposal costs.]
We also provide additional services that are not managed through our Solid Waste business, including both our WMSBS and EES organizations, recycling brokerage services, landfill gas-to-energy services and [removed: expanded service offerings and solutions.][added: certain other]
| Solid Waste | [removed: |] $ | [removed: 14,832] [added: 15,537] | | $ | [removed: 13,968] [added: 14,832] | | $ | [removed: 13,285] [added: 13,968] |
| Other | | [removed: | 2,538] [added: 2,487] | | | [removed: 2,278] [added: 2,538] | | | [removed: 2,065] [added: 2,278] |
| Intercompany | | [removed: | (2,885)] [added: (3,110)] | | | [removed: (2,637)] [added: (2,885)] | | | [removed: (2,389)] [added: (2,637)] |
| Total | [removed: |] $ | [removed: 14,485] [added: 14,914] | | $ | [removed: 13,609] [added: 14,485] | | $ | [removed: 12,961] [added: 13,609] |
| Commercial | | [added: |] $ | [removed: 3,714] [added: 3,972] | | $ | [removed: 3,480] [added: 3,714] | | $ | [removed: 3,332] [added: 3,480] |
| Residential | | | [removed: 2,528] | [added: 2,529] | | [removed: 2,487] | [added: 2,528] | | [removed: 2,499] | [added: 2,487 |]
| Industrial | | | [removed: 2,583] | [added: 2,773] | | [removed: 2,412] | [added: 2,583] | | [removed: 2,252] | [added: 2,412 |]
We are North America’s leading provider of comprehensive waste management environmental services.
We partner with our residential, commercial, industrial and municipal customers and the communities we serve to manage and reduce waste at each stage from collection to disposal, while recovering valuable resources and creating clean, renewable energy.
We own or operate the largest network of landfills in North America.
In order to make disposal more practical for larger urban markets, where the distance to landfills is typically farther, we manage transfer stations that consolidate, compact and transport waste efficiently and economically.
We also use waste to create energy, recovering the gas produced naturally as waste decomposes in landfills and using the gas in generators to make electricity.
Additionally, we are a leading recycler in North America, handling materials that include paper, cardboard, glass, plastic and metal.
Our “Solid Waste” business is operated and managed locally by our subsidiaries that focus on distinct geographic areas and provides collection, transfer, disposal, and recycling and resource recovery services.
Our “Traditional Solid Waste” business excludes our recycling and resource recovery services.
Through our subsidiaries, we are also a leading developer, operator and owner of landfill gas-to-energy facilities in the U.S.
Our Solid Waste operating revenues are primarily generated from fees charged for our collection, transfer, disposal, and recycling and resource recovery services, and from sales of commodities by our recycling and landfill gas-to-energy operations.
The fees we charge for our services generally include our environmental fee, fuel surcharge and regulatory recovery fee which are intended to pass through to customers direct and indirect costs incurred.
We also provide additional services that are not managed through our Solid Waste business, described under Results of Operations below.
Business Environment
The waste industry is a comparatively mature and stable industry.
However, customers increasingly expect more of their waste materials to be recovered and those waste streams are becoming more complex.
In addition, many state and local governments mandate diversion, recycling and waste reduction at the source and prohibit the disposal of certain types of waste at landfills.
Due to this, we monitor these developments to adapt our services offerings.
As companies, individuals and communities look for ways to be more sustainable, we are promoting our comprehensive services that go beyond our core business of collecting and disposing of waste in order to meet their needs.
Despite some industry consolidation in recent years, we encounter intense competition from governmental, quasi-governmental and private service providers based on pricing, service quality, customer experience and breadth of service offerings.
We also encounter competition for acquisition and growth opportunities.
Our industry is directly affected by changes in general economic factors, as increases and decreases in consumer spending, business expansions and construction starts generally correlate to volumes of waste generated and our revenues.
Negative economic conditions, in addition to competitor actions, can make it more challenging to negotiate, renew or expand service contracts with acceptable margins and customers may reduce their service needs.
General economic factors and the market for consumer goods, in addition to regulatory developments, can also significantly impact commodity prices for recyclable materials we sell.
Our operating expenses are directly impacted by volume levels; as volume levels shift, due to economic and other factors, we must manage our network capacity and cost structure accordingly.
The generally favorable macro-economic environment, including steady spending by consumers and businesses and construction starts, has benefited our volume growth and gross margins in recent quarters.
We are not expecting any significant shift in the near term, but there is increased market volatility and uncertainty about longer-term macro-economic indicators.
Disruptions in the global movement of recycling commodities, due in part to actions by the Chinese government, resulted in significantly lower average markets prices in 2018 compared to 2017; however, we currently expect market price declines for recycling commodities to moderate in 2019.
The recycling industry is continuing to adapt to the heightened quality standards and regulations.
In addition, we are also focusing on managing processing costs, developing alternative markets and educating customers to reduce contamination in the recycling stream.
Current Year Financial Results
During 2018, we continued to produce strong operating results from our Traditional Solid Waste business, driven by strong yield and volume growth in our collection and disposal business.
Net income and earnings per diluted share both increased primarily as a result of the strong operating results from our Traditional Solid Waste business as well as the favorable impact on our effective tax rate due to enactment of tax reform.
The Company continued its commitment to supporting both organic and inorganic growth during 2018, allocating $1,694 million of available cash to capital expenditures and $466 million to the acquisition of solid waste businesses.
We also allocated $1,806 million to our shareholders during 2018 through common stock repurchases and dividends.
| | · | | Operating expenses of $9,249 million in 2018, or 62.0% of revenues, compared with $9,021 million, or 62.3% of revenues, in 2017. This increase of $228 million is primarily attributable to higher volumes and cost inflation in the current year period, partially offset by (i) changes in accounting for rebates and certain franchise fees required by the adoption of ASU 2014-09 and (ii) decreased cost of goods sold due to lower market prices for recycling commodities; |
| | · | | Selling, general and administrative expenses of $1,453 million in 2018, or 9.7% of revenues, compared with $1,468 million, or 10.1% of revenues, in 2017. This decrease of $15 million is primarily attributable to lower incentive compensation accruals partially offset by increased professional fees and bad debt expense; |
| | · | | Net income attributable to Waste Management, Inc. of $1,925 million, or $4.45 per diluted share, for 2018 as compared with $1,949 million, or $4.41 per diluted share, for 2017. The comparability is impacted by an increase in the effective income tax rate in the current year period of 19% compared with 11% in the prior year period primarily due to the one-time impacts associated with enactment of tax reform in late 2017. The current year was favorably impacted by (i) improved operating results in our Traditional Solid Waste business and (ii) net gains associated with the sale of certain hauling and ancillary operations. Partially offsetting these increases was lower earnings from our recycling line of business due to lower market prices for recycling commodities and the impairment of a landfill; |
| | · | | Net cash provided by operating activities was $3,570 million in 2018 compared with $3,180 million in 2017; and |
| | · | | Free cash flow was $2,084 million in 2018 compared with $1,770 million in 2017. The $314 million increase was a result of (i) higher earnings from our Traditional Solid Waste business; (ii) lower income tax payments associated with enactment of tax reform in late 2017 and timing of income tax payments and (iii) divestitures of certain hauling and ancillary operations partially offset by higher capital expenditures to support organic growth in our business. Free cash flow is a non-GAAP measure of liquidity. Refer to Free Cash Flow below for our definition of free cash flow, additional information about our use of this measure, and a reconciliation to net cash provided by operating activities, which is the most comparable GAAP measure. |
expanded service offerings and solutions.
Our Company’s goals are targeted at serving our customers, our employees, the environment, the communities in which we work and our stockholders.
Increasingly, customers want more of their waste materials recovered, while waste streams are becoming more complex, and our aim is to address the current needs, while anticipating the expanding and evolving needs, of our customers.
We believe we are uniquely equipped to meet the challenges of the changing waste industry and our customers’ waste management needs, both today and as we work together to envision and create a more sustainable future.
As the waste industry leader, we have the expertise necessary to collect and handle our customers’ waste efficiently and responsibly by delivering environmental performance — maximizing resource value, while minimizing environmental impact — so that both our economy and our environment can thrive.
Our fundamental strategy has not changed; we remain dedicated to providing long-term value to our stockholders by successfully executing our core strategy of focused differentiation and continuous improvement, with the current state of our strategy taking into account economic conditions, the regulatory environment, asset and resource availability and innovation through technology.
We believe that focused differentiation in our industry, driven by capitalizing on our extensive, well-placed network of assets, will deliver profitable growth and competitive advantages.
Simultaneously, we believe the combination of cost control, process improvement and operational efficiency will deliver on the Company’s strategy of continuous improvement and yield an attractive total cost structure and enhanced service quality.
While we will continue to monitor emerging diversion technologies that may generate additional value and related market dynamics, our current attention will be on improving existing diversion technologies, such as our recycling operations.
We believe that execution of our strategy will deliver shareholder value and leadership in a dynamic industry.
| --- | --- | --- | --- |
| | · | | Operating expenses of $9,021 million in 2017, or 62.3% of revenues, compared with $8,486 million, or 62.4% of revenues, in 2016. This increase of $535 million is primarily attributable to (i) increased cost of goods sold due to higher market prices for recycling commodities; (ii) higher volumes; (iii) increased maintenance and repairs costs; (iv) increased labor and related benefits costs, primarily due to merit and headcount increases and (v) increased fuel costs, primarily due to higher fuel prices and the expiration of certain natural gas fuel excise tax credits. These increases were partially offset by decreased landfill leachate management costs; |
| | · | | Selling, general and administrative expenses of $1,468 million in 2017, or 10.1% of revenues, compared with $1,410 million, or 10.4% of revenues, in 2016. This increase of $58 million is primarily attributable to (i) the impact of favorable litigation settlements in 2016; (ii) merit increases; (iii) an increase in certain costs that vary with revenue and earnings growth, including incentive compensation accruals; (iv) higher severance costs and (v) charitable contributions made for hurricane relief efforts; |
| | · | | Net income attributable to Waste Management, Inc. of $1,949 million, or $4.41 per diluted share, for 2017 as compared with $1,182 million, or $2.65 per diluted share, for 2016; and |
| | · | | In 2017, we returned $1,500 million to our shareholders through dividends and share repurchases compared with $1,451 million in 2016. |
Our business performed exceptionally well in 2017, as our strategy of improving pricing, adding profitable volume and controlling costs led to another year of significant earnings improvement.
Our focus on delivering exceptional customer service while bolstering employee engagement yielded consistently positive operational performance throughout the year.
Our cash flow generation has also continued to exceed expectations, allowing us to invest in assets that support continuous improvement through efficiency and innovation and return $1.5 billion to our shareholders in dividends and share repurchases in 2017.
The success that we achieved in 2017 reinforces our foundation for earnings and cash flow growth in 2018, despite anticipated disruption and downward price pressure in the global market for recycling commodities.
With the reduction in our cash taxes due to enactment of tax reform, we are investing in our front-line employees, technology and revenue generating assets to continue to grow our business and improve customer service.
These investments, together with our long-held commitments to maintain a strong balance sheet, return cash to shareholders and pursue attractive strategic growth opportunities, position the Company to capitalize on its momentum as we work to deliver superior performance again in 2018.
The following explanations of certain items that affected the comparability of the years presented has been provided to support investors’ understanding of our performance.
Our 2017 results were affected by the following:
| | · | | An income tax benefit of $529 million related to enactment of the Tax Cuts and Jobs Act, consisting of a net tax benefit of $595 million for the re-measurement of our deferred income tax assets and liabilities, partially offset by income tax expense of $66 million for a one-time, mandatory transition tax on the deemed repatriation of previously tax-deferred and unremitted foreign earnings. This net tax benefit had a favorable impact of $1.20 on our diluted earnings per share; |
| | · | | The recognition of net pre-tax charges aggregating to $36 million, primarily related to (i) $37 million of impairment charges related to investments in waste diversion technology companies; (ii) $34 million of goodwill impairment charges for certain ancillary services businesses; (iii) an $11 million charge for the withdrawal from an underfunded Multiemployer Pension Plan; (iv) $11 million of charges to adjust our subsidiary’s estimated potential share of an environmental remediation liability and related costs for a closed site in Harris County, Texas and (v) a charge of $6 million related to the early extinguishment of $590 million of 6.1% senior notes. These charges were partially offset by gains of $31 million from the sale of certain oil and gas producing properties and a $30 million reduction in post-closing, performance-based contingent consideration obligations associated with an acquired business in our EES organization. These net charges had a negative impact of $0.08 on our diluted earnings per share; and |
| | · | | Income tax benefit of $32 million for excess tax benefits related to the vesting or exercise of equity-based compensation awards, which had a favorable impact of $0.07 on our diluted earnings per share. |
Our 2016 results were affected by the following:
We define free cash flow as net cash
However, we believe free cash flow gives investors useful insight into how we view our liquidity.
| | | | | | | | | | |
| --- | --- | --- | --- | --- | --- | --- | --- | --- | --- |
These increases were partially offset by (i) higher income tax payments of $120 million in 2017; (ii) cash proceeds of $67 million from the termination of our cross-currency swaps in 2016 and (iii) higher annual incentive plan cash payments of $41 million in 2017.
Additionally, we experienced favorable changes in assets and liabilities, net of effects of acquisitions and divestitures, particularly non-trade related items including payroll and incentive accruals.
Capital expenditures increased by $170 million when comparing 2017 with 2016 and $106 million when comparing 2016 with 2015.
Southern Waste Systems/Sun Recycling (“SWS”) — On January 8, 2016, Waste Management Inc. of Florida, an indirect wholly-owned subsidiary of WM, acquired certain operations and business assets of SWS in Southern Florida for total consideration of $525 million.
The acquired business assets include residential, commercial and industrial solid waste collection, processing/recycling and transfer operations, equipment, vehicles, real estate and customer agreements.
Deffenbaugh Disposal, Inc. (“Deffenbaugh”) — On March 26, 2015, we acquired Deffenbaugh, one of the largest privately owned collection and disposal firms in the Midwest, for total consideration, net of cash acquired, of $400 million.
Deffenbaugh’s assets include collection operations, transfer stations, recycling facilities and landfills.
Equity-Based Compensation — In March 2016, the Financial Accounting Standards Board (“FASB”) issued ASU 2016‑09 associated with equity-based compensation as part of its simplification initiative to reduce the cost and complexity of compliance with GAAP, while maintaining or improving the usefulness of the information provided.
This amended guidance was effective for the Company on January 1, 2017 and required the following changes to the presentation of our financial statements:
| | · | | Excess tax benefits or deficiencies for share-based payments are now recorded as a discrete item in the period shares vest or stock options are exercised as an adjustment to income tax expense or benefit rather than additional paid-in capital. This change was applied prospectively as of January 1, 2017. The Company did not have any excess tax benefits that were not previously recognized as of January 1, 2017. See Note 8 to the Consolidated Financial Statements for discussion of the current year impact; |
An excerpt. Shown here: 40 of 263 rewritten, 40 of 174 added and 40 of 242 removed. The counts are complete. For every sentence, read Item 7. Management’s Discussion and Analysis of Financial Condition and Results of Operations. in the FY2018 filing and the FY2017 filing.
Item 7A. Quantitative and Qualitative Disclosures about Market Risk.
6 rewritten, 0 added, 0 removed, 17 unchanged
The Company had no derivatives outstanding as of December 31, [removed: 2017.][added: 2018.]
As of December 31, [removed: 2017,] [added: 2018,] we had [removed: $9.5] [added: $10.1] billion of long-term debt, excluding the impacts of accounting for debt issuance costs, discounts, premiums and fair value adjustments attributable to terminated interest rate derivatives.
We have [removed: $1.8] [added: $2.2] billion of debt that is exposed to changes in market interest rates within the next 12 months comprised of (i) [removed: $831] [added: $990] million of [added: short-term borrowings under our commercial paper program; (ii) $705 million of] tax-exempt bonds with term interest rate periods [removed: scheduled to] [added: that] expire within the next 12 months; [removed: (ii) $515 million of outstanding borrowings under our commercial paper program;] (iii) [removed: $328] [added: $513] million of [added: variable-rate] tax-exempt bonds that are subject to repricing on either a daily or weekly basis [removed: through a remarketing process] and (iv) [removed: $113 million] [added: C$15 million, or $11 million,] of [removed: outstanding] [added: Canadian] borrowings under our [removed: Canadian term loan.][added: $2.75 billion revolving credit facility.]
We currently estimate that a 100‑basis point increase in the interest rates of our outstanding variable-rate debt obligations would increase our [removed: 2018] [added: 2019] interest expense by [removed: $15] [added: $19] million.
An instantaneous, 100‑basis point increase in interest rates across all maturities attributable to these instruments would have decreased the fair value of our debt by approximately [removed: $635] [added: $575] million as of December 31, [removed: 2017.][added: 2018.]
We also invest a portion of our restricted trust and escrow account balances in [removed: fixed-income] [added: available-for-sale] securities, including U.S. Treasury securities, U.S. agency securities, municipal [removed: securities and] [added: securities,] mortgage- and asset-backed [added: securities and equity] securities.
Item 1. Business.
66 rewritten, 36 added, 30 removed, 202 unchanged
During [removed: 2017,] [added: 2018,] our largest customer represented 1% of annual revenues.
We employed approximately [removed: 42,300] [added: 43,700] people as of December 31, [removed: 2017.][added: 2018.]
We own or operate [removed: 249] [added: 252] landfill sites, which is the largest network of landfills in North America.
In order to make disposal more practical for larger urban markets, where the distance to landfills is typically farther, we manage [removed: 305] [added: 314] transfer stations that consolidate, compact and transport waste efficiently and economically.
Our fundamental strategy has not changed; we remain dedicated to providing long-term value to our stockholders by successfully executing our core strategy of focused differentiation and continuous [removed: improvement, with the current state of our strategy taking into account economic conditions, the regulatory environment, asset and resource availability and innovation through technology.][added: improvement.]
We believe that focused [removed: differentiation in our industry,] [added: differentiation, which is] driven by capitalizing on our [removed: extensive, well-placed] [added: unique and extensive] network of assets, will deliver profitable growth and [added: position us to leverage] competitive advantages.
In December [removed: 2017,] [added: 2018,] we announced that our Board of Directors expects to increase the quarterly dividend from [removed: $0.425 to] $0.465 [added: to $0.5125] per share for dividends declared in [removed: 2018,] [added: 2019,] which is a [removed: 9.4%] [added: 10.2%] increase from the quarterly dividends we declared in [removed: 2017.][added: 2018.]
This is an indication of our ability to generate strong and consistent cash flows and marks the [removed: 15th] [added: 16th] consecutive year of dividend increases.
We also provide additional services that are not managed through our Solid Waste [removed: business] [added: business,] as described below.
[added: These operations are presented in this report as “Other.”] The services we currently provide include collection, landfill (solid and hazardous waste landfills), transfer, recycling and resource recovery and other services, as described below.
| | · | | For most residential collection services, we have a contract with, or a franchise granted by, a municipality, homeowners’ association or some other regional authority that gives us the exclusive right to service all or a portion of the homes in an area. These contracts or franchises are typically for periods of three to [removed: eight] [added: ten] years. We also provide services under individual monthly subscriptions directly to households. The fees for residential collection are either paid by the municipality or authority from their tax revenues or service charges, or are paid directly by the residents receiving the service. |
As of December 31, [removed: 2017,] [added: 2018,] we owned or operated [removed: 244] [added: 247] solid waste landfills and five secure hazardous waste landfills, which represents the largest network of landfills in North America.
[removed: A landfill must] meet federal, state or provincial, and local regulations during its design, construction, operation and closure.
As of December 31, [removed: 2017,] [added: 2018,] we owned or operated [removed: 305] [added: 314] transfer stations in North America.
There are some instances where transfer stations are operated under contract, generally [added: for municipalities.]
[removed: Recycling involves the separation of] reusable materials from the waste stream for processing and resale or other disposition.
As of December 31, [removed: 2017,] [added: 2018,] we operated [removed: 90] [added: 102] MRFs where paper, cardboard, metals, plastics, glass, construction and demolition materials and other recycling commodities are recovered for [removed: resale.][added: resale or redirected for other purposes.]
As a result, changes in commodity prices for recycled materials also significantly affect the rebates we pay to our [removed: suppliers, which] [added: suppliers and depending on the key terms of the agreement] are recorded as [added: either] operating expenses [added: or a reduction in operating revenues] within our Consolidated Statements of [removed: Operations.][added: Operations, subsequent to the adoption of Accounting Standards Update (“ASU”) 2014-09 on January 1, 2018.]
Although many waste management services such as collection and disposal are local services, our strategic accounts organization, which is managed by our Strategic Business Solutions (“WMSBS”) organization, works with customers whose locations span the U.S. [removed: Our strategic accounts program provides centralized customer service, billing] and [removed: management of accounts to streamline the administration of customers’ multiple and nationwide locations’ waste management needs.][added: Canada.]
[added: The breadth of our service offerings and the familiarity we have with waste management practices gives us the unique] ability to assist customers in minimizing the amount of waste they generate, identifying recycling opportunities, determining the most efficient means available for waste collection and disposal and ensuring that disposal is achieved in a manner that is both reflective of the current regulatory environment and environmentally friendly.
The U.S. Environmental Protection Agency (“EPA”) endorses landfill gas as a renewable energy resource, in the [removed: same category as wind, solar and geothermal resources.]
As of December 31, [removed: 2017,] [added: 2018,] we had [removed: 127] [added: 130] landfill gas beneficial use projects producing commercial quantities of methane gas at owned or operated landfills.
For [removed: 102] [added: 101] of these projects, the processed gas is used to fuel electricity generators.
For [removed: 13] [added: 14] of these projects, the gas is used at the landfill or delivered by pipeline to industrial customers as a direct substitute for fossil fuels in industrial processes.
For [removed: 12] [added: 15] of these projects, the landfill gas is processed to pipeline-quality natural gas and then sold to natural gas suppliers.
We also have expanded service offerings and solutions including [removed: portable self-storage and long distance moving services;] fluorescent bulb and universal waste mail-back through our LampTracker® program; portable restroom servicing under the name Port-o-Let®; and street and parking lot sweeping services.
[removed: In North America, the] [added: The] industry [removed: consists primarily of three national waste management companies and regional and local companies of varying sizes and financial resources, including] [added: also includes] companies that specialize in certain discrete areas of waste management, operators of alternative disposal [removed: facilities and] [added: facilities,] companies that seek to use parts of the waste stream as feedstock for renewable energy and other [removed: by-products.][added: by-products, and waste brokers that rely upon haulers in local markets to address customer needs.]
We [added: principally] compete with [removed: these companies as well as with] [added: large national waste management companies,] counties and municipalities that maintain their own waste collection and disposal operations and [removed: waste brokers that rely upon haulers in] [added: regional and] local [removed: markets to address customer needs.][added: companies of varying sizes and financial resources.]
On the other hand, certain destructive weather [removed: conditions that tend to occur during the second half of the year,] [added: and climate conditions,] such as [added: wildfires in] the [added: Western U.S. and] hurricanes that most often impact our operations in the Southern and Eastern [removed: U.S.,] [added: U.S. during the second half of the year,] can increase our revenues in the Areas affected.
As of December 31, [removed: 2017,] [added: 2018,] we had approximately [removed: 42,300] [added: 43,700] full-time employees, of which approximately [removed: 7,900] [added: 8,200] were employed in administrative and sales positions and the balance in operations.
Approximately [removed: 8,100] [added: 8,300] of our employees are covered by collective bargaining agreements.
Financial assurance is also a requirement for (i) obtaining or retaining disposal site or transfer station operating permits; (ii) supporting [added: certain] variable-rate tax-exempt debt and (iii) estimated final capping, closure, post-closure and environmental remedial obligations at many of our landfills.
Letters of credit generally are supported by our long-term U.S. [added: and Canadian] revolving credit facility [removed: (“$2.25] [added: (“$2.75] billion revolving credit facility”) and other credit facilities established for that purpose.
As of December 31, [removed: 2017,] [added: 2018,] both our commercial General Liability Insurance Policy and our workers’ compensation insurance program carried self-insurance exposures of up to $5 million per incident.
As of December 31, [removed: 2017,] [added: 2018,] our automobile liability insurance program included a per-incident deductible of up to $10 million.
Our estimated insurance liabilities as of December 31, [removed: 2017] [added: 2018] are summarized in Note 10 to the Consolidated Financial Statements.
With acquisition, development or expansion of a waste management or disposal facility or transfer station, we must often spend considerable time, effort and money to obtain or maintain required permits and [removed: approvals.]
We cannot predict what impact the current administration will have on [added: regulations impacting our industry, especially given] the [removed: political and regulatory environment] [added: number of rules currently] in [removed: the U.S.,] [added: litigation, nor can we predict] the timing of any such [removed: changes, or the impact of any such changes on our business.][added: changes.]
| | · | | The Resource Conservation and Recovery Act of 1976 (“RCRA”), as amended, regulates handling, transporting and disposing of hazardous and non-hazardous waste and delegates authority to states to develop programs to ensure the safe disposal of solid waste. In 1991, the EPA issued [removed: its] final regulations under Subtitle D of RCRA, which set forth minimum federal performance and design criteria for solid waste landfills. These regulations are typically implemented by the states, although states can impose requirements that are more stringent than the Subtitle D standards. We incur costs in complying with these standards in the ordinary course of our operations. [added: In December 2018, the EPA signed a final rule that establishes management standards for pharmaceutical wastes that are classified as hazardous wastes. The requirements of the rule apply primarily to healthcare facilities and reverse distributors of hazardous waste pharmaceuticals and include a broad prohibition on disposal of hazardous waste pharmaceuticals in sewage systems. The rule is not currently anticipated to materially affect our industry, but we do expect that it will create new waste volumes for disposal at facilities permitted to incinerate hazardous waste. Also, in December 2018, the EPA published an Advanced Notice of Proposed Rulemaking to consider whether to propose revisions to the MSW Landfill criteria to support advances in liquids management. The notice does not reopen any existing regulations; we will review the topic for both risks and opportunities for our business and respond appropriately.] |
| | · | | The Comprehensive Environmental Response, Compensation and Liability Act of 1980, as amended, (“CERCLA”) which is also known as Superfund, provides for federal authority to respond directly to releases or threatened releases of hazardous substances into the environment that have created actual or potential environmental hazards. CERCLA’s primary means for addressing such releases is to impose strict liability for cleanup of disposal sites upon current and former site owners and operators, generators of the hazardous substances at the site and transporters who selected the disposal site and transported substances thereto. Liability under CERCLA is not dependent on the intentional release of hazardous substances; it can be based upon the release or threatened release of hazardous substances, even resulting from lawful, unintentional and attentive action, as the term is defined by CERCLA and other applicable statutes and regulations. The EPA may issue orders requiring responsible parties to perform response actions at sites, or the EPA may seek recovery of funds expended or to be expended in the future at sites. Liability may include contribution for cleanup costs incurred by a defendant in a CERCLA civil action or by an entity that has previously resolved its liability to federal or state regulators in an administrative or judicially-approved settlement. Liability under CERCLA could also [added: include obligations to a potentially responsible party (“PRP”) that voluntarily expends site clean-up costs. Further, liability for damage to publicly-owned natural resources may also be imposed. We are subject to potential liability under CERCLA as an owner or operator of facilities at which hazardous substances have been disposed and as a generator or transporter of hazardous substances disposed of at other locations.] |
Our strategic planning processes appropriately consider that the future of our business and the industry can be influenced by changes in economic conditions, the competitive landscape, the regulatory environment, asset and resource availability and technology.
All quarterly dividends will be declared at the discretion of our Board of Directors and depend on various factors, including our net earnings, financial condition, cash required for future business plans, growth and acquisitions and other factors the Board of Directors may deem relevant.
A landfill must
Recycling involves the separation of
See Note 2 to the Consolidated Financial Statements for additional information.
Our strategic accounts program provides centralized customer service, billing and management of accounts to streamline the administration of customers multiple locations’ waste management needs.
same category as wind, solar and geothermal resources.
approvals.
| | · | | The Federal Water Pollution Control Act of 1972, as amended, known as the Clean Water Act, regulates the discharge of pollutants into streams, rivers, groundwater, or other surface waters from a variety of sources, including solid and hazardous waste disposal sites. If our operations discharge any pollutants into surface waters, the Clean Water Act requires us to apply for and obtain discharge permits, conduct sampling and monitoring, |
Since 2014, decisions from the U.S Supreme Court and U.S. Court of Appeals for the D.C Circuit, as well as EPA policy memorandum, have significantly narrowed the applicability and scope of EPA permitting requirements for GHGs from stationary sources, including with respect to biogenic carbon dioxide (“CO2”) permitting.
In
The EPA has not yet finalized this rulemaking.
| | · | | In May 2016, the EPA established lifetime health advisories for certain per- and polyfluoroalkyl substances (“PFAS”), a group of man-made chemicals that have been manufactured and used globally since the 1940s in products such as textiles, fire suppressants, cookware, packaging and plastics. PFAS are typically very persistent in the environment and can be found in water, soil and air. Citing concerns about potential adverse human health effects from exposure to PFAS, several states have recently enacted new drinking water, surface water and/or groundwater limits for various PFAS, and the EPA has stated that it will be considering additional regulatory action related to the compounds. We are working with both the EPA and state regulatory agencies to maintain compliance with these evolving PFAS standards and anticipate additional expense that will result from these efforts |
cases, releases and cleanup of hazardous substances and liabilities for such matters.
Many other markets, both domestic and foreign, have tightened their quality expectations as well.
In addition, other countries have limited or restricted the import of certain recyclables.
In response, China has imposed new tariffs on the import of recyclable commodities, including wastepaper, plastics and metals.
With a heightened awareness of the global problems of plastic waste in the environment, an increasing number of cities across the country have passed ordinances banning certain types of plastics from sale or use.
Bans on single use plastic bags, straws, and polystyrene food containers have been passed in over 350 cities, and a ban on single use plastic bags has been implemented in the State of California.
These bans have increased pressure by manufacturers on our recycling facilities to accept a broader array of materials in curbside recycling programs to alleviate public pressures to ban the sale of those materials.
However, with no viable end markets for recycling these materials, we and other recyclers are working to educate and remind customers of the need for end market demand and economic viability to support sustainable recycling programs.
Regulation of Oil and Gas Exploration, Production and Disposal
Increased regulation of oil and gas exploration and production, including GHG emissions or hydraulic fracturing, could make it more difficult or cost-prohibitive for our EES customers to continue operations, adversely affecting our business.
We anticipate that
Renewable Fuel Production
We have invested, and continue to invest, in facilities to capture and treat renewable natural gas (“RNG”) from the Company’s landfills, and we use RNG from landfill biogas in approximately 30% of our natural gas collection vehicles.
The Energy Policy Act of 2005 and Energy Independence and Security Act of 2007 authorize the Renewable Fuels Standards (“RFS”) program that promotes the production and use of renewable transportation fuels.
The Company is an EPA-registered producer of transportation fuel making compressed and liquefied RNG from landfill biogas, which qualifies as a cellulosic biofuel under the RFS program.
Oil refiners and importers are required through the RFS program to blend specified volumes of various categories of renewable transportation fuels with gasoline or buy credits, referred to as renewable identification numbers (“RINs”), from renewable fuel producers.
The market value for RINs is tied to renewable fuel volumes set by the EPA annually, and the final 2019 required volumes for cellulosic biofuel are 45% higher than in 2018.
The EPA is required to develop a rulemaking this year that will set required volume requirements for a three‑year period from 2020 through 2022.
Based on the overall political framework and the upcoming rulemakings, we anticipate a stable market for the Company’s RINs.
Moreover, we have seen initiatives at the federal, state and local level to enhance the environmental benefits in terms of GHG reductions realized by recycling programs by focusing on reducing contamination in the recyclable material.
Consistent with our Company’s long-standing commitment to corporate sustainability and environmental stewardship, we have published our 2018 Sustainability Report, “Driving Change,” which details the GHG emissions reductions we have facilitated to date and our determination to expand these reductions in the future, as well as our commitment to help make the communities in which we live and work safe, resilient and sustainable.
The information in this report can be found at our Company website but does not constitute a part of this Form 10-K.
The Company actively participates in a number of sustainability reporting programs and frameworks, including the Dow Jones Sustainability Index, where we are “Sector Leader” for Commercial Services, the CDP, where we are among “A List” companies, and the Sustainability Accounting Standards Board, on which we serve as a member of the Board’s advisory council.
All quarterly dividends will be declared at the discretion of our Board of Directors.
These operations are presented in this report as “Other.”
The following table shows revenues contributed by these services for the years ended December 31 (in millions):
| | | | | | | | | | |
| --- | --- | --- | --- | --- | --- | --- | --- | --- | --- |
| | | 2017 | | | 2016 | | | 2015 | |
| Collection | | $ | 9,264 | | $ | 8,802 | | $ | 8,439 |
| Landfill | | | 3,370 | | | 3,110 | | | 2,919 |
| Transfer | | | 1,591 | | | 1,512 | | | 1,377 |
| Recycling | | | 1,432 | | | 1,221 | | | 1,163 |
| Other | | | 1,713 | | | 1,601 | | | 1,452 |
| Intercompany | | | (2,885) | | | (2,637) | | | (2,389) |
| Total | | $ | 14,485 | | $ | 13,609 | | $ | 12,961 |
for municipalities.
The breadth of our service offerings and the familiarity we have with waste management practices gives us the unique
In addition, we hold interests in oil and gas producing properties.
The industry’s national and regional competitors often face significant competitors in local markets.
We previously chose to maintain a Directors’ and Officers’ Liability Insurance policy that covered only individual executive liability, often referred to as “Broad Form Side A." During 2017, due to attractive pricing, we converted to a traditional full coverage policy, and subject to the terms of that policy, the Company is now insured for money it advances for defense costs or pays as indemnity to the insured directors and officers in excess of applicable deductibles.
It is likely that some policies adopted by the current administration will benefit us and others will negatively affect us.
It also appears that pending litigation has blunted the impact of deregulation for the immediate future.
| include obligations to a potentially responsible party (“PRP”) that voluntarily expends site clean-up costs. Further, liability for damage to publicly-owned natural resources may also be imposed. We are subject to potential liability under CERCLA as an owner or operator of facilities at which hazardous substances have been disposed and as a generator or transporter of hazardous substances disposed of at other locations. |
| --- |
Further, in June 2014, the U.S. Supreme Court issued a decision that significantly limited the applicability and scope of EPA permitting requirements for GHGs from stationary sources.
Following this ruling, the EPA issued a policy memorandum in July 2014 advising that the U.S. Supreme Court ruling effectively narrows the scope of biogenic carbon dioxide (“CO2”) permitting issues that remain for the EPA to address.
The EPA plans to finalize the rulemaking in 2018.
| | · | | In 2011, the EPA published the Non-Hazardous Secondary Materials (“NHSM”) Rule, which provides the standards and procedures for identifying whether NHSM are solid waste under RCRA when used as fuels or ingredients in combustion units. The EPA also published New Source Performance Standards and Emission Guidelines for commercial and industrial solid waste incineration units (“CISWI”) and Maximum Achievable Control Technology Standards for commercial and industrial boilers (“Boiler MACT”). The EPA published clarifications and amendments to the three rules in 2013 and legal challenges to the rules were subsequently filed by both industry and environmental groups. In May 2015, the Court of Appeals for the D.C. Circuit upheld the NHSM Rule together with the amendments to the rule that support some of our projects in which we are seeking to convert biomass or other secondary materials into products, fuels or energy. Through rulings in July and December of 2016 related to the CISWI and Boiler MACT challenges, the Court vacated certain elements of those rules while remanding other aspects of the rules to the EPA for reconsideration. We believe the ultimate rules and administrative determinations will not have a material adverse impact on our business as a whole and are more likely to facilitate our efforts to reuse or recover energy value from secondary material streams. |
| | · | | In December 2014, the EPA issued a final rule regulating the disposal and beneficial use of coal combustion residuals (“CCR”). This codification of the CCR rule provides utilities with a stable regulatory regime and encourages beneficial use of CCR in encapsulated uses (e.g., used in cement or wallboard), and use according to |
entry into market areas, these laws have not, and are not expected to have a material adverse impact on our business as a whole.
Hydraulic Fracturing Regulation
incentives could increase our operating costs.
An excerpt. Shown here: 40 of 66 rewritten, all 36 added and all 30 removed. The counts are complete. For every sentence, read Item 1. Business. in the FY2018 filing and the FY2017 filing.
Cover and table of contents
27 rewritten, 1 added, 1 removed, 59 unchanged
For the fiscal year ended December 31, [removed: 2017][added: 2018]
| Common Stock, [removed: $.01] [added: $0.01] par value | New York Stock Exchange |
Indicate by check mark whether the registrant has submitted electronically [removed: and posted on its corporate Web site, if any,] every Interactive Data File required to be submitted [removed: and posted] pursuant to Rule 405 of Regulations S-T (§ 232.405 of this chapter) during the preceding 12 months (or for such shorter period that the registrant was required to submit and post such files).
| Non-accelerated filer | ☐ [removed: (Do not check if a smaller reporting company)] | Smaller reporting company ☐ |
| [added: | |] Emerging growth company [removed: |] ☐ | [removed: |]
The aggregate market value of the voting stock held by non-affiliates of the registrant as of June 30, [removed: 2017] [added: 2018] was approximately [removed: $32.2] [added: $34.8] billion.
The number of shares of Common Stock, $0.01 par value, of the registrant outstanding as of February 8, [removed: 2018] [added: 2019] was [removed: 433,673,878] [added: 423,779,540] (excluding treasury shares of [removed: 196,608,583).][added: 206,502,921).]
| Proxy Statement for the [removed: 2018] [added: 2019] Annual Meeting of Stockholders | | Part III |
| [Item 1A.](#Item1ARiskFactors_689078) | [Risk Factors](#Item1ARiskFactors_689078) | [removed: 14] [added: 15] |
| [Item 1B.](#Item1BUnresolvedStaffComments_347325) | [Unresolved Staff Comments](#Item1BUnresolvedStaffComments_347325) | [removed: 25] [added: 27] |
| [Item 2.](#Item2Properties_696453) | [Properties](#Item2Properties_696453) | [removed: 26] [added: 27] |
| [Item 3.](#Item3LegalProceedings_313163) | [Legal Proceedings](#Item3LegalProceedings_313163) | [removed: 26] [added: 27] |
| [Item 4.](#Item4MineSafetyDisclosures_74576) | [Mine Safety Disclosures](#Item4MineSafetyDisclosures_74576) | [removed: 26] [added: 27] |
| [Item 5.](#Item5MarketforRegistrantsCommon_605372) | [Market for Registrant’s Common Equity, Related Stockholder Matters and Issuer Purchases of Equity Securities](#Item5MarketforRegistrantsCommon_605372) | [removed: 27] [added: 28] |
| [Item 6.](#Item6SelectedFinancialData_572231) | [Selected Financial Data](#Item6SelectedFinancialData_572231) | [removed: 29] [added: 30] |
| [Item 7A.](#Item7AQuantitative_14076) | [Quantitative and Qualitative Disclosures About Market Risk](#Item7AQuantitative_14076) | [removed: 60] [added: 56] |
| [Item 8.](#Item8FinancialStatements_338840) | [Financial Statements and Supplementary Data](#Item8FinancialStatements_338840) | [removed: 61] [added: 57] |
| [Item 9.](#Item9ChangesinandDisagreements_74478) | [Changes in and Disagreements with Accountants on Accounting and Financial Disclosure](#Item9ChangesinandDisagreements_74478) | [removed: 125] [added: 120] |
| [Item 9A.](#Item9AControlsandProcedures_86084) | [Controls and Procedures](#Item9AControlsandProcedures_86084) | [removed: 125] [added: 120] |
| [Item 9B.](#Item9BOtherInformation_948347) | [Other Information](#Item9BOtherInformation_948347) | [removed: 126] [added: 121] |
| [Item 10.](#Item10DirectorsExecutive_334717) | [Directors, Executive Officers and Corporate Governance](#Item10DirectorsExecutive_334717) | [removed: 126] [added: 121] |
| [Item 11.](#Item11ExecutiveCompensation_362877) | [Executive Compensation](#Item11ExecutiveCompensation_362877) | [removed: 126] [added: 121] |
| [Item 12.](#Item12SecurityOwnership_987251) | [Security Ownership of Certain Beneficial Owners and Management and Related Stockholder Matters](#Item12SecurityOwnership_987251) | [removed: 126] [added: 121] |
| [Item 13.](#Item13CertainRelationships_733675) | [Certain Relationships and Related Transactions, and Director Independence](#Item13CertainRelationships_733675) | [removed: 126] [added: 121] |
| [Item 14.](#Item14PrincipalAccounting_341161) | [Principal Accounting Fees and Services](#Item14PrincipalAccounting_341161) | [removed: 126] [added: 121] |
| [Item 15.](#Item15ExhibitsFinancial_136084) | [removed: [Exhibits, Financial Statement Schedules](#Item15ExhibitsFinancial_136084)] [added: [Exhibits](#Item15ExhibitsFinancial_136084)] | [removed: 127] [added: 122] |
| [Item 16.](#Item_16_Form_10K_Summary) | [Form 10-K Summary](#Item_16_Form_10K_Summary) | [removed: 130] [added: 124] |
10-K 1 wm-20181231x10k.htm 10-K
10-K 1 wm-20171231x10k.htm 10-K
Item 2. Properties.
7 rewritten, 1 added, 1 removed, 10 unchanged
We also have administrative offices in Arizona, [removed: Illinois, Connecticut] [added: Connecticut, Illinois] and India.
We have operations in all 50 [removed: states,] [added: states except Montana,] the District of Columbia and throughout Canada.
However, we expect to continue to make investments in additional property and equipment for expansion, for [added: the] replacement of [added: aging] assets and [removed: to] [added: investment in assets that] support our strategy of continuous improvement through efficiency and innovation.
| Landfills owned or operated (a) | | [removed: 249] [added: 252] | | [removed: 248] [added: 249] |
| Transfer stations | | [removed: 305] [added: 314] | | [removed: 310] [added: 305] |
| Material recovery facilities | | [removed: 90] [added: 102] | | [removed: 95] [added: 90] |
| | (a) | | As of December 31, [removed: 2017] [added: 2018] and [removed: 2016,] [added: 2017,] our landfills owned or operated consisted of total acreage of [removed: 156,784] [added: 157,369] and [removed: 158,054;] [added: 156,784;] permitted acreage of [removed: 42,590] [added: 42,730] and [removed: 42,182;] [added: 42,590;] and expansion acreage of [removed: 821] [added: 944] and [removed: 905,] [added: 821,] respectively. Total acreage includes permitted acreage, expansion acreage, other acreage available for future disposal that has not been permitted, buffer land and other land. Permitted acreage consists of all acreage at the landfill encompassed by an active permit to dispose of waste. Expansion acreage consists of unpermitted acreage where the related expansion efforts meet our criteria to be included as expansion airspace. A discussion of the related criteria is included within Item 7. Management’s Discussion and Analysis of Financial Condition and Results of Operations — Critical Accounting Estimates and Assumptions included within this report. |
| | | 2018 | | 2017 |
| | | 2017 | | 2016 |
Item 5. Market for Registrant’s Common Equity, Related Stockholder Matters and Issuer Purchases of Equity Securities.
5 rewritten, 17 added, 33 removed, 16 unchanged
[added: Our common stock is traded on the New York Stock Exchange (“NYSE”) under the symbol “WM.”] The number of holders of record of our common stock on February 8, [removed: 2018] [added: 2019] was [removed: 9,248.][added: 8,942.]
| Dow Jones Waste & Disposal Services Index | | $ | 100 | | $ | [removed: 125] [added: 114] | | $ | [removed: 142] [added: 119] | | $ | [removed: 148] [added: 144] | | $ | [removed: 179] [added: 168] | | $ | [removed: 210] [added: 168] |
[removed: However, all] [added: Any] future [removed: dividend declarations are] [added: share repurchases will be made] at the discretion of [removed: the Board of Directors] [added: management] and [added: will] depend on various [removed: factors,] [added: factors] including our net earnings, financial condition, cash required for future business [removed: plans] [added: plans,] and [removed: other factors the Board of Directors may deem relevant.][added: growth and acquisitions.]
We announced in December [removed: 2016] [added: 2017] that the Board of Directors authorized up to [removed: $750 million] [added: $1.25 billion] in future share repurchases.
The following table summarizes common stock repurchases made during the fourth quarter of [removed: 2017] [added: 2018] (shares in millions):
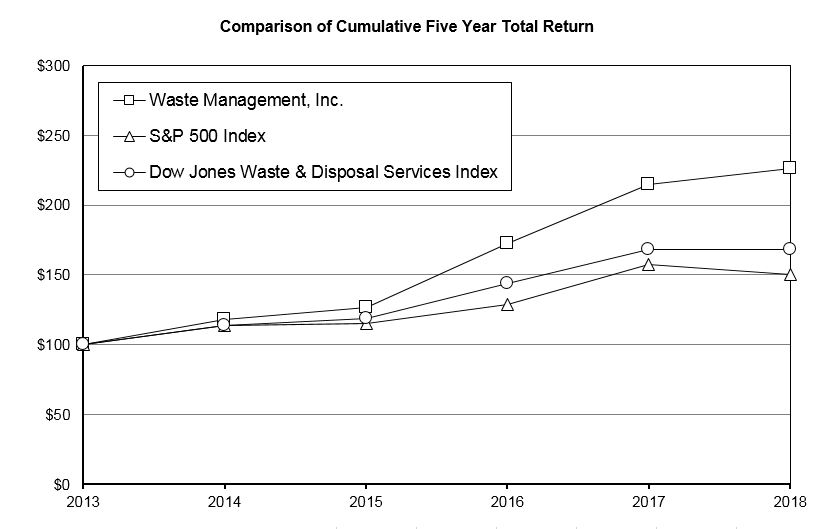
| | | 12/31/13 | | | 12/31/14 | | | 12/31/15 | | | 12/31/16 | | | 12/31/17 | | | 12/31/18 | |
| Waste Management, Inc. | | $ | 100 | | $ | 118 | | $ | 127 | | $ | 173 | | $ | 215 | | $ | 226 |
| S&P 500 Index | | $ | 100 | | $ | 114 | | $ | 115 | | $ | 129 | | $ | 157 | | $ | 150 |
During 2018, we repurchased an aggregate of $1,008 million of our common stock under accelerated share repurchase (“ASR”) agreements and open market repurchases, which equated to 11.7 million shares with a weighted average price per share of $86.35.
| October 1 — 31 | | 2.8 | | $ | 89.60 | (a) | 2.8 | | $ | 252 million | |
| November 1 — 30 | | — | | $ | — | | — | | $ | 252 million | |
| December 1 — 31 | | 0.5 | | $ | 88.88 | (b) | 0.5 | | $ | 1.5 billion | (c) |
| Total | | 3.3 | | $ | 89.49 | | 3.3 | | | | |
| | (a) | | In October 2018, we completed an ASR agreement that was entered into in July 2018 to repurchase $200 million of our common stock. At the beginning of the repurchase period, we delivered $200 million in cash and received 1.8 million shares. The ASR agreement completed in October 2018, at which time we received 0.4 million additional shares. At the beginning of October, subsequent to the completion of the July 2018 ASR agreement, we repurchased 0.5 million shares of our common stock in open market transactions in compliance with Rule 10b5-1 and Rule 10b‑18 of the Exchange Act for $48 million, inclusive of per-share commissions. |
At the end of October 2018, we entered into a new ASR agreement to repurchase $200 million of our common stock.
At the beginning of the repurchase period, we delivered $200 million in cash and received 1.9 million shares.
The October 2018 ASR agreement completed in December 2018.
The “Average Price Paid per Share” in the table represents the final weighted average price per share paid for the completed ASR agreements and the open market repurchases.
| | (b) | | In December 2018, we completed the October 2018 ASR agreement discussed above at which time we received 0.4 million additional shares. Subsequent to the completion of the October 2018 ASR agreement, we repurchased an additional 0.1 million shares of our common stock in open market transactions in compliance with Rule 10b5-1 and Rule 10b-18 of the Exchange Act for $10 million, inclusive of per-share commissions. The “Average Price Paid per Share” in the table represents the final weighted average price per share paid for the completed ASR agreement and the open market repurchases. |
| | (c) | | We announced in December 2018 that the Board of Directors has authorized up to $1.5 billion in future share repurchases, which supersedes and replaces remaining authority under any prior Board of Directors authorization for share repurchases after the completion of our current open market repurchase plan ending February 15, 2019. |
| --- | --- | --- | --- |
Our common stock is traded on the New York Stock Exchange (“NYSE”) under the symbol “WM.” The following table sets forth the range of the high and low per share sales prices for our common stock as reported on the NYSE:
| | | | | | | |
| --- | --- | --- | --- | --- | --- | --- |
| | | High | | | Low | |
| 2016 | | | | | | |
| First Quarter | | $ | 59.99 | | $ | 50.36 |
| Second Quarter | | | 66.27 | | | 56.06 |
| Third Quarter | | | 70.49 | | | 62.42 |
| Fourth Quarter | | | 71.71 | | | 61.09 |
| 2017 | | | | | | |
| First Quarter | | $ | 73.90 | | $ | 69.00 |
| Second Quarter | | | 74.57 | | | 70.10 |
| Third Quarter | | | 78.80 | | | 73.18 |
| Fourth Quarter | | | 86.89 | | | 75.87 |
| 2018 | | | | | | |
| First Quarter (through February 8, 2018) | | $ | 89.73 | | $ | 78.89 |
On February 8, 2018, the closing sales price as reported on the NYSE was $79.12 per share.
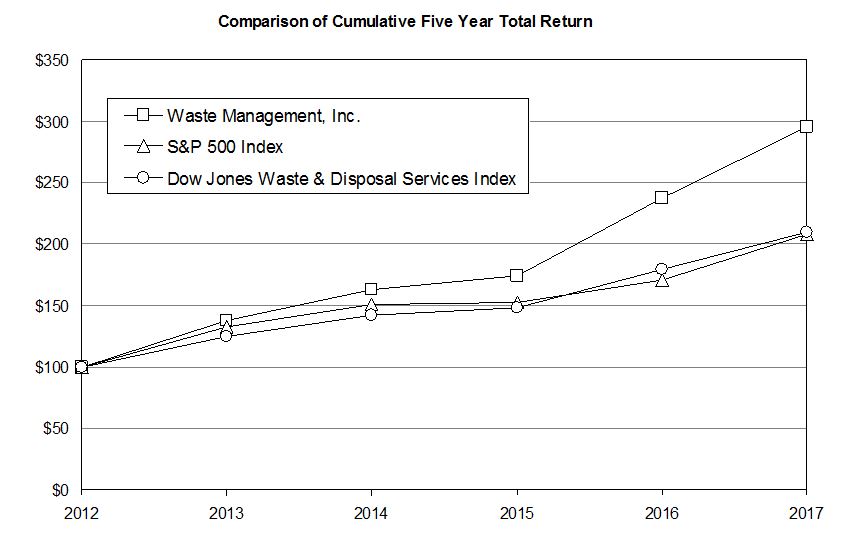
| | | 12/31/12 | | | 12/31/13 | | | 12/31/14 | | | 12/31/15 | | | 12/31/16 | | | 12/31/17 | |
| Waste Management, Inc. | | $ | 100 | | $ | 138 | | $ | 163 | | $ | 174 | | $ | 238 | | $ | 296 |
| S&P 500 Index | | $ | 100 | | $ | 132 | | $ | 151 | | $ | 153 | | $ | 171 | | $ | 208 |
Our quarterly dividends have been declared by our Board of Directors.
Cash dividends declared and paid were $750 million in 2017, or $1.70 per common share, $726 million in 2016, or $1.64 per common share, and $695 million in 2015, or $1.54 per common share.
In December 2017, we announced that our Board of Directors expects to increase the quarterly dividend from $0.425 to $0.465 per share for dividends declared in 2018.
During 2017, we repurchased an aggregate of $750 million of our common stock under accelerated share repurchase (“ASR”) agreements.
We received a total of 9.7 million shares pursuant to these ASR agreements with a weighted average per share purchase price of $77.67.
| October 1 — 31 | | — | | $ | — | | — | | $ | — | |
| November 1 — 30 | | — | | $ | — | | — | | $ | — | |
| December 1 — 31 | | 1.0 | (a) | $ | 79.47 | (a) | 1.0 | (a) | $ | 1.25 billion | (b) |
| Total | | 1.0 | | $ | 79.47 | | 1.0 | | | | |
| | (a) | | In August 2017, we entered into an ASR agreement to repurchase $500 million of our common stock, and the “Average Price Paid per Share” in the table above is the final weighted average per share purchase price paid for all shares repurchased pursuant to the ASR agreement. At the beginning of the repurchase period, we delivered $500 million in cash and received 5.3 million shares based on a stock price of $75.25 per share. The ASR agreement completed in December 2017, at which time we received 1.0 million additional shares. |
| | (b) | | We announced in December 2017 that the Board of Directors has authorized up to $1.25 billion in future share repurchases. |
Any future share repurchases will be made at the discretion of management and will depend on factors similar to those considered by the Board of Directors in making dividend declarations.
Item 6. Selected Financial Data.
12 rewritten, 2 added, 0 removed, 11 unchanged
| | | [removed: 2017(a)] [added: 2018(a)] | | | [removed: 2016(a)] [added: 2017(a)] | | | [removed: 2015(a)] [added: 2016(a)] | | | [removed: 2014] [added: 2015] | | | [removed: 2013] [added: 2014] | |
| Operating revenues | | $ | [removed: 14,485] [added: 14,914] | | $ | [removed: 13,609] [added: 14,485] | | $ | [removed: 12,961] [added: 13,609] | | $ | [removed: 13,996] [added: 12,961] | | $ | [removed: 13,983] [added: 13,996] |
| Consolidated net income | | | [added: 1,923 | | |] 1,949 | | | 1,180 | | | 752 | | | 1,338 | [removed: | | 130 |]
| Net income attributable to Waste Management, Inc. | | | [added: 1,925 | | |] 1,949 | | | 1,182 | | | 753 | | | 1,298 | [removed: | | 98 |]
| Basic earnings per common share | | | [added: 4.49 | | |] 4.44 | | | 2.66 | | | 1.66 | | | 2.80 | [removed: | | 0.21 |]
| Diluted earnings per common share | | | [added: 4.45 | | |] 4.41 | | | 2.65 | | | 1.65 | | | 2.79 | [removed: | | 0.21 |]
| Cash dividends declared per common share | | | [added: 1.86 | | |] 1.70 | | | 1.64 | | | 1.54 | | | 1.50 | [removed: | | 1.46 |]
| Working capital (deficit) [added: (b)] | | $ | [removed: (638)] [added: (463)] | | $ | [removed: (418)] [added: (568)] | | $ | [removed: (165)] [added: (418)] | | $ | [removed: 41] [added: (165)] | | $ | [removed: (628)] [added: 41] |
| Total assets | | | [added: 22,650 | | |] 21,829 | | | 20,859 | | | 20,367 | | | 21,252 | [removed: | | 22,441 |]
| Long-term debt, including current portion | | | [added: 10,026 | | |] 9,491 | | | 9,310 | | | 8,929 | | | 9,390 | [removed: | | 10,177 |]
| Total Waste Management, Inc. stockholders’ equity | | | [added: 6,275 | | |] 6,019 | | | 5,297 | | | 5,345 | | | 5,866 | [removed: | | 5,707 |]
| Total equity | | | [added: 6,276 | | |] 6,042 | | | 5,320 | | | 5,367 | | | 5,889 | [removed: | | 6,002 |]
| | (b) | | Prior year information was revised to conform to our current year presentation. |
| --- | --- | --- | --- |
Item 8. Financial Statements and Supplementary Data.
569 rewritten, 264 added, 267 removed, 1,131 unchanged
| [Reports of Independent Registered Public Accounting Firm](#REPORTOFINDEPENDENTREGISTEREDPUBLICACCOU) | | [removed: 62] [added: 58] |
| [Consolidated Balance Sheets as of December 31, [removed: 2017] [added: 2018] and [removed: 2016](#BALANCESHEETS_191365)] [added: 2017](#BALANCESHEETS_191365)] | | [removed: 64] [added: 60] |
| [Consolidated Statements of Operations for the Years Ended December 31, [removed: 2017, 2016] [added: 2018, 2017] and [removed: 2015](#STATEMENTSOFOPERATIONS_745891)] [added: 2016](#STATEMENTSOFOPERATIONS_745891)] | | [removed: 65] [added: 61] |
| [Consolidated Statements of Comprehensive Income for the Years Ended December 31, [removed: 2017, 2016] [added: 2018, 2017] and [removed: 2015](#COMPREHENSIVEINCOME_932746)] [added: 2016](#COMPREHENSIVEINCOME_932746)] | | [removed: 65] [added: 61] |
| [Consolidated Statements of Cash Flows for the Years Ended December 31, [removed: 2017, 2016] [added: 2018, 2017] and [removed: 2015](#CASHFLOWS_594152)] [added: 2016](#CASHFLOWS_594152)] | | [removed: 66] [added: 62] |
| [Consolidated Statements of Changes in Equity for the Years Ended December 31, [removed: 2017, 2016] [added: 2018, 2017] and [removed: 2015](#CHANGESINEQUITY_625544)] [added: 2016](#CHANGESINEQUITY_625544)] | | [removed: 67] [added: 63] |
| [Notes to Consolidated Financial Statements](#NOTESTOCONSOLIDATEDFINANCIALSTATEMENTS_4) | | [removed: 68] [added: 64] |
We have audited Waste Management, Inc.’s internal control over financial reporting as of December 31, [removed: 2017,] [added: 2018,] based on criteria established in Internal Control-Integrated Framework issued by the Committee of Sponsoring Organizations of the Treadway Commission (2013 framework) (the COSO criteria).
In our opinion, Waste Management, Inc. (the Company) maintained, in all material respects, effective internal control over financial reporting as of December 31, [removed: 2017,] [added: 2018,] based on the COSO criteria.
We also have audited, in accordance with the standards of the Public Company Accounting Oversight Board (United States) (PCAOB), the [removed: 2017] [added: 2018] consolidated financial statements of the Company, and our report dated February [removed: 15, 2018] [added: 14, 2019] expressed an unqualified opinion thereon.
| Houston, Texas February [removed: 15, 2018] [added: 14, 2019] | |
We have audited the accompanying consolidated balance sheets of Waste Management, Inc. (the Company) as of December 31, [removed: 2017 and 2016,] [added: 2018] and [added: 2017,] the related consolidated statements of operations, comprehensive income, cash flows, and changes in equity for each of the three years in the period ended December 31, [removed: 2017,] [added: 2018,] and the related notes (collectively referred to as the “consolidated financial statements”).
In our opinion, the consolidated financial statements present fairly, in all material respects, the financial position of the Company at December 31, [removed: 2017] [added: 2018] and [removed: 2016,] [added: 2017,] and the results of its operations and its cash flows for each of the three years in the period ended December 31, [removed: 2017,] [added: 2018,] in conformity with U.S. generally accepted accounting principles.
We also have audited, in accordance with the standards of the Public Company Accounting Oversight Board (United States) (PCAOB), the Company’s internal control over financial reporting as of December 31, [removed: 2017,] [added: 2018,] based on criteria established in Internal Control-Integrated Framework issued by the Committee of Sponsoring Organizations of the Treadway Commission (2013 framework), and our report dated February [removed: 15, 2018] [added: 14, 2019] expressed an unqualified opinion thereon.
[removed: WASTE MANAGEMENT, INC.][added: | Waste Management, Inc. stockholders’ equity: | | | | | |]
| | [removed: |] December 31, | | | | |
| | | [added: 2018 | | |] 2017 | | | 2016 | |
| ASSETS | | | | | | [removed: |]
| Current assets: | | | | | | [removed: |]
| Cash and cash equivalents | [removed: |] $ | [removed: 22] [added: 61] | | $ | [removed: 32] [added: 22] |
| Accounts receivable, net of allowance for doubtful accounts of [removed: $21] [added: $29] and [removed: $24,] [added: $21,] respectively | | [removed: | 1,805] [added: 1,931] | | | [removed: 1,700] [added: 1,805] |
| Other receivables | | [removed: | 569] [added: 344] | | | [removed: 432] [added: 569] |
| Parts and supplies | | [removed: | 96] [added: 102] | | | [removed: 90] [added: 96] |
| Other assets | | | [removed: 132] [added: (14)] | | | [removed: 122] [added: (66)] | [added: | | 75 |]
| Total [removed: current assets] [added: Assets] | | [added: $] | [removed: 2,624] [added: 424] | | [added: $] | [removed: 2,376] [added: 376] |
| Property and equipment, net of accumulated depreciation and amortization of [removed: $17,704] [added: $18,264] and [removed: $17,152,] [added: $17,704,] respectively | | [removed: | 11,559] [added: 11,942] | | | [removed: 10,950] [added: 11,559] |
| Goodwill | | [removed: | 6,247] [added: 6,430] | | | [removed: 6,215] [added: 6,247] |
| Other intangible assets, net | | [removed: | 547] [added: 572] | | | [removed: 591] [added: 547] |
| Restricted trust and escrow accounts | | [removed: | 319] [added: 296] | | | [removed: 105] [added: 249] |
| Investments in unconsolidated entities | | [removed: | 269] [added: 406] | | | [removed: 320] [added: 269] |
| Other assets | | [removed: | 264] [added: 359] | | | [removed: 302] [added: 264] |
| Total assets | [removed: |] $ | [removed: 21,829] [added: 22,650] | | $ | [removed: 20,859] [added: 21,829] |
| LIABILITIES AND EQUITY | | | | | | [removed: |]
| Current liabilities: | | | | | | [removed: |]
| Accounts payable | [removed: |] $ | [removed: 1,040] [added: 1,037] | | $ | [removed: 799] [added: 1,040] |
| Accrued liabilities | | [removed: | 980] [added: 1,117] | | | [removed: 1,085] [added: 980] |
| Deferred revenues | | [removed: | 503] [added: 522] | | | [removed: 493] [added: 503] |
| Current portion of long-term debt | | [removed: | 739] [added: 432] | | | [removed: 417] [added: 739] |
| Total current liabilities | | [removed: | 3,262] [added: 3,108] | | | [removed: 2,794] [added: 3,262] |
| Long-term debt, less current portion | | [removed: | 8,752] [added: 9,594] | | | [removed: 8,893] [added: 8,752] |
| Houston, Texas February 14, 2019 | |
| Total current assets | | 2,645 | | | 2,694 |
| Consolidated net income | | $ | 1,923 | | $ | 1,949 | | $ | 1,180 |
| Depreciation and amortization | | | 1,477 | | | 1,376 | | | 1,301 |
| Increase (decrease) in cash, cash equivalents and restricted cash and cash equivalents | | | (110) | | | 199 | | | (10) |
| Cash, cash equivalents and restricted cash and cash equivalents at end of period | | $ | 183 | | $ | 293 | | $ | 94 |
| Restricted cash and cash equivalents included in other current assets | | | 49 | | | 70 | | | — |
| Restricted cash and cash equivalents included in restricted trust and escrow accounts | | | 73 | | | 201 | | | 62 |
| Cash, cash equivalents and restricted cash and cash equivalents at end of period | | $ | 183 | | $ | 293 | | $ | 94 |
| Adoption of new accounting standards | | | 80 | | — | | | — | | | — | | | 85 | | | (5) | | — | | | — | | | — |
| Divestiture of noncontrolling interest | | | (19) | | — | | | — | | | — | | | — | | | — | | — | | | — | | | (19) |
| Balance, December 31, 2018 | | $ | 6,276 | | 630,282 | | $ | 6 | | $ | 4,993 | | $ | 9,797 | | $ | (87) | | (206,299) | | $ | (8,434) | | $ | 1 |
On January 1, 2018, we adopted ASU 2014-09 using the modified retrospective approach for all ongoing customer contracts.
Our results of operations for the reported periods after January 1, 2018 are presented under this amended guidance, while prior period amounts are not adjusted and continue to be reported in accordance with historical accounting guidance.
The impact of adopting the amended guidance primarily relates to (i) the deferral of certain sales incentives, which previously were expensed as incurred, but under the new guidance are capitalized as other assets and amortized to selling, general and administrative expenses over the expected life of the customer relationship and (ii) the recognition of certain consideration payable to our customers as a reduction in operating revenues, which under historical guidance was recorded as operating expenses.
We recognized a net $80 million increase to our retained earnings as of January 1, 2018 for the cumulative impact of adopting the amended guidance associated with the capitalization of sales incentives as contract acquisition costs consisting of a $108 million asset and a related $28 million deferred tax liability.
There were no material impacts on our consolidated financial statements, which include these changes, as a result of our adoption of this amended guidance.
For contracts with an effective term greater than one year, we applied the standard’s practical expedient that permits the exclusion of unsatisfied performance obligations as our right to consideration corresponds directly to the value provided to the customer for services completed to date and all future variable consideration is allocated to wholly unsatisfied performance obligations.
We also applied the standard’s optional exemption for performance obligations related to contracts that have an original expected duration of one year or less.
See Note 3 for additional information and disclosures related to this amended guidance.
It further states that an entity may choose to measure equity investments that do not have readily determinable fair values using a quantitative approach, or measurement alternative, which is equal to its cost minus impairment, if any, plus or minus changes resulting from observable price changes in orderly transactions for the identical or a similar investment of the same issuer.
We concluded that all equity investments within the scope of ASU 2016-01, which primarily relate to equity securities previously accounted for under the cost method, do not have readily determinable fair values.
Accordingly, the value of these investments beginning January 1, 2018 has been measured using a quantitative approach, or the measurement alternative, as noted above.
See Note 3 for additional information and disclosures related to this amended guidance.
| | · | | Cash, cash equivalents and restricted cash and cash equivalents reported on the Consolidated Statements of Cash Flows now includes restricted cash and cash equivalents of $65 million, $62 million and $271 million as of December 31, 2015, 2016 and 2017, respectively, in restricted trust and escrow accounts and other current assets in our Consolidated Balance Sheets as well as previously reported cash and cash equivalents. |
| | · | | Cash payments made within 120 days of the acquisition date of a business combination to settle a contingent consideration liability are classified as cash outflows from investing activities. Thereafter, cash payments up to the amount of the contingent consideration liability recognized at the acquisition date (including measurement period adjustments) are classified as cash outflows from financing activities and any excess is classified as cash outflows from operating activities. The adoption of this amended guidance did not have a material impact on our Consolidated Statements of Cash Flows. |
Our restricted cash and cash equivalents generally consist of funds deposited into specific accounts for purposes of funding insurance claims and demonstrating our ability to meet our landfill final capping, closure, post-closure and environmental remediation obligations.
Reclassification of Certain Tax Effects from Accumulated Other Comprehensive Income — In February 2018, the FASB issued ASU 2018-02 associated with the reclassification of certain tax effects from accumulated other comprehensive income (loss).
This amended guidance allows a reclassification from accumulated other comprehensive income (loss) to retained earnings for stranded tax effects resulting from the Tax Cuts and Jobs Act (the “Act”) which was signed into law on December 22, 2017.
We early adopted this amended guidance on January 1, 2018, and as a result, elected to reclassify $5 million of stranded tax effects from accumulated other comprehensive income (loss) to retained earnings using a specific identification approach.
See Note 12 for additional disclosures related to this amended guidance.
Income Taxes — In March 2018, the FASB issued ASU 2018-05 associated with the accounting and disclosures around the enactment of the Act and the Securities and Exchange Commission’s Staff Accounting Bulletin No. 118, Income Tax Accounting Implications of the Tax Cuts and Jobs Act (“SAB 118”), which the Company has adopted.
See Note 8 for the disclosures related to this amended guidance.
There have been further amendments, including practical expedients, with the issuance of ASU 2018-01 in January 2018, ASU 2018-11 in July 2018 and ASU 2018-20 in December 2018.
We elected the optional transition method which allows entities to continue to apply historical accounting guidance in the comparative periods presented in the year of adoption.
At transition, lessees and lessors may elect to apply a package of practical expedients permitting entities not to reassess: (i) whether any expired or existing contracts are or contain leases; (ii) lease classification for any expired or existing leases and (iii) whether initial direct costs for any expired or existing leases qualify for capitalization under the amended guidance.
These practical expedients must be elected as a package and consistently applied.
We have elected to apply the package of practical expedients upon adoption.
We identified our leases or other contracts impacted by the new standard and are currently in the process of (i) finalizing our implementation of a software solution to manage and account for leases under the new standard and (ii) updating our business processes and related policies, systems and controls to support recognition and disclosure under the new standard.
Upon adoption of the amended guidance, we expect to recognize right-of-use assets and related liabilities of approximately $300 million to $350 million for our contracts which contain an operating lease.
| --- | --- | --- |
| --- | --- | --- | --- | --- | --- | --- |
| Total Waste Management, Inc. stockholders’ equity | | | 6,019 | | | 5,297 |
| Loss on early extinguishment of debt | | | (6) | | | (4) | | | (555) |
| Loss on early extinguishment of debt | | | 6 | | | 4 | | | 555 |
| Net receipts from restricted trust and escrow accounts | | | 243 | | | — | | | 51 |
| Premiums paid on early extinguishment of debt | | | (8) | | | (2) | | | (555) |
| Balance, December 31, 2014 | | $ | 5,889 | | 630,282 | | $ | 6 | | $ | 4,585 | | $ | 6,888 | | $ | 23 | | (171,745) | | $ | (5,636) | | $ | 23 |
Equity-Based Compensation — In March 2016, the Financial Accounting Standards Board (“FASB”) issued Accounting Standards Update (“ASU”) 2016‑09 associated with equity-based compensation as part of its simplification initiative to reduce the cost and complexity of compliance with U.S. Generally Accepted Accounting Principles (“GAAP”), while maintaining or improving the usefulness of the information provided.
| | · | | Excess tax benefits or deficiencies for share-based payments are now recorded as a discrete item in the period shares vest or stock options are exercised as an adjustment to income tax expense or benefit rather than additional paid-in capital. This change was applied prospectively as of January 1, 2017. The Company did not have any excess tax benefits that were not previously recognized as of January 1, 2017. See Note 8 for discussion of the current year impact; |
| | · | | As of January 1, 2017, the calculation of diluted weighted average shares outstanding was changed prospectively to no longer include excess tax benefits as assumed proceeds. This change did not have a material impact on our current year diluted earnings per share; |
| | · | | Cash flows related to excess tax benefits or deficiencies are included in net cash provided by operating activities rather than as a financing activity. The Company adopted this change retrospectively, which resulted in an increase to net cash provided by operating activities and a corresponding increase to net cash used in financing activities of $28 million and $15 million for the years ended December 31, 2016 and 2015, respectively; |
| | · | | Cash paid to taxing authorities when withholding shares from an employee’s vesting or exercise of equity-based compensation awards for tax-withholding purposes is now considered a repurchase of the Company’s equity instruments and is classified as net cash used in financing activities rather than as an operating activity. The Company adopted this change retrospectively, which resulted in an increase to net cash provided by operating |
NOTES TO CONSOLIDATED FINANCIAL STATEMENTS — (Continued)
| activities and a corresponding increase to net cash used in financing activities of $18 million and $15 million for the years ended December 31, 2016 and 2015, respectively; and |
| --- |
| | · | | The Company elected to continue to estimate forfeitures rather than account for forfeitures as they occur. |
Goodwill Impairment Testing — In January 2017, the FASB issued ASU 2017‑04 which simplifies the goodwill impairment test by eliminating Step 2 of the quantitative assessment and should reduce the cost and complexity of evaluating goodwill for impairment.
Under the amended guidance, when a quantitative assessment is required, an entity will perform a goodwill impairment test by comparing the estimated fair value of a reporting unit with its carrying amount.
An impairment charge will be measured as the amount by which the carrying amount exceeds the reporting unit’s estimated fair value, not to exceed the total amount of recorded goodwill.
We make efforts to control our exposure to credit risk associated with these instruments by (i) placing our assets and other financial interests
| before the landfill is certified as closed by the applicable state regulatory agency. These costs are recorded as an asset retirement obligation as airspace is consumed over the life of the landfill with a corresponding increase in the landfill asset. Closure obligations are recorded over the life of the landfill based on estimates of the discounted cash flows associated with performing closure activities. |
Changes in such
One landfill required approval by our Chief Financial Officer because of community or political opposition that
could impede the expansion process.
The remaining two landfills required approval because the permit application process did not meet the one- or five-year requirements.
resources or by third-party environmental engineers or other service providers.
| | | | | | | | | | | |
| --- | --- | --- | --- | --- | --- | --- | --- | --- | --- | --- |
| Risk-free discount rate applied to environmental remediation liabilities and recovery assets | | | 2.5 | % | | 2.5 | % | | 2.25 | % |
| | | |
the landfill asset, which is amortized on a units-of-consumption basis over the shorter of the lease term or the life of the landfill.
amounts may not be recoverable.
We assess whether an impairment exists using a quantitative assessment.
| Cost method investments | | | 142 | | | 147 |
The fees charged for our services are generally defined in our service agreements and vary based on contract-specific terms such as frequency of service, weight, volume and the general market factors influencing a region’s rates.
During
During 2017, we had $452 million of non-cash financing activities due to the initial funding of a wholly-owned insurance captive and tax-exempt bond borrowings.
| | | $ | 1,675 | | $ | 251 | | $ | 1,926 | | $ | 1,576 | | $ | 246 | | $ | 1,822 |
| December 31, 2016 | | $ | 1,576 | | $ | 246 |
An excerpt. Shown here: 40 of 569 rewritten, 40 of 264 added and 40 of 267 removed. The counts are complete. For every sentence, read Item 8. Financial Statements and Supplementary Data. in the FY2018 filing and the FY2017 filing.
Item 9A. Controls and Procedures.
5 rewritten, 0 added, 0 removed, 15 unchanged
Based on such evaluation, our principal executive and financial officers have concluded that such disclosure controls and procedures were effective as of December 31, [removed: 2017] [added: 2018] (the end of the period covered by this Annual Report on Form 10‑K).
Management of the Company assessed the effectiveness of our internal control over financial reporting as of December 31, [removed: 2017] [added: 2018] based on the Internal Control — Integrated Framework issued by the Committee of Sponsoring Organizations of the Treadway Commission (2013 framework).
Based on this assessment, management has concluded that our internal control over financial reporting was effective as of December 31, [removed: 2017.][added: 2018.]
Management, together with our CEO and CFO, evaluated the changes in our internal control over financial reporting during the quarter ended December 31, [removed: 2017.][added: 2018.]
We determined that there were no changes in our internal control over financial reporting during the quarter ended December 31, [removed: 2017] [added: 2018] that have materially affected, or are reasonably likely to materially affect, our internal control over financial reporting.
Item 10. Directors, Executive Officers and Corporate Governance.
1 rewritten, 0 added, 0 removed, 3 unchanged
The information required by this Item is incorporated by reference to the sections entitled “Board of Directors,” “Section 16(a) Beneficial Ownership Reporting Compliance,” and “Executive Officers,” in the Company’s definitive Proxy Statement for its [removed: 2018] [added: 2019] Annual Meeting of Stockholders (the “Proxy Statement”), to be held May 14, [removed: 2018.][added: 2019.]
Item 15. Exhibits, Financial Statement Schedules.
39 rewritten, 1 added, 12 removed, 30 unchanged
Consolidated Balance Sheets as of December 31, [removed: 2017] [added: 2018] and [removed: 2016][added: 2017]
Consolidated Statements of Operations for the years ended December 31, [removed: 2017, 2016] [added: 2018, 2017] and [removed: 2015][added: 2016]
Consolidated Statements of Comprehensive Income for the years ended December 31, [removed: 2017, 2016] [added: 2018, 2017] and [removed: 2015][added: 2016]
Consolidated Statements of Cash Flows for the years ended December 31, [removed: 2017, 2016] [added: 2018, 2017] and [removed: 2015][added: 2016]
Consolidated Statements of Changes in Equity for the years ended December 31, [removed: 2017, 2016] [added: 2018, 2017] and [removed: 2015][added: 2016]
All [removed: other] schedules have been omitted because the required information is not significant or is included in the financial statements or notes thereto, or is not applicable.
| 3.2 | — | [Amended and Restated By-laws of Waste Management, Inc. \[incorporated by reference to Exhibit 3.2 to Form 8‑K dated [removed: November 13, 2017\].](http://www.sec.gov/Archives/edgar/data/823768/000110465917067720/a17-26373_1ex3d2.htm)] [added: February 19, 2018\].](http://www.sec.gov/Archives/edgar/data/823768/000110465918011700/a18-6740_1ex3d2.htm)] |
| [removed: 4.6*] [added: 4.6] | — | [Officers’ Certificate delivered pursuant to Section 301 of the Indenture dated September 10, 1997 by and between Waste Management, Inc. and The Bank of New York Mellon Trust Company, N.A., as Trustee, establishing the terms and form of Waste Management, Inc.’s 3.150% Senior Notes due [removed: 2027.](https://www.sec.gov/Archives/edgar/data/823768/000155837018000716/wm-20171231ex46aca6a46.htm)] [added: 2027 \[incorporated by reference to Exhibit 4.6 to Form 10-K for the year ended December 31, 2017\].](http://www.sec.gov/Archives/edgar/data/823768/000155837018000716/wm-20171231ex46aca6a46.htm)] |
| [removed: 4.7*] [added: 4.7] | — | [Guarantee Agreement by Waste Management Holdings, Inc. in favor of The Bank of New York Mellon Trust Company, N.A., as Trustee for the holders of Waste Management, Inc.’s 3.150% Senior Notes due [removed: 2027.](https://www.sec.gov/Archives/edgar/data/823768/000155837018000716/wm-20171231ex47349167a.htm)] [added: 2027 \[incorporated by reference to Exhibit 4.7 to Form 10-K for the year ended December 31, 2017\].](http://www.sec.gov/Archives/edgar/data/823768/000155837018000716/wm-20171231ex47349167a.htm)] |
| 4.8* | — | [Schedule of Officers’ Certificates delivered pursuant to Section 301 of the Indenture dated September 10, 1997 establishing the terms and form of Waste Management, Inc.’s Senior Notes. Waste Management and its subsidiaries are parties to debt instruments that have not been filed with the SEC under which the total amount of securities authorized under any single instrument does not exceed 10% of the total assets of Waste Management and its subsidiaries on a consolidated basis. Pursuant to paragraph 4(iii)(A) of Item 601(b) of Regulation S-K, Waste Management agrees to furnish a copy of such instruments to the SEC upon [removed: request.](https://www.sec.gov/Archives/edgar/data/823768/000155837018000716/wm-20171231ex48cec62cb.htm)] [added: request.](https://www.sec.gov/Archives/edgar/data/823768/000155837019000662/wm-20181231ex48109ff5b.htm)] |
| [removed: 10.7] [added: 10.8] | — | [$2.25 Billion Third Amended and Restated Revolving Credit Agreement dated as of July 10, 2015 by and among Waste Management, Inc. and Waste Management Holdings, Inc. and certain banks party thereto, [added: and] Bank of America, N.A., as administrative [removed: agent, JPMorgan Chase Bank, N.A. and Barclays Bank PLC, as syndication agents, BNP Paribas, Citibank, N.A., Deutsche Bank Securities Inc., The Bank of Tokyo-Mitsubishi UFJ, Ltd., Mizuho Bank, Ltd., U.S. Bank National Association and Wells Fargo Bank, National Association, as co-documentation agents and J.P. Morgan Securities LLC, Merrill Lynch, Pierce, Fenner & Smith Incorporated, and Barclays Bank PLC, as lead arrangers and joint bookrunners] [added: agent] \[incorporated by reference to Exhibit 10.1 to Form 8‑K dated July 10, 2015\].](http://www.sec.gov/Archives/edgar/data/823768/000119312515252401/d99371dex101.htm) |
| [removed: 10.8] [added: 10.9] | — | [CDN$509,500,000 Credit Facilities Amended and Restated Credit Agreement by and among Waste Management of Canada Corporation and WM Quebec Inc., as borrowers, Waste Management, Inc. and Waste Management Holdings, Inc., as guarantors, The Bank of Nova Scotia, as administrative agent, JPMorgan Chase Bank, N.A., Bank of America, N.A. and PNC Bank Canada Branch, as co-syndication agents, The Bank of Nova Scotia, JPMorgan Chase Bank, N.A., Merrill Lynch, Pierce, Fenner & Smith Incorporated and PNC Capital Markets LLC, as joint lead arrangers and joint bookrunners and the Lenders from time to time party thereto \[incorporated by reference to Exhibit 10.1 to Form 8‑K dated March 24, 2016\].](http://www.sec.gov/Archives/edgar/data/823768/000119312516521391/d135663dex101.htm) |
| [removed: 10.9] [added: 10.10] | — | [Commercial Paper Dealer Agreement, substantially in the form as executed with each of Mizuho Securities USA Inc., Merrill Lynch, Pierce, Fenner & Smith Incorporated, and J.P. Morgan Securities LLC, as Dealer, dated August 22, 2016 \[incorporated by reference to Exhibit 10.11 to Form 10‑K for the year ended December 31, 2016\].](http://www.sec.gov/Archives/edgar/data/823768/000119312517046480/d252547dex1011.htm) |
| [removed: 10.10] [added: 10.11] | — | [Commercial Paper Issuing and Paying Agent Agreement between Waste Management, Inc. and Bank of America, National Association dated August 15, 2016 \[incorporated by reference to Exhibit 10.12 to Form 10‑K for the year ended December 31, 2016\].](http://www.sec.gov/Archives/edgar/data/823768/000119312517046480/d252547dex1012.htm) |
| [removed: 10.11†] [added: 10.15†] | — | [removed: [Employment] [added: [Amendment to Employment] Agreement between the Company and James [removed: C. Fish,] [added: E. Trevathan,] Jr. [removed: dated August 15, 2011] \[incorporated by reference to Exhibit [removed: 10.2] [added: 10.3] to Form [removed: 10‑Q for the quarter ended September 30, 2011\].](http://www.sec.gov/Archives/edgar/data/823768/000095012311092385/h84353exv10w2.htm)] [added: 8‑K dated March 9, 2011\].](http://www.sec.gov/Archives/edgar/data/823768/000095012311024530/h80480exv10w3.htm)] |
| [removed: 10.12†] [added: 10.14†] | — | [removed: [First Amendment to Employment] [added: [Employment] Agreement between the Company and James [removed: C. Fish,] [added: E. Trevathan,] Jr. dated [removed: July 20, 2012] [added: June 1, 2000] \[incorporated by reference to Exhibit [removed: 10.3] [added: 10.20] to Form [removed: 10‑Q] [added: 10‑K] for the [removed: quarter] [added: year] ended [removed: June 30, 2012\].](http://www.sec.gov/Archives/edgar/data/823768/000119312512316664/d352342dex103.htm)] [added: December 31, 2000\].](http://www.sec.gov/Archives/edgar/data/823768/000095012901001398/h84376ex10-20.txt)] |
| [removed: 10.13†] [added: 10.12†] | — | [First Amended and Restated Employment Agreement between USA Waste-Management Resources, LLC and James C. Fish, Jr. dated December 22, 2017 \[incorporated by reference to Exhibit 10.2 to Form 8-K dated December 22, 2017\].](http://www.sec.gov/Archives/edgar/data/823768/000110465917075030/a17-28786_1ex10d2.htm) |
| [removed: 10.14†] [added: 10.13†] | — | [Employment Agreement between USA Waste-Management Resources, LLC and Devina A. Rankin dated December 22, 2017 \[incorporated by reference to Exhibit 10.3 to Form 8-K dated December 22, 2017\].](http://www.sec.gov/Archives/edgar/data/823768/000110465917075030/a17-28786_1ex10d3.htm) |
| [removed: 10.15†] [added: 10.20†] | — | [Employment Agreement between the Company and [removed: James E. Trevathan, Jr.] [added: Barry H. Caldwell] dated [removed: June 1, 2000] [added: September 23, 2002] \[incorporated by reference to Exhibit [removed: 10.20] [added: 10.24] to Form 10‑K for the year ended December 31, [removed: 2000\].](http://www.sec.gov/Archives/edgar/data/823768/000095012901001398/h84376ex10-20.txt)] [added: 2002\].](http://www.sec.gov/Archives/edgar/data/823768/000095012903000958/h02934exv10w24.txt)] |
| 10.16† | — | [removed: [Amendment to Employment] [added: [Employment] Agreement between the Company and [removed: James E. Trevathan, Jr.] [added: Jeff Harris dated December 1, 2006] \[incorporated by reference to Exhibit [removed: 10.3] [added: 10.1] to Form 8‑K dated [removed: March 9, 2011\].](http://www.sec.gov/Archives/edgar/data/823768/000095012311024530/h80480exv10w3.htm)] [added: December 1, 2006\].](http://www.sec.gov/Archives/edgar/data/823768/000095012906009990/h41867exv10w1.htm)] |
| 10.17† | — | [removed: [Employment] [added: [Amendment to Employment] Agreement [added: by and] between the Company and Jeff Harris [removed: dated December 1, 2006] \[incorporated by reference to Exhibit [removed: 10.1] [added: 10.6] to Form [removed: 8‑K dated December 1, 2006\].](http://www.sec.gov/Archives/edgar/data/823768/000095012906009990/h41867exv10w1.htm)] [added: 10‑Q for the quarter ended March 31, 2011\].](http://www.sec.gov/Archives/edgar/data/823768/000095012311040715/h80290exv10w6.htm)] |
| 10.19† | — | [Employment Agreement between [removed: the Company] [added: USA Waste-Management Resources, LLC] and [removed: John J. Morris, Jr.] [added: Charles C. Boettcher] dated [removed: June 18, 2012] [added: December 22, 2017] \[incorporated by reference to Exhibit [removed: 10.4] [added: 10.23] to Form [removed: 10‑Q] [added: 10-K] for the [removed: quarter] [added: year] ended [removed: June 30, 2012\].](http://www.sec.gov/Archives/edgar/data/823768/000119312512316664/d352342dex104.htm)] [added: December 31, 2017\].](http://www.sec.gov/Archives/edgar/data/823768/000155837018000716/wm-20171231ex10236fa05.htm)] |
| [removed: 10.20†] [added: 10.18†] | — | [First Amended and Restated Employment Agreement between USA Waste-Management Resources, LLC and John J. Morris, Jr. \[incorporated by reference to Exhibit 10.4 to Form 8-K dated December 22, 2017\].](http://www.sec.gov/Archives/edgar/data/823768/000110465917075030/a17-28786_1ex10d4.htm) |
| [removed: 10.21†] [added: 10.22†] | — | [removed: [Employment Agreement between the Company] [added: [Form of Director] and [removed: Barry H. Caldwell dated September 23, 2002] [added: Executive Officer Indemnity Agreement] \[incorporated by reference to Exhibit [removed: 10.24] [added: 10.43] to Form 10‑K for the year ended December 31, [removed: 2002\].](http://www.sec.gov/Archives/edgar/data/823768/000095012903000958/h02934exv10w24.txt)] [added: 2012\].](http://www.sec.gov/Archives/edgar/data/823768/000119312513058892/d413187dex1043.htm)] |
| [removed: 10.22†] [added: 10.25†] | — | [removed: [Employment Offer Letter to Charles C. Boettcher dated August 5,] [added: [Form of] 2016 [added: Individual Restricted Stock Unit Award Agreement] \[incorporated by reference to Exhibit [removed: 10.23] [added: 10.32] to Form 10‑K for the year ended December 31, [removed: 2016\].](http://www.sec.gov/Archives/edgar/data/823768/000119312517046480/d252547dex1023.htm)] [added: 2016\].](http://www.sec.gov/Archives/edgar/data/823768/000119312517046480/d252547dex1032.htm)] |
| [removed: 10.23†*] [added: 10.21†*] | — | [removed: [Employment] [added: [Separation and Release] Agreement between USA Waste-Management Resources, LLC and [removed: Charles C. Boettcher dated December 22, 2017.](https://www.sec.gov/Archives/edgar/data/823768/000155837018000716/wm-20171231ex10236fa05.htm)] [added: Barry H. Caldwell.](https://www.sec.gov/Archives/edgar/data/823768/000155837019000662/wm-20181231ex1021cd10d.htm)] |
| [removed: 10.25†] [added: 10.26†] | — | [removed: [Separation and Release Agreement between the Company and David Steiner dated January 6,] [added: [Form of] 2017 [added: Senior Leadership Team Award Agreement] \[incorporated by reference to Exhibit 10.1 to Form 8‑K dated [removed: January 6, 2017\].](http://www.sec.gov/Archives/edgar/data/823768/000119312517004508/d314907dex101.htm)] [added: February 27, 2017\].](http://www.sec.gov/Archives/edgar/data/823768/000119312517069837/d350228dex101.htm)] |
| [removed: 10.26†] [added: 10.28†] | — | [removed: [Employment] [added: [Form of 2017 Long Term Incentive Compensation Award] Agreement [removed: between the Company and Puneet Bhasin dated December 7, 2009] [added: (Mid-Year Award)] \[incorporated by reference to Exhibit [removed: 10.12] [added: 10.37] to Form [removed: 10‑K] [added: 10-K] for the year ended December 31, [removed: 2009\].](http://www.sec.gov/Archives/edgar/data/823768/000095012310013022/h69024exv10w12.htm)] [added: 2017\].](http://www.sec.gov/Archives/edgar/data/823768/000155837018000716/wm-20171231ex1037b83f8.htm)] |
| [removed: 10.31†] [added: 10.23†] | — | [Waste Management Holdings, Inc. Executive Severance Plan \[incorporated by reference to Exhibit 10.1 to Form 8-K dated December 22, 2017\].](http://www.sec.gov/Archives/edgar/data/823768/000110465917075030/a17-28786_1ex10d1.htm) |
| [removed: 10.32†] [added: 10.24†] | — | [Form of [removed: 2015] [added: 2016] Senior Leadership Team Award Agreement \[incorporated by reference to Exhibit 10.1 to Form 8‑K dated February [removed: 25, 2015\].](http://www.sec.gov/Archives/edgar/data/823768/000119312515075056/d883941dex101.htm)] [added: 26, 2016\].](http://www.sec.gov/Archives/edgar/data/823768/000119312516489993/d142630dex101.htm)] |
| [removed: 10.33†] [added: 10.29†] | — | [Form of [removed: 2016] [added: 2018] Senior Leadership Team Award Agreement \[incorporated by reference to Exhibit 10.1 to Form [removed: 8‑K] [added: 8-K] dated February [removed: 26, 2016\].](http://www.sec.gov/Archives/edgar/data/823768/000119312516489993/d142630dex101.htm)] [added: 19, 2018\].](http://www.sec.gov/Archives/edgar/data/823768/000110465918011700/a18-6740_1ex10d1.htm)] |
| [removed: 10.35†] [added: 10.27†] | — | [removed: [Form of 2017] [added: [2017] Senior Leadership Team Award Agreement [added: with Mr. James E. Trevathan, Jr.] \[incorporated by reference to Exhibit [removed: 10.1] [added: 10.2] to Form 8‑K dated February 27, [removed: 2017\].](http://www.sec.gov/Archives/edgar/data/823768/000119312517069837/d350228dex101.htm)] [added: 2017\].](http://www.sec.gov/Archives/edgar/data/823768/000119312517069837/d350228dex102.htm)] |
| 21.1* | — | [Subsidiaries of the [removed: Registrant.](https://www.sec.gov/Archives/edgar/data/823768/000155837018000716/wm-20171231ex211080b9a.htm)] [added: Registrant.](https://www.sec.gov/Archives/edgar/data/823768/000155837019000662/wm-20181231ex2110beae1.htm)] |
| 23.1* | — | [Consent of Independent Registered Public Accounting [removed: Firm.](https://www.sec.gov/Archives/edgar/data/823768/000155837018000716/wm-20171231ex2313508e5.htm)] [added: Firm.](https://www.sec.gov/Archives/edgar/data/823768/000155837019000662/wm-20181231ex23166ce2d.htm)] |
| 31.1* | — | [Certification Pursuant to Rule 13a‑14(a) and 15d‑14(a) under the Securities Exchange Act of 1934, as amended, of James C. Fish, Jr., President and Chief Executive [removed: Officer.](https://www.sec.gov/Archives/edgar/data/823768/000155837018000716/wm-20171231ex311e9a42e.htm)] [added: Officer.](https://www.sec.gov/Archives/edgar/data/823768/000155837019000662/wm-20181231ex31148c4e8.htm)] |
| 31.2* | — | [Certification Pursuant to Rule 13a‑14(a) and 15d‑14(a) under the Securities Exchange Act of 1934, as amended, of Devina A. Rankin, Senior Vice President and Chief Financial [removed: Officer.](https://www.sec.gov/Archives/edgar/data/823768/000155837018000716/wm-20171231ex31279cc4a.htm)] [added: Officer.](https://www.sec.gov/Archives/edgar/data/823768/000155837019000662/wm-20181231ex3126eb5af.htm)] |
| 32.1 | — | [Certification Pursuant to 18 U.S.C. §1350 of James C. Fish, Jr., President and Chief Executive [removed: Officer.](https://www.sec.gov/Archives/edgar/data/823768/000155837018000716/wm-20171231ex3214f5aa3.htm)] [added: Officer.](https://www.sec.gov/Archives/edgar/data/823768/000155837019000662/wm-20181231ex3213795f3.htm)] |
| 32.2 | — | [Certification Pursuant to 18 U.S.C. §1350 of Devina A. Rankin, Senior Vice President and Chief Financial [removed: Officer.](https://www.sec.gov/Archives/edgar/data/823768/000155837018000716/wm-20171231ex322bed26f.htm)] [added: Officer.](https://www.sec.gov/Archives/edgar/data/823768/000155837019000662/wm-20181231ex322132815.htm)] |
| 95* | — | [Mine Safety [removed: Disclosures.](https://www.sec.gov/Archives/edgar/data/823768/000155837018000716/wm-20171231xex95.htm)] [added: Disclosures.](https://www.sec.gov/Archives/edgar/data/823768/000155837019000662/wm-20181231xex95.htm)] |
| 10.7 | — | [$2.75 Billion Fourth Amended and Restated Revolving Credit Agreement dated as of June 26, 2018 by and among Waste Management, Inc., Waste Management of Canada Corporation, WM Quebec Inc. and Waste Management Holdings, Inc., certain banks party thereto, and Bank of America, N.A., as administrative agent \[incorporated by reference to Exhibit 10.1 to Form 8-K filed June 29, 2018\].](http://www.sec.gov/Archives/edgar/data/823768/000110465918043239/a18-16120_1ex10d1.htm) |
Schedule II — Valuation and Qualifying Accounts
| --- | --- | --- |
| 10.18† | — | [Amendment to Employment Agreement by and between the Company and Jeff Harris \[incorporated by reference to Exhibit 10.6 to Form 10‑Q for the quarter ended March 31, 2011\].](http://www.sec.gov/Archives/edgar/data/823768/000095012311040715/h80290exv10w6.htm) |
| 10.24† | — | [Employment Agreement between the Company and David Steiner dated May 6, 2002 \[incorporated by reference to Exhibit 10.1 to Form 10‑Q for the quarter ended March 31, 2002\].](http://www.sec.gov/Archives/edgar/data/823768/000095012902002335/h96558ex10-1.txt) |
| 10.27† | — | [Separation and Release Agreement between USA Waste-Management Resources, LLC and Puneet Bhasin dated March 10, 2017 \[incorporated by reference to Exhibit 10.3 to Form 10‑Q for the quarter ended March 31, 2017\].](http://www.sec.gov/Archives/edgar/data/823768/000119312517138491/d355982dex103.htm) |
| 10.28† | — | [Employment Agreement between the Company and Mark Schwartz dated July 5, 2012 \[incorporated by reference to Exhibit 10.5 to Form 10‑Q for the quarter ended June 30, 2012\].](http://www.sec.gov/Archives/edgar/data/823768/000119312512316664/d352342dex105.htm) |
| 10.29† | — | [Separation and Release Agreement between USA Waste-Management Resources, LLC and Mark Schwartz dated January 1, 2017 \[incorporated by reference to Exhibit 10.26 to Form 10‑K for the year ended December 31, 2016\].](http://www.sec.gov/Archives/edgar/data/823768/000119312517046480/d252547dex1026.htm) |
| 10.30† | — | [Form of Director and Executive Officer Indemnity Agreement \[incorporated by reference to Exhibit 10.43 to Form 10‑K for the year ended December 31, 2012\].](http://www.sec.gov/Archives/edgar/data/823768/000119312513058892/d413187dex1043.htm) |
| 10.34† | — | [Form of 2016 Individual Restricted Stock Unit Award Agreement \[incorporated by reference to Exhibit 10.32 to Form 10‑K for the year ended December 31, 2016\].](http://www.sec.gov/Archives/edgar/data/823768/000119312517046480/d252547dex1032.htm) |
| 10.36† | — | [2017 Senior Leadership Team Award Agreement with Mr. James E. Trevathan, Jr. \[incorporated by reference to Exhibit 10.2 to Form 8‑K dated February 27, 2017\].](http://www.sec.gov/Archives/edgar/data/823768/000119312517069837/d350228dex102.htm) |
| 10.37†* | — | [Form of 2017 Long Term Incentive Compensation Award Agreement (Mid-Year Award).](https://www.sec.gov/Archives/edgar/data/823768/000155837018000716/wm-20171231ex1037b83f8.htm) |
| 12.1* | — | [Computation of Ratio of Earnings to Fixed Charges.](https://www.sec.gov/Archives/edgar/data/823768/000155837018000716/wm-20171231ex121288b99.htm) |
Item 16. Form 10-K Summary.
12 rewritten, 0 added, 34 removed, 35 unchanged
Date: February [removed: 15, 2018][added: 14, 2019]
| /s/ JAMES C. FISH, JR. | | President, Chief Executive Officer and Director | | February [removed: 15, 2018] [added: 14, 2019] |
| /s/ DEVINA A. RANKIN | | Senior Vice President and | | February [removed: 15, 2018] [added: 14, 2019] |
| /s/ LESLIE K. NAGY | | Vice President and Chief Accounting Officer | | February [removed: 15, 2018] [added: 14, 2019] |
| /s/ [removed: BRADBURY] [added: THOMAS] H. [removed: ANDERSON] [added: WEIDEMEYER] | | Chairman of the Board and Director | | February [removed: 15, 2018] [added: 14, 2019] |
| /s/ FRANK M. CLARK, JR. | | Director | | February [removed: 15, 2018] [added: 14, 2019] |
| Frank M. [removed: Clark] [added: Clark, Jr.] | | | | |
| /s/ ANDRÉS R. GLUSKI | | Director | | February [removed: 15, 2018] [added: 14, 2019] |
| /s/ PARTICK W. GROSS | | Director | | February [removed: 15, 2018] [added: 14, 2019] |
| /s/ VICTORIA M. HOLT | | Director | | February [removed: 15, 2018] [added: 14, 2019] |
| /s/ KATHLEEN M. MAZZARELLA | | Director | | February [removed: 15, 2018] [added: 14, 2019] |
| /s/ JOHN C. POPE | | Director | | February [removed: 15, 2018] [added: 14, 2019] |
| Bradbury H. Anderson | | | | |
| /s/ THOMAS H. WEIDEMEYER | | Director | | February 15, 2018 |
REPORT OF INDEPENDENT REGISTERED PUBLIC ACCOUNTING FIRM
The Board of Directors and Stockholders of Waste Management, Inc.
Opinion on the Financial Statement Schedule
We have audited the consolidated financial statements of Waste Management, Inc. (the Company) as of December 31, 2017 and 2016, and for each of the three years in the period ended December 31, 2017, and have issued our report thereon dated February 15, 2018 (included elsewhere in this Form 10-K).
Our audits also included the financial statement schedule listed in Item 15(a)(2) of this Form 10-K.
In our opinion, the financial statement schedule, when considered in relation to the basic financial statements taken as a whole, presents fairly, in all material respects the information set forth therein.
Basis for Opinion
This schedule is the responsibility of the Company’s management.
Our responsibility is to express an opinion on this schedule based on our audits.
We believe that our audits provide a reasonable basis for our opinion.
| 5 | |
| --- | --- |
| | /s/ ERNST & YOUNG LLP |
| Houston, Texas February 15, 2018 | |
WASTE MANAGEMENT, INC.
SCHEDULE II — VALUATION AND QUALIFYING ACCOUNTS
(In Millions)
| | | | | | | | | | | | | |
| --- | --- | --- | --- | --- | --- | --- | --- | --- | --- | --- | --- | --- |
| | | | | | | | | Accounts | | | | |
| | | Balance | | | Charged | | | Written | | | Balance | |
| | | Beginning of | | | to | | | Off/Use of | | | End of | |
| | | Year | | | Income | | | Reserve | | | Year | |
| 2015 — Reserves for doubtful accounts (a) | | $ | 31 | | $ | 36 | | $ | (42) | | $ | 25 |
| 2016 — Reserves for doubtful accounts (a) | | $ | 25 | | $ | 42 | | $ | (43) | | $ | 24 |
| 2017 — Reserves for doubtful accounts (a) | | $ | 24 | | $ | 43 | | $ | (45) | | $ | 22 |
| 2015 — Merger and restructuring accruals (b) | | $ | 45 | | $ | 15 | | $ | (47) | | $ | 13 |
| 2016 — Merger and restructuring accruals (b) | | $ | 13 | | $ | 4 | | $ | (10) | | $ | 7 |
| 2017 — Merger and restructuring accruals (b) | | $ | 7 | | $ | — | | $ | (5) | | $ | 2 |
| | (a) | | Includes reserves for doubtful accounts receivable and notes receivable. |
| --- | --- | --- | --- |
| | (b) | | Included in accrued liabilities in our Consolidated Balance Sheets. These accruals represent employee severance and benefit costs and transitional costs. |