 filings.tools
Williams Companies 10-K 2017-12-31
Filed 2018-02-22. 22 sections, 632K characters. Original on sec.gov · Markdown · JSON
Cover and table of contents
10-K 1 wmb_20171231x10k.htm 10-K
UNITED STATES SECURITIES AND EXCHANGE COMMISSION
Washington, D.C. 20549
Form 10-K
(Mark One)
| þ | ANNUAL REPORT PURSUANT TO SECTION 13 OR 15(d) OF THE SECURITIES EXCHANGE ACT OF 1934 |
| For the fiscal year ended December 31, 2017 | |
| OR | |
| ¨ | TRANSITION REPORT PURSUANT TO SECTION 13 OR 15(d) OF THE SECURITIES EXCHANGE ACT OF 1934 |
| For the transition period from to |
Commission file number 1-4174
The Williams Companies, Inc.
(Exact Name of Registrant as Specified in Its Charter)
| Delaware | 73-0569878 | |
| (State or Other Jurisdiction of Incorporation or Organization) | (IRS Employer Identification No.) | |
| One Williams Center, Tulsa, Oklahoma | 74172 | |
| (Address of Principal Executive Offices) | (Zip Code) |
918-573-2000
(Registrant’s Telephone Number, Including Area Code)
Securities registered pursuant to Section 12(b) of the Act:
| Title of Each Class | Name of Each Exchange on Which Registered | |
| Common Stock, $1.00 par value | New York Stock Exchange |
Securities registered pursuant to Section 12(g) of the Act:
None
Indicate by check mark if the registrant is a well-known seasoned issuer, as defined in Rule 405 of the Securities Act. Yes þ No ¨
Indicate by check mark if the registrant is not required to file reports pursuant to Section 13 or Section 15(d) of the Act. Yes ¨ No þ
Indicate by check mark whether the registrant: (1) has filed all reports required to be filed by Section 13 or 15(d) of the Securities Exchange Act of 1934 during the preceding 12 months (or for such shorter period that the registrant was required to file such reports), and (2) has been subject to such filing requirements for the past 90 days. Yes þ No ¨
Indicate by check mark whether the registrant has submitted electronically and posted on its corporate Web site, if any, every Interactive Data File required to be submitted and posted pursuant to Rule 405 of Regulation S-T (§232.405 of this chapter) during the preceding 12 months (or for such shorter period that the registrant was required to submit and post such files). Yes þ No ¨
Indicate by check mark if disclosure of delinquent filers pursuant to Item 405 of Regulation S-K (§229.405 of this chapter) is not contained herein, and will not be contained, to the best of registrant’s knowledge, in definitive proxy or information statements incorporated by reference in Part III of this Form 10-K or any amendment to this Form 10-K. ¨
Indicate by check mark whether the registrant is a large accelerated filer, an accelerated filer, a non-accelerated filer, a smaller reporting company, or an emerging growth company. See the definitions of “large accelerated filer,” “accelerated filer,” “smaller reporting company,” and “emerging growth company” in Rule 12b-2 of the Exchange Act.
| Large accelerated filer þ | Accelerated filer ¨ | Non-accelerated filer ¨ | Smaller reporting company ¨ | Emerging growth company ¨ | ||||
| (Do not check if a smaller reporting company) |
If an emerging growth company, indicate by check mark if the registrant has elected not to use the extended transition period for complying with any new or revised financial accounting standards provided pursuant to Section 13(a) of the Exchange Act. ¨
Indicate by check mark whether the registrant is a shell company (as defined in Rule 12b-2 of the Act). Yes ¨ No þ
The aggregate market value of the voting and non-voting common equity held by non-affiliates computed by reference to the price at which the common equity was last sold as of the last business day of the registrant’s most recently completed second quarter was approximately $24,993,673,967.
The number of shares outstanding of the registrant’s common stock outstanding at February 19, 2018 was 827,327,336.
DOCUMENTS INCORPORATED BY REFERENCE
Portions of the Registrant’s Definitive Proxy Statement for the Registrant’s Annual Meeting of Stockholders to be held on May 10, 2018, are incorporated into Part III, as specifically set forth in Part III.
THE WILLIAMS COMPANIES, INC.
FORM 10-K
TABLE OF CONTENTS
DEFINITIONS
The following is a listing of certain abbreviations, acronyms and other industry terminology that may be used throughout this Annual Report.
Measurements:
Barrel: One barrel of petroleum products that equals 42 U.S. gallons
Bcf : One billion cubic feet of natural gas
Bcf/d: One billion cubic feet of natural gas per day
British Thermal Unit (Btu): A unit of energy needed to raise the temperature of one pound of water by one degree
Fahrenheit
Dekatherms (Dth): A unit of energy equal to one million British thermal units
Mbbls/d: One thousand barrels per day
Mdth/d: One thousand dekatherms per day
MMcf/d: One million cubic feet per day
MMdth: One million dekatherms or approximately one trillion British thermal units
MMdth/d: One million dekatherms per day
Tbtu: One trillion British thermal units
Consolidated Entities:
Cardinal: Cardinal Gas Services, L.L.C.
Constitution: Constitution Pipeline Company, LLC
Gulfstar One: Gulfstar One LLC
Jackalope: Jackalope Gas Gathering Services, L.L.C.
Northwest Pipeline: Northwest Pipeline LLC
Transco: Transcontinental Gas Pipe Line Company, LLC
WPZ: Williams Partners L.P.
Partially Owned Entities: Entities in which we do not own a 100 percent ownership interest and which, as of December 31, 2017, we account for as an equity-method investment, including principally the following:
Aux Sable: Aux Sable Liquid Products LP
Caiman II: Caiman Energy II, LLC
Discovery: Discovery Producer Services LLC
Gulfstream: Gulfstream Natural Gas System, L.L.C.
Laurel Mountain: Laurel Mountain Midstream, LLC
OPPL: Overland Pass Pipeline Company LLC
UEOM: Utica East Ohio Midstream LLC
Government and Regulatory:
EPA: Environmental Protection Agency
Exchange Act, the: Securities and Exchange Act of 1934, as amended
FERC: Federal Energy Regulatory Commission
GAAP: Generally accepted accounting principles
IRS: Internal Revenue Service
SEC: Securities and Exchange Commission
Other:
ACMP: Access Midstream Partners, L.P. prior to its merger with Pre-Merger WPZ
Energy Transfer: Energy Transfer Equity, L.P.
ETC: Energy Transfer Corp LP
ETC Merger: Merger wherein Williams would have been merged into ETC
Fractionation: The process by which a mixed stream of natural gas liquids is separated into its constituent products,
such as ethane, propane, and butane
IDR: Incentive distribution right
LNG: Liquefied natural gas; natural gas which has been liquefied at cryogenic temperatures
Merger Agreement: Merger Agreement and Plan of Merger of Williams with Energy Transfer and certain of its
affiliates
MVC: Minimum volume commitment
NGLs: Natural gas liquids; natural gas liquids result from natural gas processing and crude oil refining and are
used as petrochemical feedstocks, heating fuels, and gasoline additives, among other applications
NGL margins: NGL revenues less Btu replacement cost, plant fuel, transportation, and fractionation
Pre-merger WPZ: Williams Partners L.P. prior to its merger with ACMP
PDH facility: Propane dehydrogenation facility
RGP Splitter: Refinery grade propylene splitter
Throughput: The volume of product transported or passing through a pipeline, plant, terminal, or other facility
The statements in this Annual Report that are not historical information, including statements concerning plans and objectives of management for future operations, economic performance or related assumptions, are forward-looking statements. Forward-looking statements may be identified by various forms of words such as “anticipates,” “believes,” “seeks,” “could,” “may,” “should,” “continues,” “estimates,” “expects,” “forecasts,” “intends,” “might,” “goals,” “objectives,” “targets,” “planned,” “potential,” “projects,” “scheduled,” “will,” “assumes,” “guidance,” “outlook,” “in-service date,” or other similar expressions and other words and terms of similar meaning. Although we believe that our expectations regarding future events are based on reasonable assumptions, we can give no assurance that such expectations or assumptions will be achieved. Additional information regarding forward-looking statements and important factors that could cause actual results to differ materially from those in the forward-looking statements are described under Part I, Item 1A in this Annual Report.
PART I
Item 1. Business
In this report, Williams (which includes The Williams Companies, Inc. and, unless the context otherwise indicates, all of our subsidiaries) is at times referred to in the first person as “we,” “us” or “our.” We also sometimes refer to Williams as the “Company.”
WEBSITE ACCESS TO REPORTS AND OTHER INFORMATION
We file our annual report on Form 10-K, quarterly reports on Form 10-Q, current reports on Form 8-K, proxy statements and other documents electronically with the SEC under the Exchange Act. You may read and copy any materials that we file with the SEC at the SEC’s Public Reference Room at 100 F Street, N.E., Washington, DC 20549. You may obtain information on the operation of the Public Reference Room by calling the SEC at 1-800-SEC-0330. You may also obtain such reports from the SEC’s Internet website at www.sec.gov.
Our Internet website is http://investor.williams.com/. We make available, free of charge, through the Investors tab of our Internet website our annual report on Form 10-K, quarterly reports on Form 10-Q, current reports on Form 8-K, and amendments to those reports filed or furnished pursuant to Section 13(a) or 15(d) of the Exchange Act as soon as reasonably practicable after we electronically file such material with, or furnish it to, the SEC. Our Corporate Governance Guidelines, Code of Ethics for Senior Officers, Board committee charters, and the Williams Code of Business Conduct are also available on our Internet website. We will also provide, free of charge, a copy of any of our corporate documents listed above upon written request to our Corporate Secretary, One Williams Center, Suite 4700, Tulsa, Oklahoma 74172.
GENERAL
We are an energy infrastructure company focused on connecting North America’s significant hydrocarbon resource plays to markets for natural gas and NGLs. Our operations are located principally in the United States.
As of December 31, 2017, our interstate gas pipelines and midstream interests were largely held through our significant investment in WPZ. We own the general partner interest and a 74 percent limited partner interest in WPZ.
We were founded in 1908, originally incorporated under the laws of the state of Nevada in 1949 and reincorporated under the laws of the state of Delaware in 1987. Williams’ headquarters are located in Tulsa, Oklahoma, with other major offices in Salt Lake City, Utah; Houston, Texas; Pittsburgh, Pennsylvania; and the Four Corners Area. Our telephone number is 918-573-2000.
FINANCIAL INFORMATION ABOUT SEGMENTS
See Part II, “Item 8. Financial Statements and Supplementary Data — Notes to Consolidated Financial Statements — Note 18 – Segment Disclosures.”
BUSINESS SEGMENTS
Substantially all our operations are conducted through our subsidiaries. Our activities in 2017 were operated through the following reporting segments as presented in the accompanying financial statements and management’s discussion and analysis.
| • | Williams Partners — comprised of our consolidated master limited partnership, WPZ, which includes gas pipeline and midstream businesses. The gas pipeline business includes interstate natural gas pipelines and pipeline joint project investments. The midstream business provides natural gas gathering, treating, processing and compression services; NGL production, fractionation, storage, marketing and transportation; deepwater production handling and crude oil transportation services; an olefin production business (see Note 2 – |
Acquisitions and Divestitures of Notes to Consolidated Financial Statements), and is comprised of several wholly owned and partially owned subsidiaries and joint project investments.
This reporting segment also included our former Canadian midstream operations comprised of an oil sands offgas processing plant near Fort McMurray, Alberta, an NGL/olefin fractionation facility, and the Boreal Pipeline, which were sold in September 2016 (see Note 2 – Acquisitions and Divestitures of Notes to Consolidated Financial Statements).
| • | Other — comprised of business activities that are not operating segments, as well as corporate operations. Other also includes certain domestic olefins pipeline assets as well as certain Canadian assets, which included a liquids extraction plant located near Fort McMurray, Alberta, that began operations in March 2016, and a propane dehydrogenation facility which was under development. In September 2016, the Canadian assets were sold (see Note 2 – Acquisitions and Divestitures of Notes to Consolidated Financial Statements). |
Detailed discussion of each of our reporting segments follows. For a discussion of our ongoing expansion projects, see Part II, Item 7. Management’s Discussion and Analysis of Financial Condition and Results of Operations.
Williams Partners
Gas Pipeline Business
Williams Partners’ gas pipeline businesses consist primarily of Transco and Northwest Pipeline. Our gas pipeline business also holds interests in joint venture interstate and intrastate natural gas pipeline systems including a 50 percent equity-method investment in Gulfstream and a 41 percent interest in Constitution (a consolidated entity), which is developing a pipeline project (see Note 3 – Variable Interest Entities of Notes to Consolidated Financial Statements). Transco and Northwest Pipeline own and operate a combined total of approximately 13,600 miles of pipelines with a total annual throughput of approximately 4,533 TBtu of natural gas and peak-day delivery capacity of approximately 18.8 MMdth of natural gas.
Transco
Transco is an interstate natural gas transmission company that owns and operates a 9,700-mile natural gas pipeline system, which is regulated by the FERC, extending from Texas, Louisiana, Mississippi and the Gulf of Mexico through Alabama, Georgia, South Carolina, North Carolina, Virginia, Maryland, Delaware, Pennsylvania and New Jersey to the New York City metropolitan area. The system serves customers in Texas and 12 southeast and Atlantic seaboard states, including major metropolitan areas in Georgia, North Carolina, Washington, D.C., Maryland, New York, New Jersey, and Pennsylvania.
Pipeline system and customers
At December 31, 2017, Transco’s system, which extends from Texas to New York, had a system-wide delivery capacity totaling approximately 15.0 MMdth of natural gas per day. During 2017, Transco completed five fully-contracted expansions, which added more than 2.8 MMdth of firm transportation capacity per day to the existing pipeline system. Transco’s system includes 50 compressor stations, four underground storage fields, and an LNG storage facility. Compression facilities at sea level-rated capacity total approximately 2.1 million horsepower.
Transco’s major natural gas transportation customers are public utilities and municipalities that provide service to residential, commercial, industrial and electric generation end users. Shippers on Transco’s system include public utilities, municipalities, intrastate pipelines, direct industrial users, electric power generators, and natural gas marketers and producers. Transco’s firm transportation agreements are generally long-term agreements with various expiration dates and account for the major portion of Transco’s business. Additionally, Transco offers interruptible transportation services under shorter-term agreements.
Transco has natural gas storage capacity in four underground storage fields located on or near its pipeline system or market areas and operates two of these storage fields. Transco also has storage capacity in an LNG storage facility that it owns and operates. The total usable gas storage capacity available to Transco and its customers in such underground storage fields and LNG storage facility and through storage service contracts is approximately 200 Bcf of natural gas. At December 31, 2017, Transco’s customers had stored in its facilities approximately 141
Bcf of natural gas. In addition, wholly owned subsidiaries of Transco operate and hold a 35 percent equity-method investment in Pine Needle LNG Company, LLC, an LNG storage facility with 4 Bcf of storage capacity. Storage capacity permits Transco’s customers to inject gas into storage during the summer and off-peak periods for delivery during peak winter demand periods.
Northwest Pipeline
Northwest Pipeline is an interstate natural gas transmission company that owns and operates a natural gas pipeline system, which is regulated by the FERC, extending from the San Juan basin in northwestern New Mexico and southwestern Colorado through Colorado, Utah, Wyoming, Idaho, Oregon, and Washington to a point on the Canadian border near Sumas, Washington. Northwest Pipeline provides services for markets in Washington, Oregon, Idaho, Wyoming, Nevada, Utah, Colorado, New Mexico, California, and Arizona, either directly or indirectly through interconnections with other pipelines.
Pipeline system and customers
At December 31, 2017, Northwest Pipeline’s system, having long-term firm transportation and storage redelivery agreements with aggregate capacity reservations of approximately 3.8 MMdth/d, was composed of approximately 3,900 miles of mainline and lateral transmission pipeline and 41 transmission compressor stations having a combined sea level-rated capacity of approximately 472,000 horsepower.
Northwest Pipeline transports and stores natural gas for a broad mix of customers, including local natural gas distribution companies, municipal utilities, direct industrial users, electric power generators, and natural gas marketers and producers. Northwest Pipeline’s firm transportation and storage contracts are generally long-term contracts with various expiration dates and account for the major portion of Northwest Pipeline’s business. Additionally, Northwest Pipeline offers interruptible and short-term firm transportation service.
Northwest Pipeline owns a one-third interest in the Jackson Prairie underground storage facility in Washington and contracts with a third party for natural gas storage services in the Clay Basin underground field in Utah. Northwest Pipeline also owns and operates an LNG storage facility in Washington. These storage facilities have an aggregate working natural gas storage capacity of 14.2 MMdth of natural gas, which is substantially utilized for third-party natural gas. These natural gas storage facilities enable Northwest Pipeline to balance daily receipts and deliveries and provide storage services to customers.
Gulfstream
Gulfstream is a 745-mile interstate natural gas pipeline system extending from the Mobile Bay area in Alabama to markets in Florida, which has a capacity to transport 1.3 Bcf/d. Williams Partners owns, through a subsidiary, a 50 percent equity-method investment in Gulfstream. Williams Partners shares operating responsibilities for Gulfstream with the other 50 percent owner.
Midstream Business
Williams Partners’ midstream business, one of the nation’s largest natural gas gatherers and processors, has primary service areas concentrated in major producing basins in Arkansas, Colorado, New Mexico, Oklahoma, Texas, Wyoming, the Gulf of Mexico, Louisiana, Pennsylvania, West Virginia, New York, and Ohio. The primary businesses are: (1) natural gas gathering, treating, and processing; (2) NGL fractionation, storage and transportation; (3) crude oil transportation; and (4) olefins production (see Note 2 – Acquisitions and Divestitures of Notes to Consolidated Financial Statements). These fall within the middle of the process of taking raw natural gas and crude oil from the producing fields to the consumer.
Key variables for this business will continue to be:
| • | Producer drilling activities impacting natural gas supplies supporting our gathering and processing volumes; |
| • | Prices impacting commodity-based activities; |
| • | Retaining and attracting customers by continuing to provide reliable services; |
| • | Revenue growth associated with additional infrastructure either completed or currently under construction; |
| • | Disciplined growth in service areas. |
Gathering, Processing, and Treating
Williams Partners’ gathering systems receive natural gas from producers’ oil and natural gas wells and gather these volumes to gas processing, treating or redelivery facilities. Typically, natural gas, in its raw form, is not acceptable for transportation in major interstate natural gas pipelines or for commercial use as a fuel. Williams Partners’ treating facilities remove water vapor, carbon dioxide, and other contaminants and collect condensate, but do not extract NGLs. Williams Partners’ is generally paid a fee based on the volume of natural gas gathered and/or treated, generally measured in the Btu heating value.
In addition, natural gas contains various amounts of NGLs, which generally have a higher value when separated from the natural gas stream. Our processing plants extract the NGLs in addition to removing water vapor, carbon dioxide, and other contaminants. NGL products include:
| • | Ethane, primarily used in the petrochemical industry as a feedstock for ethylene production, one of the basic building blocks for plastics; |
| • | Propane, used for heating, fuel and as a petrochemical feedstock in the production of ethylene and propylene, another building block for petrochemical-based products such as carpets, packing materials, and molded plastic parts; |
| • | Normal butane, isobutane and natural gasoline, primarily used by the refining industry as blending stocks for motor gasoline or as a petrochemical feedstock. |
Our gas processing services generate revenues primarily from the following types of contracts:
| • | Fee-based: We are paid a fee based on the volume of natural gas processed, generally measured in the Btu heating value. Our customers are entitled to the NGLs produced in connection with this type of processing agreement. A portion of our fee-based processing revenues includes a share of the margins on the NGLs produced. For the year ended December 31, 2017, 70 percent of our NGL production volumes were under fee-based contracts. |
| • | Noncash commodity-based: We also process gas under two types of commodity-based contracts, keep-whole and percent-of-liquids, where we receive consideration for our services in the form of NGLs. Under these contracts, we retain some or all of the extracted NGLs as compensation for our services. For a keep-whole arrangement we replace the Btu content of the retained NGLs that were extracted during processing with natural gas purchases, also known as shrink replacement gas. For a percent-of-liquids arrangement, we deliver to customers an agreed-upon percentage of the extracted NGLs and retain the remainder. NGLs we retain in connection with these types of processing agreements are referred to as our equity NGL production. Under keep-whole agreements, we have commodity price exposure on the difference between NGL and natural gas prices. For the year ended December 31, 2017, 30 percent of our NGL production volumes were under noncash commodity-based contracts. |
Our gathering and processing agreements have terms ranging from month-to-month to the life of the producing lease. Generally, our gathering and processing agreements are long-term agreements. Some contracts have price escalators which annually increase our gathering rates. In addition, certain contracts include fee redetermination or cost of service mechanisms that are designed to support a return on invested capital and allow our gathering rates to be adjusted, subject to specified caps in certain cases, to account for variability in volume, capital expenditures, commodity price fluctuations, compression and other expenses. Certain of our gas gathering agreements include MVCs. If the minimum annual or semi-annual volume commitment is not met, these customers are obligated to pay a fee equal to
the applicable fee for each Mcf by which the applicable customer’s minimum annual or semi-annual volume commitment exceeds the actual volume gathered. The revenue associated with such shortfall fees is generally recognized in the fourth quarter of each year.
Demand for gas gathering and processing services is dependent on producers’ drilling activities, which is impacted by the strength of the economy, natural gas prices, and the resulting demand for natural gas by manufacturing and industrial companies and consumers. Williams Partners’ gas gathering and processing customers are generally natural gas producers who have proved and/or producing natural gas fields in the areas surrounding its infrastructure. During 2017, Williams Partners’ facilities gathered and processed gas and crude oil for approximately 260 customers. Williams Partners’ top ten customers accounted for approximately 75 percent of our gathering and processing fee revenues and NGL margins from our noncash commodity-based agreements.
Demand for our equity NGLs is affected by economic conditions and the resulting demand from industries using these commodities to produce petrochemical-based products such as plastics, carpets, packing materials and blending stocks for motor gasoline and the demand from consumers using these commodities for heating and fuel. NGL products are currently the preferred feedstock for ethylene and propylene production, which has shifted away from the more expensive crude-based feedstocks.
Geographically, the midstream natural gas assets are positioned to maximize commercial and operational synergies with our other assets. For example, most of the offshore gathering and processing assets attach and process or condition natural gas supplies delivered to the Transco pipeline. Our San Juan basin, southwest Wyoming, and Piceance systems are capable of delivering residue gas volumes into Northwest Pipeline’s interstate system in addition to third-party interstate systems. Our gathering systems in Pennsylvania delivers residue gas volumes into Transco’s pipeline in addition to third-party interstate systems.
The following table summarizes our significant consolidated natural gas gathering assets:
| Natural Gas Gathering Assets | |||||||||
| Location | Pipeline Miles | Inlet Capacity (Bcf/d) | Ownership Interest | Supply Basins/Shale Formations | |||||
| Northeast | |||||||||
| Ohio Valley Midstream | Ohio, West Virginia, & Pennsylvania | 216 | 0.8 | 100% | Appalachian | ||||
| Susquehanna Supply Hub | Pennsylvania & New York | 436 | 3.2 | 100% | Appalachian | ||||
| Cardinal (1) | Ohio | 353 | 1.0 | 66% | Appalachian | ||||
| Flint | Ohio | 75 | 0.4 | 100% | Appalachian | ||||
| Marcellus South (2) | Pennsylvania | 41 | 0.1 | 100% | Appalachian | ||||
| Atlantic-Gulf | |||||||||
| Canyon Chief, including Blind Faith and Gulfstar extensions | Deepwater Gulf of Mexico | 156 | 0.5 | 100% | Eastern Gulf of Mexico | ||||
| Other Eastern Gulf | Offshore shelf and other | 46 | 0.2 | 100% | Eastern Gulf of Mexico | ||||
| Seahawk | Deepwater Gulf of Mexico | 115 | 0.4 | 100% | Western Gulf of Mexico | ||||
| Perdido Norte | Deepwater Gulf of Mexico | 105 | 0.3 | 100% | Western Gulf of Mexico | ||||
| Other Western Gulf | Offshore shelf and other | 105 | 0.5 | 100% | Western Gulf of Mexico | ||||
| West | |||||||||
| Four Corners | Colorado & New Mexico | 3,742 | 1.8 | 100% | San Juan | ||||
| Wamsutter | Wyoming | 2,084 | 0.7 | 100% | Wamsutter | ||||
| Southwest Wyoming | Wyoming | 1,614 | 0.5 | 100% | Southwest Wyoming | ||||
| Piceance | Colorado | 352 | 1.8 | (3) | Piceance | ||||
| Niobrara | Wyoming | 224 | 0.2 | (4) | Powder River | ||||
| Barnett Shale | Texas | 858 | 0.8 | 100% | Barnett Shale | ||||
| Eagle Ford Shale | Texas | 1,225 | 0.6 | 100% | Eagle Ford Shale | ||||
| Haynesville Shale | Louisiana | 626 | 1.8 | 100% | Haynesville Shale | ||||
| Permian | Texas | 365 | 0.1 | 100% | Permian | ||||
| Mid-Continent | Oklahoma, Texas, & Kansas | 2,248 | 0.9 | 100% | Miss-Lime, Granite Wash, Colony Wash, Arkoma |
| (1) | Statistics reflect 100 percent of the assets from our 66 percent ownership of Cardinal gathering system. |
| (2) | Statistics reflect 100 percent of the Beaver Creek assets in the consolidated Marcellus South gathering system. |
| (3) | Includes our 60 percent ownership of a gathering system in the Ryan Gulch area with 140 miles of pipeline and 0.2 Bcf/d of inlet capacity, and our 67 percent ownership of a gathering system at Allen Point with 8 miles of pipeline and 0.1 Bcf/d of inlet capacity. We operate both systems. We own and operate 100 percent of the balance of the Piceance gathering assets. |
| (4) | Statistics reflect 100 percent of the assets from our 50 percent ownership of the Jackalope gathering system. |
The following table summarizes our significant consolidated natural gas processing facilities:
| Natural Gas Processing Facilities | |||||||||
| Location | Inlet Capacity (Bcf/d) | NGL Production Capacity (Mbbls/d) | Ownership Interest | Supply Basins | |||||
| Northeast | |||||||||
| Fort Beeler | Marshall County, WV | 0.5 | 62 | 100% | Appalachian | ||||
| Oak Grove | Marshall County, WV | 0.2 | 25 | 100% | Appalachian | ||||
| Atlantic-Gulf | |||||||||
| Markham | Markham, TX | 0.5 | 45 | 100% | Western Gulf of Mexico | ||||
| Mobile Bay | Coden, AL | 0.7 | 30 | 100% | Eastern Gulf of Mexico | ||||
| West | |||||||||
| Echo Springs | Echo Springs, WY | 0.7 | 58 | 100% | Wamsutter | ||||
| Opal | Opal, WY | 1.1 | 47 | 100% | Southwest Wyoming | ||||
| Bucking Horse (1) | Converse County, WY | 0.1 | 7 | 50% | Powder River | ||||
| Willow Creek | Rio Blanco County, CO | 0.5 | 30 | 100% | Piceance | ||||
| Parachute | Garfield County, CO | 1.1 | 6 | 100% | Piceance | ||||
| Ignacio | Ignacio, CO | 0.5 | 29 | 100% | San Juan | ||||
| Kutz | Bloomfield, NM | 0.2 | 12 | 100% | San Juan |
| (1) | Statistics reflect 100 percent of the assets from our 50 percent ownership of Bucking Horse gas processing facility. |
In addition, we own and operate several natural gas treating facilities in New Mexico, Colorado, Texas, and Louisiana which bring natural gas to specifications allowable by major interstate pipelines.
We also own and operate fractionation facilities at Moundsville, de-ethanization and condensate facilities at our Oak Grove processing plant, a condensate stabilization facility near our Oak Grove plant, and an ethane transportation pipeline. Our three condensate stabilizers are capable of handling 17 Mbbls/d of field condensate. NGLs are extracted from the natural gas stream in our cryogenic processing plants. Our Oak Grove de-ethanizer is capable of handling up to approximately 80 Mbbls/d of mixed NGLs to extract up to approximately 40 Mbbls/d of ethane. The remaining mixed NGL stream from the de-ethanizer is then transported and fractionated at our Moundsville facilities, which are capable of handling more than 43 Mbbls/d of mixed NGLs. Ethane produced at our de-ethanizer is transported to markets via our 50-mile ethane pipeline from Oak Grove to Houston, Pennsylvania.
Our gathering business in the Northeast also provides multiple takeaway options to its customers. Ohio Valley Midstream makes customer deliveries with interconnections to two pipelines. Susquehanna Supply Hub makes deliveries for its customers with interconnections to Transco, as well as five other pipelines, while our Cardinal system utilizes interconnections with Blue Racer Midstream, LLC (Blue Racer), and UEOM. In addition, our NGL processing business utilizes connections with multiple pipelines, as well as truck and rail transportation to local and regional markets.
Crude Oil Transportation and Production Handling Assets
In addition to our natural gas assets, we own and operate four deepwater crude oil pipelines and own production platforms serving the deepwater in the Gulf of Mexico. Our crude oil transportation revenues are typically volumetric-based fee arrangements. However, a portion of our marketing revenues are recognized from purchase and sale arrangements whereby the oil that we transport is purchased and sold as a function of the same index-based price. Our offshore floating production platforms provide centralized services to deepwater producers such as compression, separation, production handling, water removal, and pipeline landings. Revenue sources have historically included a combination of fixed-fee, volumetric-based fee and cost reimbursement arrangements. Fixed fees associated with the resident production at our Devils Tower facility are recognized on a units-of-production basis. Fixed fees associated with the resident production at our Gulfstar One facility are recognized as the guaranteed capacity is made available.
The following tables summarize our significant crude oil transportation pipelines and production handling platforms:
| Crude Oil Pipelines | |||||||
| Pipeline Miles | Capacity (Mbbls/d) | Ownership Interest | Supply Basins | ||||
| Mountaineer, including Blind Faith and Gulfstar extensions | 155 | 150 | 100% | Eastern Gulf of Mexico | |||
| BANJO | 57 | 90 | 100% | Western Gulf of Mexico | |||
| Alpine | 96 | 85 | 100% | Western Gulf of Mexico | |||
| Perdido Norte | 74 | 150 | 100% | Western Gulf of Mexico |
| Production Handling Platforms | |||||||
| Gas Inlet Capacity (MMcf/d) | Crude/NGL Handling Capacity (Mbbls/d) | Ownership Interest | Supply Basins | ||||
| Devils Tower | 210 | 60 | 100% | Eastern Gulf of Mexico | |||
| Gulfstar I FPS (1) | 172 | 80 | 51% | Eastern Gulf of Mexico |
| (1) | Statistics reflect 100 percent of the assets from our 51 percent interest in Gulfstar One. |
Canadian Operations
Williams Partners completed the sale of its Canadian operations in September 2016. This business included an oil sands offgas processing plant located near Fort McMurray, Alberta, and an NGL/olefin fractionation facility located at Redwater, Alberta, which is near Edmonton, Alberta, and the Boreal Pipeline which transported NGLs and associated olefins from the Fort McMurray plant to the Redwater fractionation facility. This business allowed us to extract, fractionate, treat, store, terminal and sell the ethane/ethylene, propane, propylene, normal butane (butane), iso-butane, alky feedstock, and condensate recovered from a third-party oil sands bitumen upgrader.
Operating statistics
The following table summarizes our significant operating statistics:
| 2016 | 2015 | ||||
| Volumes: | |||||
| Canadian propylene sales (millions of pounds) | 87 | 161 | |||
| Canadian NGL sales (millions of gallons) | 141 | 284 |
Gulf Olefins
In mid-2017, Williams Partners completed the sale of its 88.5 percent undivided interest and operatorship of an olefins production facility in Geismar, Louisiana, along with a refinery grade propylene splitter in the Gulf region. The olefins business also operated an ethylene storage hub at Mont Belvieu using leased third-party underground storage caverns.
Our refinery grade propylene splitter had production capacity of approximately 500 million pounds per year of propylene. At the propylene splitter, we purchased refinery grade propylene and fractionated it into polymer grade propylene and propane; as a result, the asset was exposed to the price spread between those commodities.
Marketing Services
We market NGL products to a wide range of users in the energy and petrochemical industries. The NGL marketing business transports and markets our equity NGLs from the production at our processing plants, and also markets NGLs on behalf of third-party NGL producers, including some of our fee-based processing customers, and the NGL volumes
owned by Discovery. The NGL marketing business bears the risk of price changes in these NGL volumes while they are being transported to final sales delivery points. In order to meet sales contract obligations, we may purchase products in the spot market for resale. Other than a long-term agreement to sell our equity NGLs transported on OPPL, the majority of sales are based on supply contracts of one year or less in duration.
In certain situations to facilitate our gas gathering and processing activities, we buy natural gas from our producer customers for resale.
Prior to the sale of our olefin operations, we marketed olefin products to a wide range of users in the energy and petrochemical industries.
Other NGL & Petchem Operations
We own interests in and/or operate NGL fractionation and storage assets in central Kansas near Conway. These assets include a 50 percent interest in an NGL fractionation facility with capacity of slightly more than 100 Mbbls/d and we own approximately 20 million barrels of NGL storage capacity.
We own 283 miles of pipeline systems in Louisiana and Texas that provide feedstock transportation from fractionation and storage facilities to various third-party crackers. These systems include the Bayou ethane pipeline, which provides ethane transportation from Mont Belvieu, Texas; certain ethane and propane systems in Louisiana; and a pipeline that has the capacity to transport 12 Mbbls/d of ethane from Discovery’s Paradis fractionator.
We own 114 miles of pipelines in the Houston Ship Channel area which transport a variety of products including ethane, propane, ammonia, tertiary butyl alcohol, and other industrial products used in the petrochemical industry. We also own a tunnel crossing pipeline under the Houston Ship Channel. A portion of these pipelines are leased to third parties.
WPZ Operating Areas
WPZ organizes these businesses into the following operating areas:
Northeast G&P is comprised of natural gas gathering and processing, compression, and NGL fractionation businesses in the Marcellus and Utica Shale regions in Pennsylvania, West Virginia, New York, and Ohio, as well as a 66 percent interest in Cardinal (a consolidated entity), a 62 percent equity-method investment in UEOM, a 69 percent equity-method investment in Laurel Mountain, a 58 percent equity-method investment in Caiman II, and Appalachia Midstream Services, LLC, which owns an approximate average 66 percent interest in multiple gas gathering systems in the Marcellus Shale.
Atlantic-Gulf is comprised of an interstate natural gas pipeline, Transco, and significant natural gas gathering and processing and crude oil production handling and transportation assets in the Gulf Coast region, including a 51 percent interest in Gulfstar One (a consolidated entity) which is a proprietary floating production system, and various petrochemical and feedstock pipelines in the Gulf Coast region, as well as a 50 percent equity-method investment in Gulfstream, a 41 percent interest in Constitution (a consolidated entity) which is developing a pipeline project (see Note 3 – Variable Interest Entities of Notes to Consolidated Financial Statements), and a 60 percent equity-method investment in Discovery.
West is comprised of an interstate natural gas pipeline, Northwest Pipeline, and natural gas gathering, processing, and treating operations in New Mexico, Colorado, and Wyoming, as well as the Barnett Shale region of north-central Texas, the Eagle Ford Shale region of south Texas, the Haynesville Shale region of northwest Louisiana, and the Mid-Continent region which includes the Anadarko, Arkoma, Delaware, and Permian basins. West also includes an NGL and natural gas marketing business, storage facilities, and an undivided 50 percent interest in an NGL fractionator near Conway, Kansas, as well as our previously owned 50 percent equity-method investment in the Delaware basin gas gathering system in the Permian basin, and a 50 percent equity-method investment in OPPL.
NGL & Petchem Services is comprised of previously owned operations, including an 88.5 percent undivided interest in an olefins production facility in Geismar, Louisiana, which was sold in July 2017 (see Note 2 – Acquisitions and Divestitures of Notes to Consolidated Financial Statements), and a refinery grade propylene splitter in the Gulf
region, which was sold in June 2017. This operating area also included an oil sands offgas processing plant near Fort McMurray, Alberta, and an NGL/olefin fractionation facility, which were sold in September 2016.
Certain Equity-Method Investments
Discovery
We own a 60 percent interest in and operate the facilities of Discovery. Discovery’s assets include a 600 MMcf/d cryogenic natural gas processing plant near Larose, Louisiana, a 32 Mbbls/d NGL fractionator plant near Paradis, Louisiana, and a 614-mile offshore natural gas gathering and transportation system in the Gulf of Mexico. Discovery’s mainline has a gathering inlet capacity of 600 MMcf/d, while the Keathley Canyon Connector, a deepwater lateral pipeline in the central deepwater Gulf of Mexico has a gathering inlet capacity of 400 MMcf/d. Discovery’s assets also include a crude oil production handling platform with a crude oil/NGL handling capacity of 10 Mbbls/d and natural gas processing capacity of 75 MMcf/d.
Laurel Mountain
We own a 69 percent interest in a joint venture, Laurel Mountain, that includes a 2,053-mile gathering system that we operate in western Pennsylvania with the capacity to gather 0.7 Bcf/d of natural gas. Laurel Mountain has a long-term, dedicated, volumetric-based fee agreement, with exposure to natural gas prices, to gather the anchor customer’s production in the western Pennsylvania area of the Marcellus Shale.
Caiman II
We own a 58 percent interest in Caiman II, which owns a 50 percent interest in Blue Racer, a joint project to own, operate, develop and acquire midstream assets in the Utica Shale and certain adjacent areas in the Marcellus Shale. Blue Racer’s assets include 721 miles of gathering pipelines, and the Natrium complex in Marshall County, West Virginia, with a cryogenic processing capacity of 400 MMcf/d and fractionation capacity of approximately 120,000 Bbls/d. Blue Racer also owns the Berne complex in Monroe County, Ohio, with a cryogenic processing capacity of 400 MMcf/d, and NGL and condensate pipelines connecting Natrium to Berne.
Utica East Ohio Midstream
We own a 62 percent interest in UEOM, which includes infrastructure for the gathering, processing, and fractionation of natural gas and NGLs in the Utica Shale play in eastern Ohio. We operate a natural gas gathering pipeline, while our partner operates inlet compression, two processing plants with a total capacity of 800 MMcf/d, 41 Mbbls/d of condensate stabilization capacity, a 135 Mbbls/d NGL fractionation facility, approximately 950,000 barrels of NGL storage capacity and other ancillary assets, including loading and terminal facilities. These assets earn a fixed fee that escalates annually within a specified range.
Appalachia Midstream Investments
Through our Appalachia Midstream Investments, we operate 100 percent of and own an approximate average 66 percent interest in the Bradford Supply Hub gathering system and own an approximate average 68 percent interest in the Marcellus South gathering system, together which consist of approximately 987 miles of gathering pipeline in the Marcellus Shale region. The majority of our volumes in the region are gathered from northern Pennsylvania, southwestern Pennsylvania and the northwestern panhandle of West Virginia in core areas of the Marcellus Shale. Appalachia Midstream Investments operates the assets under long-term, 100 percent fixed-fee gathering agreements that include significant acreage dedications and cost of service mechanisms.
During the first quarter of 2017, we exchanged all of our 50 percent interest in the Delaware basin gas gathering system for an increased interest in the Bradford Supply Hub natural gas gathering system that is part of the Appalachia Midstream Investments and $155 million in cash. Following this exchange, we have an approximate average 66 percent interest in the Appalachia Midstream Investments. We continue to account for this investment under the equity-method due to the significant participatory rights of our partners such that we do not exercise control. (See Note 5 – Investing Activities of Notes to Consolidated Financial Statements.)
Aux Sable
We also own a 15 percent interest in Aux Sable and its Channahon, Illinois, gas processing and NGL fractionation facility near Chicago. The facility is capable of processing up to 2.1 Bcf/d of natural gas from the Alliance Pipeline system and fractionating approximately 132 Mbbls/d of extracted liquids into NGL products. Additionally, Aux Sable owns an 80 MMcf/d gas conditioning plant and a 12-inch, 83-mile gas pipeline infrastructure in North Dakota that provides additional NGLs to Channahon from the Bakken Shale in the Williston basin.
Delaware basin gas gathering system
We previously owned a non-operated 50 percent interest in the Delaware basin gas gathering system in the Permian basin, which was sold in February 2017. The system was comprised of more than 450 miles of gathering pipeline, located in west Texas.
Overland Pass Pipeline
We also operate and own a 50 percent interest in OPPL. OPPL is capable of transporting 255 Mbbls/d and includes approximately 1,096 miles of NGL pipeline extending from Opal, Wyoming, to the Mid-Continent NGL market center near Conway, Kansas, along with extensions into the Piceance and Denver-Julesberg basins in Colorado and the Bakken Shale in the Williston basin in North Dakota. Our equity NGL volumes from two of our three Wyoming plants and our Willow Creek facility in Colorado are dedicated for transport on OPPL under a long-term transportation agreement.
Operating Statistics
The following table summarizes our significant operating statistics for Williams Partners’ domestic midstream business:
| 2017 | 2016 | 2015 | ||||||
| Volumes: (1) | ||||||||
| Gathering (Bcf/d) | 8.15 | 8.25 | 8.34 | |||||
| Plant inlet natural gas (Bcf/d) | 3.05 | 3.50 | 3.52 | |||||
| NGL production (Mbbls/d) (2) | 148 | 151 | 131 | |||||
| NGL equity sales (Mbbls/d) (2) | 39 | 46 | 31 | |||||
| Crude oil transportation (Mbbls/d) (2) | 134 | 113 | 126 | |||||
| Geismar ethylene sales (millions of pounds) | 566 | 1,638 | 1,066 |
| (1) | Excludes volumes associated with equity-method investments. |
| (2) | Annual average Mbbls/d. |
Additional Business Segment Information
Our ongoing business segments are presented as continuing operations in the accompanying financial statements and Notes to Consolidated Financial Statements included in Part II.
We perform certain management, legal, financial, tax, consultation, information technology, administrative and other services for our subsidiaries.
Our principal sources of cash are from dividends, distributions, and advances from our subsidiaries, investments, payments by subsidiaries for services rendered, and, if needed, external financings, and net proceeds from asset sales. The terms of certain subsidiaries’ borrowing arrangements may limit the transfer of funds to us under certain conditions.
We believe that we have adequate sources and availability of raw materials and commodities for existing and anticipated business needs. Our interstate pipeline systems are all regulated in various ways resulting in the financial return on the investments made in the systems being limited to standards permitted by the regulatory agencies. Each of the pipeline systems has ongoing capital requirements for efficiency and mandatory improvements, with expansion opportunities also necessitating periodic capital outlays.
Revenues by service within our Williams Partners segment that exceeded 10 percent of consolidated revenue include:
| Total | |||
| (Millions) | |||
| 2017 | |||
| Service: | |||
| Regulated natural gas transportation and storage | $ | 2,148 | |
| Gathering, processing, and production handling | 2,715 | ||
| 2016 | |||
| Service: | |||
| Regulated natural gas transportation and storage | $ | 2,001 | |
| Gathering, processing, and production handling | 2,729 | ||
| 2015 | |||
| Service: | |||
| Regulated natural gas transportation and storage | $ | 1,938 | |
| Gathering, processing and production handling | 2,804 |
We have one customer, Chesapeake Energy Corporation, and its affiliates, that accounts for 10 percent of our total revenue in 2017. (See Note 16 – Fair Value Measurements, Guarantees, and Concentration of Credit Risk of Notes to Consolidated Financial Statements for additional details.)
REGULATORY MATTERS
FERC
Our gas pipeline interstate transmission and storage activities are subject to FERC regulation under the Natural Gas Act of 1938 (NGA) and under the Natural Gas Policy Act of 1978, and, as such, our rates and charges for the transportation of natural gas in interstate commerce, accounting, and the extension, enlargement, or abandonment of our jurisdictional facilities, among other things, are subject to regulation. Each gas pipeline company holds certificates of public convenience and necessity issued by the FERC authorizing ownership and operation of all pipelines, facilities, and properties for which certificates are required under the NGA. FERC Standards of Conduct govern how our interstate pipelines communicate and do business with gas marketing employees. Among other things, the Standards of Conduct require that interstate pipelines not operate their systems to preferentially benefit gas marketing functions.
FERC regulation requires all terms and conditions of service, including the rates charged, to be filed with and approved by the FERC before any changes can go into effect. Each of our interstate natural gas pipeline companies establishes its rates primarily through the FERC’s ratemaking process. Key determinants in the ratemaking process are:
| • | Costs of providing service, including depreciation expense; |
| • | Allowed rate of return, including the equity component of the capital structure and related income taxes; |
| • | Contract and volume throughput assumptions. |
The allowed rate of return is determined in each rate case. Rate design and the allocation of costs between the reservation and commodity rates also impact profitability. As a result of these proceedings, certain revenues previously collected may be subject to refund.
We also own interests in and operate two offshore transmission pipelines that are regulated by the FERC because they are deemed to transport gas in interstate commerce. Black Marlin Pipeline Company provides transportation service for offshore Texas production in the High Island area and redelivers that gas to intrastate pipeline interconnects near Texas City. Discovery provides transportation service for offshore Louisiana production from the South Timbalier,
Grand Isle, Ewing Bank, and Green Canyon (deepwater) areas to an onshore processing facility and downstream interconnect points with major interstate pipelines. In addition, Williams Partners owns a 50 percent equity-method investment in and is the operator of OPPL, which is an interstate natural gas liquids pipeline regulated by the FERC pursuant to the Interstate Commerce Act. OPPL provides transportation service pursuant to tariffs filed with the FERC. We also own an ethane pipeline in West Virginia and Pennsylvania (Williams Ohio Valley Pipeline LLC) and an ethane pipeline in Texas and Louisiana (Williams Bayou Ethane Pipeline) each of which provides interstate service subject to FERC jurisdiction under the Interstate Commerce Act.
Pipeline Safety
Our gas pipelines are subject to the Natural Gas Pipeline Safety Act of 1968, as amended, the Pipeline Safety Improvement Act of 2002, the Pipeline Safety, Regulatory Certainty, and Jobs Creation Act of 2011 (Pipeline Safety Act), and the Protecting Our Infrastructure of Pipelines and Enhancing Safety Act of 2016, which regulate safety requirements in the design, construction, operation, and maintenance of interstate natural gas transmission facilities. The United States Department of Transportation Pipeline and Hazardous Materials Safety Administration (PHMSA) administers federal pipeline safety laws.
Federal pipeline safety laws authorize PHMSA to establish minimum safety standards for pipeline facilities and persons engaged in the transportation of gas or hazardous liquids by pipeline. These safety standards apply to the design, construction, testing, operation, and maintenance of gas and hazardous liquids pipeline facilities affecting interstate or foreign commerce. PHMSA has also established reporting requirements for operators of gas and hazardous liquid pipeline facilities, as well as provisions for establishing the qualification of pipeline personnel and requirements for managing the integrity of gas transmission and distribution lines and certain hazardous liquid pipelines. To ensure compliance with these provisions, PHMSA performs pipeline safety inspections and has the authority to initiate enforcement actions.
Federal pipeline safety regulations contain an exemption that applies to gathering lines in certain rural locations. A substantial portion of our gathering lines qualify for that exemption and are currently not regulated under federal law.
States are largely preempted by federal law from regulating pipeline safety for interstate pipelines but most are certified by PHMSA to assume responsibility for enforcing intrastate pipeline safety regulations and inspecting intrastate pipelines. In practice, because states can adopt stricter standards for intrastate pipelines than those imposed by the federal government for interstate lines, they vary considerably in their authority and capacity to address pipeline safety.
On January 3, 2012, the Pipeline Safety Act was enacted. The Pipeline Safety Act requires PHMSA to complete a number of reports in preparation for potential rulemakings. The issues addressed in these rulemaking provisions include, but are not limited to, the use of automatic or remotely controlled shut-off valves on new or replaced transmission line facilities, modifying the requirements for pipeline leak detection systems, and expanding the scope of the pipeline integrity management requirements for both gas and liquid pipeline systems. On June 22, 2016, the Protecting Our Infrastructure of Pipelines and Enhancing Safety Act of 2016 was enacted, further strengthening PHMSA’s safety authority.
Pipeline Integrity Regulations
We have an enterprise-wide Gas Integrity Management Plan that we believe meets the PHMSA final rule that was issued pursuant to the requirements of the Pipeline Safety Improvement Act of 2002. The rule requires gas pipeline operators to develop an integrity management program for gas transmission pipelines that could affect high-consequence areas in the event of pipeline failure. The integrity management program includes a baseline assessment plan along with periodic reassessments to be completed within required time frames. In meeting the integrity regulations, we have identified high-consequence areas and developed baseline assessment plans. Ongoing periodic reassessments and initial assessments of any new high-consequence areas have been completed. We estimate that the cost to be incurred in 2018 associated with this program to be approximately $99 million. Management considers the costs associated with compliance with the rule to be prudent costs incurred in the ordinary course of business and, therefore, recoverable through Northwest Pipeline’s and Transco’s rates.
We have an enterprise-wide Liquid Integrity Management Plan that we believe meets the PHMSA final rule that was issued pursuant to the requirements of the Pipeline Safety Improvement Act of 2002. The rule requires liquid pipeline operators to develop an integrity management program for liquid transmission pipelines that could affect high-consequence areas in the event of pipeline failure. The integrity management program includes a baseline assessment plan along with periodic reassessments expected to be completed within required time frames. In meeting the integrity regulations, we utilized government defined high-consequence areas and developed baseline assessment plans. We completed assessments within the required time frames. We estimate that the cost to be incurred in 2018 associated with this program will be approximately $4 million. Ongoing periodic reassessments and initial assessments of any new high-consequence areas are expected to be completed within the time frames required by the rule. Management considers the costs associated with compliance with the rule to be prudent costs incurred in the ordinary course of business.
State Gathering Regulation
Our onshore midstream gathering operations are subject to laws and regulations in the various states in which we operate. For example, the Texas Railroad Commission has the authority to regulate the terms of service for our intrastate natural gas gathering business in Texas. Although the applicable state regulations vary widely, they generally require that pipeline rates and practices be reasonable and nondiscriminatory, and may include provisions covering marketing, pricing, pollution, environment, and human health and safety. Some states, such as New York, have specific regulations pertaining to the design, construction, and operations of gathering lines within such state.
Intrastate Liquids Pipelines in the Gulf Coast
Our intrastate liquids pipelines in the Gulf Coast are regulated by the Louisiana Department of Environmental Quality, the Texas Railroad Commission, and various other state and federal agencies. These pipelines are also subject to the liquid pipeline safety and integrity regulations discussed above since both Louisiana and Texas have adopted the integrity management regulations defined in PHMSA.
OCSLA
Our offshore midstream gathering is subject to the Outer Continental Shelf Lands Act (OCSLA). Although offshore gathering facilities are not subject to the NGA, offshore transmission pipelines are subject to the NGA, and in recent years the FERC has taken a broad view of offshore transmission, finding many shallow-water pipelines to be jurisdictional transmission. Most offshore gathering facilities are subject to the OCSLA, which provides in part that outer continental shelf pipelines “must provide open and nondiscriminatory access to both owner and nonowner shippers.”
See Part II, Item 8. Financial Statements and Supplementary Data — Note 17 – Contingent Liabilities and Commitments of Notes to Consolidated Financial Statements for further details on our regulatory matters. For additional information regarding regulatory matters, please also refer to “Risk Factors — The operation of our businesses might also be adversely affected by regulatory proceedings, changes in government regulations or in their interpretation or implementation, or the introduction of new laws or regulations applicable to our businesses or our customers,” and “The natural gas sales, transportation, and storage operations of our gas pipelines are subject to regulation by the FERC, which could have an adverse impact on their ability to establish transportation and storage rates that would allow them to recover the full cost of operating their respective pipelines, including a reasonable rate of return."
ENVIRONMENTAL MATTERS
Our operations are subject to federal environmental laws and regulations as well as the state, local, and tribal laws and regulations adopted by the jurisdictions in which we operate. We could incur liability to governments or third parties for any unlawful discharge of pollutants into the air, soil, or water, as well as liability for cleanup costs. Materials could be released into the environment in several ways including, but not limited to:
| • | Leakage from gathering systems, underground gas storage caverns, pipelines, processing or treating facilities, transportation facilities, and storage tanks; |
| • | Damage to facilities resulting from accidents during normal operations; |
| • | Damages to onshore and offshore equipment and facilities resulting from storm events or natural disasters; |
| • | Blowouts, cratering, and explosions. |
In addition, we may be liable for environmental damage caused by former owners or operators of our properties.
We believe compliance with current environmental laws and regulations will not have a material adverse effect on our capital expenditures, earnings, or current competitive position. However, environmental laws and regulations could affect our business in various ways from time to time, including incurring capital and maintenance expenditures, fines and penalties, and creating the need to seek relief from the FERC for rate increases to recover the costs of certain capital expenditures and operation and maintenance expenses.
For additional information regarding the potential impact of federal, state, tribal, or local regulatory measures on our business and specific environmental issues, please refer to “Risk Factors — “Our operations are subject to environmental laws and regulations, including laws and regulations relating to climate change and greenhouse gas emissions, which may expose us to significant costs, liabilities, and expenditures that could exceed our expectations,” and Part II, Item 7 “Management’s Discussion and Analysis of Financial Condition and Results of Operations — Environmental” and “Environmental Matters” in Part II, Item 8. Financial Statements and Supplementary Data — Note 17 – Contingent Liabilities and Commitments of Notes to Consolidated Financial Statements.
COMPETITION
Gas Pipeline Business
The market for supplying natural gas is highly competitive and new pipelines, storage facilities, and other related services are expanding to service the growing demand for natural gas. Additionally, pipeline capacity in many growing natural gas supply basins is constrained causing competition to increase among pipeline companies as they strive to connect those basins to major natural gas demand centers.
In our business, we compete with major intrastate and interstate natural gas pipelines. In the last few years, local distribution companies have also started entering into the long haul transportation business through joint venture pipelines. The principle elements of competition in the interstate natural gas pipeline business are based on rates, reliability, quality of customer service, diversity of supply, and proximity to customers and market hubs.
Significant entrance barriers to build new pipelines exist, including federal and growing state regulations and public opposition against new pipeline builds, and these factors will continue to impact potential competition for the foreseeable future. However, we believe the position of our existing infrastructure, established strategic long-term contracts, and the fact that our pipelines have numerous receipt and delivery points along our systems provide us a competitive advantage, especially along the eastern seaboard and northwestern United States.
Midstream Business
Competition for natural gas gathering, processing, treating, transporting, and storing natural gas continues to increase as production from shales and other resource areas continues to grow. Our midstream services compete with similar facilities that are in the same proximity as our assets.
We face competition from major and independent natural gas midstream providers, private equity firms, and major integrated oil and natural gas companies that gather, transport, process, fractionate, store, and market natural gas and NGLs, as well as some larger exploration and production companies that are choosing to develop midstream services to handle their own natural gas.
Our gathering and processing agreements are generally long-term agreements that may include acreage dedication. We primarily face competition to the extent these agreements approach renewal and new volume opportunities arise. Competition for natural gas volumes is primarily based on reputation, commercial terms (products retained or fees charged), array of services provided, efficiency and reliability of services, location of gathering facilities, available capacity, downstream interconnects, and latent capacity. We believe our significant presence in traditional prolific
supply basins, our solid positions in growing shale plays, and our ability to offer integrated packages of services position us well against our competition.
For additional information regarding competition for our services or otherwise affecting our business, please refer to “Risk Factors - The financial condition of our natural gas transportation and midstream businesses is dependent on the continued availability of natural gas supplies in the supply basins that we access and demand for those supplies in the markets we serve,” “Our industry is highly competitive and increased competitive pressure could adversely affect our business and operating results,” and “We may not be able to replace, extend, or add additional customer contracts or contracted volumes on favorable terms, or at all, which could affect our financial condition, the amount of cash available to pay dividends, and our ability to grow.”
EMPLOYEES
At February 1, 2018, we had approximately 5,425 full-time employees.
FINANCIAL INFORMATION ABOUT GEOGRAPHIC AREAS
See Part II, Item 8. Financial Statements and Supplementary Data — Note 18 – Segment Disclosures of Notes to Consolidated Financial Statements for amounts of revenues during the last three fiscal years from external customers attributable to the United States and all foreign countries. Also see Part II, Item 8. Financial Statements and Supplementary Data — Note 18 – Segment Disclosures of Notes to Consolidated Financial Statements for information relating to long-lived assets during the last three fiscal years, located in the United States and all foreign countries.
Item 1A. Risk Factors
FORWARD-LOOKING STATEMENTS AND CAUTIONARY STATEMENT
FOR PURPOSES OF THE “SAFE HARBOR” PROVISIONS OF
THE PRIVATE SECURITIES LITIGATION REFORM ACT OF 1995
The reports, filings, and other public announcements of Williams may contain or incorporate by reference statements that do not directly or exclusively relate to historical facts. Such statements are “forward-looking statements” within the meaning of Section 27A of the Securities Act of 1933, as amended (Securities Act) and Section 21E of the Securities Exchange Act of 1934, as amended (Exchange Act). These forward-looking statements relate to anticipated financial performance, management’s plans and objectives for future operations, business prospects, outcome of regulatory proceedings, market conditions, and other matters. We make these forward-looking statements in reliance on the safe harbor protections provided under the Private Securities Litigation Reform Act of 1995.
All statements, other than statements of historical facts, included in this report that address activities, events, or developments that we expect, believe or anticipate will exist or may occur in the future, are forward-looking statements. Forward-looking statements can be identified by various forms of words such as “anticipates,” “believes,” “seeks,” “could,” “may,” “should,” “continues,” “estimates,” “expects,” “forecasts,” “intends,” “might,” “goals,” “objectives,” “targets,” “planned,” “potential,” “projects,” “scheduled,” “will,” “assumes,” “guidance,” “outlook,” “in-service date,” or other similar expressions. These forward-looking statements are based on management’s beliefs and assumptions and on information currently available to management and include, among others, statements regarding:
| • | Expected levels of cash distributions by WPZ with respect to limited partner interests; |
| • | Levels of dividends to Williams stockholders; |
| • | Future credit ratings of Williams, WPZ, and their affiliates; |
| • | Amounts and nature of future capital expenditures; |
| • | Expansion and growth of our business and operations; |
| • | Expected in-service dates for capital projects; |
| • | Financial condition and liquidity; |
| • | Business strategy; |
| • | Cash flow from operations or results of operations; |
| • | Seasonality of certain business components; |
| • | Natural gas and natural gas liquids prices, supply, and demand; |
| • | Demand for our services. |
Forward-looking statements are based on numerous assumptions, uncertainties, and risks that could cause future events or results to be materially different from those stated or implied in this report. Many of the factors that will determine these results are beyond our ability to control or predict. Specific factors that could cause actual results to differ from results contemplated by the forward-looking statements include, among others, the following:
| • | Whether WPZ will produce sufficient cash flows to provide expected levels of cash distributions; |
| • | Whether we are able to pay current and expected levels of dividends; |
| • | Whether WPZ elects to pay expected levels of cash distributions and we elect to pay expected levels of dividends; |
| • | Whether we will be able to effectively execute our financing plan; |
| • | Availability of supplies, including lower than anticipated volumes from third parties served by our midstream business, and market demand; |
| • | Volatility of pricing including the effect of lower than anticipated energy commodity prices and margins; |
| • | Inflation, interest rates, and general economic conditions (including future disruptions and volatility in the global credit markets and the impact of these events on our customers and suppliers); |
| • | The strength and financial resources of our competitors and the effects of competition; |
| • | Whether we are able to successfully identify, evaluate, and timely execute our capital projects and other |
investment opportunities in accordance with our forecasted capital expenditures budget;
| • | Our ability to successfully expand our facilities and operations; |
| • | Development and rate of adoption of alternative energy sources; |
| • | The impact of operational and developmental hazards and unforeseen interruptions, and the availability of adequate insurance coverage; |
| • | The impact of existing and future laws (including, but not limited to, the Tax Cuts and Job Acts of 2017), regulations, the regulatory environment, environmental liabilities, and litigation, as well as our ability to obtain necessary permits and approvals and achieve favorable rate proceeding outcomes; |
| • | Our costs and funding obligations for defined benefit pension plans and other postretirement benefit plans; |
| • | Changes in maintenance and construction costs; |
| • | Changes in the current geopolitical situation; |
| • | Our exposure to the credit risk of our customers and counterparties; |
| • | Risks related to financing, including restrictions stemming from debt agreements, future changes in credit ratings as determined by nationally recognized credit rating agencies, and the availability and cost of capital; |
| • | The amount of cash distributions from and capital requirements of our investments and joint ventures in which we participate; |
| • | Risks associated with weather and natural phenomena, including climate conditions and physical damage to our facilities; |
| • | Acts of terrorism, including cybersecurity threats, and related disruptions; |
| • | Additional risks described in our filings with the Securities and Exchange Commission (SEC). |
Given the uncertainties and risk factors that could cause our actual results to differ materially from those contained in any forward-looking statement, we caution investors not to unduly rely on our forward-looking statements. We disclaim any obligations to and do not intend to update the above list or to announce publicly the result of any revisions to any of the forward-looking statements to reflect future events or developments.
In addition to causing our actual results to differ, the factors listed above and referred to below may cause our intentions to change from those statements of intention set forth in this report. Such changes in our intentions may also cause our results to differ. We may change our intentions, at any time and without notice, based upon changes in such factors, our assumptions, or otherwise.
Because forward-looking statements involve risks and uncertainties, we caution that there are important factors, in addition to those listed above, that may cause actual results to differ materially from those contained in the forward-looking statements. These factors are described in the following section.
RISK FACTORS
You should carefully consider the following risk factors in addition to the other information in this report. Each of these factors could adversely affect our business, prospects, financial condition, results of operations, cash flows, and, in some cases our reputation. The occurrence of any of such risks could also adversely affect the value of an investment in our securities.
Risks Related to Our Business
The financial condition of
Showing the first 8K of 68K characters. Open the full section
Item 1B. Unresolved Staff Comments
Not applicable.
Item 2. Properties
Please read “Business” for a description of the location and general character of our principal physical properties. We generally own our facilities, although a substantial portion of our pipeline and gathering facilities is constructed and maintained pursuant to rights-of-way, easements, permits, licenses, or consents on and across properties owned by others.
Item 3. Legal Proceedings
Environmental
Certain reportable legal proceedings involving governmental authorities under federal, state, and local laws regulating the discharge of materials into the environment are described below. While it is not possible for us to predict the final outcome of the proceedings which are still pending, we do not anticipate a material effect on our consolidated financial position if we receive an unfavorable outcome in any one or more of such proceedings.
On June 13, 2013, an explosion and fire occurred at our formerly owned Geismar olefins plant and rendered the facility temporarily inoperable (Geismar Incident). On October 21, 2013, the EPA issued an Inspection Report pursuant to the Clean Air Act’s Risk Management Program following its inspection of the facility on June 24 through June 28, 2013. The report notes the EPA’s preliminary determinations about the facility’s documentation regarding process safety, process hazard analysis, as well as operating procedures, employee training, and other matters. On June 16, 2014, we received a request for information related to the Geismar Incident from the EPA under Section 114 of the Clean Air Act to which we responded on August 13, 2014. The EPA could issue penalties pertaining to final determinations.
On February 21, 2017, we received notice from the Environmental Enforcement Section of the United States Department of Justice (DOJ) regarding certain alleged violations of the Clean Air Act at our Moundsville facility as set forth in a Notice of Noncompliance issued by the EPA on January 14, 2016. The notice includes an offer to avoid further legal action on the alleged violations by paying $2 million. In discussion with the DOJ and the EPA, the EPA has indicated its belief that additional similar violations have occurred at our Oak Grove facility and has expressed interest in pursuing a global settlement. On January 19, 2018, we received an offer from the DOJ to globally settle the government’s claim for civil penalties associated with the alleged violations at both the Moundsville and the Oak Grove facilities for $1.955 million. We are currently evaluating the penalty assessment and the proposed global settlement offer and will respond to the agencies.
On May 5, 2017, we entered into a Consent Order with the Georgia Department of Natural Resources, Environmental Protection Division (GADNR) pertaining to alleged violations of the Georgia Water Quality Control Act and associated rules arising from a permit issued by GADNR for construction of the Dalton Project. Pursuant to the Consent Order, we paid a fine of $168,750 and agreed to perform a Corrective Action Order to remedy the alleged violations.
On January 19, 2018, we received notice from the PHMSA regarding certain alleged violations of PHMSA regulations in connection with a fire and release of liquid ethane that occurred at our Houston Meter Station located near Houston, Washington County, PA on December 24, 2014. The Notice of Probable Violation and Proposed Civil Penalty issued by PHMSA alleges failure to timely notify the National Response Center of a release of a hazardous
liquid resulting in a fire or explosion and failure to verify that the facility was constructed, inspected, tested, and calibrated in accordance with comprehensive written specifications or standards and proposes a total civil penalty of $174,100. We are currently evaluating the penalty assessment and will respond to the agency.
Other environmental matters called for by this Item are described under the caption “Environmental Matters” in Note 17 – Contingent Liabilities and Commitments of Notes to Consolidated Financial Statements included under Part II, Item 8 Financial Statements of this report, which information is incorporated by reference into this Item.
Other Litigation
The additional information called for by this Item is provided in Note 17 – Contingent Liabilities and Commitments of Notes to Consolidated Financial Statements included under Part II, Item 8 Financial Statements of this report, which information is incorporated by reference into this Item.
Item 4. Mine Safety Disclosures
Not applicable.
Executive Officers of the Registrant
The name, age, period of service, and title of each of our executive officers as of February 22, 2018, are listed below. Williams Partners L.P. merged with ACMP in February 2015 (the ACMP Merger). ACMP was the surviving entity in the ACMP Merger and changed its name to Williams Partners L.P. References in the biographical information below to (a) “Pre-merger WPZ” will mean Williams Partners L.P. prior to the ACMP Merger and (b) “ACMP/WPZ” will refer to both ACMP prior to and after the ACMP Merger, when it changed its name to Williams Partners L.P.
| Alan S. Armstrong | Director, Chief Executive Officer, and President |
| Age: 55 | |
| Position held since January 2011. | |
| Mr. Armstrong has served as our Chief Executive Officer and President and a director of Williams since January 2011. Mr. Armstrong has served as a director of the general partner of ACMP/WPZ since 2012, as Chief Executive Officer of ACMP/WPZ since December 31, 2014, and as Chairman of the Board of ACMP/WPZ since February 2, 2015. Mr. Armstrong also served as Chairman of the Board and Chief Executive Officer of the general partner of Pre-merger WPZ from 2011 until the ACMP Merger, as Senior Vice President - Midstream of Pre-merger WPZ from 2010 to 2011, and a director and Chief Operating Officer of Pre-merger WPZ from 2005 to 2010. From 2002 to 2011, Mr. Armstrong served as Williams’ Senior Vice President - Midstream and acted as president of our midstream business. From 1999 to 2002, Mr. Armstrong was Vice President, Gathering and Processing in our midstream business and from 1998 to 1999 was Vice President, Commercial Development. Mr. Armstrong has served as a director of BOK Financial Corporation, a financial services company, since 2013. |
| Walter J. Bennett | Senior Vice President - West |
| Age: 48 | |
| Position held since January 2015. | |
| Mr. Bennett has served as our Senior Vice President - West since January 2015. Mr. Bennett has served as Senior Vice President - West of the general partner of ACMP/WPZ since December 2013 and as Senior Vice President - West of the general partner of Pre-merger WPZ from January 2015 until the ACMP Merger. Mr. Bennett previously served as a director of the general partner of ACMP/WPZ from February 2017 through November 2017. Mr. Bennett was formerly Chief Operating Officer of Chesapeake Midstream Development and served as Senior Vice President - Operations at Boardwalk Pipeline Partners. |
| John D. Chandler | Senior Vice President and Chief Financial Officer |
| Age: 48 | |
| Position held since September 2017. | |
| Mr. Chandler has served as our Senior Vice President and Chief Financial Officer since September 2017, and as a director of the general partner of ACMP/WPZ since November 2017. Mr. Chandler most recently served as Senior Vice President and Chief Financial Officer of Magellan GP, LLC, the general partner of Magellan Midstream Partners, LP from 2009 until his retirement in March 2014. From 2003 until 2009, he served as Senior Vice President and Chief Financial Officer for the general partner of Magellan Midstream Holdings, L.P. From 1992 until 2002, Mr. Chandler held various accounting and finance roles within Williams and MAPCO Inc., prior to its acquisition by Williams. Mr. Chandler has served as a director of Matrix Service Company since June 2017. |
| Micheal G. Dunn | Executive Vice President and Chief Operating Officer |
| Age: 52 | |
| Position held since February 2017. | |
| Mr. Dunn has served as our Executive Vice President and Chief Operating Officer and as a director of the general partner of ACMP/WPZ since February 2017. Previously, Mr. Dunn served as President of Questar Pipeline and as Executive Vice President of Questar Corporation from 2015 through 2017. Prior to that, Mr. Dunn served as President and Chief Executive Officer of PacifiCorp Energy from 2010 through 2015, a subsidiary of Berkshire Hathaway Energy. Earlier, Mr. Dunn was president of Kern River Gas Transmission Company, a Berkshire Hathaway Energy interstate natural gas pipeline subsidiary. He joined Kern River in 1990, having served in various leadership roles in the areas of operations, construction, engineering and information technology before being named President of Kern River in 2007. Mr. Dunn began his career with Williams as an operations engineer and spent 14 years with the company in a variety of technical and leadership roles. |
| Frank J. Ferazzi | Senior Vice President - Atlantic Gulf |
| Age: 61 | |
| Position held since June 2017 | |
| Mr. Ferazzi has served as our Senior Vice President - Atlantic-Gulf since June 2017. Previously, Mr. Ferazzi served as VP & GM Eastern Interstates from November 2014 through June 2017, and previously as VP & GM Transco from January 2013 through January 2015. Prior to that, Mr. Ferazzi served as VP Commercial Operations - Gas Pipeline from May 2010 through December 2012. |
| John E. Poarch | Senior Vice President - Engineering Services |
| Age: 52 | |
| Position held since November 2017. | |
| Mr. Poarch has served as our Senior Vice President - Engineering Services since November 2017. Previously, he served as VP Commercial West OA from March 2017 through November 2017, and before that, as VP Commercial & Business Development from January 2015 through March 2017. Previously, Mr. Poarch was the general manager for Access Midstream’s Eagle Ford operations. |
| James E. Scheel | Senior Vice President - Northeast G&P |
| Age: 53 | |
| Position held since January 2014. | |
| Mr. Scheel has served as our Senior Vice President - Northeast G&P since January 2014. Mr. Scheel served as a director of ACMP/WPZ from the ACMP Merger until November 2017. Mr. Scheel served as a director of the Pre-merger WPZ general partner from 2012 until the ACMP Merger. Mr. Scheel served as a director of the Pre-merger ACMP general partner from December 2012 to February 2014. Previously, Mr. Scheel served as Senior Vice President - Corporate Strategic Development of Williams and the Pre-merger WPZ general partner from February 2012 to January 2014. Mr. Scheel served as Vice President of Business Development of Williams’ midstream business from January 2011 to February 2012. |
| Ted T. Timmermans | Vice President, Controller, and Chief Accounting Officer |
| Age: 61 | |
| Position held since July 2005. | |
| Mr. Timmermans has served as our Vice President, Controller, and Chief Accounting Officer since July 2005. Mr. Timmermans has served in the same roles for the general partner of ACMP/WPZ since the ACMP Merger. Mr. Timmermans served as Chief Accounting Officer of WMZ from 2008 until its merger with Pre-Merger WPZ in 2010. Previously, Mr. Timmermans served as our Assistant Controller from 1998 to 2005. |
| T. Lane Wilson | Senior Vice President, General Counsel and Chief Compliance Officer |
| Age: 51 | |
| Position held since April 2017. | |
| Mr. Wilson has served as Senior Vice President, General Counsel and Chief Compliance Officer since April 2017. Prior to joining Williams, Mr. Wilson served as a United States Magistrate Judge for the Northern District of Oklahoma from 2009 until he joined Williams in April 2017. Mr. Wilson previously served as a shareholder and member of the board of directors of the Hall Estill law firm from 1994 through 2008. |
| Chad J. Zamarin | Senior Vice President - Corporate Strategic Development |
| Age: 41 | |
| Position held since June 2017. | |
| Mr. Zamarin has served as our Senior Vice President - Corporate Strategic Development since June 2017. Mr. Zamarin has served as a director of the general partner of ACMP/WPZ since November 2017. Previously, he served as President, Pipeline and Midstream at Cheniere Energy from 2014 through 2017. Prior to joining Cheniere, Mr. Zamarin served as the Chief Operating Officer at NiSource Midstream, LLC and NiSource Energy Ventures, LLC, as well as the President of Pennant Midstream, LLC, a joint venture with Hilcorp Energy. |
PART II
Item 5. Market for Registrant’s Common Equity, Related Stockholder Matters and Issuer Purchases of Equity Securities
Our common stock is listed on the New York Stock Exchange under the symbol “WMB.” At the close of business on February 19, 2018, we had approximately 6,979 holders of record of our common stock. The high and low sales price ranges (New York Stock Exchange composite transactions) and dividends declared by quarter for each of the past two years are as follows:
| High | Low | Dividend | |||||||||
| 2017 | |||||||||||
| First Quarter | $ | 32.69 | $ | 27.68 | $ | 0.30 | |||||
| Second Quarter | 31.25 | 27.65 | 0.30 | ||||||||
| Third Quarter | 32.18 | 28.76 | 0.30 | ||||||||
| Fourth Quarter | 30.72 | 26.82 | 0.30 | ||||||||
| 2016 | |||||||||||
| First Quarter | $ | 26.68 | $ | 10.22 | $ | 0.64 | |||||
| Second Quarter | 23.89 | 14.60 | 0.64 | ||||||||
| Third Quarter | 31.43 | 19.68 | 0.20 | ||||||||
| Fourth Quarter | 32.21 | 27.35 | 0.20 |
Some of our subsidiaries’ borrowing arrangements may limit the transfer of funds to us. These terms have not impeded, nor are they expected to impede, our ability to pay dividends. On February 21, 2018, our board of directors approved a regular quarterly dividend of $0.34 per share payable on March 26, 2018.
Performance Graph
Set forth below is a line graph comparing our cumulative total stockholder return on our common stock (assuming reinvestment of dividends) with the cumulative total return of the S&P 500 Stock Index and the Bloomberg Americas Pipelines Index for the period of five fiscal years commencing January 1, 2013. The Bloomberg Americas Pipelines Index is composed of Enbridge Inc., Kinder Morgan, Inc., TransCanada Corporation, ONEOK, Inc., Pembina Pipeline Corporation, Cheniere Energy, Inc., Targa Resources Corp., Inter Pipeline Ltd., Keyera Corp., AltaGas Ltd., Plains GP Holdings, L.P., and Williams. The graph below assumes an investment of $100 at the beginning of the period.
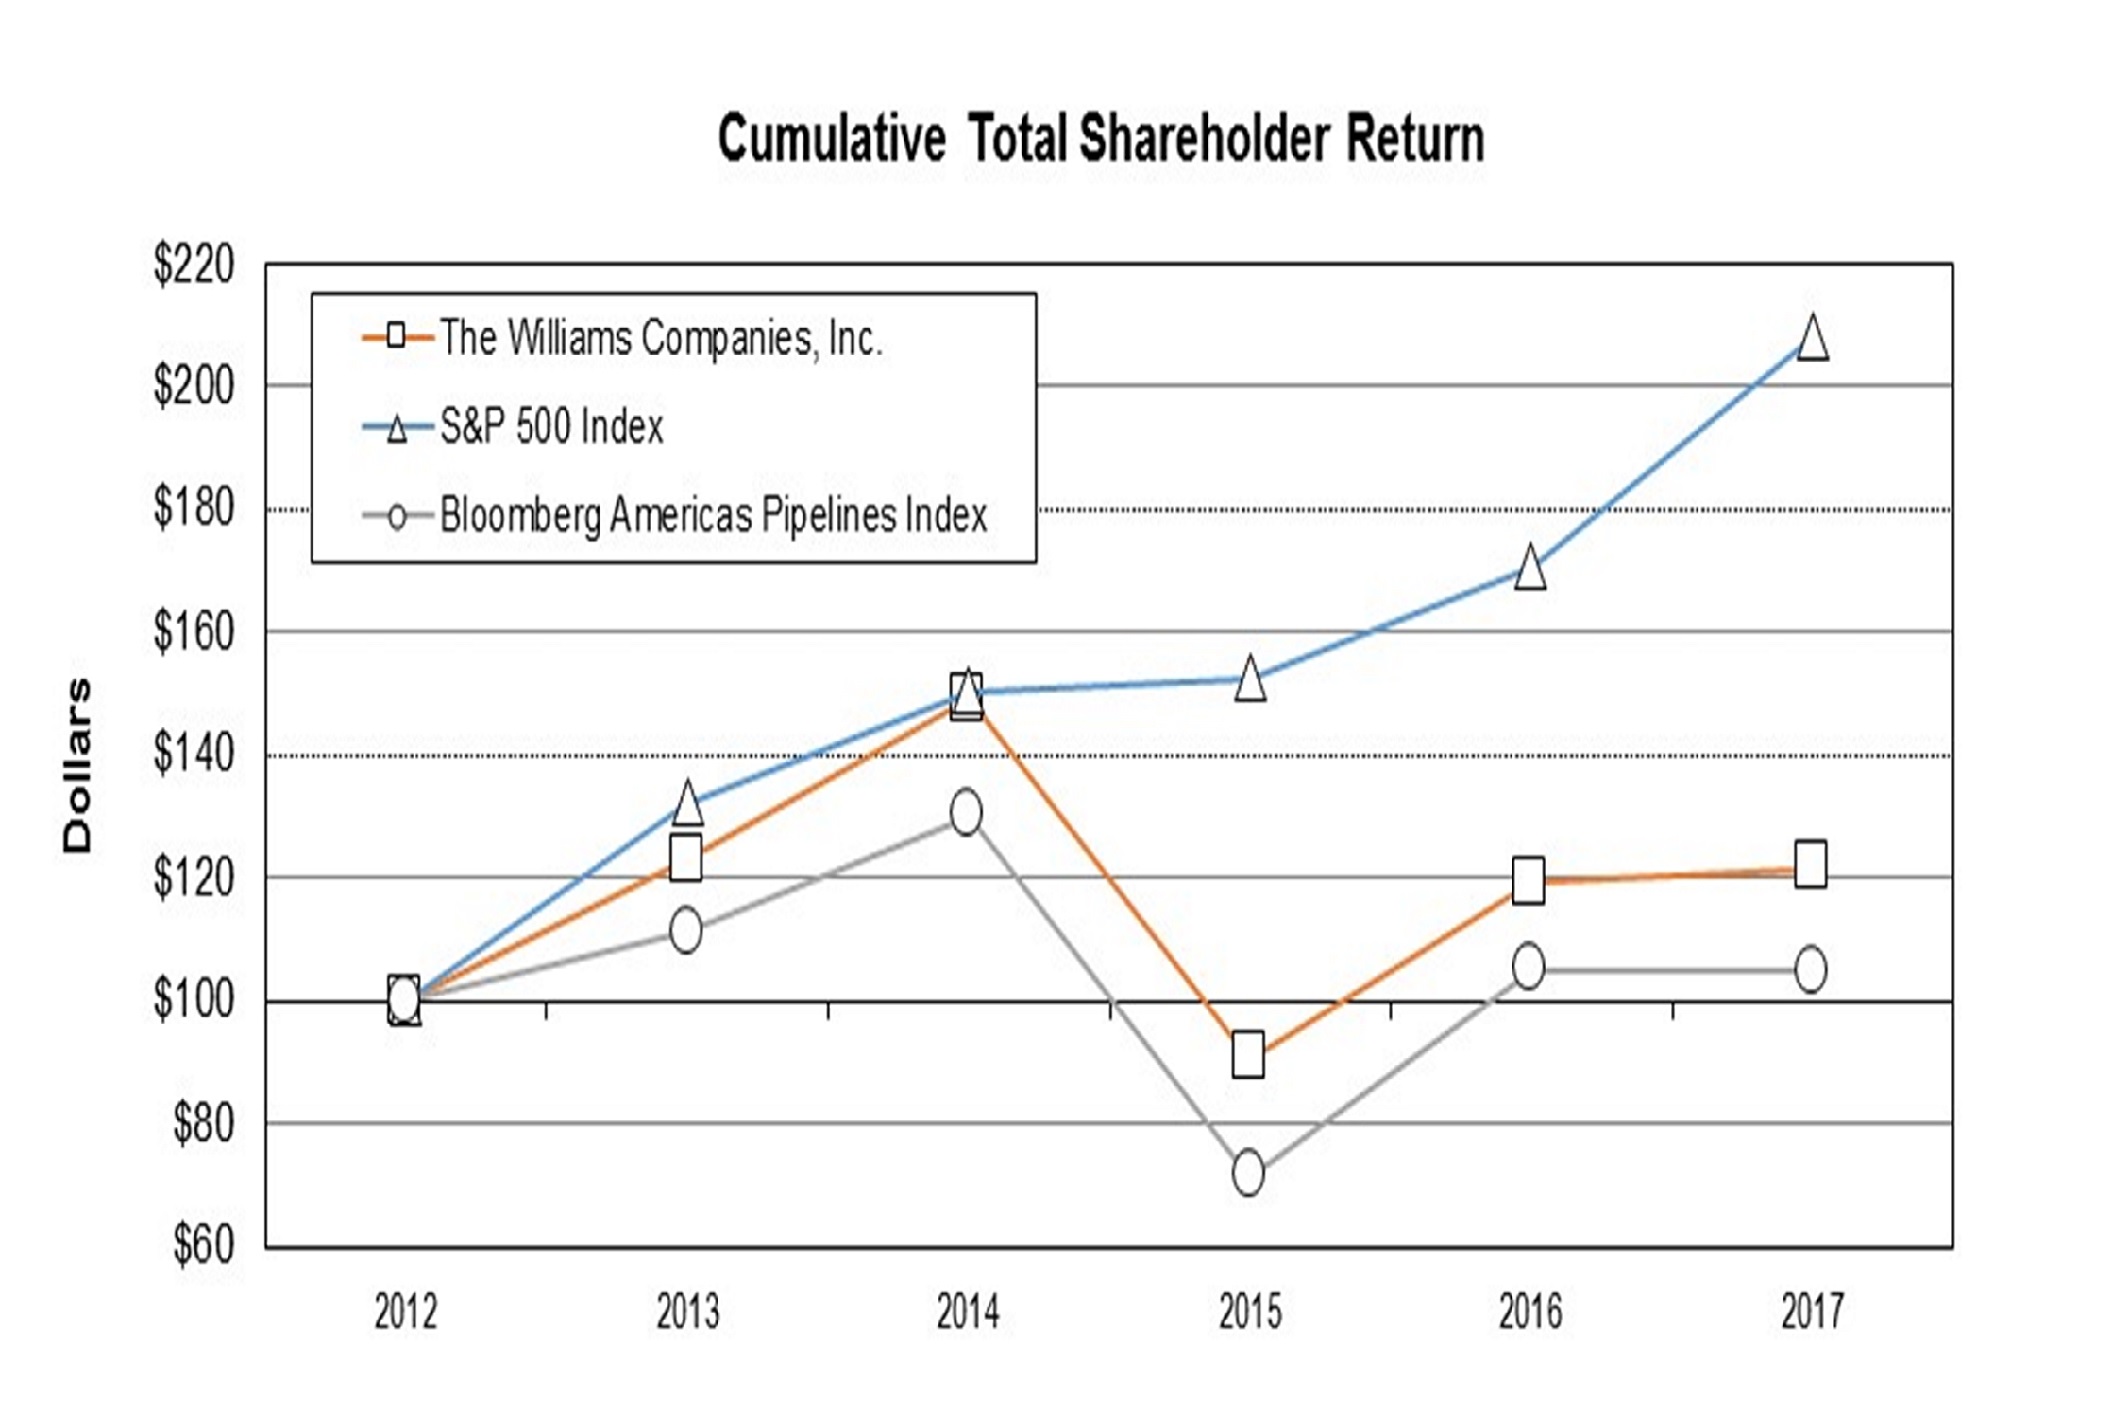
| 2012 | 2013 | 2014 | 2015 | 2016 | 2017 | ||||||
| The Williams Companies, Inc. | 100.0 | 122.8 | 149.1 | 90.6 | 119.1 | 121.5 | |||||
| S&P 500 Index | 100.0 | 132.4 | 150.5 | 152.5 | 170.8 | 208.1 | |||||
| Bloomberg Americas Pipelines Index | 100.0 | 111.0 | 130.0 | 71.5 | 105.0 | 104.7 |
Item 6. Selected Financial Data
The following financial data at December 31, 2017 and 2016, and for each of the three years in the period ended December 31, 2017, should be read in conjunction with the other financial information included in Part II, Item 7, Management’s Discussion and Analysis of Financial Condition and Results of Operations and Part II, Item 8, Financial Statements and Supplementary Data of this Form 10-K. All other financial data has been prepared from our accounting records.
| 2017 | 2016 | 2015 | 2014 | 2013 | |||||||||||||||
| (Millions, except per-share amounts) | |||||||||||||||||||
| Revenues (1) | $ | 8,031 | $ | 7,499 | $ | 7,360 | $ | 7,637 | $ | 6,860 | |||||||||
| Income (loss) from continuing operations (2) | 2,509 | (350 | ) | (1,314 | ) | 2,335 | 679 | ||||||||||||
| Amounts attributable to The Williams Companies, Inc.: | |||||||||||||||||||
| Income (loss) from continuing operations (2) | 2,174 | (424 | ) | (571 | ) | 2,110 | 441 | ||||||||||||
| Diluted earnings (loss) per common share: | |||||||||||||||||||
| Income (loss) from continuing operations (2) | 2.62 | (.57 | ) | (.76 | ) | 2.91 | .64 | ||||||||||||
| Total assets at December 31 (3) | 46,352 | 46,835 | 49,020 | 50,455 | 27,065 | ||||||||||||||
| Commercial paper and long-term debt due within one year at December 31 (4) | 501 | 878 | 675 | 802 | 226 | ||||||||||||||
| Long-term debt at December 31 (3) | 20,434 | 22,624 | 23,812 | 20,780 | 11,276 | ||||||||||||||
| Stockholders’ equity at December 31 (3) (5) | 9,656 | 4,643 | 6,148 | 8,777 | 4,864 | ||||||||||||||
| Cash dividends declared per common share | 1.200 | 1.680 | 2.450 | 1.958 | 1.438 |
| (1) | Revenues for 2014 increased reflecting the consolidation of ACMP beginning in third quarter and new Canadian construction management services. |
| (2) | Income (loss) from continuing operations: |
| • | For 2017 includes a $1.923 billion benefit for income taxes resulting from Tax Reform rate change, a $1.095 billion pre-tax gain on the sale of our Geismar Interest, partially offset by $1.248 billion of pre-tax impairments of certain assets, and $776 million of pre-tax regulatory charges resulting from Tax Reform; |
| • | For 2016 includes an $873 million impairment of certain assets and a $430 million impairment of certain equity-method investments; |
| • | For 2015 includes a $1.4 billion impairment of certain equity-method investments and a $1.1 billion impairment of goodwill; |
| • | For 2014 includes $2.5 billion pre-tax gain recognized as a result of remeasuring to fair value the equity-method investment we held before we acquired a controlling interest in ACMP, $246 million of insurance recoveries related to the 2013 Geismar Incident, and $154 million of cash received related to a contingency settlement. 2014 also includes $78 million of pre-tax equity losses from Bluegrass Pipeline and Moss Lake related primarily to the underlying write-off of previously capitalized project development costs and $76 million of pre-tax acquisition, merger, and transition expenses related to our acquisition of ACMP; |
| • | For 2013 includes $99 million of deferred income tax expense incurred on undistributed earnings of our foreign operations that are no longer considered permanently reinvested. |
| (3) | The increases in 2014 reflect assets acquired and debt assumed primarily related to our acquisition of ACMP in third quarter as well as $1.9 billion of related debt issuances and $2.8 billion of debt issuances at WPZ. Additionally, we issued $3.4 billion of equity. |
| (4) | The increase in 2014 reflects borrowings under WPZ’s commercial paper program, which was initiated in 2013. |
| (5) | The increase in 2017 includes our issuance of common stock as part of our Financial Repositioning. |
Item 7. Management’s Discussion and Analysis of Financial Condition and Results of Operations
General
We are an energy infrastructure company focused on connecting North America’s significant hydrocarbon resource plays to growing markets for natural gas and NGLs. Our operations are located principally in the United States. We have one reportable segment, Williams Partners. All remaining business activities are included in Other.
Williams Partners
Williams Partners consists of our consolidated master limited partnership, WPZ, which includes gas pipeline and midstream businesses. The gas pipeline businesses include interstate natural gas pipelines and pipeline joint project investments; and the midstream businesses provide natural gas gathering, treating, and processing services; NGL production, fractionation, storage, marketing, and transportation; deepwater production handling and crude oil transportation services; and are comprised of several wholly owned and partially owned subsidiaries and joint project investments. As of December 31, 2017, we own 74 percent of the interests in WPZ.
Williams Partners’ gas pipeline businesses consist primarily of Transco and Northwest Pipeline. The gas pipeline business also holds interests in joint venture interstate and intrastate natural gas pipeline systems including a 50 percent equity-method investment in Gulfstream and a 41 percent interest in Constitution (a consolidated entity), which is developing a pipeline project. (See Note 3 – Variable Interest Entities of Notes to Consolidated Financial Statements.) As of December 31, 2017, Transco and Northwest Pipeline owned and operated a combined total of approximately 13,600 miles of pipelines with a total annual throughput of approximately 4,533 Tbtu of natural gas and peak-day delivery capacity of approximately 18.8 MMdth of natural gas.
Williams Partners’ midstream businesses primarily consist of (1) natural gas gathering, treating, compression, and processing; (2) NGL fractionation, storage, and transportation; (3) crude oil production handling and transportation; and (4) olefins production. (See Note 2 – Acquisitions and Divestitures of Notes to Consolidated Financial Statements.) The primary service areas are concentrated in major producing basins in Colorado, Texas, Oklahoma, Kansas, New Mexico, Wyoming, the Gulf of Mexico, Louisiana, Pennsylvania, West Virginia, New York, and Ohio, which include the Barnett, Eagle Ford, Haynesville, Marcellus, Niobrara, and Utica shale plays as well as the Mid-Continent region.
The midstream businesses include equity-method investments in natural gas gathering and processing assets and NGL fractionation and transportation assets, including a 62 percent equity-method investment in UEOM, a 69 percent equity-method investment in Laurel Mountain, a 58 percent equity-method investment in Caiman II, a 60 percent equity-method investment in Discovery, a 50 percent equity-method investment in OPPL, and Appalachia Midstream Services, LLC, which owns an approximate average 66 percent equity-method investment interest in multiple gas gathering systems in the Marcellus Shale (Appalachia Midstream Investments), as well as our previously owned 50 percent equity-method investment in the Delaware basin gas gathering system (DBJV) in the Mid-Continent region (see Note 5 – Investing Activities of Notes to Consolidated Financial Statements).
The midstream businesses previously included Canadian midstream operations, which were comprised of an oil sands offgas processing plant near Fort McMurray, Alberta and an NGL/olefin fractionation facility at Redwater, Alberta. In September 2016, these Canadian operations were sold.
Williams Partners’ ongoing strategy is to safely and reliably operate large-scale, interstate natural gas transmission and midstream infrastructures where our assets can be fully utilized and drive low per-unit costs. We focus on consistently attracting new business by providing highly reliable service to our customers and investing in growing markets and areas of increasing natural gas demand.
Williams Partners’ interstate transmission and related storage activities are subject to regulation by the FERC and as such, our rates and charges for the transportation of natural gas in interstate commerce, and the extension, expansion or abandonment of jurisdictional facilities and accounting, among other things, are subject to regulation. The rates are established through the FERC’s ratemaking process. Changes in commodity prices and volumes transported have
limited near-term impact on these revenues because the majority of cost of service is recovered through firm capacity reservation charges in transportation rates.
Other
Other is comprised of business activities that are not operating segments, as well as corporate operations. Other also includes certain domestic olefins pipeline assets as well as certain Canadian assets, which included a liquids extraction plant located near Fort McMurray, Alberta, that began operations in March 2016, and a propane dehydrogenation facility which was under development. In September 2016, the Canadian assets were sold.
Financial Repositioning
In January 2017, we entered into agreements with WPZ, wherein we permanently waived the general partner’s IDRs and converted our 2 percent general partner interest in WPZ to a noneconomic interest in exchange for 289 million newly issued WPZ common units. Pursuant to this agreement, we also purchased approximately 277 thousand WPZ common units for $10 million. Additionally, we purchased approximately 59 million common units of WPZ at a price of $36.08586 per unit in a private placement transaction, funded with proceeds from our equity offering (see Note 14 – Stockholders’ Equity of Notes to Consolidated Financial Statements). According to the terms of this agreement, concurrent with WPZ’s quarterly distributions in February 2017 and May 2017, we paid additional consideration totaling $56 million to WPZ for these units. Subsequent to these transactions and as of December 31, 2017, we own a 74 percent limited partner interest in WPZ.
Unless indicated otherwise, the following discussion and analysis of results of operations and financial condition and liquidity relates to our current continuing operations and should be read in conjunction with the consolidated financial statements and notes thereto included in Part II, Item 8 of this report.
Dividends
In December 2017, we paid a regular quarterly dividend of $0.30 per share. On February 21, 2018, our board of directors approved a regular quarterly dividend of $0.34 per share payable on March 26, 2018.
Overview
Net income (loss) attributable to The Williams Companies, Inc., for the year ended December 31, 2017, changed favorably by $2.598 billion compared to the year ended December 31, 2016, reflecting a $1.949 billion improvement in the provision (benefit) for income taxes primarily due to Tax Reform, the absence of $430 million of impairments of equity-method investments incurred in 2016, a $219 million increase in Other investing income (loss) – net primarily associated with the disposition of certain equity-method investments in 2017, a $204 million increase in operating income and reduced interest expense, partially offset by a $261 million increase in net income attributable to noncontrolling interests primarily due to increased income at WPZ. The increase in operating income reflects a gain of $1.095 billion from the sale of our Geismar Interest, increased service revenue from expansion projects, and lower costs and expenses, partially offset by a $674 million regulatory charge resulting from Tax Reform, a $375 million increase in impairments of certain assets, and a $184 million decrease in product margins primarily due to the loss of olefins volumes as a result of the sale of our Gulf Olefins and Canadian operations.
Tax Reform
In December 2017, the Tax Cuts and Jobs Act was enacted, which, among other things, reduced the federal corporate income tax rate from 35 percent
Showing the first 8K of 123K characters. Open the full section
Item 7A. Quantitative and Qualitative Disclosures About Market Risk
Interest Rate Risk
Our current interest rate risk exposure is related primarily to our debt portfolio. Our debt portfolio is primarily comprised of fixed rate debt, which mitigates the impact of fluctuations in interest rates. Any borrowings under the credit facilities and any issuances under WPZ’s commercial paper program could be at a variable interest rate and could expose us to the risk of increasing interest rates. The maturity of our long-term debt portfolio is partially influenced by the expected lives of our operating assets. (See Note 13 – Debt, Banking Arrangements, and Leases of Notes to Consolidated Financial Statements.)
The tables below provide information by maturity date about our interest rate risk-sensitive instruments as of December 31, 2017 and 2016. The fair value of our publicly traded long-term debt is valued using indicative year-end traded bond market prices. Private debt is valued based on market rates and the prices of similar securities with similar terms and credit ratings.
| 2018 | 2019 | 2020 | 2021 | 2022 | Thereafter (1) | Total | Fair Value December 31, 2017 | |||||||||||||||||||||||||
| (Millions) | ||||||||||||||||||||||||||||||||
| Long-term debt, including current portion: | ||||||||||||||||||||||||||||||||
| Fixed rate | $ | 502 | $ | 33 | $ | 2,123 | $ | 873 | $ | 2,003 | $ | 15,131 | $ | 20,665 | $ | 22,735 | ||||||||||||||||
| Weighted-average interest rate | 5.1 | % | 5.1 | % | 5.1 | % | 5.1 | % | 5.2 | % | 5.7 | % | ||||||||||||||||||||
| Variable rate (2) | $ | — | $ | — | $ | — | $ | 270 | $ | — | $ | — | $ | 270 | $ | 270 | ||||||||||||||||
| 2017 | 2018 | 2019 | 2020 | 2021 | Thereafter (1) | Total | Fair Value December 31, 2016 | |||||||||||||||||||||||||
| (Millions) | ||||||||||||||||||||||||||||||||
| Long-term debt, including current portion: | ||||||||||||||||||||||||||||||||
| Fixed rate | $ | 785 | $ | 500 | $ | 32 | $ | 2,121 | $ | 871 | $ | 17,475 | $ | 21,784 | $ | 22,465 | ||||||||||||||||
| Weighted-average interest rate | 5.2 | % | 5.2 | % | 5.2 | % | 5.2 | % | 5.2 | % | 5.6 | % | ||||||||||||||||||||
| Variable rate (3) | $ | — | $ | 850 | $ | — | $ | 775 | $ | — | $ | — | $ | 1,625 | $ | 1,625 | ||||||||||||||||
| Commercial paper: | ||||||||||||||||||||||||||||||||
| Variable rate (4) | $ | 93 | $ | — | $ | — | $ | — | $ | — | $ | — | $ | 93 | $ | 93 |
| (1) | Includes unamortized discount / premium and debt issuance costs. |
| (2) | The weighted-average interest rate for our $270 million credit facility borrowing at December 31, 2017 was 3.16 percent. |
| (3) | The weighted-average interest rates for WPZ’s $850 million term loan and our $775 million credit facility borrowing at December 31, 2016 were 2.50 percent and 2.51 percent, respectively. |
| (4) | The weighted-average interest rate was 1.06 percent at December 31, 2016. |
Commodity Price Risk
We are exposed to the impact of fluctuations in the market price of NGLs and natural gas, as well as other market factors, such as market volatility and energy commodity price correlations. We are exposed to these risks in connection with our owned energy-related assets, our long-term energy-related contracts, and limited proprietary trading activities. Our management of the risks associated with these market fluctuations includes maintaining sufficient liquidity, as well as using various derivatives and nonderivative energy-related contracts. The fair value of derivative contracts is subject
to many factors, including changes in energy commodity market prices, the liquidity and volatility of the markets in which the contracts are transacted, and changes in interest rates. At December 31, 2017 and 2016, our derivative activity was not material. (See Note 16 – Fair Value Measurements, Guarantees, and Concentration of Credit Risk of Notes to Consolidated Financial Statements.)
Item 8. Financial Statements and Supplementary Data
Report of Independent Registered Public Accounting Firm
The Stockholders and the Board of Directors of
The Williams Companies, Inc.
Opinion on the Financial Statements
We have audited the accompanying consolidated balance sheet of The Williams Companies, Inc. (the “Company”) as of December 31, 2017 and 2016, the related consolidated statements of operations, comprehensive income (loss), changes in equity and cash flows for each of the three years in the period ended December 31, 2017, and the related notes and financial statement schedules listed in the index at Item 15(a) (collectively referred to as the “consolidated financial statements”). In our opinion, based on our audits and the reports of other auditors, the consolidated financial statements present fairly, in all material respects, the consolidated financial position of the Company at December 31, 2017 and 2016, and the consolidated results of its operations and its cash flows for each of the three years in the period ended December 31, 2017, in conformity with U.S. generally accepted accounting principles.
We did not audit the financial statements of Gulfstream Natural Gas System, L.L.C. (“Gulfstream”), a limited liability corporation in which the Company has a 50 percent interest. In the consolidated financial statements, the Company’s investment in Gulfstream was $244 million and $261 million as of December 31, 2017 and 2016, respectively, and the Company’s equity earnings in the net income of Gulfstream were $75 million in 2017, $69 million in 2016 and $65 million in 2015. Gulfstream’s financial statements were audited by other auditors whose reports have been furnished to us, and our opinion, insofar as it relates to the amounts included for Gulfstream, is based solely on the reports of the other auditors.
We also have audited, in accordance with the standards of the Public Company Accounting Oversight Board (United States) (“PCAOB”), the Company’s internal control over financial reporting as of December 31, 2017, based on criteria established in Internal Control - Integrated Framework issued by the Committee of Sponsoring Organizations of the Treadway Commission (2013 framework) and our report dated February 22, 2018 expressed an unqualified opinion thereon.
Basis for Opinion
These consolidated financial statements are the responsibility of the Company’s management. Our responsibility is to express an opinion on the Company’s consolidated financial statements based on our audits. We are a public accounting firm registered with the PCAOB and are required to be independent with respect to the Company in accordance with the U.S. federal securities laws and the applicable rules and regulations of the Securities and Exchange Commission and the PCAOB.
We conducted our audits in accordance with the standards of the PCAOB. Those standards require that we plan and perform the audit to obtain reasonable assurance about whether the consolidated financial statements are free of material misstatement, whether due to error or fraud. Our audits included performing procedures to assess the risks of material misstatement of the consolidated financial statements, whether due to error or fraud, and performing procedures that respond to those risks. Such procedures included examining, on a test basis, evidence regarding the amounts and disclosures in the consolidated financial statements. Our audits also included evaluating the accounting principles used and significant estimates made by management, as well as evaluating the overall presentation of the consolidated financial statements. We believe that our audits and the reports of other auditors provide a reasonable basis for our opinion.
/s/ Ernst & Young LLP
We have served as the Company’s auditor since 1962.
Tulsa, Oklahoma
February 22, 2018
Report of Independent Registered Public Accounting Firm
To the Management Committee and Members of Gulfstream Natural Gas System, L.L.C.:
Opinion on the Financial Statements
We have audited the balance sheet of Gulfstream Natural Gas System, L.L.C. (the “Company”) as of December 31, 2017, and the related statements of operations, comprehensive income, cash flows, and members’ equity for the year then ended, including the related notes (collectively referred to as the “financial statements;” not presented herein). In our opinion, the financial statements present fairly, in all material respects, the financial position of the Company as of December 31, 2017, and the results of its operations and its cash flows for the year then ended in conformity with accounting principles generally accepted in the United States of America.
Basis for Opinion
These financial statements are the responsibility of the Company’s management. Our responsibility is to express an opinion on the Company’s financial statements based on our audit. We are a public accounting firm registered with the Public Company Accounting Oversight Board (United States) (“PCAOB”) and are required to be independent with respect to the Company in accordance with the U.S. federal securities laws and the applicable rules and regulations of the Securities and Exchange Commission and the PCAOB.
We conducted our audit of these financial statements in accordance with the standards of the PCAOB and in accordance with auditing standards generally accepted in the United States of America. Those standards require that we plan and perform the audit to obtain reasonable assurance about whether the financial statements are free of material misstatement, whether due to error or fraud.
Our audit included performing procedures to assess the risks of material misstatement of the financial statements, whether due to error or fraud, and performing procedures that respond to those risks. Such procedures included examining, on a test basis, evidence regarding the amounts and disclosures in the financial statements. Our audit also included evaluating the accounting principles used and significant estimates made by management, as well as evaluating the overall presentation of the financial statements. We believe that our audit provides a reasonable basis for our opinion.
/s/ PricewaterhouseCoopers LLP
Houston, Texas
February 22, 2018
We have served as the Company’s auditor since 2018.
Report of Independent Registered Public Accounting Firm
To the Members of Gulfstream Natural Gas System, L.L.C.
We have audited the balance sheet of Gulfstream Natural Gas System, L.L.C. (the "Company") as of December 31, 2016, and the related statement of operations, comprehensive income, cash flows, and members’ equity for each of the two years in the period ended December 31, 2016. These financial statements are the responsibility of the Company's management. Our responsibility is to express an opinion on these financial statements based on our audits.
We conducted our audits in accordance with the standards of the Public Company Accounting Oversight Board (United States) and in accordance with auditing standards generally accepted in the United States of America. Those standards require that we plan and perform the audit to obtain reasonable assurance about whether the financial statements are free of material misstatement. The Company is not required to have, nor were we engaged to perform, an audit of its internal control over financial reporting. Our audits included consideration of internal control over financial reporting as a basis for designing audit procedures that are appropriate in the circumstances, but not for the purpose of expressing an opinion on the effectiveness of the Company's internal control over financial reporting. Accordingly, we express no such opinion. An audit also includes examining, on a test basis, evidence supporting the amounts and disclosures in the financial statements, assessing the accounting principles used and significant estimates made by management, as well as evaluating the overall financial statement presentation. We believe t
Showing the first 8K of 282K characters. Open the full section
Item 9. Changes in and Disagreements with Accountants on Accounting and Financial Disclosure
None.
Item 9A. Controls and Procedures
Disclosure Controls and Procedures
Our management, including our Chief Executive Officer and Chief Financial Officer, does not expect that our disclosure controls and procedures (as defined in Rules 13a - 15(e) and 15d - 15(e) of the Securities Exchange Act) (Disclosure Controls) will prevent all errors and all fraud. A control system, no matter how well conceived and operated, can provide only reasonable, not absolute, assurance that the objectives of the control system are met. Further, the design of a control system must reflect the fact that there are resource constraints, and the benefits of controls must be considered relative to their costs. Because of the inherent limitations in all control systems, no evaluation of controls can provide absolute assurance that all control issues and instances of fraud, if any, within the company have been detected. These inherent limitations include the realities that judgments in decision-making can be faulty, and that breakdowns can occur because of simple error or mistake. Additionally, controls can be circumvented by the individual acts of some persons, by collusion of two or more people, or by management override of the control. The design of any system of controls also is based in part upon certain assumptions about the likelihood of future events, and there can be no assurance that any design will succeed in achieving its stated goals under all potential future conditions. Because of the inherent limitations in a cost-effective control system, misstatements due to error or fraud may occur and not be detected. We monitor our Disclosure Controls and make modifications as necessary; our intent in this regard is that the Disclosure Controls will be modified as systems change and conditions warrant.
Evaluation of Disclosure Controls and Procedures
An evaluation of the effectiveness of the design and operation of our Disclosure Controls was performed as of the end of the period covered by this report. This evaluation was performed under the supervision and with the participation of our management, including our Chief Executive Officer and Chief Financial Officer. Based upon that evaluation, our Chief Executive Officer and Chief Financial Officer concluded that these Disclosure Controls are effective at a reasonable assurance level.
Changes in Internal Control Over Financial Reporting
There have been no changes during the fourth quarter of 2017 that have materially affected, or are reasonably likely to materially affect, our Internal Control over Financial Reporting.
Management’s Annual Report on Internal Control over Financial Reporting
Management is responsible for establishing and maintaining adequate internal control over financial reporting (as defined in Rules 13a - 15(f) and 15d - 15(f) under the Securities Exchange Act of 1934). Our internal control over financial reporting is designed to provide reasonable assurance to our management and board of directors regarding the preparation and fair presentation of financial statements in accordance with accounting principles generally accepted in the United States. Our internal control over financial reporting includes those policies and procedures that (i) pertain to the maintenance of records that, in reasonable detail, accurately and fairly reflect the transactions and dispositions of our assets; (ii) provide reasonable assurance that transactions are recorded as to permit preparation of financial statements in accordance with generally accepted accounting principles, and that our receipts and expenditures are being made only in accordance with authorization of our management and board of directors; and (iii) provide reasonable assurance regarding prevention or timely detection of unauthorized acquisition, use or disposition of our assets that could have a material effect on our financial statements.
All internal control systems, no matter how well designed, have inherent limitations including the possibility of human error and the circumvention or overriding of controls. Therefore, even those systems determined to be effective can provide only reasonable assurance with respect to financial statement preparation and presentation.
Under the supervision and with the participation of our management, including our Chief Executive Officer and Chief Financial Officer, we assessed the effectiveness of our internal control over financial reporting as of December 31, 2017, based on the criteria set forth by the Committee of Sponsoring Organizations of the Treadway Commission (COSO) in Internal Control — Integrated Framework (2013). Based on our assessment, we concluded that, as of December 31, 2017, our internal control over financial reporting was effective.
Ernst & Young LLP, our independent registered public accounting firm, has audited our internal control over financial reporting, as stated in their report which is included in this Annual Report on Form 10-K.
Report of Independent Registered Public Accounting Firm
on Internal Control Over Financial Reporting
The Stockholders and the Board of Directors of
The Williams Companies, Inc.
Opinion on Internal Control Over Financial Reporting
We have audited The Williams Companies, Inc.’s internal control over financial reporting as of December 31, 2017, based on criteria established in Internal Control - Integrated Framework issued by the Committee of Sponsoring Organizations of the Treadway Commission (2013 framework) (the “COSO criteria”). In our opinion, The Williams Companies, Inc. (the “Company”) maintained, in all material respects, effective internal control over financial reporting as of December 31, 2017, based on the COSO criteria.
We also have audited, in accordance with the standards of the Public Company Accounting Oversight Board (United States) (“PCAOB”), the consolidated balance sheet of the Company as of December 31, 2017 and 2016, and the related consolidated statements of operations, comprehensive income (loss), changes in equity and cash flows for each of the three years in the period ended December 31, 2017, and the related notes and financial statement schedules listed in the index at Item 15(a) and our report dated February 22, 2018 expressed an unqualified opinion thereon.
Basis for Opinion
The Company’s management is responsible for maintaining effective internal control over financial reporting and for its assessment of the effectiveness of internal control over financial reporting included in the accompanying Management’s Annual Report on Internal Control over Financial Reporting. Our responsibility is to express an opinion on the Company’s internal control over financial reporting based on our audit. We are a public accounting firm registered with the PCAOB and are required to be independent with respect to the Company in accordance with the U.S. federal securities laws and the applicable rules and regulations of the Securities and Exchange Commission and the PCAOB.
We conducted our audit in accordance with the standards of the PCAOB. Those standards require that we plan and perform the audit to obtain reasonable assurance about whether effective internal control over financial reporting was maintained in all material respects.
Our audit included obtaining an understanding of internal control over financial reporting, assessing the risk that a material weakness exists, testing and evaluating the design and operating effectiveness of internal control based on the assessed risk, and performing such other procedures as we considered necessary in the circumstances. We believe that our audit provides a reasonable basis for our opinion.
Definition and Limitations of Internal Control Over Financial Reporting
A company’s internal control over financial reporting is a process designed to provide reasonable assurance regarding the reliability of financial reporting and the preparation of financial statements for external purposes in accordance with generally accepted accounting principles. A company’s internal control over financial reporting includes those policies and procedures that (1) pertain to the maintenance of records that, in reasonable detail, accurately and fairly reflect the transactions and dispositions of the assets of the company; (2) provide reasonable assurance that transactions are recorded as necessary to permit preparation of financial statements in accordance with generally accepted accounting principles, and that receipts and expenditures of the company are being made only in accordance with authorizations of management and directors of the company; and (3) provide reasonable assurance regarding prevention or timely detection of unauthorized acquisition, use, or disposition of the company’s assets that could have a material effect on the financial statements.
Because of its inherent limitations, internal control over financial reporting may not prevent or detect misstatements. Also, projections of any evaluation of effectiveness to future periods are subject to the risk that controls may become inadequate because of changes in conditions, or that the degree of compliance with the policies or procedures may deteriorate.
/s/ Ernst & Young LLP
Tulsa, Oklahoma
February 22, 2018
Item 9B. Other Information
None.
PART III
Item 10. Directors, Executive Officers and Corporate Governance
The information regarding our directors and nominees for director required by Item 401 of Regulation S-K will be presented under the heading “Election of Directors” in our definitive proxy statement prepared for the solicitation of proxies in connection with our Annual Meeting of Stockholders to be held May 10, 2018, which shall be filed no later than April 30, 2018 (Proxy Statement), which information is incorporated by reference herein.
Information regarding our executive officers required by Item 401(b) of Regulation S-K is presented at the end of Part I herein and captioned “Executive Officers of the Registrant” as permitted by General Instruction G(3) to and Instruction 3 to Item 401(b) of Regulation S-K.
Information required by Item 405 of Regulation S-K will be included under the heading “Section 16(a) Beneficial Ownership Reporting Compliance” in our Proxy Statement, which information is incorporated by reference herein.
Information required by paragraphs (c)(3), (d)(4) and (d)(5) of Item 407 of Regulation S-K will be included under the heading “Questions and Answers About the Annual Meeting and Voting” and “Corporate Governance and Board Matters” in our Proxy Statement, which information is incorporated by reference herein.
We have adopted a Code of Ethics for Senior Officers that applies to our Chief Executive Officer, Chief Financial Officer, and Controller, or persons performing similar functions. The Code of Ethics for Senior Officers, together with our Corporate Governance Guidelines, the charters for each of our board committees, and our Code of Business Conduct applicable to all employees are available on our Internet website at www.williams.com. We will provide, free of charge, a copy of our Code of Ethics or any of our other corporate documents listed above upon written request to our Corporate Secretary at Williams, One Williams Center, Suite 4700, Tulsa, Oklahoma 74172. We intend to disclose any amendments to or waivers of the Code of Ethics on behalf of our Chief Executive Officer, Chief Financial Officer, Controller, and persons performing similar functions on the corporate governance section of our Internet website at www.williams.com, promptly following the date of any such amendment or waiver.
Item 11. Executive Compensation
The information required by Item 402 and paragraphs (e)(4) and (e)(5) of Item 407 of Regulation S-K regarding executive compensation will be presented under the headings “Compensation Discussion and Analysis,” “Executive Compensation and Other Information,” “Compensation of Directors,” “Compensation and Management Development Committee Report on Executive Compensation,” and “Compensation and Management Development Committee Interlocks and Insider Participation” in our Proxy Statement, which information is incorporated by reference herein. Notwithstanding the foregoing, the information provided under the heading “Compensation and Management Development Committee Report on Executive Compensation” in our Proxy Statement is furnished and shall not be deemed to be filed for purposes of Section 18 of the Securities Exchange Act of 1934, as amended, is not subject to the liabilities of that section and is not deemed incorporated by reference in any filing under the Securities Act of 1933, as amended.
Item 12. Security Ownership of Certain Beneficial Owners and Management and Related Stockholder Matters
The information regarding securities authorized for issuance under equity compensation plans required by Item 201(d) of Regulation S-K and the security ownership of certain beneficial owners and management required by Item 403 of Regulation S-K will be presented under the headings “Equity Compensation Stock Plans” and “Security
Ownership of Certain Beneficial Owners and Management” in our Proxy Statement, which information is incorporated by reference herein.
Item 13. Certain Relationships and Related Transactions, and Director Independence
The information regarding certain relationships and related transactions required by Item 404 and Item 407(a) of Regulation S-K will be presented under the heading “Corporate Governance and Board Matters” in our Proxy Statement, which information is incorporated by reference herein.
Item 14. Principal Accountant Fees and Services
The information regarding our principal accounting fees and services required by Item 9(e) of Schedule 14A will be presented under the heading “Principal Accountant Fees and Services” in our Proxy Statement, which information is incorporated by reference herein.
PART IV
Item 15. Exhibits and Financial Statement Schedules
(a) 1 and 2.
All other schedules have been omitted since the required information is not present or is not present in amounts sufficient to require submission of the schedule, or because the information required is included in the financial statements and notes thereto.
(a) 3 and (b). The exhibits listed below are filed as part of this annual report.
INDEX TO EXHIBITS
| ______________ | |
| * | Filed herewith |
| ** | Furnished herewith |
| § | Management contract or compensatory plan or arrangement |
| + | Pursuant to item 601(6)(2) of Regulation S-K, the registrant agrees to furnish supplementally a copy of any omitted exhibit or schedule to the SEC upon request. |
Item 16. Form 10-K Summary
Not applicable.
SIGNATURES
Pursuant to the requirements of Section 13 or 15(d) of the Securities Exchange Act of 1934, the registrant has duly caused this report to be signed on its behalf by the undersigned, thereunto duly authorized.
| THE WILLIAMS COMPANIES, INC. (Registrant) | ||
| By: | /s/ TED T. TIMMERMANS | |
| Ted T. Timmermans Vice President, Controller and Chief Accounting Officer |
Date: February 22, 2018
Pursuant to the requirements of the Securities Exchange Act of 1934, this report has been signed below by the following persons on behalf of the registrant and in the capacities and on the dates indicated.
| Signature | Title | Date | ||
| /s/ ALAN S. ARMSTRONG | President, Chief Executive Officer and Director | February 22, 2018 | ||
| Alan S. Armstrong | (Principal Executive Officer) | |||
| /s/ JOHN D. CHANDLER | Senior Vice President and Chief Financial Officer | February 22, 2018 | ||
| John D. Chandler | (Principal Financial Officer) | |||
| /s/ TED T. TIMMERMANS | Vice President, Controller and Chief Accounting Officer | February 22, 2018 | ||
| Ted T. Timmermans | (Principal Accounting Officer) | |||
| /s/ STEPHEN W. BERGSTROM | Chairman of the Board | February 22, 2018 | ||
| Stephen W. Bergstrom | ||||
| /s/ STEPHEN I. CHAZEN | Director | February 22, 2018 | ||
| Stephen I. Chazen | ||||
| /s/ CHARLES I. COGUT | Director | February 22, 2018 | ||
| Charles I. Cogut | ||||
| /s/ KATHLEEN B. COOPER | Director | February 22, 2018 | ||
| Kathleen B. Cooper | ||||
| /s/ MICHAEL A. CREEL | Director | February 22, 2018 | ||
| Michael A. Creel | ||||
| /s/ PETER A. RAGAUSS | Director | February 22, 2018 | ||
| Peter A. Ragauss | ||||
| /s/ SCOTT D. SHEFFIELD | Director | February 22, 2018 | ||
| Scott D. Sheffield | ||||
| /s/ MURRAY D. SMITH | Director | February 22, 2018 | ||
| Murray D. Smith | ||||
| Signature | Title | Date | ||
| /s/ WILLIAM H. SPENCE | Director | February 22, 2018 | ||
| William H. Spence | ||||
| /s/ JANICE D. STONEY | Director | February 22, 2018 | ||
| Janice D. Stoney |