 filings.tools
Item 5. Market for Registrant’s Common Equity, Related Stockholder Matters and Issuer Purchases of Equity Securities
3K characters. Original on sec.gov · Markdown
Item 5. Market for Registrant’s Common Equity, Related Stockholder Matters and Issuer Purchases of Equity Securities
Our common stock is listed on the New York Stock Exchange under the symbol “WMB.” At the close of business on February 19, 2018, we had approximately 6,979 holders of record of our common stock. The high and low sales price ranges (New York Stock Exchange composite transactions) and dividends declared by quarter for each of the past two years are as follows:
| High | Low | Dividend | |||||||||
| 2017 | |||||||||||
| First Quarter | $ | 32.69 | $ | 27.68 | $ | 0.30 | |||||
| Second Quarter | 31.25 | 27.65 | 0.30 | ||||||||
| Third Quarter | 32.18 | 28.76 | 0.30 | ||||||||
| Fourth Quarter | 30.72 | 26.82 | 0.30 | ||||||||
| 2016 | |||||||||||
| First Quarter | $ | 26.68 | $ | 10.22 | $ | 0.64 | |||||
| Second Quarter | 23.89 | 14.60 | 0.64 | ||||||||
| Third Quarter | 31.43 | 19.68 | 0.20 | ||||||||
| Fourth Quarter | 32.21 | 27.35 | 0.20 |
Some of our subsidiaries’ borrowing arrangements may limit the transfer of funds to us. These terms have not impeded, nor are they expected to impede, our ability to pay dividends. On February 21, 2018, our board of directors approved a regular quarterly dividend of $0.34 per share payable on March 26, 2018.
Performance Graph
Set forth below is a line graph comparing our cumulative total stockholder return on our common stock (assuming reinvestment of dividends) with the cumulative total return of the S&P 500 Stock Index and the Bloomberg Americas Pipelines Index for the period of five fiscal years commencing January 1, 2013. The Bloomberg Americas Pipelines Index is composed of Enbridge Inc., Kinder Morgan, Inc., TransCanada Corporation, ONEOK, Inc., Pembina Pipeline Corporation, Cheniere Energy, Inc., Targa Resources Corp., Inter Pipeline Ltd., Keyera Corp., AltaGas Ltd., Plains GP Holdings, L.P., and Williams. The graph below assumes an investment of $100 at the beginning of the period.
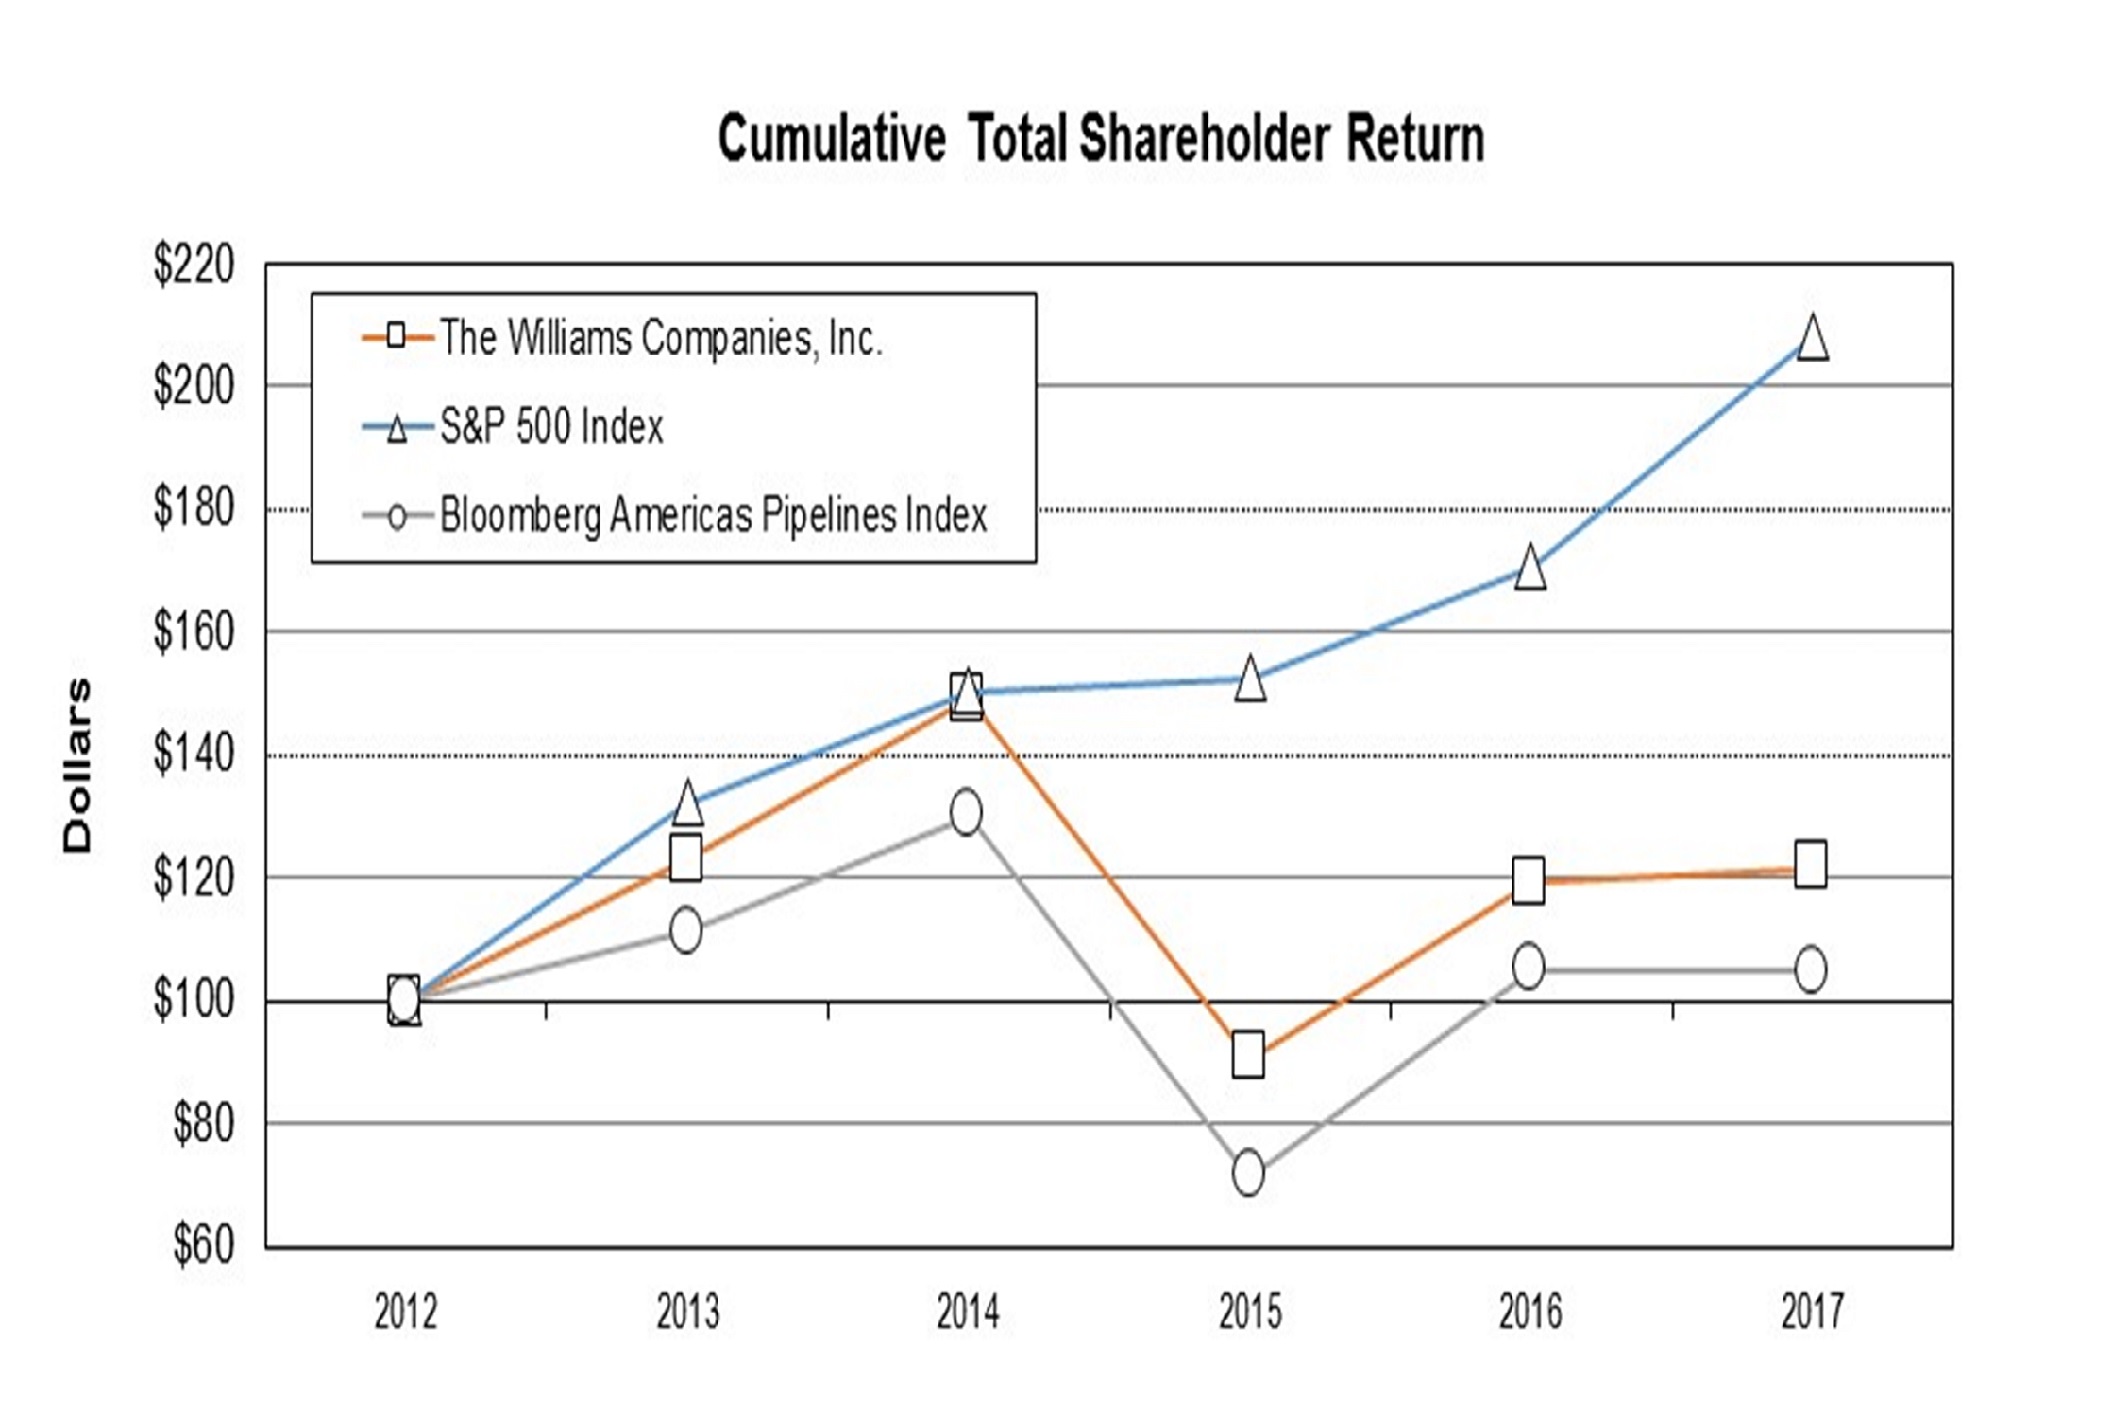
| 2012 | 2013 | 2014 | 2015 | 2016 | 2017 | ||||||
| The Williams Companies, Inc. | 100.0 | 122.8 | 149.1 | 90.6 | 119.1 | 121.5 | |||||
| S&P 500 Index | 100.0 | 132.4 | 150.5 | 152.5 | 170.8 | 208.1 | |||||
| Bloomberg Americas Pipelines Index | 100.0 | 111.0 | 130.0 | 71.5 | 105.0 | 104.7 |
Previous: Item 4. Mine Safety Disclosures · Next: Item 6. Selected Financial Data