 filings.tools
Item 1. Business
76K characters. Original on sec.gov · Markdown
Item 1. Business
In this report, Williams (which includes The Williams Companies, Inc. and, unless the context otherwise indicates, all of our subsidiaries) is at times referred to in the first person as “we,” “us,” or “our.” We also sometimes refer to Williams as the “Company.”
GENERAL
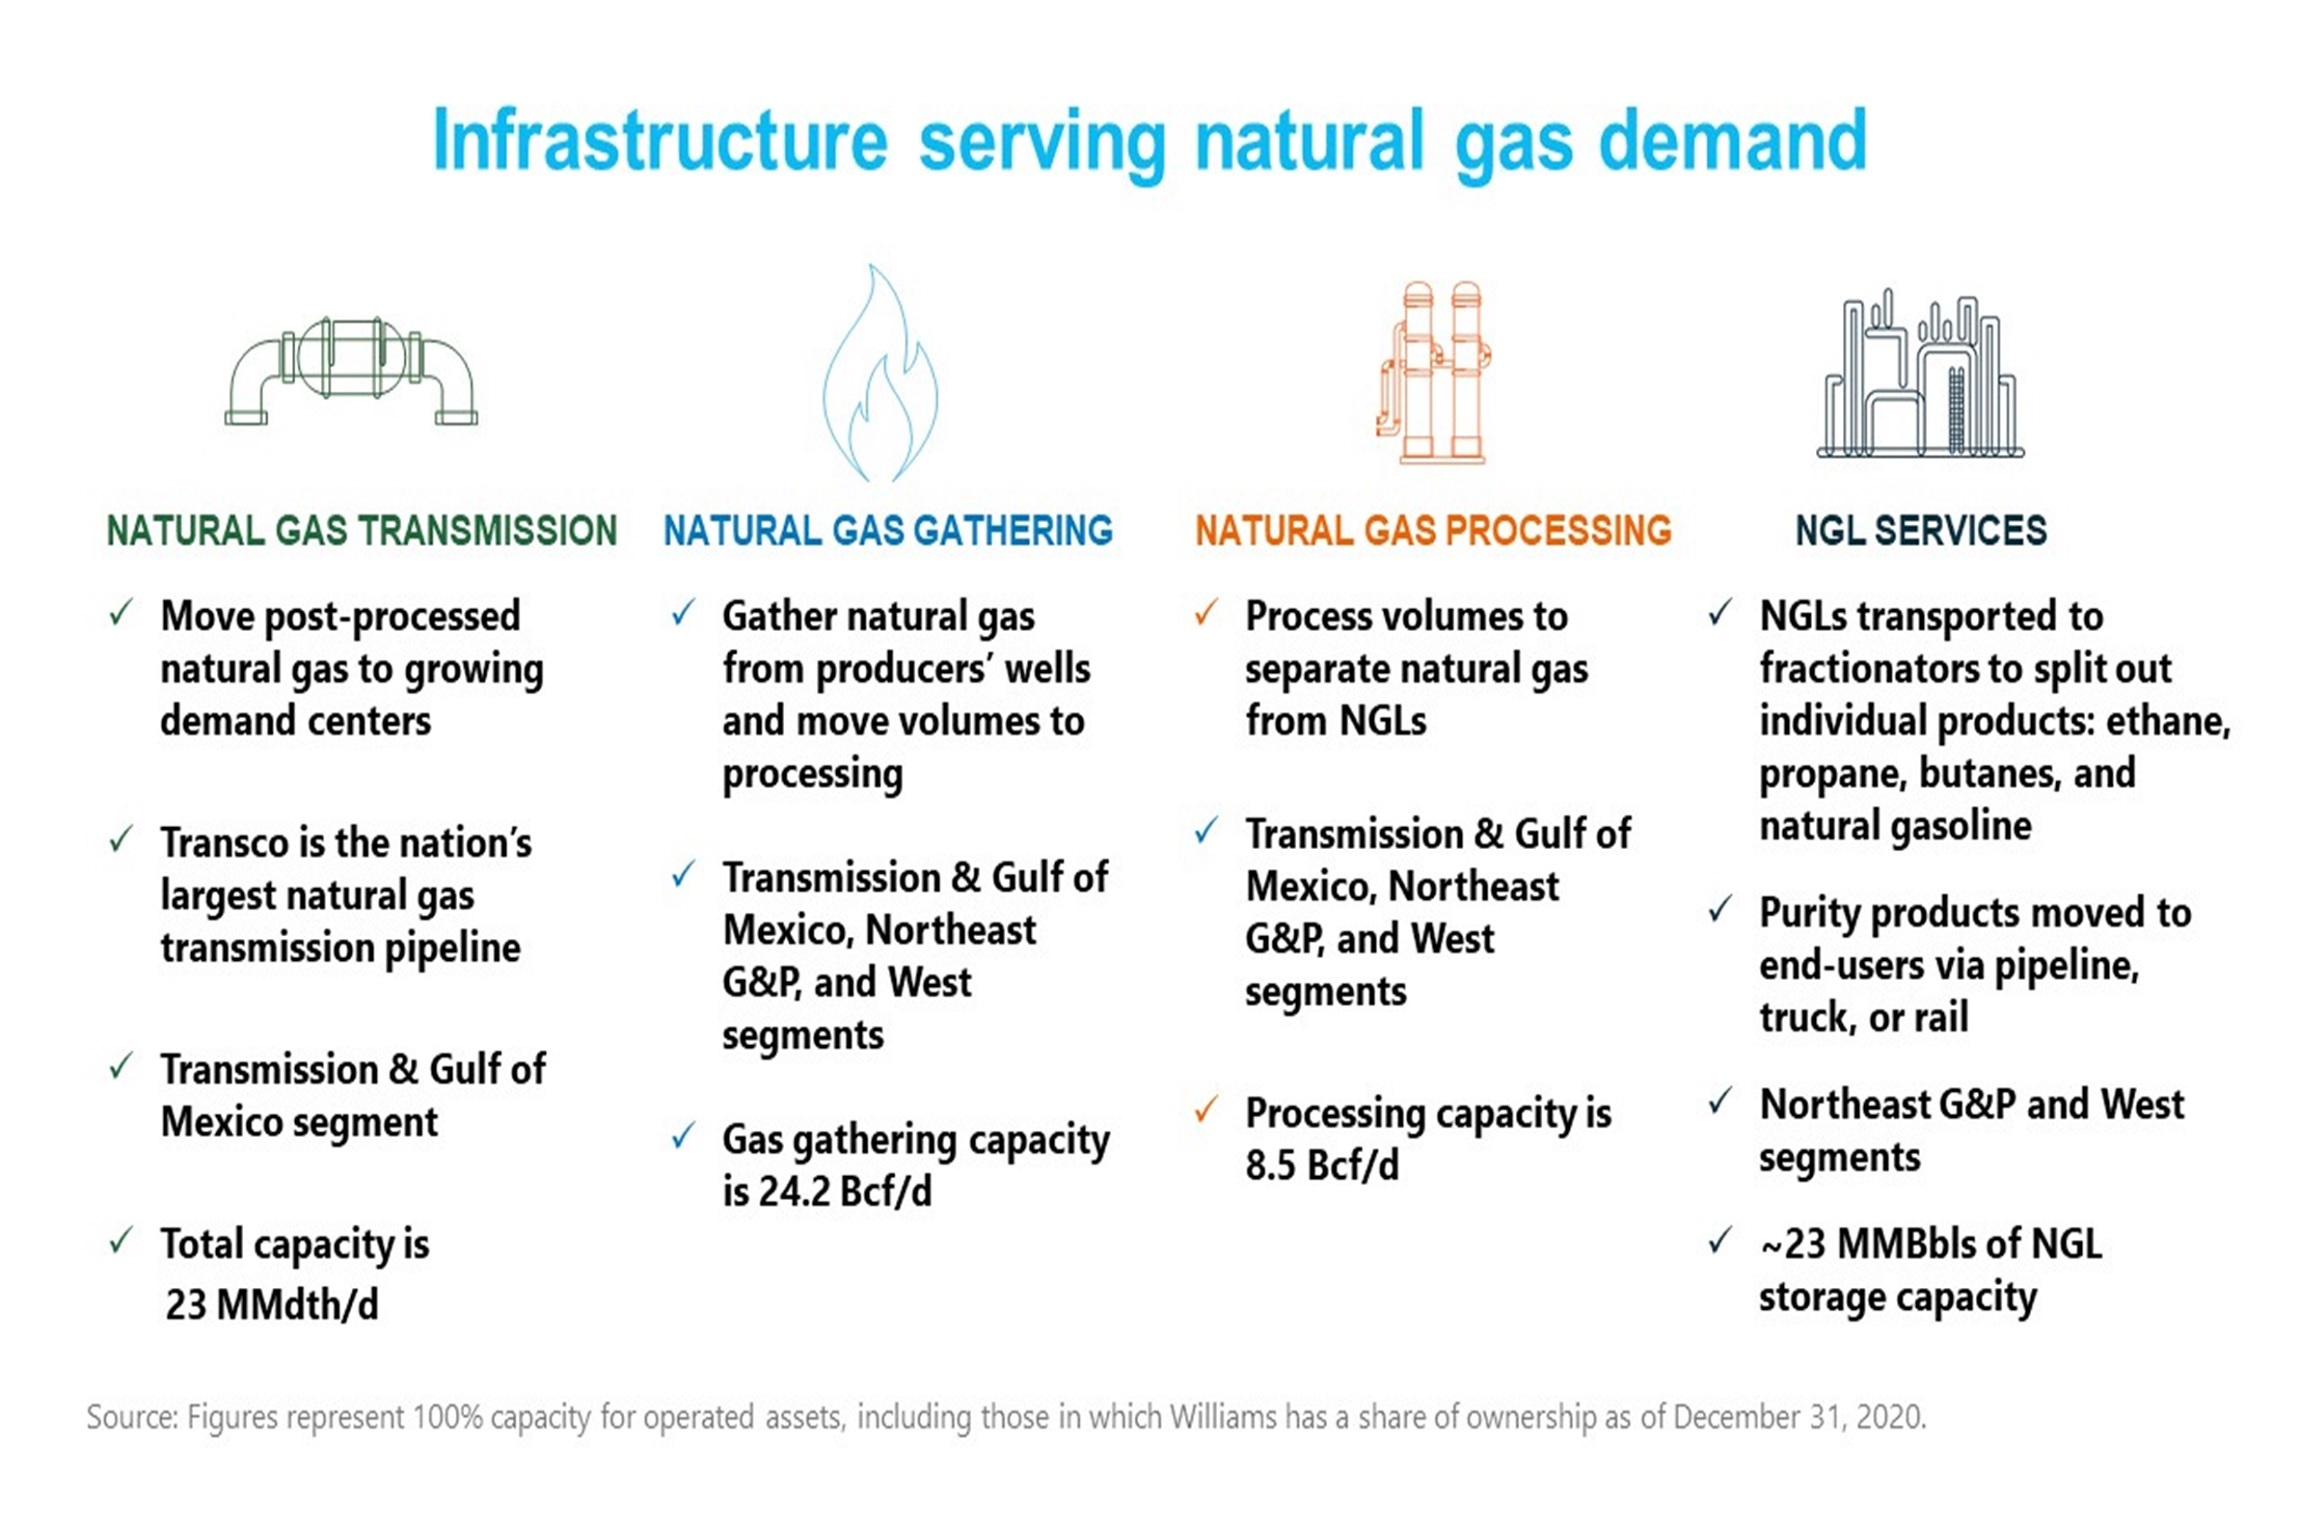
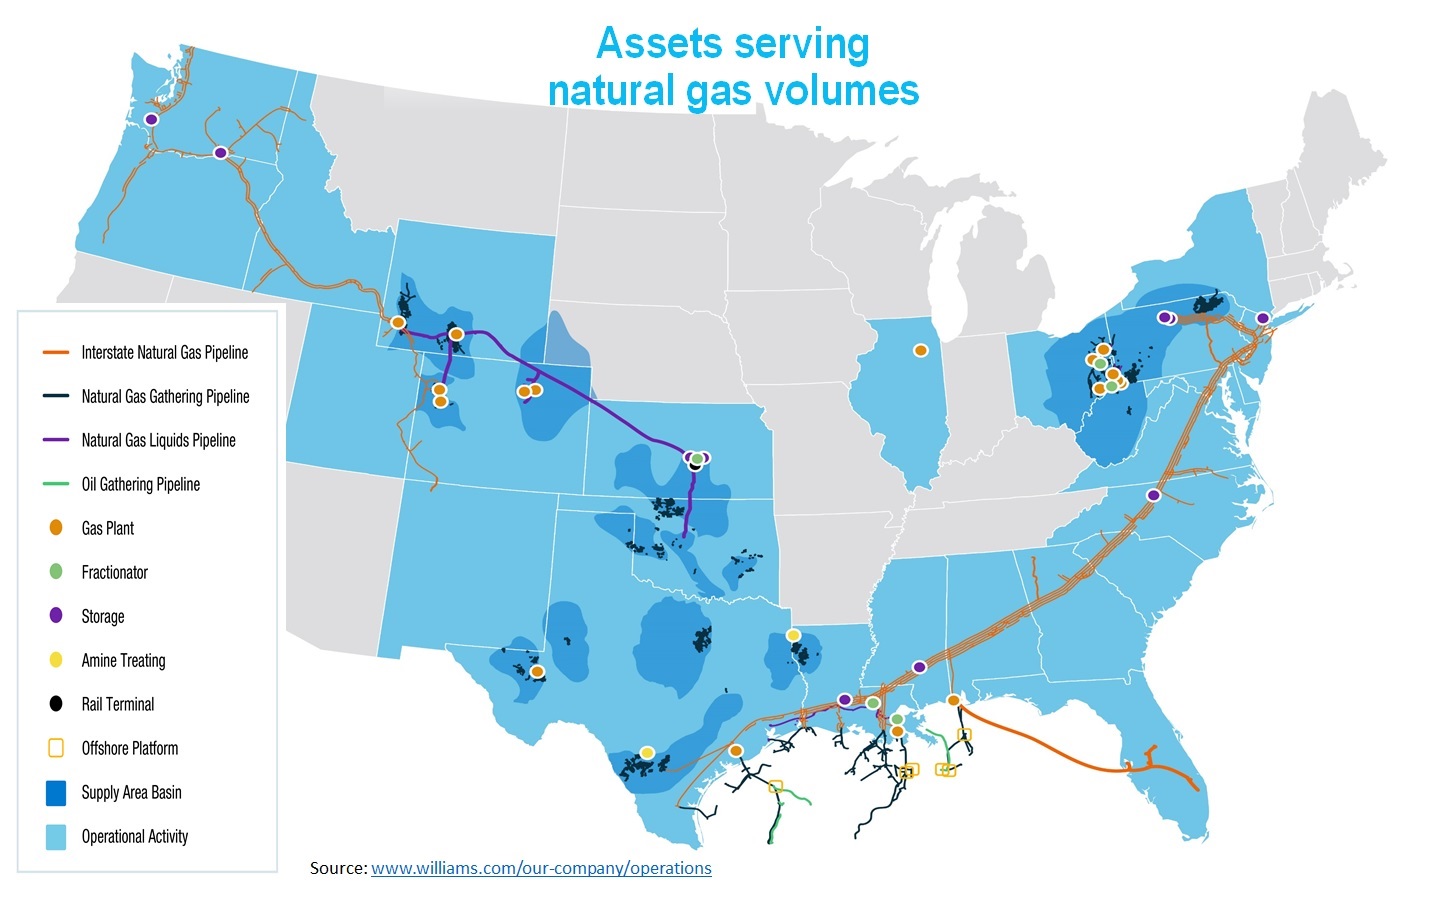
We are an energy infrastructure company committed to be the leader in providing infrastructure that safely delivers natural gas products to reliably fuel the clean energy economy. We have operations in 15 supply areas that provide natural gas gathering, processing, and transmission services and natural gas liquids fractionation, transportation, and storage services to more than 600 customers. We own an interest in and operate over 30,000 miles of pipelines, 34 processing facilities, 9 fractionation facilities, and approximately 23 million barrels of NGL storage capacity, handling approximately 30 percent of the nation’s natural gas volumes.
 |
We were founded in 1908, originally incorporated under the laws of the state of Nevada in 1949 and reincorporated under the laws of the state of Delaware in 1987. Our common stock trades on the New York Stock Exchange under the symbol “WMB.” Our operations are located in the United States. Williams’ headquarters are located in Tulsa, Oklahoma, with other major offices in Salt Lake City, Utah; Houston, Texas; and Pittsburgh, Pennsylvania. Our telephone number is 918-573-2000.
 |
Service Assets, Customers, and Contracts
Interstate Natural Gas Pipeline Assets
Our interstate natural gas pipelines, which are presented in our Transmission & Gulf of Mexico segment as described under the heading “Business Segments,” are subject to regulation by the FERC and as such, our rates and charges for the transportation of natural gas in interstate commerce are subject to regulation. The rates are established through the FERC’s ratemaking process.
Our interstate natural gas pipelines transport and store natural gas for a broad mix of customers, including local natural gas distribution companies, public utilities, municipalities, direct industrial users, electric power generators, and natural gas marketers and producers. Our interstate natural gas transmission businesses are fully contracted under long-term firm reservation contracts with high credit quality customers. These contracts have various expiration dates and account for the major portion of our regulated businesses, and are not exposed to crude oil prices. Additionally, we offer storage services and interruptible transportation services under shorter-term agreements. Transco’s and Northwest Pipeline’s three largest customers in 2020 accounted for approximately 28 percent and 51 percent, respectively, of their total operating revenues.
Gathering, Processing, and Treating Assets
Our gathering, processing, and treating operations are presented within our Transmission & Gulf of Mexico, Northeast G&P, and West reporting segments as described under the heading “Business Segments.”
Our gathering systems receive natural gas from producers’ crude oil and natural gas wells and gather these volumes to gas processing, treating, or redelivery facilities. Typically, natural gas, in its raw form, is not acceptable for transportation in major interstate natural gas pipelines or for commercial use as a fuel. Our treating facilities
remove water vapor, carbon dioxide, and other contaminants, and collect condensate. We are generally paid a fee based on the volume of natural gas gathered and/or treated, generally measured in the Btu heating value.
In addition, natural gas contains various amounts of NGLs, which generally have a higher value when separated from the natural gas stream. Our processing plants extract the NGLs, which include ethane, primarily used in the petrochemical industry; propane, used for heating, fuel, and also in the petrochemical industry; and, normal butane, isobutane, and natural gasoline, primarily used by the refining industry.
Our gas processing services generate revenues primarily from the following types of contracts:
-
Fee-based: We are paid a fee based on the volume of natural gas processed, generally measured in the Btu heating value. A portion of our fee-based processing revenue includes a share of the margins on the NGLs produced. For the year ended December 31, 2020, approximately 80 percent of our NGL production volumes were under fee-based contracts.
-
Noncash commodity-based: We also process gas under two types of commodity-based contracts, keep-whole and percent-of-liquids, where we receive consideration for our services in the form of NGLs. For a keep-whole arrangement we replace the Btu content of the retained NGLs with natural gas purchases, also known as shrink replacement gas. For a percent-of-liquids arrangement, we deliver an agreed-upon percentage of the extracted NGLs and retain the remainder. Retained NGLs are referred to as our equity NGL production. Per-unit NGL margins are calculated based on sales of our own equity volumes at the processing plants. For the year ended December 31, 2020, approximately 20 percent of our NGL production volumes were under noncash commodity-based contracts.
Generally, our gathering and processing agreements are long-term agreements, with terms ranging from month-to-month to the life of the producing lease. Certain contracts include cost of service mechanisms that are designed to support a return on invested capital and allow our gathering rates to be adjusted, subject to specified caps in certain cases, to account for variability in volume, capital expenditures, commodity price fluctuations, compression and other expenses. We also have certain gas gathering and processing agreements with MVC, whereby the customer is obligated to pay a contractually determined fee based on any shortfall between the actual gathered and processed volumes and the MVC for a stated period.
Demand for gas gathering and processing services is dependent on producers’ drilling activities, which is impacted by the strength of the economy, commodity prices, and the resulting demand for natural gas by manufacturing and industrial companies and consumers. Our gathering, processing, and treating businesses do not have direct exposure to crude oil prices. Our on-shore natural gas gathering and processing businesses are substantially focused on gas-directed drilling basins rather than crude oil, with a broad diversity of basins and customers served. Declines in crude oil drilling would be expected to result in less associated natural gas production, which could drive more demand for natural gas produced from gas-directed basins we serve.
During 2020, our facilities gathered and processed gas and crude oil for approximately 230 customers. Our top ten customers accounted for approximately 73 percent of our gathering and processing fee revenues and NGL margins from our noncash commodity-based agreements. We believe counterparty credit concerns in our gathering and processing businesses are significantly mitigated by the physical nature of our services, where we gather at the wellhead and are therefore critical to a producer’s ability to move product to market.
Crude Oil Transportation and Production Handling Assets
Our crude oil transportation operations, which are presented in our Transmission & Gulf of Mexico segment as described under the heading “Business Segments,” earn revenues typically by volumetric-based fee arrangements. Revenue sources have historically included a combination of fixed-fee, volumetric-based fee, and cost reimbursement arrangements. Generally, fixed fees associated with the production at our Gulf Coast production handling facilities are recognized on a units-of-production basis. Certain fixed fees associated with the production at our Gulfstar One facility are recognized based on contractually determined maximum daily quantities. Our crude oil transportation business is supported mostly by major oil producers with long-cycle perspectives.
Key variables for all of our businesses will continue to be:
-
Obstacles to our expansion efforts, including delays or denials of necessary permits and opposition to hydrocarbon-based energy development;
-
Producer drilling activities impacting natural gas supplies supporting our gathering and processing volumes;
-
Retaining and attracting customers by continuing to provide reliable services;
-
Revenue growth associated with additional infrastructure either completed or currently under construction;
-
Prices impacting our commodity-based activities;
-
Disciplined growth in our service areas.
BUSINESS SEGMENTS
Consistent with the manner in which our chief operating decision maker evaluates performance and allocates resources, our operations are conducted, managed, and presented in Part I of this Annual Report within the following reportable segments: Transmission & Gulf of Mexico, Northeast G&P, and West.
Our reportable segments are comprised of the following business activities:
-
Transmission & Gulf of Mexico is comprised of our interstate natural gas pipelines, Transco and Northwest Pipeline, as well as natural gas gathering and processing and crude oil production handling and transportation assets in the Gulf Coast region, including a 51 percent interest in Gulfstar One (a consolidated variable interest entity), which is a proprietary floating production system, a 50 percent equity-method investment in Gulfstream, and a 60 percent equity-method investment in Discovery.
-
Northeast G&P is comprised of our midstream gathering, processing, and fractionation businesses in the Marcellus Shale region primarily in Pennsylvania and New York, and the Utica Shale region of eastern Ohio, as well as a 65 percent interest in our Northeast JV (a consolidated variable interest entity) which operates in West Virginia, Ohio, and Pennsylvania, a 66 percent interest in Cardinal (a consolidated variable interest entity) which operates in Ohio, a 69 percent equity-method investment in Laurel Mountain, a 99 percent interest in Caiman II (a former equity-method investment which is a consolidated entity following our November 2020 acquisition of an additional ownership interest) which owns a 50 percent equity-method investment in Blue Racer, and Appalachia Midstream Investments, a wholly owned subsidiary that owns equity-method investments with an approximate average 66 percent interest in multiple gas gathering systems in the Marcellus Shale region.
-
West is comprised of our gas gathering, processing, and treating operations in the Rocky Mountain region of Colorado and Wyoming, the Barnett Shale region of north-central Texas, the Eagle Ford Shale region of south Texas, the Haynesville Shale region of northwest Louisiana, and the Mid-Continent region which includes the Anadarko, Arkoma, and Permian basins. This segment also includes our NGL and natural gas marketing business, storage facilities, an undivided 50 percent interest in an NGL fractionator near Conway, Kansas, a 50 percent equity-method investment in OPPL, a 50 percent equity-method investment in RMM, and a 20 percent equity-method investment in Targa Train 7.
-
Other includes minor business activities that are not reportable segments, as well as corporate operations.
Detailed discussion of each of our reporting segments follows. For a discussion of our ongoing expansion projects, see Part II, Item 7. Management’s Discussion and Analysis of Financial Condition and Results of Operations.
Transmission & Gulf of Mexico
This segment includes the Transco interstate natural gas pipeline that extends from the Gulf of Mexico to the eastern seaboard, the Northwest Pipeline interstate natural gas pipeline, as well as natural gas gathering, processing and treating, crude oil production handling, and NGL fractionation assets within the onshore, offshore shelf, and deepwater areas in and around the Gulf Coast states of Texas, Louisiana, Mississippi, and Alabama. This segment also includes various petrochemical and feedstock pipelines in the Gulf Coast region.
Transco
Transco is an interstate natural gas transmission company that owns and operates a 9,800-mile natural gas pipeline system, which is regulated by the FERC, extending from Texas, Louisiana, Mississippi, and the Gulf of Mexico through Alabama, Georgia, South Carolina, North Carolina, Virginia, Maryland, Delaware, Pennsylvania, and New Jersey to the New York City metropolitan area. The system serves customers in Texas and 12 southeast and Atlantic seaboard states, including major metropolitan areas in Georgia, North Carolina, Washington, D.C., Maryland, New York, New Jersey, and Pennsylvania.
At December 31, 2020, Transco’s system had a system-wide delivery capacity totaling approximately 17.9 MMdth/d. During 2020, Transco completed one fully-contracted expansion and began partial early service on two additional fully-contracted expansions, which added more than 0.5 MMdth of firm transportation capacity per day to our pipeline. Transco’s system includes 57 compressor stations, four underground storage fields, and one LNG storage facility. Compression facilities at sea level-rated capacity total approximately 2.3 million horsepower.
Transco has natural gas storage capacity in four underground storage fields located on or near its pipeline system or market areas and operates two of these storage fields. Transco also has storage capacity in an LNG storage facility that it owns and operates. The total usable gas storage capacity available to Transco and its customers in such underground storage fields and LNG storage facility and through storage service contracts is approximately 194 MMdth of natural gas. At December 31, 2020, Transco’s customers had stored in its facilities approximately 148 MMdth of natural gas. Storage capacity permits our customers to inject gas into storage during the summer and off-peak periods for delivery during peak winter demand periods.
Northwest Pipeline
Northwest Pipeline is an interstate natural gas transmission company that owns and operates a 3,900-mile natural gas pipeline system, which is regulated by the FERC, extending from the San Juan basin in northwestern New Mexico and southwestern Colorado through Colorado, Utah, Wyoming, Idaho, Oregon, and Washington to a point on the Canadian border near Sumas, Washington. Northwest Pipeline provides services for markets in Washington, Oregon, Idaho, Wyoming, Nevada, Utah, Colorado, New Mexico, California, and Arizona, either directly or indirectly through interconnections with other pipelines.
At December 31, 2020, Northwest Pipeline’s system had long-term firm transportation and storage redelivery agreements with aggregate capacity reservations of approximately 3.8 MMdth/d. Northwest Pipeline’s system includes 42 transmission compressor stations having a combined sea level-rated capacity of approximately 473,000 horsepower.
Northwest Pipeline owns a one-third undivided interest in the Jackson Prairie underground storage facility in Washington and contracts with a third party for natural gas storage services in the Clay basin underground field in Utah. Northwest Pipeline also owns and operates an LNG storage facility in Washington. These storage facilities have an aggregate working natural gas storage capacity of 14.2 MMdth, which is substantially utilized for third-party natural gas. These natural gas storage facilities enable Northwest Pipeline to balance daily receipts and deliveries and provide storage services to customers.
Gas Transportation, Processing, and Treating Assets
The following tables summarize the significant operated assets of this segment:
| Offshore Natural Gas Pipelines | ||||||||||||||||||||||||||||||||
| Inlet | ||||||||||||||||||||||||||||||||
| Pipeline | Capacity | Ownership | ||||||||||||||||||||||||||||||
| Location | Miles | (Bcf/d) | Interest | Supply Basins | ||||||||||||||||||||||||||||
| Consolidated: | ||||||||||||||||||||||||||||||||
| Canyon Chief, including Blind Faith and Gulfstar extensions | Deepwater Gulf of Mexico | 156 | 0.5 | 100% | Eastern Gulf of Mexico | |||||||||||||||||||||||||||
| Norphlet | Deepwater Gulf of Mexico | 58 | 0.3 | 100% | Eastern Gulf of Mexico | |||||||||||||||||||||||||||
| Other Eastern Gulf | Offshore shelf and other | 46 | 0.2 | 100% | Eastern Gulf of Mexico | |||||||||||||||||||||||||||
| Seahawk | Deepwater Gulf of Mexico | 115 | 0.4 | 100% | Western Gulf of Mexico | |||||||||||||||||||||||||||
| Perdido Norte | Deepwater Gulf of Mexico | 105 | 0.3 | 100% | Western Gulf of Mexico | |||||||||||||||||||||||||||
| Other Western Gulf | Offshore shelf and other | 103 | 0.4 | 100% | Western Gulf of Mexico | |||||||||||||||||||||||||||
| Non-consolidated: (1) | ||||||||||||||||||||||||||||||||
| Discovery | Central Gulf of Mexico | 594 | 0.6 | 60% | Western Gulf of Mexico | |||||||||||||||||||||||||||
| Natural Gas Processing Facilities | ||||||||||||||||||||||||||||||||
| NGL | ||||||||||||||||||||||||||||||||
| Inlet | Production | |||||||||||||||||||||||||||||||
| Capacity | Capacity | Ownership | ||||||||||||||||||||||||||||||
| Location | (Bcf/d) | (Mbbls/d) | Interest | Supply Basins | ||||||||||||||||||||||||||||
| Consolidated: | ||||||||||||||||||||||||||||||||
| Markham | Markham, TX | 0.5 | 45 | 100% | Western Gulf of Mexico | |||||||||||||||||||||||||||
| Mobile Bay | Coden, AL | 0.7 | 35 | 100% | Eastern Gulf of Mexico | |||||||||||||||||||||||||||
| Non-consolidated: (1) | ||||||||||||||||||||||||||||||||
| Discovery | Larose, LA | 0.6 | 32 | 60% | Western Gulf of Mexico |
(1)Includes 100 percent of the statistics associated with operated equity-method investments.
Crude Oil Transportation and Production Handling Assets
In addition to our natural gas assets, we own and operate four deepwater crude oil pipelines and own production platforms serving the deepwater in the Gulf of Mexico. Our offshore floating production platforms provide centralized services to deepwater producers such as compression, separation, production handling, water removal, and pipeline landings.
The following tables summarize the significant crude oil transportation pipelines and production handling platforms of this segment:
| Crude Oil Pipelines | |||||||||||||||||||||||||||||||||||
| Pipeline | Capacity | Ownership | |||||||||||||||||||||||||||||||||
| Miles | (Mbbls/d) | Interest | Supply Basins | ||||||||||||||||||||||||||||||||
| Consolidated: | |||||||||||||||||||||||||||||||||||
| Mountaineer, including Blind Faith and Gulfstar extensions | 155 | 150 | 100% | Eastern Gulf of Mexico | |||||||||||||||||||||||||||||||
| BANJO | 57 | 90 | 100% | Western Gulf of Mexico | |||||||||||||||||||||||||||||||
| Alpine | 96 | 85 | 100% | Western Gulf of Mexico | |||||||||||||||||||||||||||||||
| Perdido Norte | 74 | 150 | 100% | Western Gulf of Mexico | |||||||||||||||||||||||||||||||
| Production Handling Platforms | |||||||||||||||||||||||||||||||||||
| Crude/NGL | |||||||||||||||||||||||||||||||||||
| Gas Inlet | Handling | ||||||||||||||||||||||||||||||||||
| Capacity | Capacity | Ownership | |||||||||||||||||||||||||||||||||
| (MMcf/d) | (Mbbls/d) | Interest | Supply Basins | ||||||||||||||||||||||||||||||||
| Consolidated: | |||||||||||||||||||||||||||||||||||
| Devils Tower | 110 | 60 | 100% | Eastern Gulf of Mexico | |||||||||||||||||||||||||||||||
| Gulfstar I FPS (1) | 172 | 80 | 51% | Eastern Gulf of Mexico | |||||||||||||||||||||||||||||||
| Non-consolidated: (2) | |||||||||||||||||||||||||||||||||||
| Discovery | 75 | 10 | 60% | Western Gulf of Mexico |
(1)Statistics reflect 100 percent of the assets from our 51 percent interest in Gulfstar One.
(2)Includes 100 percent of the statistics associated with operated equity-method investments.
Transmission & Gulf of Mexico Operating Statistics
| 2020 | 2019 | 2018 | |||||||||||||||
| Consolidated: | |||||||||||||||||
| Interstate natural gas pipeline throughput (Tbtu/d) | 15.1 | 15.3 | 14.0 | ||||||||||||||
| Gathering volumes (Bcf/d) | 0.25 | 0.25 | 0.26 | ||||||||||||||
| Plant inlet natural gas volumes (Bcf/d) | 0.48 | 0.54 | 0.50 | ||||||||||||||
| NGL production (Mbbls/d) (2) | 29 | 32 | 32 | ||||||||||||||
| NGL equity sales (Mbbls/d) (2) | 5 | 7 | 6 | ||||||||||||||
| Crude oil transportation (Mbbls/d) (2) | 121 | 136 | 140 | ||||||||||||||
| Non-consolidated: (1) | |||||||||||||||||
| Interstate natural gas pipeline throughput (Tbtu/d) | 1.2 | 1.2 | 1.3 | ||||||||||||||
| Gathering volumes (Bcf/d) | 0.30 | 0.36 | 0.26 | ||||||||||||||
| Plant inlet natural gas volumes (Bcf/d) | 0.30 | 0.36 | 0.27 | ||||||||||||||
| NGL production (Mbbls/d) (2) | 21 | 25 | 20 | ||||||||||||||
| NGL equity sales (Mbbls/d) (2) | 6 | 6 | 4 | ||||||||||||||
(1)Includes 100 percent of the volumes associated with operated equity-method investments.
(2)Annual average Mbbls/d.
Certain Equity-Method Investments
Gulfstream
Gulfstream is a 745-mile interstate natural gas pipeline system extending from the Mobile Bay area in Alabama to markets in Florida, which has a capacity to transport 1.3 Bcf/d. We own, through a subsidiary, a 50 percent equity-method investment in Gulfstream. We share operating responsibilities for Gulfstream with the other 50 percent owner.
Discovery
We own a 60 percent interest in and operate the facilities of Discovery. Discovery’s assets include a 600 MMcf/d cryogenic natural gas processing plant near Larose, Louisiana, a 32 Mbbls/d NGL fractionator plant near Paradis, Louisiana, and a 594-mile offshore natural gas gathering and transportation system in the Gulf of Mexico.
Discovery’s mainline has a gathering inlet capacity of 600 MMcf/d. Discovery’s assets also include a crude oil production handling platform with capacity of 10 Mbbls/d and gas handling and separation capacity of 75 MMcf/d.
Northeast G&P
This segment includes our natural gas gathering, compression, processing, and NGL fractionation businesses in the Marcellus and Utica Shale regions in Pennsylvania, West Virginia, New York, and Ohio.
The following tables summarize the significant operated assets of this segment:
| Natural Gas Gathering Assets | ||||||||||||||||||||||||||||||||
| Inlet | ||||||||||||||||||||||||||||||||
| Pipeline | Capacity | Ownership | ||||||||||||||||||||||||||||||
| Location | Miles | (Bcf/d) | Interest | Supply Basins | ||||||||||||||||||||||||||||
| Consolidated: | ||||||||||||||||||||||||||||||||
| Ohio Valley Midstream (1) | Ohio, West Virginia, & Pennsylvania | 216 | 0.8 | 65% | Appalachian | |||||||||||||||||||||||||||
| Utica East Ohio Midstream (1) (2) | Ohio | 53 | 0.5 | 65% | Appalachian | |||||||||||||||||||||||||||
| Susquehanna Supply Hub | Pennsylvania & New York | 462 | 4.3 | 100% | Appalachian | |||||||||||||||||||||||||||
| Cardinal (1) | Ohio | 378 | 0.8 | 66% | Appalachian | |||||||||||||||||||||||||||
| Flint | Ohio | 95 | 0.5 | 100% | Appalachian | |||||||||||||||||||||||||||
| Non-consolidated: (3) | ||||||||||||||||||||||||||||||||
| Bradford Supply Hub | Pennsylvania | 733 | 4.0 | 66% | Appalachian | |||||||||||||||||||||||||||
| Marcellus South | Pennsylvania & West Virginia | 325 | 1.0 | 68% | Appalachian | |||||||||||||||||||||||||||
| Laurel Mountain | Pennsylvania | 1,145 | 0.9 | 69% | Appalachian | |||||||||||||||||||||||||||
| Blue Racer | West Virginia & Ohio | 723 | 1.5 | 50% | Appalachian |
| Natural Gas Processing Facilities | ||||||||||||||||||||||||||||||||
| NGL | ||||||||||||||||||||||||||||||||
| Inlet | Production | |||||||||||||||||||||||||||||||
| Capacity | Capacity | Ownership | ||||||||||||||||||||||||||||||
| Location | (Bcf/d) | (Mbbls/d) | Interest | Supply Basins | ||||||||||||||||||||||||||||
| Consolidated: (1) | ||||||||||||||||||||||||||||||||
| Fort Beeler | Marshall County, WV | 0.5 | 62 | 65% | Appalachian | |||||||||||||||||||||||||||
| Oak Grove | Marshall County, WV | 0.4 | 50 | 65% | Appalachian | |||||||||||||||||||||||||||
| Kensington | Columbiana Co., OH | 0.6 | 68 | 65% | Appalachian | |||||||||||||||||||||||||||
| Leesville | Carroll Co., OH | 0.2 | 18 | 65% | Appalachian | |||||||||||||||||||||||||||
| Non-Consolidated: (3) | ||||||||||||||||||||||||||||||||
| Berne | Monroe Co., OH | 0.4 | 60 | 50% | Appalachian | |||||||||||||||||||||||||||
| Natrium | Marshall Co., WV | 0.8 | 120 | 50% | Appalachian |
(1)Statistics reflect 100 percent of the assets from our 65 percent ownership in our Northeast JV and 66 percent ownership of Cardinal gathering system.
(2)UEOM inlet capacity consists of 1.3 Bcf/d of a high pressure gathering pipeline that delivers Cardinal gathering volumes to UEOM processing facilities. The listed inlet capacity of 0.5 Bcf/d is incremental capacity to the Cardinal gathering capacity of 0.8 Bcf/d.
(3)Includes 100 percent of the statistics associated with operated equity-method investments.
Other NGL Operations
We own and operate a 43 Mbbls/d NGL fractionation facility at Moundsville, West Virginia, de-ethanization and condensate facilities at our Oak Grove processing plant, a condensate stabilization facility near our Moundsville fractionator, and an ethane transportation pipeline. Our Oak Grove de-ethanizer is capable of handling up to approximately 80 Mbbls/d of mixed NGLs to extract up to approximately 40 Mbbls/d of ethane. Our condensate
stabilizers are capable of handling approximately 17 Mbbls/d of field condensate. We also own and operate 44 Mbbls/d of condensate stabilization capacity, a 135 Mbbls/d NGL fractionation facility, approximately 970,000 barrels of NGL storage capacity, and other ancillary assets, including loading and terminal facilities in Ohio.
NGLs are extracted from the natural gas stream in our Oak Grove and Fort Beeler cryogenic processing plants. Ethane produced at our de-ethanizer is transported to markets via our 50-mile ethane pipeline from Oak Grove to Houston, Pennsylvania. The remaining mixed NGL stream from the de-ethanizer is then transported via pipeline and fractionated at either our Moundsville or Harrison County, Ohio, fractionation facility. The resulting products are then transported on truck or rail. Ohio Valley Midstream provides residue natural gas take away options for our customers with interconnections to three interstate transmission pipelines.
Northeast G&P Operating Statistics
| 2020 | 2019 | 2018 | ||||||||||||||||||
| Consolidated: | ||||||||||||||||||||
| Gathering volumes (Bcf/d) | 4.31 | 4.24 | 3.63 | |||||||||||||||||
| Plant inlet natural gas volumes (Bcf/d) | 1.32 | 1.04 | 0.52 | |||||||||||||||||
| NGL production (Mbbls/d) (1) | 101 | 76 | 46 | |||||||||||||||||
| NGL equity sales (Mbbls/d) (1) | 2 | 3 | 4 | |||||||||||||||||
| Non-consolidated: (2) | ||||||||||||||||||||
| Gathering volumes (Bcf/d) | 4.78 | 4.29 | 3.76 | |||||||||||||||||
(1) Annual average Mbbls/d.
(2) Includes 100 percent of the volumes associated with operated equity-method investments, including the Laurel Mountain Midstream partnership; and the Bradford Supply Hub and a portion of the Marcellus South Supply Hub within Appalachia Midstream Investments. Beginning November 18, 2020, we operate Blue Racer. Blue Racer gathering volumes of 1.38 Bcf/d, plant inlet natural gas volumes of 0.95 Bcf/d, NGL production of 65 Mbbls/d, and NGL equity sales of 6 Mbbls/d have been excluded.
Acquisition of UEOM and formation of Northeast JV
As of December 31, 2018, we owned a 62 percent interest in UEOM which we accounted for as an equity-method investment. On March 18, 2019, we signed and closed the acquisition of the remaining 38 percent interest in UEOM. As a result of acquiring this additional interest, we obtained control of and now consolidate UEOM. (See Note 3 – Acquisitions and Divestitures of Notes to Consolidated Financial Statements).
In June 2019, we contributed our consolidated interests in UEOM and our Ohio Valley midstream business to a newly formed partnership, and we retained 65 percent ownership of, as well as operate and consolidate, the Northeast JV business.
Certain Equity-Method Investments
Appalachia Midstream Investments
Through our Appalachia Midstream Investments, we operate 100 percent of and own an approximate average 66 percent interest in the Bradford Supply Hub gathering system and own an approximate average 68 percent interest in the Marcellus South gathering system, together which consist of approximately 1,058 miles of gathering pipeline in the Marcellus Shale region with the capacity to gather 5,031 MMcf/d of natural gas. The majority of our volumes in the region are gathered from northern Pennsylvania, southwestern Pennsylvania, and the northwestern panhandle of West Virginia in core areas of the Marcellus Shale. We operate the assets under long-term, 100 percent fixed-fee gathering agreements that include significant acreage dedications and, in the Bradford Supply Hub, a cost of service mechanism. Additionally, some Marcellus South agreements have MVCs.
Laurel Mountain
We own a 69 percent interest in a joint venture, Laurel Mountain, that includes a 1,145-mile gathering system that we operate in western Pennsylvania with the capacity to gather 0.9 Bcf/d of natural gas. Laurel Mountain has a long-term, dedicated, volumetric-based fee agreement, with exposure to natural gas prices, to gather the anchor customer’s production in the western Pennsylvania area of the Marcellus Shale.
Blue Racer
As of December 31, 2019, we effectively owned a 29 percent indirect interest in Blue Racer through our 58 percent interest in Caiman II, whose primary asset is a 50 percent interest in Blue Racer. On November 18, 2020, we paid $157 million, net of cash acquired, to acquire an additional 41 percent ownership interest in Caiman II. We now control and consolidate Caiman II, reporting the 50 percent interest in Blue Racer as an equity-method investment.
Blue Racer is a joint venture to own, operate, develop, and acquire midstream assets in the Utica Shale and certain adjacent areas in the Marcellus Shale. Blue Racer’s assets include 723 miles of gathering pipelines, and the Natrium complex in Marshall County, West Virginia, with a cryogenic processing capacity of 800 MMcf/d and fractionation capacity of approximately 134 Mbbls/d. Blue Racer also owns the Berne complex in Monroe County, Ohio, with a cryogenic processing capacity of 400 MMcf/d, and NGL and condensate pipelines connecting Natrium to Berne. Blue Racer provides gathering, processing, and marketing service primarily under percentage of liquids and fixed fee agreements.
West
Gas Gathering, Processing, and Treating Assets
The following tables summarize the significant operated assets of this segment:
| Natural Gas Gathering Assets | |||||||||||||||||||||||||||||||||||
| Location | Pipeline Miles | Inlet Capacity (Bcf/d) | Ownership Interest | Supply Basins/Shale Formations | |||||||||||||||||||||||||||||||
| Consolidated: | |||||||||||||||||||||||||||||||||||
| Wamsutter | Wyoming | 2,265 | 0.7 | 100% | Wamsutter | ||||||||||||||||||||||||||||||
| Southwest Wyoming | Wyoming | 1,614 | 0.5 | 100% | Southwest Wyoming | ||||||||||||||||||||||||||||||
| Piceance | Colorado | 352 | 1.8 | (1) | Piceance | ||||||||||||||||||||||||||||||
| Barnett Shale | Texas | 840 | 0.5 | 100% | Barnett Shale | ||||||||||||||||||||||||||||||
| Eagle Ford Shale | Texas | 1,280 | 0.5 | 100% | Eagle Ford Shale | ||||||||||||||||||||||||||||||
| Haynesville Shale | Louisiana | 629 | 1.8 | 100% | Haynesville Shale | ||||||||||||||||||||||||||||||
| Permian | Texas | 103 | 0.1 | 100% | Permian | ||||||||||||||||||||||||||||||
| Mid-Continent | Oklahoma & Texas | 2,248 | 0.9 | 100% | Miss-Lime, Granite Wash, Colony Wash, Arkoma | ||||||||||||||||||||||||||||||
| Non-consolidated: (2) | |||||||||||||||||||||||||||||||||||
| Rocky Mountain Midstream | Colorado | 200 | 0.6 | 50% | Denver-Julesburg |
| Natural Gas Processing Facilities | |||||||||||||||||||||||||||||||||||
| NGL | |||||||||||||||||||||||||||||||||||
| Inlet | Production | ||||||||||||||||||||||||||||||||||
| Capacity | Capacity | Ownership | |||||||||||||||||||||||||||||||||
| Location | (Bcf/d) | (Mbbls/d) | Interest | Supply Basins | |||||||||||||||||||||||||||||||
| Consolidated: | |||||||||||||||||||||||||||||||||||
| Echo Springs | Echo Springs, WY | 0.7 | 58 | 100% | Wamsutter | ||||||||||||||||||||||||||||||
| Opal | Opal, WY | 1.1 | 47 | 100% | Southwest Wyoming | ||||||||||||||||||||||||||||||
| Willow Creek | Rio Blanco County, CO | 0.5 | 30 | 100% | Piceance | ||||||||||||||||||||||||||||||
| Parachute | Garfield County, CO | 1.1 | 6 | 100% | Piceance | ||||||||||||||||||||||||||||||
| Non-consolidated: (2) | |||||||||||||||||||||||||||||||||||
| Fort Lupton | Colorado | 0.3 | 50 | 50% | Denver-Julesburg | ||||||||||||||||||||||||||||||
| Keenesburg I | Colorado | 0.2 | 40 | 50% | Denver-Julesburg |
(1)Includes our 60 percent ownership of a gathering system in the Ryan Gulch area with 140 miles of pipeline and 0.2 Bcf/d of inlet capacity, and our 67 percent ownership of a gathering system at Allen Point with 8 miles of pipeline and 0.1 Bcf/d of inlet capacity. We operate both systems. We own and operate 100 percent of the balance of the Piceance gathering assets.
(2)Includes 100 percent of the statistics associated with operated equity-method investments.
Marketing Services
We market gas and NGL products to a wide range of users in the energy and petrochemical industries. The NGL marketing business transports and markets our equity NGLs from the production at our processing plants, and also markets NGLs on behalf of third-party NGL producers, including some of our fee-based processing customers, and the NGL volumes owned by Discovery and RMM. The NGL marketing business bears the risk of price changes in these NGL volumes while they are being transported to final sales delivery points. In order to meet sales contract obligations, we may purchase products in the spot market for resale.
Other NGL Operations
We own interests in and/or operate NGL fractionation and storage assets in central Kansas near Conway. These assets include a 50 percent interest in an NGL fractionation facility with capacity of slightly more than 100 Mbbls/d and we own approximately 20 million barrels of NGL storage capacity. We also own a 189-mile NGL pipeline from our fractionator near Conway, Kansas, to an interconnection with a third-party NGL pipeline system in Oklahoma.
West Operating Statistics
| 2020 | 2019 | 2018 | ||||||||||||||||||
| Consolidated: (1) | ||||||||||||||||||||
| Gathering volumes (Bcf/d) | 3.33 | 3.52 | 4.27 | |||||||||||||||||
| Plant inlet natural gas volumes (Bcf/d) | 1.25 | 1.48 | 2.01 | |||||||||||||||||
| NGL production (Mbbls/d) (2) | 49 | 54 | 84 | |||||||||||||||||
| NGL equity sales (Mbbls/d) (2) | 22 | 22 | 33 | |||||||||||||||||
| Non-Consolidated: (3) | ||||||||||||||||||||
| Gathering volumes (Bcf/d) | 0.25 | 0.20 | 0.08 | |||||||||||||||||
| Plant inlet natural gas volumes (Bcf/d) | 0.25 | 0.20 | 0.08 | |||||||||||||||||
| NGL production (Mbbls/d) (2) | 23 | 12 | 3 |
(1) 2020 and 2019 volumes reflect the absence of Four Corners assets due to the sale in October 2018.
(2) Annual average Mbbls/d.
(3) Includes 100 percent of the volumes associated with operated equity-method investments, including RMM and Jackalope. Jackalope was a consolidated entity in first- and second-quarter 2018, an equity-method investment during third- and fourth-quarter 2018 as well as first-quarter 2019, and sold effective with second-quarter 2019.
Sale of Four Corners Assets
In October 2018, we completed the sale of our natural gas gathering and processing assets in the Four Corners area of New Mexico and Colorado. The system was comprised of 3,742 miles of gathering pipeline with 1.8 Bcf/d of gas gathering inlet capacity and two processing facilities with a combined 0.7 Bcf/d of natural gas processing inlet capacity and 41 Mbbls/d of NGL production capacity.
Certain Equity-Method Investments
Overland Pass Pipeline
We also operate and own a 50 percent interest in OPPL. OPPL is capable of transporting 255 Mbbls/d of NGLs and includes approximately 1,035 miles of NGL pipeline extending from Opal, Wyoming, to the Mid-Continent NGL market center near Conway, Kansas, along with extensions into the Piceance and Denver-Julesberg basins in Colorado and the Bakken Shale in the Williston basin in North Dakota. Our equity NGL volumes from our Wyoming plants and our Willow Creek facility in Colorado are dedicated for transport on OPPL under a long-term transportation agreement. NGL volumes from our RMM equity-method investment are also transported on OPPL.
Rocky Mountain Midstream
During the third quarter of 2018, our joint venture, RMM, purchased a natural gas and crude oil gathering and natural gas processing business in Colorado’s Denver-Julesburg basin. As of December 31, 2020, we operate and own 50 percent of RMM. RMM includes a natural gas gathering pipeline and an approximate 80-mile crude oil transportation pipeline. It also includes crude oil storage assets.
Targa Train 7
We own a 20 percent interest in Targa Train 7, a Mt. Belvieu fractionation train, which was placed into service in the first quarter of 2020.
Other
Other includes certain previously owned operations, minor business activities that are not reportable segments, as well as corporate operations.
REGULATORY MATTERS
FERC
Our gas pipeline interstate transmission and storage activities are subject to FERC regulation under the Natural Gas Act of 1938 (NGA) and under the Natural Gas Policy Act of 1978, and, as such, our rates and charges for the transportation of natural gas in interstate commerce, accounting, and the extension, enlargement, or abandonment of our jurisdictional facilities, among other things, are subject to regulation. Each of our gas pipeline companies holds certificates of public convenience and necessity issued by the FERC authorizing ownership and operation of all pipelines, facilities, and properties for which certificates are required under the NGA. FERC Standards of Conduct govern how our interstate pipelines communicate and do business with gas marketing employees. Among other things, the Standards of Conduct require that interstate gas pipelines not operate their systems to preferentially benefit gas marketing functions.
FERC regulation requires all terms and conditions of service, including the rates charged, to be filed with and approved by the FERC before any changes can go into effect. Our interstate gas pipeline companies establish rates through the FERC’s ratemaking process. In addition, our interstate gas pipelines may enter into negotiated rate agreements where cost-based recourse rates are made available. Key determinants in the FERC ratemaking process include:
-
Costs of providing service, including depreciation expense;
-
Allowed rate of return, including the equity component of the capital structure and related income taxes;
-
Contract and volume throughput assumptions.
The allowed rate of return is determined in each rate case. Rate design and the allocation of costs between the reservation and commodity rates also impact profitability. As a result of these proceedings, certain revenues previously collected may be subject to refund.
We also own interests in and operate natural gas liquids pipelines that are regulated by various federal and state governmental agencies. Services provided on our interstate natural gas liquids pipelines are subject to regulation under the Interstate Commerce Act by the FERC, which has authority over the terms and conditions of service; rates, including depreciation and amortization policies; and initiation of service. Our intrastate natural gas liquids pipelines providing common carrier service are subject to regulation by various state regulatory agencies.
Pipeline Safety
Our gas pipelines are subject to the Natural Gas Pipeline Safety Act of 1968, as amended, the Pipeline Safety Improvement Act of 2002, the Pipeline Safety, Regulatory Certainty, and Jobs Creation Act of 2011 (Pipeline Safety Act), and the Protecting Our Infrastructure of Pipelines and Enhancing Safety Act of 2016, which regulate safety requirements in the design, construction, operation, and maintenance of interstate natural gas transmission facilities. The United States Department of Transportation Pipeline and Hazardous Materials Safety Administration (PHMSA) administers federal pipeline safety laws.
Federal pipeline safety laws authorize PHMSA to establish minimum safety standards for pipeline facilities and persons engaged in the transportation of gas or hazardous liquids by pipeline. These safety standards apply to the design, construction, testing, operation, and maintenance of gas and hazardous liquids pipeline facilities affecting interstate or foreign commerce. PHMSA has also established reporting requirements for operators of gas and hazardous liquid pipeline facilities, as well as provisions for establishing the qualification of pipeline personnel and requirements for managing the integrity of gas transmission and distribution lines and certain hazardous liquid pipelines. To ensure compliance with these provisions, PHMSA performs pipeline safety inspections and has the authority to initiate enforcement actions.
In 2016, PHMSA published a proposed rulemaking that would impose new or more stringent requirements for certain natural gas pipelines including, expanding certain of PHMSA’s current regulatory safety programs for natural gas lines in high-population areas (also known as moderate consequence areas (MCAs)) that do not qualify as high-consequence areas (HCAs) and requiring maximum allowable operating pressure (MAOP) validation through re-verification of all historical records for pipelines in service, which may require natural gas pipelines installed before 1970 (previously excluded from certain pressure testing obligations) to be pressure tested. However, PHMSA has since decided to split this proposed rule (Mega Rule), into three separate rulemaking proceedings. The first of these three rulemakings, relating to onshore gas transmission pipelines, was published as a final rule on October 1, 2019, and imposes numerous requirements, including MAOP reconfirmation, the periodic assessment of additional pipeline mileage outside of HCAs, the reporting of exceedances of MAOP, and the consideration of seismicity as a risk factor in integrity management. In accordance with the final rule, we have developed new procedures and updated our existing pipeline safety program to facilitate meeting all requirements within the time frames stated. The remaining rulemakings comprising the Mega Rule are expected to be issued in 2021 and will include revised pipeline repair criteria as well as more stringent corrosion control requirements.
PHMSA also published new or more stringent rules for onshore hazardous liquids transportation lines in October 2019 requiring integrity assessments on all onshore pipe that accommodate inline inspection tools.
We are also expecting additional regulations due to new pipeline safety legislation finalized in December 2020 that reauthorized PHMSA pipeline safety programs. The new legislation includes mandates for PHMSA to publish final rules for advanced leak detection for gas pipelines, additional repair criteria for gas and hazardous liquids pipelines, updated operating and maintenance standards requirements applicable to large-scale liquefied natural gas facilities, certain Coastal Waters and Coastal Beaches to be designated as USA ecological resources for purposes of
determining whether a hazardous liquid pipeline is in a high consequence area, and the gas gathering portion of the proposed Mega Rule.
New regulations adopted by PHMSA may impose more stringent requirements applicable to integrity management programs and other pipeline safety aspects of our operations, which could cause us to incur increased capital and operating costs and operational delays.
Pipeline Integrity Regulations
We have an enterprise-wide Gas Integrity Management Plan that we believe meets the PHMSA final rule that was issued pursuant to the requirements of the Pipeline Safety Improvement Act of 2002. The rule requires gas pipeline operators to develop an integrity management program for gas transmission pipelines that could affect HCAs in the event of pipeline failure. The integrity management program includes a baseline assessment plan along with periodic reassessments to be completed within required time frames. In meeting the integrity regulations, we have identified HCAs and developed baseline assessment plans. Ongoing periodic reassessments and initial assessments of any new HCAs have been completed. We estimate that the cost to be incurred in 2021 associated with this program to be approximately $105 million. Management considers costs associated with compliance with the rule to be prudent costs incurred in the ordinary course of business and, therefore, recoverable through Northwest Pipeline’s and Transco’s rates.
We have an enterprise-wide Liquid Integrity Management Plan that we believe meets the PHMSA final rule that was issued pursuant to the requirements of the Pipeline Safety Improvement Act of 2002. The rule requires liquid pipeline operators to develop an integrity management program for liquid transmission pipelines that could affect HCAs in the event of pipeline failure. The integrity management program includes a baseline assessment plan along with periodic reassessments expected to be completed within required time frames. In meeting the integrity regulations, we utilized government defined HCAs and developed baseline assessment plans. We completed assessments within the required time frames. We estimate that the cost to be incurred in 2021 associated with this program will be approximately $3 million. Ongoing periodic reassessments and initial assessments of any new HCAs are expected to be completed within the time frames required by the rule. Management considers the costs associated with compliance with the rule to be prudent costs incurred in the ordinary course of business.
State Gathering Regulations
Our onshore midstream gathering operations are subject to laws and regulations in the various states in which we operate. For example, the Texas Railroad Commission has the authority to regulate the terms of service for our intrastate natural gas gathering business in Texas. Although the applicable state regulations vary widely, they generally require that pipeline rates and practices be reasonable and nondiscriminatory, and may include provisions covering marketing, pricing, pollution, environment, and human health and safety. Some states, such as New York, have specific regulations pertaining to the design, construction, and operations of gathering lines within such state.
Intrastate Liquids Pipelines in the Gulf Coast
Our intrastate liquids pipelines in the Gulf Coast are regulated by the Louisiana Public Service Commission, the Texas Railroad Commission, and various other state and federal agencies. These pipelines are also subject to the liquid pipeline safety and integrity regulations discussed above since both Louisiana and Texas have adopted the integrity management regulations defined in PHMSA.
OCSLA
Our offshore gas and liquids pipelines located on the outer continental shelf are subject to the Outer Continental Shelf Lands Act, which provides in part that outer continental shelf pipelines “must provide open and nondiscriminatory access to both owner and non-owner shippers.”
See Part II, Item 8. Financial Statements and Supplementary Data — Note 19 – Contingent Liabilities and Commitments of Notes to Consolidated Financial Statements for further details on our regulatory matters. For additional information regarding regulatory matters, please also refer to Part 1, Item 1A. “Risk Factors” — “The
operation of our businesses might be adversely affected by regulatory proceedings, changes in government regulations or in their interpretation or implementation, or the introduction of new laws or regulations applicable to our businesses or our customers,” and “The natural gas sales, transportation, and storage operations of our gas pipelines are subject to regulation by the FERC, which could have an adverse impact on their ability to establish transportation and storage rates that would allow them to recover the full cost of operating their respective pipelines and storage assets, including a reasonable rate of return.”
ENVIRONMENTAL MATTERS
Our operations are subject to federal environmental laws and regulations as well as the state, local, and tribal laws and regulations adopted by the jurisdictions in which we operate. We could incur liability to governments or third parties for any unlawful discharge of pollutants into the air, soil, or water, as well as liability for cleanup costs. Materials could be released into the environment in several ways including, but not limited to:
-
Leakage from gathering systems, underground gas storage caverns, pipelines, processing or treating facilities, transportation facilities, and storage tanks;
-
Damage to facilities resulting from accidents during normal operations;
-
Damages to onshore and offshore equipment and facilities resulting from storm events or natural disasters;
-
Blowouts, cratering, and explosions.
In addition, we may be liable for environmental damage caused by former owners or operators of our properties.
We believe compliance with current environmental laws and regulations will not have a material adverse effect on our capital expenditures, earnings, or current competitive position. However, environmental laws and regulations could affect our business in various ways from time to time, including incurring capital and maintenance expenditures, fines and penalties, and creating the need to seek relief from the FERC for rate increases to recover the costs of certain capital expenditures and operation and maintenance expenses.
For additional information regarding the potential impact of federal, state, tribal, or local regulatory measures on our business and specific environmental issues, please refer to Part 1, Item 1A. “Risk Factors” — “Our operations are subject to environmental laws and regulations, including laws and regulations relating to climate change and greenhouse gas emissions, which may expose us to significant costs, liabilities, and expenditures that could exceed our expectations,” and Part II, Item 7 “Management’s Discussion and Analysis of Financial Condition and Results of Operations — Environmental” and “Environmental Matters” in Part II, Item 8. Financial Statements and Supplementary Data — Note 19 – Contingent Liabilities and Commitments of Notes to Consolidated Financial Statements.
COMPETITION
Gas Pipeline Business
The market for supplying natural gas is highly competitive and new pipelines, storage facilities, and other related services are expanding to service the growing demand for natural gas. Additionally, pipeline capacity in many growing natural gas supply basins is constrained causing competition to increase among pipeline companies as they strive to connect those basins to major natural gas demand centers.
In our business, we predominately compete with major intrastate and interstate natural gas pipelines. In the last few years, local distribution companies have also started entering into the long-haul transportation business through joint venture pipelines. The principle elements of competition in the interstate natural gas pipeline business are based on rates, reliability, quality of customer service, diversity of supply, and proximity to customers and market hubs.
Significant entrance barriers to build new pipelines exist, including federal and growing state regulations and public opposition against new pipeline builds, and these factors will continue to impact potential competition for the
foreseeable future. However, we believe our past success in working with regulators and the public, the position of our existing infrastructure, established strategic long-term contracts, and the fact that our pipelines have numerous receipt and delivery points along our systems provide us a competitive advantage, especially along the eastern seaboard and northwestern United States.
Midstream Business
Competition for natural gas gathering, processing, treating, transporting, and storing natural gas continues to increase as production from shales and other resource areas continues to grow. Our midstream services compete with similar facilities that are in the same proximity as our assets.
We face competition from companies of varying size and financial capabilities, including major and independent natural gas midstream providers, private equity firms, and major integrated oil and natural gas companies that gather, transport, process, fractionate, store, and market natural gas and NGLs, as well as some larger exploration and production companies that are choosing to develop midstream services to handle their own natural gas.
Our gathering and processing agreements are generally long-term agreements that may include acreage dedication. Competition for natural gas volumes is primarily based on reputation, commercial terms (products retained or fees charged), array of services provided, efficiency and reliability of services, location of gathering facilities, available capacity, downstream interconnects, and latent capacity. We believe our significant presence in traditional prolific supply basins, our solid positions in growing shale plays, our expertise and reputation as a reliable operator, and our ability to offer integrated packages of services position us well against our competition.
For additional information regarding competition for our services or otherwise affecting our business, please refer to Part 1, Item 1A. “Risk Factors” - “The financial condition of our natural gas transportation and midstream businesses is dependent on the continued availability of natural gas supplies in the supply basins that we access and demand for those supplies in the markets we serve,” “Our industry is highly competitive and increased competitive pressure could adversely affect our business and operating results,” and “We may not be able to replace, extend, or add additional customer contracts or contracted volumes on favorable terms, or at all, which could affect our financial condition, the amount of cash available to pay dividends, and our ability to grow.”
HUMAN CAPITAL RESOURCES
We are committed to maintaining an environment that enables us to attract, develop, and retain a highly skilled and diverse group of talented employees who help promote long-term value creation.
Employees
As of February 1, 2021, we had 4,739 full-time employees located throughout the United States. Of this total, approximately 21 percent are women and more than 14 percent are ethnically diverse. During 2020, our voluntary turnover rate was 4.6 percent.
We encourage you to review our 2019 Sustainability Report available on our website for more information about our human capital programs and initiatives. Nothing on our website shall be deemed incorporated by references into this Annual Report on Form 10-K.
Workforce Safety
We continue to advance our safety-first culture by developing and empowering our employees to operate our assets in a safe, reliable, and customer-focused way. We strive to continuously improve safety and achieve better performance than the industry benchmark. When a safety hazard is recognized, every employee is empowered to stop work activities and make it right. Safety and environmental-focused goals and related metrics comprise 10 percent of our annual incentive program for employees, providing an increased focus on activities that help us meet enterprise safety commitments.
For 2019, these metrics included our Near Miss to Incident Ratio, emphasizing our safety focus on hazard recognition and reinforcing the importance of incident prevention, and our Late Post Startup Deliverables metric, emphasizing the importance of completing all post startup deliverables associated with newly completed projects. As disclosed in our 2020 Proxy Statement, we exceeded our targets for these safety metrics in 2019, achieving a Near Miss to Incident ratio of 13.98:1, versus a target between 9:1 and 10:1, and less than 1 percent of Late Post Startup Deliverables, versus a target between 3 percent and 4 percent. For 2020, these metrics include our High Potential Near Miss to Incident Ratio, again emphasizing our safety focus on high potential hazard recognition and reinforcing the importance of incident prevention, and our environmental metric Loss of Primary Containment, focused on reducing greenhouse gases and considered a leading indicator to more significant process safety incidents.
Workforce Health & Development
Our employees are our most valued resource and the driving force behind our reputation as a safe, reliable company that does the right thing, every time. Cultivating a healthy work environment increases productivity and promotes long-term value creation.
We provide a comprehensive total rewards program that includes base salary, an all-employee annual incentive program, retirement benefits, and health benefits, including a wellness program. We provide employees with company-paid life insurance, disability coverage, and paid parental leave for both birth and non-birth parents. Our annual incentive program is a key component of our commitment to a performance culture focused on recognizing and rewarding high performance.
In order to attract and retain top talent, we create an environment where employees feel fulfilled and supported in their personal and professional development. We offer robust corporate and technical training programs to support the professional development of our employees and add long-term value to our business. Additionally, we support strong employee engagement by encouraging open dialogue regarding professional development. Performance is measured considering both the achieved results associated with attaining annual goals and observable skills and behaviors based on our defined competencies that contribute to workplace effectiveness and career success.
The Compensation and Management Development Committee of our Board of Directors oversees the establishment and administration of our compensation programs, including incentive compensation and equity-based plans.
In response to the ongoing impact of COVID-19, we took action to safeguard the health and safety of our employees, including allowing our employees to work remotely where possible, while implementing safety guidance and best practices designed to protect the health of those entering our facilities.
Diversity & Inclusion
We encourage a diverse and inclusive workforce, helping our employees reach their full potential and promoting innovation. By embracing differences—whether race, gender, nationality, ability, orientation, or generation—we bring the best out of our people to drive business growth and long-term success.
To support networking and professional development opportunities, we endorse employee resource groups, which allow more inclusivity by offering an opportunity for employees to network, gain development, and provide input to leaders on specific needs. We strive for diverse representation at all levels through our talent management practices and employee development programs as we are committed to helping all employees develop. Diversity metrics are reported monthly to our management team.
We also have a Diversity and Inclusion Council, chaired by our chief executive officer and including members of the executive officer team, organizational and operational leaders, and individual employees, to promote policies, practices, and procedures that support the growth of a high-performing workforce where all individuals can achieve their full potential. The council serves as the governing body over enterprise diversity and inclusion initiatives.
Our Board of Directors includes 12 independent members, one-third of which are women. As part of the director selection and nominating process, the Governance and Sustainability Committee annually assesses the
Board’s diversity in such areas as geography, race, gender, ethnicity, and age. We strive to maintain a board of directors with diverse occupational and personal backgrounds.
WEBSITE ACCESS TO REPORTS AND OTHER INFORMATION
We file our annual report on Form 10-K, quarterly reports on Form 10-Q, current reports on Form 8-K, proxy statements, and other documents electronically with the SEC under the Exchange Act.
Our Internet website is www.williams.com*.* We make available, free of charge, through the Investors tab of our Internet website our annual report on Form 10-K, quarterly reports on Form 10-Q, current reports on Form 8‑K, and amendments to those reports filed or furnished pursuant to Section 13(a) or 15(d) of the Exchange Act as soon as reasonably practicable after we electronically file such material with, or furnish it to, the SEC. Our Corporate Governance Guidelines, Sustainability Report, Code of Ethics for Senior Officers, Board committee charters, and the Williams Code of Business Conduct are also available on our Internet website. We will also provide, free of charge, a copy of any of our corporate documents listed above upon written request to our Corporate Secretary, One Williams Center, Suite 4700, Tulsa, Oklahoma 74172.
Previous: Cover and table of contents · Next: Item 1A. Risk Factors