 filings.tools
Williams-Sonoma (WSM) 10-K risk factor changes: FY2017 vs FY2016
The 2017-01-29 10-K against the 2016-01-31 one, compared heading by heading and sentence by sentence. One of these filings carries no fiscal year tag, so its year is the calendar year of the period end.
Item 1A73 rewritten23 added11 removed349 unchanged
All filing items675 rewritten200 added193 removed1,359 unchanged
Summary
counted, not written
- Item 1A headings could not be compared: only 0 carried over between the two years, which usually means one filing was read wrongly, so none is reported as new or removed.
- Sentence by sentence, 200 added, 193 removed, 675 rewritten and 1,359 unchanged across 12 items that differ.
Sentences by item
20 items, with every count and a link to each item that changed
| Item | Added | Removed | Rewritten | Unchanged |
|---|---|---|---|---|
| Item 1A. RISK FACTORS | 23 | 11 | 73 | 349 |
| Item 7. MANAGEMENT’S DISCUSSION AND ANALYSIS OF FINANCIAL CONDITION AND RESULTS OF OPERATIONS | 44 | 46 | 108 | 157 |
| Item 7A. QUANTITATIVE AND QUALITATIVE DISCLOSURES ABOUT MARKET RISK | 96 | 95 | 330 | 447 |
| Item 1. BUSINESS | 6 | 1 | 29 | 66 |
| Item 3. LEGAL PROCEEDINGS | 0 | 0 | 2 | 5 |
| Cover and table of contents | 4 | 1 | 34 | 60 |
| Item 1B. UNRESOLVED STAFF COMMENTS | 0 | 0 | 0 | 1 |
| Item 2. PROPERTIES | 1 | 2 | 11 | 22 |
| Item 4. MINE SAFETY DISCLOSURES | 0 | 0 | 0 | 3 |
| Item 5. MARKET FOR REGISTRANT’S COMMON EQUITY, RELATED STOCKHOLDER MATTERS AND ISSUER PURCHASES OF EQUITY SECURITIES | 16 | 17 | 10 | 37 |
| Item 6. SELECTED FINANCIAL DATA | 1 | 0 | 31 | 14 |
| Item 9. CHANGES IN AND DISAGREEMENTS WITH ACCOUNTANTS ON ACCOUNTING AND FINANCIAL DISCLOSURE | 0 | 0 | 0 | 2 |
| Item 9A. CONTROLS AND PROCEDURES | 0 | 1 | 4 | 12 |
| Item 9B. OTHER INFORMATION | 1 | 13 | 0 | 3 |
| Item 10. DIRECTORS, EXECUTIVE OFFICERS AND CORPORATE GOVERNANCE | 0 | 0 | 0 | 2 |
| Item 11. EXECUTIVE COMPENSATION | 0 | 0 | 0 | 2 |
| Item 12. SECURITY OWNERSHIP OF CERTAIN BENEFICIAL OWNERS AND MANAGEMENT AND RELATED STOCKHOLDER MATTERS | 0 | 0 | 0 | 2 |
| Item 13. CERTAIN RELATIONSHIPS AND RELATED TRANSACTIONS, AND DIRECTOR INDEPENDENCE | 0 | 0 | 0 | 2 |
| Item 14. PRINCIPAL ACCOUNTANT FEES AND SERVICES | 0 | 0 | 0 | 4 |
| Item 15. EXHIBITS AND FINANCIAL STATEMENT SCHEDULES | 8 | 6 | 43 | 169 |
Underlined words on a shaded ground are new in FY2017; struck-through words were in FY2016. Sentences that are wholly new or wholly gone are labelled rather than marked.
Item 1A. RISK FACTORS
73 rewritten, 23 added, 11 removed, 349 unchanged
Our success depends, in large part, upon our ability to identify and analyze factors affecting our business and to anticipate and respond in a timely manner to changing merchandise trends and customer demands in order to [added: maintain and attract customers.]
[added: Much of our inventory is sourced from vendors located outside of the U.S.] Thus, we usually must order merchandise, and enter into contracts for the purchase and manufacture of such merchandise, up to twelve months and generally multiple seasons in advance of the applicable selling season and frequently before trends are known.
In order for our sales channels to function successfully, [removed: we] [added: we, our banking] and [added: authorizations partners, and] other parties involved in processing customer transactions must be able to transmit confidential information, including credit card information and other personal information [removed: on] [added: of] our customers, securely over public and private networks.
As our business expands globally, we are subject to data privacy and other [removed: similar laws in various foreign jurisdictions, such as the European Union.]
If we fail to implement appropriate safeguards, [removed: to] detect and provide prompt notice of unauthorized access as required by some of these laws, or otherwise comply with these laws, we could be subject to potential fines, [added: claims for damages and other remedies, which could be significantly in excess of our insurance coverage and could harm our business.]
We must continually respond to changing consumer preferences and buying trends relating to e-commerce [removed: usage.][added: usage, including an emphasis on mobile e-commerce.]
We also utilize interest-based advertising to target internet [added: and mobile] users whose behavior indicates they might be interested in our products.
Current or future legislation may reduce or restrict our ability to use these [removed: certain] techniques, which could reduce the effectiveness of our marketing efforts.
We are also vulnerable to certain additional risks and uncertainties associated with our e-commerce [added: and mobile] websites and digital marketing efforts, including: changes in required technology interfaces; website downtime and other technical failures; internet connectivity issues; costs and technical issues as we upgrade our website software; computer viruses; vendor reliability; changes in applicable federal and state regulations; security breaches; and consumer privacy concerns.
[removed: In addition, we] [added: We] must keep up to date with competitive technology [removed: trends,] [added: trends and opportunities that are emerging throughout the retail environment,] including the use of new or improved technology, evolving creative user [removed: interfaces] [added: interfaces,] and other e-commerce marketing trends such as paid search, re-targeting, and the proliferation of mobile usage, among [removed: others, which may increase our costs and which may not succeed in increasing sales or attracting customers.][added: others.]
Approximately [removed: 67%] [added: 64%] of our merchandise purchases in fiscal [removed: 2015] [added: 2016] were sourced from foreign [removed: venders] [added: vendors] in [removed: 48] [added: 43] countries, predominantly in Asia and Europe.
We, and our foreign vendors, are also subject to other risks and uncertainties associated with changing economic and political conditions [added: within and] outside of the [removed: United States.][added: U.S. These risks and uncertainties include import duties and quotas, compliance with anti-dumping regulations, work stoppages, economic uncertainties and adverse economic conditions (including inflation and recession), government regulations, employment and labor matters,]
[removed: These risks and uncertainties include import duties and quotas, compliance with anti-dumping regulations, work stoppages, economic uncertainties and adverse economic conditions (including inflation and recession), foreign government regulations, employment and labor matters,] wars and fears of war, political unrest, natural disasters, public health issues, regulations to address climate change and other trade restrictions.
Any event causing a disruption or delay of imports from foreign vendors, including labor disputes resulting in work disruption (such as the disruptions at the west coast ports in early 2015), the imposition of additional import restrictions, restrictions on the transfer of funds and/or increased [added: tariffs or quotas, or both, could increase the cost, reduce the supply of merchandise available to us, or result in excess inventory if merchandise is received after the planned or appropriate selling season, all of which could adversely affect our business, financial condition and operating results.]
Although we continue to be focused on improving our global compliance program, there remains a risk that one or more of our foreign vendors will not adhere to our global compliance standards, such as fair labor standards and the prohibition [removed: on] [added: of] child labor.
_We depend on foreign vendors and [removed: third party] [added: third-party] agents for timely and effective sourcing of our merchandise, and we may not be able to acquire products in sufficient quantities and at acceptable prices to meet our needs, which would impact our operations and financial results._
Any inability to acquire suitable merchandise on acceptable terms or the loss of one or more of our foreign vendors or [removed: third party] [added: third-party] agents could have a negative effect on our business and operating results because we would be missing products that we felt were important to our assortment, unless and until alternative supply arrangements are secured.
We may not be able to develop relationships with new [removed: third party] [added: third-party] agents or vendors, and products from alternative sources, if any, may be of a lesser quality and/or more expensive than those we currently purchase.
[removed: Our vendors’ failure to manufacture or import quality merchandise] in a timely and effective manner could damage our reputation and brands, and could lead to an increase in customer complaints and litigation against us and an increase in our routine insurance and litigation costs.
We are currently growing our business and increasing our global presence by opening new stores outside of the [removed: United States,] [added: U.S.,] expanding our franchise operations, and offering shipping globally through [removed: third party] [added: third-party] vendors.
In fiscal 2013 we opened our first company-owned retail stores and launched e-commerce [removed: sites] [added: websites] outside of North America as part of our overall global expansion strategy.
If our global growth initiatives are not successful, or if we or any of our [removed: third party] [added: third-party] vendors fail to comply with any applicable regulations or laws, the value of our brands may be harmed and our future opportunities for global growth may be negatively affected.
Our ultimate realized [removed: loss or] gain [added: or loss] with respect to currency fluctuations will generally depend on the size and type of the transactions that we enter into, the currency exchange rates associated with these exposures, changes in those rates and whether we have entered into foreign currency hedge contracts to offset these exposures.
We have franchise agreements with unaffiliated franchisees to operate stores and/or e-commerce websites in the Middle East, the [removed: Philippines,] [added: Philippines] and Mexico.
In addition, certain aspects of our franchise arrangements are not directly within our control, such as the ability of each franchisee to meet its projections regarding store openings and [removed: sales.][added: sales, and the impact of exchange rate fluctuations on their business.]
[added: Our failure to comply] with such laws and regulations may harm our reputation, adversely affect our future opportunities for growth and expansion in these countries, and harm our business and operating results.
| | • | | increased operational [added: and tax] complexities, including managing our inventory globally; |
We must ensure that our employees and [removed: third party] [added: third-party] agents comply with these laws.
If any of our overseas operations, or our employees or [removed: third party] [added: third-party] agents, violates such laws, we could become subject to sanctions or other penalties that could negatively affect our reputation, business and operating results.
Approximately [removed: 50%] [added: 48%] of our net revenues are generated by our retail stores.
While we believe that the surveys and other relevant information are helpful indicators of suitable store locations, we recognize that these information sources cannot predict future consumer preferences and buying trends with [added: complete accuracy.]
If we are unable to effectively manage our inventory levels and responsiveness of our supply chain, including predicting the appropriate levels and type of inventory to stock within each of our distribution [removed: centers,] [added: facilities,] our [removed: business and operating results may be harmed.]
We are subject to risks that may disrupt our supply chain operations or regionalization efforts, such as increasing labor costs, union organizing activity, and our ability to effectively locate real estate for our distribution [removed: centers] [added: facilities] or other supply chain operations.
We rely upon [removed: third party] [added: third-party] carriers for our merchandise shipments and reliable data regarding the timing of those shipments, including shipments to our customers and to and from our stores.
[added: As a result of our dependence on all of these third-party providers, we are subject to risks, including] labor disputes (such as the disruptions at the west coast ports in early 2015), union organizing activity, inclement weather, natural disasters, the closure of such carriers’ offices or a reduction in operational hours due to an economic slowdown, possible acts of terrorism affecting such carriers’ ability to provide delivery services to meet our shipping needs, disruptions or increased fuel costs, and costs associated with any regulations to address climate change.
Our e-commerce business depends, in part, on our ability to maintain efficient and uninterrupted order-taking and fulfillment operations in our distribution [removed: centers,] [added: facilities,] our customer care centers and on our e-commerce websites.
Disruptions or slowdowns in these areas could result from disruptions in telephone or network services, power outages, inadequate system capacity, system hardware or software issues, computer viruses, security breaches, human error, changes in programming, union organizing activity, insufficient or inadequate labor to fulfill the orders, disruptions in our [removed: third party] [added: third-party] labor contracts, inefficiencies due to inventory levels and limited distribution [removed: center] [added: facility] space, natural disasters or adverse weather conditions.
In addition, we face the risk that we cannot hire enough qualified employees to support our e-commerce operations, or that there will be a disruption in the workforce we hire from our [removed: third party] [added: third-party] providers, especially during our peak season.
Our retail stores, corporate offices, distribution [removed: centers,] [added: and manufacturing facilities,] infrastructure and e-commerce operations, as well as the operations of our vendors from which we receive goods and services, are vulnerable to damage from earthquakes, tornadoes, hurricanes, fires, floods or other volatile weather, power losses, telecommunications failures, hardware and software failures, computer viruses and similar events.
Postal rate [removed: increases, such as the] increases [removed: that went into effect in the U.S. in 2013 and 2014,] affect the cost of our catalog mailings.
similar laws in various foreign jurisdictions, such as the European Union.
While we make our best efforts to predict and invest in technology that is most relevant and beneficial to our company, our initiatives may not prove to be successful, may increase our costs, or may not succeed in driving sales or attracting customers.
Our vendors’ failure to manufacture or import quality merchandise
In addition, during fiscal 2016, we entered into a franchise agreement with an unaffiliated franchisee to operate stores and e-commerce websites in South Korea, beginning in 2017.
business and operating results may be harmed.
any time.
We have also recently consolidated all of our paper purchasing through a single broker.
Consolidation within the paper industry has reduced the number of potential suppliers capable of meeting our paper requirements, leading to increased costs.
and diverse customer base and using effective pricing strategies.
Further, in an effort to acquire or build new brands at an early enough stage to leverage the full scale of our capabilities and assets, we may forego the long-term evidence to guarantee success in new or emerging businesses.
_Any significant changes in U.S. trade, tax or other policies that restrict imports or increase import tariffs could have a material adverse effect on our results of operations._
A significant portion of our products are manufactured outside of the U.S. Lawmakers are evaluating proposals for substantial changes to U.S. trade and tax policies, which could include import restrictions, increased import tariffs
or border-adjustment taxes.
These policies — particularly a border-adjustment tax — could significantly increase our tax burden.
These policies may also require us to increase our prices, which would likely adversely affect our sales and revenue.
In addition, other countries might retaliate through the imposition of their own restrictions or increased tariffs, which could adversely affect our global sales and revenue.
Any significant changes in current U.S. trade, tax or other policies could have a material adverse effect on our results of operations.
For example, U.S. lawmakers are evaluating proposals for substantial changes to U.S. fiscal and tax policies, which could include comprehensive tax reform.
We cannot predict the impact, if any, these changes may have on our business; however, such changes could have a material adverse effect on our business and results of operations.
In addition, the market for prime real estate is competitive, especially in San Francisco where our corporate offices are headquartered.
years, which occur approximately every five years.
We have a $500,000,000 stock repurchase program that we intend to execute over three years, of which we have $410,578,000 remaining for future repurchases as of January 29, 2017.
In addition, several of our strategic initiatives, including our technology and supply chain initiatives, require that we hire and/or develop employees with appropriate experience.
maintain and attract customers.
Much of our inventory is sourced from vendors located outside of the United States.
claims for damages and other remedies, which could be significantly in excess of our insurance coverage and could harm our business.
tariffs or quotas, or both, could increase the cost, reduce the supply of merchandise available to us, or result in excess inventory if merchandise is received after the planned or appropriate selling season, all of which could adversely affect our business, financial condition and operating results.
Our failure to comply
complete accuracy.
As a result of our dependence on all of these third party providers, we are subject to risks, including
or may disagree with our interpretation of the coverage or the amounts owed.
ultimate cost of compliance cannot be precisely estimated.
We currently have $61,850,000 remaining for future repurchases under our $750,000,000 stock repurchase program.
to replace.
An excerpt. Shown here: 40 of 73 rewritten, all 23 added and all 11 removed. The counts are complete. For every sentence, read Item 1A. RISK FACTORS in the FY2017 filing and the FY2016 filing.
Item 7. MANAGEMENT’S DISCUSSION AND ANALYSIS OF FINANCIAL CONDITION AND RESULTS OF OPERATIONS
108 rewritten, 44 added, 46 removed, 157 unchanged
The following discussion and analysis of our financial condition, results of operations, and liquidity and capital resources for the 52 weeks ended January [removed: 31, 2016] [added: 29, 2017] (“fiscal [removed: 2015”),] [added: 2016”),] the 52 weeks ended [removed: February 1, 2015] [added: January 31, 2016] (“fiscal [removed: 2014”),] [added: 2015”),] and the 52 weeks ended February [removed: 2, 2014] [added: 1, 2015] (“fiscal [removed: 2013”)] [added: 2014”)] should be read in conjunction with our Consolidated Financial Statements and notes thereto.
[removed: In fiscal 2015, our net] [added: Net] revenues [added: in fiscal 2016] increased [removed: 5.9% to $4,976,090,000] [added: by $107,722,000 or 2.2%,] compared to [removed: $4,698,719,000 in] fiscal [removed: 2014,] [added: 2015,] with comparable brand revenue growth of [removed: 3.7%.][added: 0.7%.]
This increase in net revenues was driven by a 6.4% increase in [removed: our] e-commerce net revenues [added: (primarily driven by West Elm, Williams Sonoma] and [added: Pottery Barn Kids), and] a 5.4% increase in our retail net [removed: revenues, and included 26.8% growth] [added: revenues (primarily driven by West Elm), with particular strength] in [removed: our international revenues.][added: furniture.]
In Pottery Barn, our largest brand, comparable brand revenues [removed: increased 1.9%] [added: declined 3.5%] in fiscal [removed: 2015] [added: 2016] compared to fiscal [removed: 2014.][added: 2015.]
This [removed: growth] [added: decrease] was primarily driven by our furniture, [removed: upholstery] [added: decorative accessories] and [removed: textile] [added: table top] collections, partially offset by [removed: softer] [added: stronger] sales [removed: trends] in [removed: our gifting categories.][added: upholstery.]
In the [removed: Williams-Sonoma] [added: Williams Sonoma] brand, comparable brand revenues increased [removed: 1.1%] [added: 1.3%] in fiscal [removed: 2015] [added: 2016] compared to fiscal [removed: 2014.][added: 2015.]
Growth in cookware, cutlery, tabletop and our [removed: Williams-Sonoma] [added: Williams Sonoma] Home business [removed: drove] [added: contributed to] these results.
In West Elm, comparable brand revenues increased [removed: 14.8%] [added: 12.8%] in fiscal [removed: 2015] [added: 2016] on top of [removed: 18.2%] [added: 14.8%] in fiscal [removed: 2014.][added: 2015.]
Growth continued to be broad-based across [removed: categories.][added: categories, primarily furniture.]
In PBteen, comparable brand revenues [removed: decreased 2.7%] [added: declined 6.2%] in fiscal [removed: 2015] [added: 2016] compared to fiscal [removed: 2014.][added: 2015.]
Strength in [removed: furniture, decorative accessories,] [added: back to school] and [removed: back-to-school] [added: dorm] categories [removed: were] [added: was] more than offset by weakness in [removed: our] textiles and [added: out of stock inventory in key furniture collections and] gifting [removed: collections.][added: categories.]
And in our emerging brands, Rejuvenation and Mark and Graham, net revenues increased [removed: 37.5%.][added: 26.6%.]
Additionally, in fiscal [removed: 2015,] [added: 2016,] diluted earnings per share increased to [removed: $3.37,] [added: $3.41,] versus [removed: $3.24] [added: $3.37] in fiscal [removed: 2014 (which included a $0.04 benefit from our share of the VISA/MasterCard antitrust litigation settlement),] [added: 2015,] and we returned [removed: $352,631,000] [added: $284,811,000] to our stockholders through stock repurchases and dividends.
We believe that collectively these strategies will extend our leadership position across [removed: our brands and in] [added: all of] our [removed: supply chain.][added: brands.]
| _In thousands_ | | Fiscal [removed: 2015] [added: 2016] | | | | % Total | | | | Fiscal [removed: 2014] [added: 2015] | | | | % Total | | | | Fiscal [removed: 2013] [added: 2014] | | | | % Total | | |
| E-commerce net revenues | | $ | [removed: 2,522,580] [added: 2,633,602] | | | | [removed: 50.7%] [added: 51.8%] | | | $ | [removed: 2,370,694] [added: 2,522,580] | | | | [removed: 50.5%] [added: 50.7%] | | | $ | [removed: 2,115,022] [added: 2,370,694] | | | | [removed: 48.2%] [added: 50.5%] | |
| Retail net revenues | | | [removed: 2,453,510] [added: 2,450,210] | | | | [removed: 49.3%] [added: 48.2%] | | | | [removed: 2,328,025] [added: 2,453,510] | | | | [removed: 49.5%] [added: 49.3%] | | | | [removed: 2,272,867] [added: 2,328,025] | | | | [removed: 51.8%] [added: 49.5%] | |
| Net revenues | | $ | [removed: 4,976,090] [added: 5,083,812] | | | | 100.0% | | | $ | [removed: 4,698,719] [added: 4,976,090] | | | | 100.0% | | | $ | [removed: 4,387,889] [added: 4,698,719] | | | | 100.0% | |
[removed: By brand, this] [added: This] increase [added: in net revenues] was [removed: primarily] driven by [added: a 4.4% increase in e-commerce net revenues (primarily driven by] West [removed: Elm] [added: Elm, Williams Sonoma] and [removed: Pottery Barn,] [added: Rejuvenation),] with particular strength in furniture.
Total fiscal 2015 net revenue growth [removed: also] included [removed: an] [added: a 26.8%] increase in [removed: our] international revenues [removed: of 26.8%,] primarily related to our franchise operations, and a 3.3% increase in retail leased square footage primarily due to 17 net new stores.
Net revenues in fiscal [removed: 2014] [added: 2016] increased by [removed: $310,830,000,] [added: $107,722,000] or [removed: 7.1%,] [added: 2.2%,] compared to fiscal [removed: 2013,] [added: 2015,] with comparable brand revenue growth of [removed: 7.1%.][added: 0.7%.]
The following table summarizes our net revenues by brand for fiscal [removed: 2015,] [added: 2016,] fiscal [removed: 2014] [added: 2015] and fiscal [removed: 2013.][added: 2014:]
| _In thousands_ | | Fiscal [removed: 2015] [added: 2016] | | | | Fiscal [removed: 2014] [added: 2015] | | | | Fiscal [removed: 2013] [added: 2014] | | |
| Pottery Barn | | $ | [removed: 2,074,051] [added: 2,024,218] | | | $ | [removed: 2,022,331] [added: 2,074,051] | | | $ | [removed: 1,910,978] [added: 2,022,331] | |
| [removed: Williams-Sonoma] [added: Williams Sonoma] | | | [removed: 993,609] [added: 1,002,194] | | | | [removed: 994,651] [added: 993,609] | | | | [removed: 978,002] [added: 994,651] | |
| West Elm | | | [removed: 821,136] [added: 971,568] | | | | [removed: 669,074] [added: 821,136] | | | | [removed: 531,305] [added: 669,074] | |
| Pottery Barn Kids | | | [removed: 640,073] [added: 635,381] | | | | [removed: 624,594] [added: 640,073] | | | | [removed: 597,628] [added: 624,594] | |
| PBteen | | | [removed: 253,602] [added: 237,818] | | | | [removed: 260,617] [added: 253,602] | | | | [removed: 246,449] [added: 260,617] | |
| Other_1_ | | | [removed: 193,619] [added: 212,633] | | | | [removed: 127,452] [added: 193,619] | | | | [removed: 123,527] [added: 127,452] | |
| Total | | $ | [removed: 4,976,090] [added: 5,083,812] | | | $ | [removed: 4,698,719] [added: 4,976,090] | | | $ | [removed: 4,387,889] [added: 4,698,719] | |
Sales [removed: related] to our international [removed: franchise operations] [added: franchisees] have also been excluded as [removed: they] [added: their stores and e-commerce websites] are not operated by us.
| _Comparable brand revenue growth (decline)_ | | Fiscal [removed: 2015] [added: 2016] | | | | Fiscal [removed: 2014] [added: 2015] | | | | Fiscal [removed: 2013] [added: 2014] | | |
| Pottery Barn | | | [removed: 1.9%] [added: (3.5%] | [added: )] | | | [removed: 5.8%] [added: 1.9%] | | | | [removed: 10.4%] [added: 5.8%] | |
| [removed: Williams-Sonoma] [added: Williams Sonoma] | | | [removed: 1.1%] [added: 1.3%] | | | | [removed: 3.8%] [added: 1.1%] | | | | [removed: 1.5%] [added: 3.8%] | |
| West Elm | | | [removed: 14.8%] [added: 12.8%] | | | | [removed: 18.2%] [added: 14.8%] | | | | [removed: 17.4%] [added: 18.2%] | |
| Pottery Barn Kids | | | [removed: 2.2%] [added: (1.4%] | [added: )] | | | [removed: 5.9%] [added: 2.2%] | | | | [removed: 7.8%] [added: 5.9%] | |
| PBteen | | | [removed: (2.7%] [added: (6.2%] | ) | | | [removed: 5.7%] [added: (2.7%] | [added: )] | | | [removed: 14.1%] [added: 5.7%] | |
| Total | | | [removed: 3.7%] [added: 0.7%] | | | | [removed: 7.1%] [added: 3.7%] | | | | [removed: 8.8%] [added: 7.1%] | |
| Retail net revenues | | $ | [removed: 2,453,510] [added: 2,450,210] | | | $ | [removed: 2,328,025] [added: 2,453,510] | | | $ | [removed: 2,272,867] [added: 2,328,025] | |
| Retail net revenue growth [added: (decline)] | | | [removed: 5.4%] [added: (0.1%] | [added: )] | | | [removed: 2.4%] [added: 5.4%] | | | | [removed: 4.6%] [added: 2.4%] | |
This net revenue increase was partially offset by a 0.1% decrease in retail net revenues (primarily in Pottery Barn and Williams Sonoma, partially offset by increases in West Elm and Rejuvenation).
Total fiscal 2016 net revenue growth included a 7.5% increase in international revenues primarily related to our company-owned international operations.
In Pottery Barn Kids, comparable brand revenues declined 1.4% in fiscal 2016 compared to fiscal 2015.
Strength in our furniture business was more than offset by softness in textiles and decorative accessories.
As we look forward to fiscal 2017, we plan to drive growth by focusing on our strategic priorities of innovation and operational excellence.
We plan to increase our competitive advantage through innovation in e-commerce, our products and our services, as well as the retail experience.
To accomplish this, we plan to invest in digital and online advertising initiatives.
In Pottery Barn Kids and PBteen, we plan to drive innovation in product offerings across all stages of early life, and in Williams Sonoma, we plan to introduce high-quality products under the Williams Sonoma brand, as well as to develop innovative exclusives with our third party vendors.
To enhance the customer experience in all of our stores, we plan to invest in point-of-sale technology and scheduling tools which will provide additional functionality and operational efficiencies.
We plan to evaluate the role our retail stores can and should play and plan to invest in optimizing top-performing stores while closing underperforming stores.
We also plan to continue to focus on operational excellence, driving strategies that directly improve our customers’ experience and value perceptions.
This increase in net revenues was driven by a 4.4% increase in e-commerce net revenues (primarily driven by West Elm, Williams Sonoma and Rejuvenation), with particular strength in furniture.
This net revenue increase was partially offset by a 0.1% decrease in retail net revenues (primarily in Pottery Barn and Williams Sonoma, partially offset by increases in West Elm and Rejuvenation).
Total fiscal 2016 net revenue growth included a 7.5% increase in international revenues primarily related to our company-owned international operations.
RETAIL STORE DATA
| _In thousands_ | | Fiscal 2016 | | | | Fiscal 2015 | | | | Fiscal 2014 | | |
_Fiscal 2016 vs. Fiscal 2015_
Cost of goods sold as a percentage of net revenues remained relatively flat, increasing less than 10 basis points to 63.0% in fiscal 2016 from 62.9% in fiscal 2015.
Higher selling margins from reduced shipping and fulfillment-related costs as a result of our focus on our supply chain and inventory initiatives were offset by an increase in occupancy costs related to investments in our supply chain.
In the e-commerce channel, cost of goods sold as a percentage of net revenues decreased in fiscal 2016 compared to fiscal 2015 primarily driven by higher selling margins from reduced shipping and fulfillment-related costs as a result of our focus on our supply chain and inventory initiatives, partially offset by an increase in occupancy costs related to investments in our supply chain.
| _In thousands_ | | Fiscal 2016 | | | | % Net Revenues | | | | Fiscal 2015 | | | | % Net Revenues | | | | Fiscal 2014 | | | | % Net Revenues | | |
_Fiscal 2016 vs. Fiscal 2015_
This increase as a percentage of net revenues was primarily driven by severance-related reorganization charges of approximately $14,406,000 during fiscal 2016, as well as an increase in digital advertising expenses.
The decrease in the effective income tax rate in fiscal 2016 reflects a one-time favorable tax adjustment.
and, based on our current projections, we expect to remain in compliance throughout fiscal 2017.
This represents a decrease in net cash provided by operating activities compared to fiscal 2015 primarily due to an increase in income taxes paid in fiscal 2016 compared to fiscal 2015.
Net cash used in financing activities compared to fiscal 2015 decreased primarily due to a decrease in repurchases of common stock.
| Operating leases_2_ | | $ | 268,593 | | | $ | 703,308 | | | $ | 322,910 | | | $ | 531,699 | | | $ | 1,826,510 | |
| Purchase obligations_3_ | | | 973,102 | | | | 8,889 | | | | 871 | | | | — | | | | 982,862 | |
| Total | | $ | 1,241,695 | | | $ | 712,197 | | | $ | 323,781 | | | $ | 531,699 | | | $ | 2,809,372 | |
| _In thousands_ | | Fiscal 2017 | | | | Fiscal 2018 to Fiscal 2020 | | | | Fiscal 2021 to Fiscal 2022 | | | | Thereafter | | | | Total | | |
| Total | | $ | 18,655 | | | | — | | | | — | | | | — | | | $ | 18,655 | |
Historically, actual shrinkage has not differed materially from our estimates.
If a long-lived asset is found to be
We first perform a qualitative assessment to evaluate goodwill for potential impairment.
If based on that assessment it is more likely than not that the fair value of the reporting unit is below its carrying value, a two-step quantitative test is necessary.
If the carrying value of the reporting unit’s assets and liabilities, including goodwill, exceeds its fair value, goodwill may be impaired.
Accordingly, no further impairment testing of goodwill was performed and we did not recognize any goodwill impairment in fiscal 2016.
In fiscal 2015 and fiscal 2014, we performed a quantitative goodwill impairment test and determined that the fair value of both our reporting units substantially exceeded their carrying value.
We review and
E-commerce net revenues generated 51% of our total company net revenues in fiscal 2015 compared to 50% of our net revenues in fiscal 2014.
In Pottery Barn Kids, comparable brand revenues increased 2.2% in fiscal 2015 compared to fiscal 2014, primarily driven by our furniture, back-to-school and bedding categories.
As we look forward, in all of our brands we have targeted strategies and opportunities that we believe will allow us to profitably grow the business.
We plan to improve our competitive positioning across product, service and value for our customers, and plan to expand our brands into new products and market segments through the expansion of proprietary products.
We also plan to develop cross-brand initiatives to more fully engage with our customers and to leverage innovative marketing channels.
We plan to invest in our high growth, newer brands, particularly West Elm, and expand our global reach through existing and new franchise relationships.
In addition, we have identified four key strategies within our business to help us drive improvements across the company: re-asserting our product leadership, revolutionizing our approach to inventory, transforming our marketing, and changing our approach to real estate and the retail experience.
This increase in net revenues was driven by a 6.4% increase in our e-commerce net revenues and a 5.4% increase in our retail net revenues.
This increase was driven by a 12.1% increase in our e-commerce net revenues and a 2.4% increase in our retail net revenues.
By brand, this increase was primarily driven by the West Elm and Pottery Barn brands.
Total fiscal 2014 net revenue growth also included an increase in our international revenues of 9.4%, and a 2.2% increase in retail leased square footage primarily due to 16 net new stores.
| | | | | | | | | | | | | |
| --- | --- | --- | --- | --- | --- | --- | --- | --- | --- | --- | --- | --- |
E-COMMERCE NET REVENUES
| E-commerce net revenues | | $ | 2,522,580 | | | $ | 2,370,694 | | | $ | 2,115,022 | |
| E-commerce net revenue growth | | | 6.4% | | | | 12.1% | | | | 13.1% | |
E-commerce net revenues in fiscal 2015 increased by $151,886,000, or 6.4%, compared to fiscal 2014, led by West Elm, Williams-Sonoma and Pottery Barn Kids.
E-commerce net revenues in fiscal 2014 increased by $255,672,000, or 12.1%, compared to fiscal 2013, with increases across all brands, led by West Elm, Pottery Barn and Williams-Sonoma.
RETAIL NET REVENUES AND OTHER DATA
Retail net revenues in fiscal 2015 increased by $125,485,000, or 5.4%, compared to fiscal 2014, primarily driven by West Elm.
Retail net revenue growth for fiscal 2015 also included growth in our international revenues primarily related to our franchise operations, and a 3.3% increase in retail leased square footage primarily due to 17 net new stores.
Retail net revenues in fiscal 2014 increased by $55,158,000, or 2.4%, compared to fiscal 2013, led by West Elm and Pottery Barn, partially offset by a decrease in Williams-Sonoma due to store closures at the end of fiscal 2013.
_Fiscal 2014 vs. Fiscal 2013_
Cost of goods sold as a percentage of net revenues increased to 61.7% in fiscal 2014 from 61.2% in fiscal 2013.
This increase was primarily driven by lower selling margins.
In the retail channel, cost of goods sold as a percentage of net revenues remained relatively flat in fiscal 2014 compared to fiscal 2013 due to an increase in occupancy expenses offset by higher selling margins.
This decrease as a percentage of net revenues was primarily driven by greater advertising efficiency, lower general expenses, including litigation settlement income recorded of $7,414,000, and the leverage of employment costs.
and dividend payments.
This represents an increase in net cash provided compared to fiscal 2013 primarily due to a decrease in inventory purchases and an increase in net earnings adjusted for non-cash items, partially offset by the timing of payments associated with accounts payable and accrued liabilities.
stock of $224,377,000 and the payment of dividends of $125,758,000.
Net cash used compared to fiscal 2013 increased primarily due to an increase in tax withholding payments related to stock-based awards.
| Operating leases_2_ | | $ | 257,805 | | | $ | 657,472 | | | $ | 305,376 | | | $ | 513,255 | | | $ | 1,733,908 | |
| Purchase obligations_3_ | | | 765,417 | | | | 9,388 | | | | 654 | | | | 318 | | | | 775,777 | |
| Total | | $ | 1,023,222 | | | $ | 666,860 | | | $ | 306,030 | | | $ | 513,573 | | | $ | 2,509,685 | |
| Total | | $ | 19,455 | | | | — | | | | — | | | | — | | | $ | 19,455 | |
_Advertising and Prepaid Catalog Expenses_
Advertising expenses consist of media and production costs related to catalog mailings, e-commerce advertising and other direct marketing activities.
All advertising costs are expensed as incurred, or upon the release of the initial advertisement, with the exception of prepaid catalog expenses.
Prepaid catalog expenses consist primarily of third party incremental direct costs, including creative design, paper, printing, postage and mailing costs for all of our direct response catalogs.
Such costs are capitalized as prepaid catalog expenses and are amortized over their expected period of future benefit.
An excerpt. Shown here: 40 of 108 rewritten, 40 of 44 added and 40 of 46 removed. The counts are complete. For every sentence, read Item 7. MANAGEMENT’S DISCUSSION AND ANALYSIS OF FINANCIAL CONDITION AND RESULTS OF OPERATIONS in the FY2017 filing and the FY2016 filing.
Item 7A. QUANTITATIVE AND QUALITATIVE DISCLOSURES ABOUT MARKET RISK
330 rewritten, 96 added, 95 removed, 447 unchanged
We are exposed to market risks, which include significant deterioration of the U.S. and foreign markets, changes in U.S. interest rates, foreign currency exchange rate [removed: fluctuations,] [added: fluctuations] and the effects of economic uncertainty which may affect the prices we pay our vendors in the foreign countries in which we do business.
During fiscal [removed: 2015,] [added: 2016,] we had borrowings of [removed: $200,000,000] [added: $125,000,000] under the credit facility, all of which were repaid in the fourth quarter of fiscal [removed: 2015.][added: 2016.]
As of January [removed: 31, 2016,] [added: 29, 2017,] our investments, made primarily in demand deposit accounts and money market funds, are stated at cost and approximate their fair values.
Any foreign currency impact related to these international purchase transactions was not significant to us during fiscal [removed: 2015] [added: 2016] or fiscal [removed: 2014.][added: 2015.]
While the impact of foreign currency exchange rate fluctuations was not material to us in fiscal [removed: 2015,] [added: 2016,] we have continued to see volatility in the exchange rates in the countries in which we do business.
To mitigate this risk, we hedge a portion of our foreign currency exposure with foreign currency forward contracts in accordance with our risk management policies (see Note [removed: M] [added: L] to our Consolidated Financial Statements).
| ITEM 8. [removed: FINANCIAL | STATEMENTS] [added: FINANCIAL STATEMENTS] AND SUPPLEMENTARY DATA | [added: |]
| _In thousands, except per share amounts_ | | | Fiscal [removed: 2015] [added: 2016] | | | | Fiscal [removed: 2014] [added: 2015] | | | | Fiscal [removed: 2013] [added: 2014] | |
| E-commerce net revenues | | | $ [removed: 2,522,580] [added: 2,633,602] | | | | $ [removed: 2,370,694] [added: 2,522,580] | | | | $ [removed: 2,115,022] [added: 2,370,694] | |
| Retail net revenues | | | [removed: 2,453,510] [added: 2,450,210] | | | | [removed: 2,328,025] [added: 2,453,510] | | | | [removed: 2,272,867] [added: 2,328,025] | |
| Net revenues | | | [removed: 4,976,090] [added: 5,083,812] | | | | [removed: 4,698,719] [added: 4,976,090] | | | | [removed: 4,387,889] [added: 4,698,719] | |
| Cost of goods sold | | | [removed: 3,131,876] [added: 3,200,502] | | | | [removed: 2,898,215] [added: 3,131,876] | | | | [removed: 2,683,673] [added: 2,898,215] | |
| Gross profit | | | [removed: 1,844,214] [added: 1,883,310] | | | | [removed: 1,800,504] [added: 1,844,214] | | | | [removed: 1,704,216] [added: 1,800,504] | |
| Selling, general and administrative expenses | | | [removed: 1,355,580] [added: 1,410,711] | | | | [removed: 1,298,239] [added: 1,355,580] | | | | [removed: 1,252,118] [added: 1,298,239] | |
| Operating income | | | [removed: 488,634] [added: 472,599] | | | | [removed: 502,265] [added: 488,634] | | | | [removed: 452,098] [added: 502,265] | |
| Interest (income) expense, net | | | [removed: 627] [added: 688] | | | | [removed: 62] [added: 627] | | | | [removed: (584] [added: 62] | [removed: )] |
| Earnings before income taxes | | | [removed: 488,007] [added: 471,911] | | | | [removed: 502,203] [added: 488,007] | | | | [removed: 452,682] [added: 502,203] | |
| Income taxes | | | [removed: 177,939] [added: 166,524] | | | | [removed: 193,349] [added: 177,939] | | | | [removed: 173,780] [added: 193,349] | |
| Net earnings | | | $ [removed: 310,068] [added: 305,387] | | | | $ [removed: 308,854] [added: 310,068] | | | | $ [removed: 278,902] [added: 308,854] | |
| Basic earnings per share | | | $ [removed: 3.42] [added: 3.45] | | | | [removed: $3.30] [added: $ 3.42] | | | | $ [removed: 2.89] [added: 3.30] | |
| Diluted earnings per share | | | $ [removed: 3.37] [added: 3.41] | | | | [removed: $3.24] [added: $ 3.37] | | | | $ [removed: 2.82] [added: 3.24] | |
| Basic | | | [removed: 90,787] [added: 88,594] | | | | [removed: 93,634] [added: 90,787] | | | | [removed: 96,669] [added: 93,634] | |
| Diluted | | | [removed: 92,102] [added: 89,462] | | | | [removed: 95,200] [added: 92,102] | | | | [removed: 98,765] [added: 95,200] | |
[added: |] _See Notes to Consolidated Financial Statements._ [added: _Williams-Sonoma, Inc._ _Consolidated Statements of Comprehensive Income_ | | | | | | | | | | | | |]
| _In thousands_ | | | Fiscal [removed: 2015] [added: 2016] | | | | Fiscal [removed: 2014] [added: 2015] | | | | Fiscal [removed: 2013] [added: 2014] | |
| Other comprehensive income [removed: (loss), net of tax:] [added: (loss):] | | | | | | | | | | | | |
| Foreign currency translation adjustments | | | [removed: (7,958] [added: 1,523] | [removed: )] | | | [removed: (9,305] [added: (7,958] | ) | | | [removed: (7,850] [added: (9,305] | ) |
| Change in fair value of derivative financial [removed: instruments] [added: instruments, net of tax] | | | [removed: 1,074] [added: (916] | [added: )] | | | [removed: 806] [added: 1,074] | | | | [removed: 870] [added: 806] | |
| Reclassification adjustment for realized [removed: gains] [added: (gain) loss] on derivative financial [removed: instruments] [added: instruments_1_] | | | [removed: (1,184] [added: —] | [removed: )] | | | (573 | ) | | | [removed: (129] [added: (573] | ) |
| Comprehensive income | | | $ [removed: 302,000] [added: 306,100] | | | | $ [removed: 299,782] [added: 302,000] | | | | $ [removed: 271,793] [added: 299,782] | |
| _In thousands, except per share amounts_ | | Jan. [removed: 31, 2016] [added: 29, 2017] | | | | [removed: Feb. 1, 2015] [added: Jan. 31, 2016] | | |
| Cash and cash equivalents [added: at beginning of year] | | | [removed: $] 193,647 | | | | [removed: $] 222,927 | | [added: | | 330,121 | |]
| Accounts receivable, net | | | [removed: 79,304] [added: 88,803] | | | | [removed: 67,465] [added: 79,304] | |
| Merchandise inventories, net | | | [removed: 978,138] [added: 977,505] | | | | [removed: 887,701] [added: 978,138] | |
| Prepaid catalog expenses | | | [removed: 28,919] [added: 23,625] | | | | [removed: 33,942] [added: 28,919] | |
| Prepaid expenses | | | [removed: 44,654] [added: 52,882] | | | | [removed: 36,265] [added: 44,654] | |
| Deferred income taxes, net | | | [removed: —] [added: 135,238] | | | | [removed: 130,618] [added: 141,784] | |
| Other assets | | | [removed: 11,438] [added: 10,652] | | | | [removed: 13,005] [added: 11,438] | |
| Total current assets | | | [removed: 1,336,100] [added: 1,367,180] | | | | [removed: 1,391,923] [added: 1,336,100] | |
| Property and equipment, net | | | [removed: 886,813] [added: 923,283] | | | | [removed: 883,012] [added: 886,813] | |
| Cash and cash equivalents | | | $ 213,713 | | | | $ 193,647 | |
| Net earnings | | | — | | | | — | | | | — | | | | 305,387 | | | | — | | | | — | | | | 305,387 | |
| Repurchases of common stock | | | (2,871 | ) | | | (29 | ) | | | (12,684 | ) | | | (138,559 | ) | | | — | | | | — | | | | (151,272 | ) |
| Reissuance of treasury stock under stock-based compensation plans_1_ | | | — | | | | — | | | | (706 | ) | | | (83 | ) | | | — | | | | 789 | | | | — | |
| Dividends declared | | | — | | | | — | | | | — | | | | (133,588 | ) | | | — | | | | — | | | | (133,588 | ) |
| Balance at January 29, 2017 | | | 87,325 | | | $ | 873 | | | $ | 556,928 | | | $ | 701,702 | | | $ | (9,903 | ) | | $ | (1,380 | ) | | $ | 1,248,220 | |
| Net earnings | | $ | 305,387 | | | $ | 310,068 | | | $ | 308,854 | |
| Other | | | 439 | | | | 769 | | | | 1,911 | |
In addition, during fiscal 2016, we entered into a franchise agreement with an unaffiliated franchisee to operate stores and e-commerce websites in South Korea, beginning in fiscal 2017.
_Consolidation_
The Consolidated Financial Statements include the accounts of Williams-Sonoma, Inc. and its subsidiaries.
Historically, actual shrinkage has not differed materially from our estimates.
We first perform a qualitative assessment to evaluate goodwill for potential impairment.
If based on that assessment it is more likely than not that the fair value of the reporting unit is below its carrying value, a two-step quantitative test is necessary.
If the carrying value of the reporting unit’s assets and liabilities, including goodwill, exceeds its fair value, goodwill may be impaired.
Accordingly, no further impairment testing of goodwill was performed and we did not recognize any goodwill impairment in fiscal 2016.
In fiscal 2015 and fiscal 2014, we performed a quantitative goodwill impairment test and determined that the fair value of both our reporting units substantially exceeded their carrying value.
Accordingly, we did not recognize any goodwill impairment in fiscal 2015 or fiscal 2014.
We recognize revenues from sales to franchisees at the time merchandise ownership is transferred to the franchisee.
The FASB also issued ASU 2016-10, _Identifying Performance Obligations and Licensing_ in April 2016, which amends certain aspects of ASU 2014-09 for identifying performance obligations and the implementation guidance on licensing.
We are currently assessing the impact of these ASUs on our Consolidated Financial Statements, however, we expect that the adoption of these standards will result in a change in the timing of revenue recognition for certain merchandise shipped to the customer, as well as a change in the timing of recognizing breakage income related to our gift cards.
investments in equity securities and the presentation of certain fair value changes for financial liabilities measured at fair value.
We do not expect the adoption of this ASU to have a material impact on our financial condition, results of operations or cash flows.
In March 2016, the FASB issued ASU 2016-09, _Improvements to Employee Share-Based Payment Accounting_, which simplifies the accounting for share-based payment transactions (including the accounting for income taxes and forfeitures, among other areas).
The ASU requires entities to, among other things, recognize all excess tax benefits and deficiencies in the income statement, as a component of income tax expense or benefit, in the period in which they occur.
The ASU also allows an entity to make an accounting policy election to either estimate expected forfeitures or account for them as they occur.
We will adopt this ASU in the first quarter of fiscal 2017.
Any increased volatility in the income statement as a result of applying the provisions of the ASU will be dependent on future vesting activity and volatility in our stock price.
We plan to continue to estimate expected forfeitures.
In October 2016, the FASB issued ASU 2016-16, _Intra-Entity Transfers of Assets Other than Inventory_.
The amendments remove the prohibition against the recognition of current and deferred income tax effects of intra-entity transfers of assets other than inventory until the asset has been sold to an outside party.
We do not expect the adoption of this ASU to have a material impact on our financial condition, results of operations or cash flows.
In January 2017, the FASB issued ASU 2017-04, _Simplifying the Test for Goodwill Impairment,_ which simplifies the measurement of goodwill impairment by eliminating step two from the goodwill impairment test.
The ASU requires goodwill impairment to be measured as the amount by which a reporting unit’s carrying value exceeds its fair value, not to exceed the total amount of goodwill allocated to the reporting unit.
This ASU is effective for fiscal years and interim periods within those fiscal years beginning after December 15, 2019 and early adoption is permitted.
We do not expect the adoption of this ASU to have a material impact on our financial condition, results of operations or cash flows.
| _In thousands_ | | Fiscal 2016 | | | | Fiscal 2015 | | | | Fiscal 2014 | | |
| _In thousands_ | | Fiscal 2016 | | | | Fiscal 2015 | | | | Fiscal 2014 | | |
| Executive deferred compensation | | | 7,060 | | | | 6,003 | |
| _In thousands_ | | Fiscal 2016 | | | | Fiscal 2015 | | | | Fiscal 2014 | | |
##### [Table of Contents](#toc)
_Williams-Sonoma, Inc._
| | | | | | | | | | | | | |
| --- | --- | --- | --- | --- | --- | --- | --- | --- | --- | --- | --- | --- |
_Consolidated Statements of Comprehensive Income_
| Non-current deferred income taxes, net | | | 141,784 | | | | 4,265 | |
| Current portion of long-term debt | | | — | | | | 1,968 | |
| Balance at February 3, 2013 | | | 97,734 | | | $ | 977 | | | $ | 503,616 | | | $ | 790,912 | | | $ | 13,633 | | | $ | — | | | $ | 1,309,138 | |
| Net earnings | | | — | | | | — | | | | — | | | | 278,902 | | | | — | | | | — | | | | 278,902 | |
| Repurchases of common stock | | | (4,345 | ) | | | (43 | ) | | | (17,047 | ) | | | (219,083 | ) | | | — | | | | (3,101 | ) | | | (239,274 | ) |
| Dividends declared | | | — | | | | — | | | | — | | | | (121,688 | ) | | | — | | | | — | | | | (121,688 | ) |
| Proceeds from insurance reimbursements | | | 683 | | | | 1,644 | | | | 1,518 | |
| Other | | | 86 | | | | 267 | | | | 45 | |
| Cash and cash equivalents at beginning of year | | | 222,927 | | | | 330,121 | | | | 424,555 | |
_Restricted Cash_
Restricted cash represents deposits held in trusts to secure our liabilities associated with our workers’ compensation and other insurance programs.
During fiscal 2014, we redeemed restricted cash deposits of $14,289,000 previously held under collateralized trust agreements.
We held no restricted cash during fiscal 2015.
Each catalog is generally fully amortized over a six to nine month period, with the majority of the amortization occurring within the first four to five months.
Prepaid catalog expenses are evaluated for realizability on a monthly basis by comparing the carrying amount associated with each catalog to the estimated future profitability (net revenues less merchandise cost of goods sold, selling expenses and catalog-related costs) of that catalog.
If the estimated future profitability of the catalog is below its carrying amount, the catalog is impaired accordingly.
| --- | --- | --- |
Restricted
We are currently assessing the potential impact of these ASUs on our Consolidated Financial Statements.
In November 2015, the FASB issued ASU 2015-17, _Balance Sheet Classification of Deferred Taxes_, which requires entities to present both deferred tax assets and deferred tax liabilities as noncurrent in a classified balance sheet.
December 15, 2016; however, early adoption is permitted.
We early adopted this ASU prospectively and have presented both deferred tax assets and deferred tax liabilities as noncurrent in our Consolidated Balance Sheet as of January 31, 2016.
Prior balance sheets have not been retrospectively adjusted.
Long-term debt consists of the following:
Significant components of our deferred tax accounts are as follows:
| Executive deferral plan | | | 6,003 | | | | 5,437 | |
As of January 31, 2016, we adopted ASU 2015-17, _Balance Sheet Classification of Deferred Taxes_.
We have adopted this ASU prospectively and have presented both deferred tax assets and deferred tax liabilities as noncurrent in our Consolidated Balance Sheet as of January 31, 2016.
Prior balance sheets have not been retrospectively adjusted (see Note A).
| Fiscal 2017 | | | 242,036 | |
| Fiscal 2018 | | | 218,381 | |
| Fiscal 2019 | | | 197,055 | |
| Fiscal 2020 | | | 168,046 | |
| Thereafter | | | 650,585 | |
| Total | | | $ 1,733,908 | |
An excerpt. Shown here: 40 of 330 rewritten, 40 of 96 added and 40 of 95 removed. The counts are complete. For every sentence, read Item 7A. QUANTITATIVE AND QUALITATIVE DISCLOSURES ABOUT MARKET RISK in the FY2017 filing and the FY2016 filing.
Item 1. BUSINESS
29 rewritten, 6 added, 1 removed, 66 unchanged
We currently operate retail stores in the [removed: United States, Canada,] [added: U.S.,] Puerto Rico, [added: Canada,] Australia and the United Kingdom, and franchise our brands to third parties in [removed: a number of countries in] the Middle East, the Philippines and Mexico.
[removed: _Williams-Sonoma_][added: _Williams Sonoma_]
From the beginning, our namesake brand, [removed: Williams-Sonoma,] [added: Williams Sonoma,] has been bringing people together around food.
[removed: Williams-Sonoma] [added: Williams Sonoma] products include everything for cooking, dining and entertaining, including: cookware, tools, electrics, cutlery, tabletop and bar, outdoor, furniture and a vast library of cookbooks.
The brand also includes [removed: Williams-Sonoma] [added: Williams Sonoma] Home, a premium concept that offers classic home furnishings and decorative accessories, extending the [removed: Williams-Sonoma] [added: Williams Sonoma] lifestyle beyond the kitchen into every room of the home.
Headquartered in Brooklyn, New York, [removed: the brand] [added: West Elm] opened its first store in 2003 in [removed: Brooklyn,] [added: Dumbo,] the neighborhood it still proudly calls home.
From its commitment to Fair Trade Certified, local and handcrafted [removed: products] [added: products,] to its community-driven in-store events and collaborations, [added: and] to its role as part of an active [removed: community on social media, everything West Elm does is designed to make an impact.]
Launched in [removed: late] 2012, Mark and Graham is designed to be a premier destination for personalized gift buying.
As of January [removed: 31, 2016,] [added: 29, 2017,] the e-commerce channel had the following [removed: merchandising] [added: merchandise] strategies: [removed: Williams-Sonoma,] [added: Williams Sonoma,] Pottery Barn, Pottery Barn Kids, West Elm, PBteen, [removed: Williams-Sonoma] [added: Williams Sonoma] Home, Rejuvenation and Mark and Graham, which sell our products through our e-commerce websites and direct-mail catalogs.
We offer shipping from many of our brands to countries worldwide, while our catalogs reach customers [removed: across] [added: throughout] the U.S. and Australia.
In addition, we believe that our e-commerce websites and our [removed: direct-mail] [added: direct mail] catalogs act as a cost-efficient means of testing market acceptance of new products and new brands.
Leveraging these insights and our multi-channel positioning, our marketing efforts, including the use of online advertising and the circulation of catalogs, are targeted toward driving sales to [removed: all] [added: each] of our [removed: channels, including retail.][added: channels.]
Detailed financial information about the e-commerce channel is found in Note [removed: L] [added: K] to our Consolidated Financial Statements.
As of January [removed: 31, 2016,] [added: 29, 2017,] the retail channel had the following [removed: merchandising] [added: merchandise] strategies: [removed: Williams-Sonoma,] [added: Williams Sonoma,] Pottery Barn, Pottery Barn Kids, West Elm and Rejuvenation, operating [removed: 618] [added: 629] stores comprising [removed: 571] [added: 583] stores in 43 states, Washington, [removed: D.C.,] [added: D.C.] and Puerto Rico, [removed: 27] [added: 26] stores in Canada, 19 stores in Australia and 1 store in the United Kingdom.
We also have multi-year franchise agreements with third parties that currently operate [removed: 48] [added: 66] franchised stores and/or e-commerce websites in [removed: a number of countries in] the Middle East, the Philippines and Mexico.
The retail [removed: business] [added: channel] complements the e-commerce [removed: business] [added: channel] by building brand awareness and attracting new customers to our brands.
Our retail stores serve as billboards for our brands, which we believe inspires our customers to [added: also] shop online and through our catalogs.
Detailed financial information about the retail channel is found in Note [removed: L] [added: K] to our Consolidated Financial Statements.
We purchase most of our merchandise from numerous foreign and domestic manufacturers and importers, the largest of which accounted for approximately 2% of our purchases during fiscal [removed: 2015.][added: 2016.]
Approximately [removed: 67%] [added: 64%] of our merchandise purchases in fiscal [removed: 2015] [added: 2016] were sourced from foreign vendors in [removed: 48] [added: 43] countries, predominantly in Asia and Europe.
Our specialty retail stores, e-commerce websites and direct-mail catalogs compete with other retailers, including large department stores, discount retailers, other specialty retailers offering home-centered assortments, other e-commerce websites and other [removed: direct-mail] [added: direct mail] catalogs.
In preparation for and during our holiday selling season, we hire a substantial number of additional temporary employees, primarily in our retail stores, customer care centers and distribution [removed: centers,] [added: facilities,] and incur significant fixed catalog production and mailing costs.
As of January [removed: 31, 2016,] [added: 29, 2017,] we had approximately [removed: 28,100] [added: 28,300] employees, of whom approximately [removed: 11,600] [added: 10,500] were full-time.
In preparation for and during our fiscal [removed: 2015] [added: 2016] holiday selling season, we hired approximately [removed: 8,900] [added: 9,100] temporary employees primarily in our retail stores, [added: distribution facilities and] customer care [removed: centers and distribution] centers.
We own and/or have applied to register [removed: 80] [added: 118] separate trademarks and service marks.
We own and/or have applied to register our key brand names as trademarks in the U.S. and [removed: 92] [added: 93] additional jurisdictions.
[removed: Exclusive] [added: Generally, exclusive] rights to the trademarks and service marks are held by Williams-Sonoma, Inc. and are used by our subsidiaries and franchisees under a license.
The core brand names in particular, including [removed: “Williams-Sonoma,”] [added: “Williams Sonoma,”] “Pottery Barn,” “pottery barn kids,” “PBteen,” “west elm,” [removed: “Williams-Sonoma] [added: “Williams Sonoma] Home,” “Rejuvenation” and “Mark and Graham” are of material importance to us.
[removed: In addition, we have registered and maintain numerous Internet domain names, including “williams-sonoma.com,” “potterybarn.com,” “potterybarnkids.com,”] “pbteen.com,” “westelm.com,” “wshome.com,” “williams-sonomainc.com,” “rejuvenation.com” and “markandgraham.com.” Collectively, the trademarks, copyrights, trade dress rights and domain names that we hold are of material importance to us.
Growth across the Williams-Sonoma, Inc. portfolio has been fueled by three areas of strategic investment: brand experimentation and innovation, for a best-in-class approach to multi-channel retail experiences; operational excellence across the enterprise, from quality product and sourcing, to efficient manufacturing and supply chain; and culture and corporate social responsibility, from commitments to foster women in leadership and embrace diversity, to a healthy impact on our community and environment.
In addition, during fiscal 2016, we entered into a franchise agreement with an unaffiliated franchisee to operate stores and e-commerce websites in South Korea, beginning in 2017.
community on social media, everything West Elm does is designed to make an impact.
West Elm also operates West Elm Workspace, which provides furnishings to the commercial sector, and recently announced its expansion into the travel and hospitality industry with the launch of West Elm Hotels.
In addition, during fiscal 2016, we entered into a franchise agreement with an unaffiliated franchisee to operate stores and e-commerce websites in South Korea, beginning in 2017.
In addition, we have registered and maintain numerous Internet domain names, including “williams-sonoma.com,” “potterybarn.com,” “potterybarnkids.com,”
Additionally, by embracing new technologies and customer-engagement strategies as they emerge, we are able to continually refine our best-in-class approach to multi-channel retailing.
Item 3. LEGAL PROCEEDINGS
2 rewritten, 0 added, 0 removed, 5 unchanged
These disputes, which are not currently material, are increasing in number as our business expands and our company [removed: grows larger.][added: grows.]
Any claims against us, whether meritorious or not, could [removed: be time consuming,] result in costly litigation, require significant amounts of management time and result in the diversion of significant operational resources.
Cover and table of contents
34 rewritten, 4 added, 1 removed, 60 unchanged
| [removed: x] [added: ☒] | ANNUAL REPORT PURSUANT TO SECTION 13 OR 15(d) OF THE SECURITIES EXCHANGE ACT OF 1934 |
For the fiscal year ended January [removed: 31, 2016.][added: 29, 2017.]
| [removed: ¨] [added: ☐] | TRANSITION REPORT PURSUANT TO SECTION 13 OR 15(d) OF THE SECURITIES EXCHANGE ACT OF 1934 |
Yes [removed: x] [added: ☒] No [removed: ¨][added: ☐]
Yes [removed: ¨] [added: ☐] No [removed: x][added: ☒]
Indicate by check mark if disclosure of delinquent filers pursuant to Item 405 of Regulation S-K (§229.405 of this chapter) is not contained herein, and will not be contained, to the best of registrant’s knowledge, in definitive proxy or information statements incorporated by reference in Part III of this Form 10-K or any amendment to this Form 10-K. [removed: x]
Large accelerated filer [removed: x] [added: ☒] Accelerated filer [removed: ¨] [added: ☐] Non-accelerated filer [removed: ¨] [added: ☐] (Do not check if a smaller
reporting company) Smaller reporting company [removed: ¨][added: ☐]
As of [removed: August 2, 2015,] [added: July 31, 2016,] the approximate aggregate market value of the registrant’s common stock held by non-affiliates was [removed: $7,577,638,000.][added: $4,757,778,000.]
It is assumed for purposes of this computation that an affiliate includes all persons as of [removed: August 2, 2015] [added: July 31, 2016] listed as executive officers and directors with the Securities and Exchange Commission.
As of March [removed: 27, 2016, 89,158,790] [added: 26, 2017, 86,840,278] shares of the registrant’s common stock were outstanding.
Portions of our definitive Proxy Statement for the [removed: 2016] [added: 2017] Annual Meeting of Stockholders, also referred to in this Annual Report on Form 10-K as our Proxy Statement, which will be filed with the Securities and Exchange Commission, or SEC, have been incorporated in Part III hereof.
Such forward-looking statements include, without limitation, statements related to: projections of earnings, revenues, growth and other financial items; the strength of our business and our brands; our strategic [removed: growth initiatives;] [added: initiatives regarding innovation and operational excellence and related investments;] our beliefs about our [removed: competitive position, relative performance] [added: advantages] and [added: leadership position across] our [added: brands; our] ability to [removed: leverage our competitive advantages;] [added: drive long-term profitable growth;] the plans, strategies, initiatives and objectives of management for future operations; our brands, products and related initiatives, including our ability to introduce new brands, new products and product lines and bring in new customers; our belief that our e-commerce websites and [removed: direct-mail] [added: direct mail] catalogs act as a cost-efficient means of testing market acceptance of new products and new brands; the complementary nature of our e-commerce and retail channels; our marketing efforts; our global business and expansion efforts, including franchise, other [removed: third party] [added: third-party] arrangements and company-owned operations; our ability to attract new customers; the seasonal variations in demand; our ability to recruit, retain and motivate skilled personnel; our belief in the reasonableness of the steps taken to protect the security and confidentiality of the information we collect; our belief in the adequacy of our facilities and the availability of suitable additional or substitute space; our belief in the ultimate resolution of current legal proceedings; the payment of dividends; our stock repurchase program; our [removed: key initiatives in product leadership, inventory, marketing and real estate; our strategies and opportunities to profitably grow our business; our plans to strengthen our competitive position; our plans to develop cross brand initiatives; our leadership position across our brands and in our supply chain; our] capital allocation strategy in fiscal [removed: 2016;] [added: 2017;] our planned use of cash in fiscal [removed: 2016;] [added: 2017;] our compliance with financial covenants; our belief that our cash on hand and available credit facilities will provide adequate liquidity for our business operations over the next 12 months; our belief that our accumulated undistributed earnings of our foreign subsidiaries are sufficient to support our anticipated future cash needs of our foreign operations; our intentions regarding the utilization of such undistributed earnings; our belief regarding the effects of potential losses under our indemnification obligations; the impact of inflation; the effects of changes in our inventory reserves; the impact of new accounting pronouncements; and statements of belief and statements of assumptions underlying any of the foregoing.
FISCAL YEAR ENDED JANUARY [removed: 31, 2016][added: 29, 2017]
| Item 1. | | [removed: [Business](#tx120289_1)] [added: [Business](#tx265187_2)] | | | 3 | |
| Item 1A. | | [Risk [removed: Factors](#tx120289_2)] [added: Factors](#tx265187_3)] | | | 6 | |
| Item 1B. | | [Unresolved Staff [removed: Comments](#tx120289_3)] [added: Comments](#tx265187_4)] | | | 20 | |
| Item 2. | | [removed: [Properties](#tx120289_4)] [added: [Properties](#tx265187_5)] | | | 20 | |
| Item 3. | | [Legal [removed: Proceedings](#tx120289_5)] [added: Proceedings](#tx265187_6)] | | | 21 | |
| Item 4. | | [Mine Safety [removed: Disclosures](#tx120289_6)] [added: Disclosures](#tx265187_7)] | | | 21 | |
| Item 5. | | [Market for Registrant’s Common Equity, Related Stockholder Matters and Issuer Purchases of Equity [removed: Securities](#tx120289_7)] [added: Securities](#tx265187_9)] | | | 22 | |
| Item 6. | | [Selected Financial [removed: Data](#tx120289_8)] [added: Data](#tx265187_10)] | | | 25 | |
| Item 7. | | [Management’s Discussion and Analysis of Financial Condition and Results of [removed: Operations](#tx120289_9)] [added: Operations](#tx265187_11)] | | | 26 | |
| Item 7A. | | [Quantitative and Qualitative Disclosures About Market [removed: Risk](#tx120289_10)] [added: Risk](#tx265187_12)] | | | 36 | |
| Item 8. | | [Financial Statements and Supplementary [removed: Data](#tx120289_11)] [added: Data](#tx265187_13)] | | | 37 | |
| Item 9. | | [Changes in and Disagreements with Accountants on Accounting and Financial [removed: Disclosure](#tx120289_12)] [added: Disclosure](#tx265187_14)] | | | [removed: 61] [added: 60] | |
| Item 9A. | | [Controls and [removed: Procedures](#tx120289_13)] [added: Procedures](#tx265187_15)] | | | [removed: 61] [added: 60] | |
| Item 9B. | | [Other [removed: Information](#tx120289_14)] [added: Information](#tx265187_16)] | | | [removed: 62] [added: 61] | |
| Item 10. | | [Directors, Executive Officers and Corporate [removed: Governance](#tx120289_15)] [added: Governance](#tx265187_18)] | | | [removed: 63] [added: 62] | |
| Item 11. | | [Executive [removed: Compensation](#tx120289_16)] [added: Compensation](#tx265187_19)] | | | [removed: 63] [added: 62] | |
| Item 12. | | [Security Ownership of Certain Beneficial Owners and Management and Related Stockholder [removed: Matters](#tx120289_17)] [added: Matters](#tx265187_20)] | | | [removed: 63] [added: 62] | |
| Item 13. | | [Certain Relationships and Related Transactions, and Director [removed: Independence](#tx120289_18)] [added: Independence](#tx265187_21)] | | | [removed: 63] [added: 62] | |
| Item 14. | | [Principal Accountant Fees and [removed: Services](#tx120289_19)] [added: Services](#tx265187_22)] | | | [removed: 63] [added: 62] | |
| Item 15. | | [Exhibits and Financial Statement [removed: Schedules](#tx120289_20)] [added: Schedules](#tx265187_24)] | | | [removed: 64] [added: 63] | |
10-K 1 d265187d10k.htm 10-K
Yes ☒ No ☐
Yes ☒ No ☐
Yes ☐ No ☒
10-K 1 d120289d10k.htm FORM 10-K
Item 2. PROPERTIES
11 rewritten, 1 added, 2 removed, 22 unchanged
We lease store locations, distribution and manufacturing facilities, corporate facilities and customer care centers for our U.S. and foreign operations for original terms [removed: ranging] generally [added: ranging] from [removed: 3] [added: 5] to 22 years.
For our store locations, our gross leased store [removed: space,] [added: space] as of January [removed: 31, 2016,] [added: 29, 2017] totaled approximately [removed: 6,163,000] [added: 6,359,000] square feet for [removed: 618] [added: 629] stores compared to approximately [removed: 5,965,000] [added: 6,163,000] square feet for [removed: 601] [added: 618] stores as of [removed: February 1, 2015.][added: January 31, 2016.]
The following table summarizes the location and size of our leased facilities occupied as of January [removed: 31, 2016:][added: 29, 2017:]
| Texas | | | [removed: 1,138,000] [added: 896,000] | |
| Other | | | [removed: 535,000] [added: 25,000] | |
| New York | | | [removed: 134,000] [added: 264,000] | |
| Oregon | | | [removed: 41,000] [added: 71,000] | |
| Other | | | [removed: 24,000] [added: 573,000] | |
In addition to the above contracts, we enter into other agreements for offsite storage needs for our distribution facilities and our retail store [removed: locations.][added: locations, as necessary.]
As of January [removed: 31, 2016,] [added: 29, 2017,] the total leased space relating to these properties was not material to us and is not included in the occupied square footage reported above.
As of January [removed: 31, 2016] [added: 29, 2017] we owned 471,000 square feet of [removed: space] [added: space,] primarily in [removed: California] [added: California,] for our corporate headquarters and certain data center operations.
| Georgia | | | 1,075,000 | |
In January 2016, we entered into a 10 year agreement to lease 1,075,000 square feet of distribution facility space in Braselton, Georgia, which we will begin occupying in fiscal 2016.
This square footage is not included in the table above.
Item 5. MARKET FOR REGISTRANT’S COMMON EQUITY, RELATED STOCKHOLDER MATTERS AND ISSUER PURCHASES OF EQUITY SECURITIES
10 rewritten, 16 added, 17 removed, 37 unchanged
| Fiscal [removed: 2014] [added: 2016] | | | | High | | | | Low | | |
The closing price of our common stock on the NYSE on March [removed: 27, 2016] [added: 26, 2017] was [removed: $54.22.][added: $47.96.]
The number of stockholders of record of our common stock as of March [removed: 27, 2016] [added: 26, 2017] was [removed: 370.][added: 358.]
[removed: 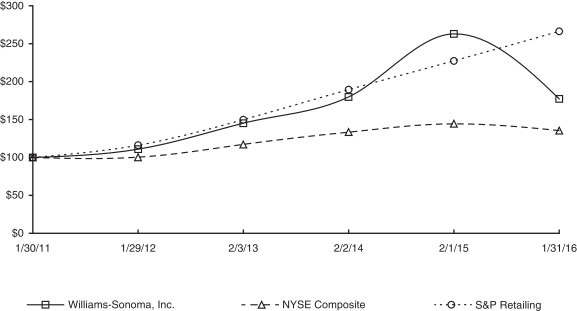][added: 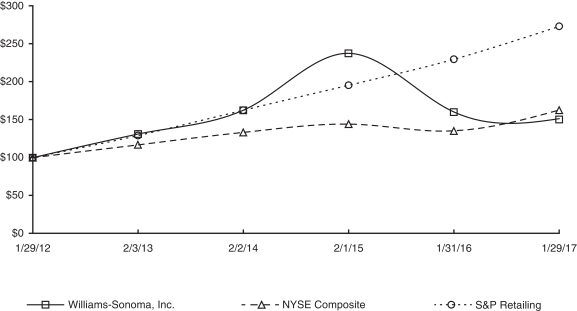]
In fiscal [removed: 2015,] [added: 2016,] fiscal [removed: 2014] [added: 2015] and fiscal [removed: 2013,] [added: 2014,] total cash dividends declared were approximately [removed: $130,290,000,] [added: $133,588,000,] or [removed: $1.40] [added: $1.48] per common share, [removed: $125,378,000,] [added: $130,290,000,] or [removed: $1.32] [added: $1.40] per common share, and [removed: $121,688,000,] [added: $125,378,000,] or [removed: $1.24] [added: $1.32] per common share, respectively.
In March [removed: 2016,] [added: 2017,] we announced that our Board of Directors had authorized a [removed: 6%] [added: 5%] increase in our quarterly cash dividend, from [removed: $0.35 to] $0.37 [added: to $0.39] per common share, subject to capital availability.
During fiscal [removed: 2013,] [added: 2016,] we repurchased [removed: 4,344,962] [added: 2,871,480] shares of our common stock at an average cost of [removed: $55.07] [added: $52.68] per share and a total cost of [removed: $239,274,000.][added: $151,272,000.]
The following table summarizes our repurchases of shares of our common stock during the fourth quarter of fiscal [removed: 2015] [added: 2016] under our [removed: $750,000,000] [added: $500,000,000] stock repurchase program:
Stock repurchases under [removed: the programs] [added: our program] may be made through open market and privately negotiated transactions at times and in such amounts as management deems appropriate.
[removed: These] [added: The] stock repurchase [removed: programs do] [added: program does] not have an expiration date and may be limited or terminated at any time without prior notice.
| 4th Quarter | | | | | $56.94 | | | | $45.98 | |
| 3rd Quarter | | | | | $57.40 | | | | $45.96 | |
| 2nd Quarter | | | | | $61.03 | | | | $47.66 | |
| 1st Quarter | | | | | $61.97 | | | | $49.39 | |
| 4th Quarter | | | | | $75.90 | | | | $47.33 | |
| 3rd Quarter | | | | | $89.38 | | | | $71.03 | |
| 2nd Quarter | | | | | $85.37 | | | | $74.75 | |
| 1st Quarter | | | | | $84.75 | | | | $73.14 | |
| | | 1/29/12 | | 2/3/13 | | 2/2/14 | | 2/1/15 | | 1/31/16 | | 1/29/17 |
| Williams-Sonoma, Inc. | | 100.00 | | 131.04 | | 162.36 | | 237.56 | | 160.06 | | 151.39 |
| NYSE Composite Index | | 100.00 | | 116.94 | | 133.26 | | 144.28 | | 135.18 | | 162.58 |
| S&P Retailing Index | | 100.00 | | 129.17 | | 162.55 | | 195.46 | | 229.73 | | 273.22 |
| October 31, 2016 | | – November 27, 2016 | | | 179,052 | | | | $ 49.33 | | | | 179,052 | | | | $ 437,851,000 | |
| November 28, 2016 | | – December 25, 2016 | | | 256,723 | | | | $ 54.46 | | | | 256,723 | | | | $ 423,871,000 | |
| December 26, 2016 | | – January 29, 2017 | | | 271,232 | | | | $ 49.01 | | | | 271,232 | | | | $ 410,578,000 | |
| Total | | | | | 707,007 | | | | $ 51.07 | | | | 707,007 | | | | $ 410,578,000 | |
| 4th Quarter | | | | $ | 75.90 | | | $ | 47.33 | |
| 3rd Quarter | | | | $ | 89.38 | | | $ | 71.03 | |
| 2nd Quarter | | | | $ | 85.37 | | | $ | 74.75 | |
| 1st Quarter | | | | $ | 84.75 | | | $ | 73.14 | |
| 4th Quarter | | | | $ | 80.99 | | | $ | 64.17 | |
| 3rd Quarter | | | | $ | 75.69 | | | $ | 62.35 | |
| 2nd Quarter | | | | $ | 73.45 | | | $ | 60.47 | |
| 1st Quarter | | | | $ | 68.05 | | | $ | 52.46 | |
| | | 1/30/11 | | 1/29/12 | | 2/3/13 | | 2/2/14 | | 2/1/15 | | 1/31/16 |
| Williams-Sonoma, Inc. | | 100.00 | | 110.71 | | 145.07 | | 179.74 | | 262.99 | | 177.19 |
| NYSE Composite Index | | 100.00 | | 100.07 | | 117.03 | | 133.36 | | 144.38 | | 135.28 |
| S&P Retailing Index | | 100.00 | | 116.11 | | 149.64 | | 189.33 | | 227.25 | | 266.25 |
In addition, in March 2016, we announced that our Board of Directors had authorized a new stock repurchase program to purchase up to $500,000,000 of our common stock that we intend to execute over the next three years.
| November 2, 2015 | | – November 29, 2015 | | | 178,815 | | | $ | 66.73 | | | | 178,815 | | | | $ 78,416,000 | |
| November 30, 2015 | | – December 27, 2015 | | | 142,852 | | | $ | 61.46 | | | | 142,852 | | | | $ 69,637,000 | |
| December 28, 2015 | | – January 31, 2016 | | | 142,941 | | | $ | 54.47 | | | | 142,941 | | | | $ 61,850,000 | |
| Total | | | | | 464,608 | | | $ | 61.34 | | | | 464,608 | | | | $ 61,850,000 | |
Item 6. SELECTED FINANCIAL DATA
31 rewritten, 1 added, 0 removed, 14 unchanged
| _In thousands, except percentages, per share amounts and retail stores data_ | | Fiscal [removed: 2015] [added: 2016] (52 Weeks) | | | | Fiscal [removed: 2014] [added: 2015] (52 Weeks) | | | | Fiscal [removed: 2013] [added: 2014] (52 Weeks) | | | | Fiscal [removed: 2012 (53] [added: 2013 (52] Weeks) | | | | Fiscal [removed: 2011 (52] [added: 2012 (53] Weeks) | | |
| Net revenues | | $ | [removed: 4,976,090] [added: 5,083,812] | | | $ | [removed: 4,698,719] [added: 4,976,090] | | | $ | [removed: 4,387,889] [added: 4,698,719] | | | $ | [removed: 4,042,870] [added: 4,387,889] | | | $ | [removed: 3,720,895] [added: 4,042,870] | |
| Net revenue growth | | | [removed: 5.9%] [added: 2.2%] | | | | [removed: 7.1%] [added: 5.9%] | | | | [removed: 8.5%] [added: 7.1%] | | | | [removed: 8.7%] [added: 8.5%] | | | | [removed: 6.2%] [added: 8.7%] | |
| Comparable brand revenue growth_1_ | | | [removed: 3.7%] [added: 0.7%] | | | | [removed: 7.1%] [added: 3.7%] | | | | [removed: 8.8%] [added: 7.1%] | | | | [removed: 6.1%] [added: 8.8%] | | | | [removed: 7.3%] [added: 6.1%] | |
| Gross profit | | $ | [removed: 1,844,214] [added: 1,883,310] | | | $ | [removed: 1,800,504] [added: 1,844,214] | | | $ | [removed: 1,704,216] [added: 1,800,504] | | | $ | [removed: 1,592,476] [added: 1,704,216] | | | $ | [removed: 1,459,856] [added: 1,592,476] | |
| Gross margin | | | [removed: 37.1%] [added: 37.0%] | | | | [removed: 38.3%] [added: 37.1%] | | | | [removed: 38.8%] [added: 38.3%] | | | | [removed: 39.4%] [added: 38.8%] | | | | [removed: 39.2%] [added: 39.4%] | |
| Operating income | | $ | [removed: 488,634] [added: 472,599] | | | $ | [removed: 502,265] [added: 488,634] | | | $ | [removed: 452,098] [added: 502,265] | | | $ | [removed: 409,163] [added: 452,098] | | | $ | [removed: 381,732] [added: 409,163] | |
| Operating margin_2_ | | | [removed: 9.8%] [added: 9.3%] | | | | [removed: 10.7%] [added: 9.8%] | | | | [removed: 10.3%] [added: 10.7%] | | | | [removed: 10.1%] [added: 10.3%] | | | | [removed: 10.3%] [added: 10.1%] | |
| Net earnings | | $ | [removed: 310,068] [added: 305,387] | | | $ | [removed: 308,854] [added: 310,068] | | | $ | [removed: 278,902] [added: 308,854] | | | $ | [removed: 256,730] [added: 278,902] | | | $ | [removed: 236,931] [added: 256,730] | |
| Basic earnings per share | | $ | [removed: 3.42] [added: 3.45] | | | $ | [removed: 3.30] [added: 3.42] | | | $ | [removed: 2.89] [added: 3.30] | | | $ | [removed: 2.59] [added: 2.89] | | | $ | [removed: 2.27] [added: 2.59] | |
| Diluted earnings per share | | $ | [removed: 3.37] [added: 3.41] | | | $ | [removed: 3.24] [added: 3.37] | | | $ | [removed: 2.82] [added: 3.24] | | | $ | [removed: 2.54] [added: 2.82] | | | $ | [removed: 2.22] [added: 2.54] | |
| Weighted average basic shares outstanding during the period | | | [removed: 90,787] [added: 88,594] | | | | [removed: 93,634] [added: 90,787] | | | | [removed: 96,669] [added: 93,634] | | | | [removed: 99,266] [added: 96,669] | | | | [removed: 104,352] [added: 99,266] | |
| Weighted average diluted shares outstanding during the period | | | [removed: 92,102] [added: 89,462] | | | | [removed: 95,200] [added: 92,102] | | | | [removed: 98,765] [added: 95,200] | | | | [removed: 101,051] [added: 98,765] | | | | [removed: 106,582] [added: 101,051] | |
| Working capital_3_ | | $ | [removed: 339,673] [added: 405,924] | | | $ | [removed: 515,975] [added: 339,673] | | | $ | [removed: 558,007] [added: 515,975] | | | $ | [removed: 659,645] [added: 558,007] | | | $ | [removed: 704,567] [added: 659,645] | |
| Total assets | | $ | [removed: 2,417,427] [added: 2,476,879] | | | $ | [removed: 2,330,277] [added: 2,417,427] | | | $ | [removed: 2,336,734] [added: 2,330,277] | | | $ | [removed: 2,187,679] [added: 2,336,734] | | | $ | [removed: 2,060,838] [added: 2,187,679] | |
| Return on assets | | | [removed: 13.1%] [added: 12.5%] | | | | [removed: 13.2%] [added: 13.1%] | | | | [removed: 12.3%] [added: 13.2%] | | | | [removed: 12.0%] [added: 12.3%] | | | | [removed: 11.3%] [added: 12.0%] | |
| Net cash provided by operating activities | | $ | [removed: 544,026] [added: 524,709] | | | $ | [removed: 461,697] [added: 544,026] | | | $ | [removed: 453,769] [added: 461,697] | | | $ | [removed: 364,127] [added: 453,769] | | | $ | [removed: 291,334] [added: 364,127] | |
| Capital expenditures | | $ | [removed: 202,935] [added: 197,414] | | | $ | [removed: 204,800] [added: 202,935] | | | $ | [removed: 193,953] [added: 204,800] | | | $ | [removed: 205,404] [added: 193,953] | | | $ | [removed: 130,353] [added: 205,404] | |
| Long-term debt and other long-term obligations | | $ | [removed: 49,713] [added: 71,215] | | | $ | [removed: 62,698] [added: 49,713] | | | $ | [removed: 61,780] [added: 62,698] | | | $ | [removed: 50,216] [added: 61,780] | | | $ | [removed: 52,015] [added: 50,216] | |
| Stockholders’ equity | | $ | [removed: 1,198,226] [added: 1,248,220] | | | $ | [removed: 1,224,706] [added: 1,198,226] | | | $ | [removed: 1,256,002] [added: 1,224,706] | | | $ | [removed: 1,309,138] [added: 1,256,002] | | | $ | [removed: 1,255,262] [added: 1,309,138] | |
| Stockholders’ equity per share (book value) | | $ | [removed: 13.38] [added: 14.29] | | | $ | [removed: 13.33] [added: 13.38] | | | $ | [removed: 13.35] [added: 13.33] | | | $ | [removed: 13.39] [added: 13.35] | | | $ | [removed: 12.50] [added: 13.39] | |
| Return on equity | | | [removed: 25.6%] [added: 25.0%] | | | | [removed: 24.9%] [added: 25.6%] | | | | [removed: 21.7%] [added: 24.9%] | | | | [removed: 20.0%] [added: 21.7%] | | | | [removed: 18.8%] [added: 20.0%] | |
| Annual dividends declared per share | | $ | [removed: 1.40] [added: 1.48] | | | $ | [removed: 1.32] [added: 1.40] | | | $ | [removed: 1.24] [added: 1.32] | | | $ | [removed: 0.88] [added: 1.24] | | | $ | [removed: 0.73] [added: 0.88] | |
| E-commerce net revenue growth | | | [removed: 6.4%] [added: 4.4%] | | | | [removed: 12.1%] [added: 6.4%] | | | | [removed: 13.1%] [added: 12.1%] | | | | [removed: 14.5%] [added: 13.1%] | | | | [removed: 12.4%] [added: 14.5%] | |
| E-commerce net revenues as a percent of net revenues | | | [removed: 50.7%] [added: 51.8%] | | | | [removed: 50.5%] [added: 50.7%] | | | | [removed: 48.2%] [added: 50.5%] | | | | [removed: 46.2%] [added: 48.2%] | | | | [removed: 43.9%] [added: 46.2%] | |
| Retail net revenue growth [added: (decline)] | | | [removed: 5.4%] [added: (0.1%] | [added: )] | | | [removed: 2.4%] [added: 5.4%] | | | | [removed: 4.6%] [added: 2.4%] | | | | [removed: 4.1%] [added: 4.6%] | | | | [removed: 1.8%] [added: 4.1%] | |
| Retail net revenues as a percent of net revenues | | | [removed: 49.3%] [added: 48.2%] | | | | [removed: 49.5%] [added: 49.3%] | | | | [removed: 51.8%] [added: 49.5%] | | | | [removed: 53.8%] [added: 51.8%] | | | | [removed: 56.1%] [added: 53.8%] | |
| Number of stores at year-end | | | [removed: 618] [added: 629] | | | | [removed: 601] [added: 618] | | | | [removed: 585] [added: 601] | | | | [removed: 581] [added: 585] | | | | [removed: 576] [added: 581] | |
| Store selling square footage at year-end | | | [removed: 3,827,000] [added: 3,951,000] | | | | [removed: 3,684,000] [added: 3,827,000] | | | | [removed: 3,590,000] [added: 3,684,000] | | | | [removed: 3,548,000] [added: 3,590,000] | | | | [removed: 3,535,000] [added: 3,548,000] | |
| Store leased square footage at year-end | | | [removed: 6,163,000] [added: 6,359,000] | | | | [removed: 5,965,000] [added: 6,163,000] | | | | [removed: 5,838,000] [added: 5,965,000] | | | | [removed: 5,778,000] [added: 5,838,000] | | | | [removed: 5,743,000] [added: 5,778,000] | |
| _3_ | [removed: _Working capital for] [added: _In] fiscal [removed: 2015 may not be comparable to the prior years presented because of our adoption of] [added: 2015, we prospectively adopted] ASU 2015-17, Balance Sheet Classification of Deferred Taxes, [removed: which we adopted prospectively in fiscal 2015. See Notes A] and [removed: D to] [added: now present both deferred tax assets and deferred tax liabilities as noncurrent in] our Consolidated [removed: Financial Statements] [added: Balance Sheets. Prior balance sheets were not retrospectively adjusted and, as a result, working capital] for [removed: additional information._] [added: fiscal 2012, fiscal 2013 and fiscal 2014 may not be comparable to fiscal 2015 and fiscal 2016._] | |
| --- | --- |
Item 9A. CONTROLS AND PROCEDURES
4 rewritten, 0 added, 1 removed, 12 unchanged
As of January [removed: 31, 2016,] [added: 29, 2017,] an evaluation was performed by management, with the participation of our Chief Executive Officer (“CEO”) and our Chief Financial Officer (“CFO”), of the effectiveness of our disclosure controls and procedures.
Our management assessed the effectiveness of the company’s internal control over financial reporting as of January [removed: 31, 2016.][added: 29, 2017.]
[added: In making this assessment, we used the criteria set forth by the Committee of Sponsoring] Organizations of the Treadway Commission (COSO) in _Internal Control-Integrated Framework (2013)._ Based on our assessment using those criteria, our management concluded that, as of January [removed: 31, 2016,] [added: 29, 2017,] our internal control over financial reporting is effective.
Their audit report appears on pages [added: 58 and] 59 [removed: through 60] of this Annual Report on Form 10-K.
In making this assessment, we used the criteria set forth by the Committee of Sponsoring
Item 9B. OTHER INFORMATION
0 rewritten, 1 added, 13 removed, 3 unchanged
None.
On October 28, 2015, the Compensation Committee of the Board of Directors approved the amendment and restatement of the 2012 EVP Level Management Retention Plan (the “EVP Retention Plan”), effective November 16, 2015 (the “Effective Date”).
The amended and restated EVP Retention Plan extends the term of the plan through November 15, 2018 and provides for substantially the same severance benefits as the prior EVP Retention Plan.
The EVP Retention Plan applies to executives at the Executive Vice President level and above, other than to the Company’s President and Chief Executive Officer, who is covered under an individual agreement.
The Compensation Committee may, in its discretion, allow an employee below the level of Executive Vice President to participate.
The amended and restated EVP Retention Plan provides for “double trigger” severance benefits.
If within 18 months following a Change of Control, the participant’s employment with the Company is terminated involuntarily by the Company without Cause, or voluntarily by the participant for Good Reason, as such terms are defined in the EVP Retention Plan, a participant would be entitled to receive the following:
| | • | | 200% of the participant’s annual base salary as in effect immediately prior to the Change of Control, or the participant’s termination, whichever is greater, to be paid over 24 months; |
| --- | --- | --- | --- |
| | • | | 200% of the participant’s average annual bonus received in the last 36 months, to be paid over 24 months; |
| | • | | 100% vesting of the participant’s outstanding equity awards with service-based vesting, or performance-based vesting with a fixed or zero payout, and a pro-rata portion of the participant’s outstanding equity awards with variable performance-based vesting will immediately become fully vested at the target performance level; and |
| | • | | in lieu of continued employment benefits (other than as required by law), payments of $3,000 per month for 12 months. |
The participant’s receipt of the severance benefits discussed above is contingent on the participant signing, and not revoking, a release of claims against the Company and the participant’s continued compliance with certain post-termination obligations in favor of the Company.
In the event that the severance payments and other benefits payable to the participant under the EVP Retention Plan would be subject to IRS Code Section 280G “parachute payment” excise taxes, then the participant’s severance payments and other benefits will be either (i) delivered in full or (ii) delivered to a lesser extent such that no portion of the benefits are subject to the excise tax, whichever is greater on an after-tax basis.
Item 15. EXHIBITS AND FINANCIAL STATEMENT SCHEDULES
43 rewritten, 8 added, 6 removed, 169 unchanged
Consolidated Statements of Earnings for the fiscal years ended January [added: 29, 2017, January] 31, [removed: 2016,] [added: 2016 and] February 1, 2015 [removed: and February 2, 2014]
Consolidated Statements of Comprehensive Income for the fiscal years ended January [added: 29, 2017, January] 31, [removed: 2016,] [added: 2016 and] February 1, 2015 [removed: and February 2, 2014]
Consolidated Balance Sheets as of January [added: 29, 2017 and January] 31, 2016 [removed: and February 1, 2015]
Consolidated Statements of Stockholders’ Equity for the fiscal years ended January [added: 29, 2017, January] 31, [removed: 2016,] [added: 2016 and] February 1, 2015 [removed: and February 2, 2014]
Consolidated Statements of Cash Flows for the fiscal years ended January [added: 29, 2017, January] 31, [removed: 2016,] [added: 2016 and] February 1, 2015 [removed: and February 2, 2014]
| (a)(3) | Exhibits: See Exhibit Index on pages [removed: 66] [added: 65] through [removed: 70.] [added: 69.] |
| (b) | Exhibits: See Exhibit Index on pages [removed: 66] [added: 65] through [removed: 70.] [added: 69.] |
| Date: March [removed: 31, 2016] [added: 30, 2017] | | | | | | By | | /s/ LAURA J. ALBER |
| Date: March [removed: 31, 2016] [added: 30, 2017] | | /s/ ADRIAN D.P. BELLAMY |
| Date: March [removed: 31, 2016] [added: 30, 2017] | | /s/ LAURA J. ALBER |
| Date: March [removed: 31, 2016] [added: 30, 2017] | | /s/ JULIE P. WHALEN |
| Date: March [removed: 31, 2016] [added: 30, 2017] | | /s/ ROSE MARIE BRAVO |
| Date: March [removed: 31, 2016] [added: 30, 2017] | | /s/ ADRIAN T. DILLON |
| Date: March [removed: 31, 2016] [added: 30, 2017] | | /s/ ANTHONY A. GREENER |
| Date: March [removed: 31, 2016] [added: 30, 2017] | | /s/ TED W. HALL |
| Date: March [removed: 31, 2016] [added: 30, 2017] | | /s/ SABRINA SIMMONS |
| Date: March [removed: 31, 2016] [added: 30, 2017] | | /s/ JERRY D. STRITZKE |
FISCAL YEAR ENDED JANUARY [removed: 31, 2016][added: 29, 2017]
| [removed: 10.5] [added: 10.6] | | Reimbursement Agreement between the Company, Williams-Sonoma Singapore Pte. Ltd. and Wells Fargo Bank, N.A., dated as of August 30, 2013 (incorporated by reference to Exhibit 10.2 to the Company’s Quarterly Report on Form 10-Q for the period ended November 3, 2013 as filed with the Commission on December 12, 2013, File No. 001-14077) |
| [removed: 10.6] [added: 10.7] | | First Amendment to Reimbursement Agreement between the Company, Williams-Sonoma Singapore Pte. Ltd. and Wells Fargo Bank, N.A., dated as of August 29, 2014 (incorporated by reference to Exhibit 10.2 to the Company’s Quarterly Report on Form 10-Q for the period ended November 2, 2014 as filed with the Commission on December 5, 2014, File No. 001-14077) |
| [removed: 10.7] [added: 10.8] | | Second Amendment to Reimbursement Agreement between the Company, Williams-Sonoma Singapore Pte. Ltd. and Wells Fargo Bank, N.A., dated as of August 28, 2015 (incorporated by reference to Exhibit 10.2 to the Company’s Quarterly Report on Form 10-Q for the period ended November 1, 2015 as filed with the Commission on December 11, 2015, File No. 001-14077) |
| [removed: 10.8] [added: 10.10] | | Reimbursement Agreement between the Company, Williams-Sonoma Singapore Pte. Ltd. and U.S. Bank National Association, dated as of August 30, 2013 (incorporated by reference to Exhibit 10.3 to the Company’s Quarterly Report on Form 10-Q for the fiscal quarter ended November 3, 2013 as filed with the Commission on December 12, 2013, File No. 001-14077) |
| [removed: 10.9] [added: 10.11] | | First Amendment to Reimbursement Agreement between the Company, Williams-Sonoma Singapore Pte. Ltd. and U.S. Bank National Association, dated as of August 29, 2014 (incorporated by reference to Exhibit 10.3 to the Company’s Quarterly Report on Form 10-Q for the fiscal quarter ended November 2, 2014 as filed with the Commission on December 5, 2014, File No. 001-14077) |
| [removed: 10.10] [added: 10.12] | | Second Amendment to Reimbursement Agreement between the Company, Williams-Sonoma Singapore Pte. Ltd. and U.S. Bank National Association, dated as of August 28, 2015 (incorporated by reference to Exhibit 10.3 to the Company’s Quarterly Report on Form 10-Q for the period ended November 1, 2015 as filed with the Commission on December 11, 2015, File No. 001-14077) |
| [removed: 10.11+] [added: 10.14+] | | Williams-Sonoma, Inc. 2000 Nonqualified Stock Option Plan (incorporated by reference to Exhibit 4 to the Company’s Registration Statement on Form S-8 as filed with the Commission on October 27, 2000, File No. 333-48750) |
| [removed: 10.12+] [added: 10.15+] | | Williams-Sonoma, Inc. 2001 Long-Term Incentive Plan, as amended (incorporated by reference to Exhibit D to the Company’s definitive proxy statement on Schedule A as filed on April 7, 2011, File No. 001-14077) |
| [removed: 10.13+] [added: 10.16+] | | Forms of Notice of Grant and Stock Option Agreement under the Company’s 2000 Nonqualified Stock Option Plan and 2001 Long-Term Incentive Plan (incorporated by reference to Exhibit 10.2 to the Company’s Quarterly Report on Form 10-Q for the period ended October 31, 2004 as filed with the Commission on December 10, 2004, File No. 001-14077) |
| [removed: 10.14+] [added: 10.17+] | | Form of Williams-Sonoma, Inc. 2001 Long-Term Incentive Plan Stock-Settled Stock Appreciation Right Award Agreement for Director Grants (incorporated by reference to Exhibit 10.31 to the Company’s Annual Report on Form 10-K for the fiscal year ended February 3, 2008 as filed with the Commission on April 3, 2008, File No. 001-14077) |
| [removed: 10.15+] [added: 10.18+] | | Form of Williams-Sonoma, Inc. 2001 Long-Term Incentive Plan Stock-Settled Stock Appreciation Right Award Agreement for Employee Grants (incorporated by reference to Exhibit 10.2 to the Company’s Current Report on Form 8-K filed with the Commission on March 22, 2010, File No. 001-14077) |
| [removed: 10.16+] [added: 10.19+] | | Williams-Sonoma, Inc. 2001 Long-Term Incentive Plan Stock-Settled Stock Appreciation Right Award Agreement for CEO Grant (incorporated by reference to Exhibit 10.38 to the Company’s Annual Report on Form 10-K for the fiscal year ended February 1, 2009 as filed with the Commission on April 2, 2009, File No. 001-14077) |
| [removed: 10.17+] [added: 10.20+] | | Form of Williams-Sonoma, Inc. 2001 Long-Term Incentive Plan Restricted Stock Unit Award Agreement for Grants to Non-Employee Directors (incorporated by reference to Exhibit 10.1 to the Company’s Quarterly Report on Form 10-Q for the period ended May 4, 2014 as filed with the Commission on June 12, 2014, File No. 001-14077) |
| [removed: 10.18+] [added: 10.21+] | | Form of Williams-Sonoma, Inc. 2001 Long-Term Incentive Plan Restricted Stock Unit Award Agreement for Grants to Employees (incorporated by reference to Exhibit 10.2 to the Company’s Quarterly Report on Form 10-Q for the period ended May 4, 2014 as filed with the Commission on June 12, 2014, File No. 001-14077) |
| [removed: 10.19+] [added: 10.22+] | | Form of Williams-Sonoma, Inc. 2001 Long Term Incentive Plan Performance Stock Unit Award Agreement for Grants to Employees (incorporated by reference to Exhibit 10.15 to the Company’s Annual Report on Form 10-K for the fiscal year ended February 2, 2014 as filed with the Commission on April 3, 2014, File No. 001-14077) |
| [removed: 10.20+] [added: 10.23+] | | Williams-Sonoma, Inc. 2001 Incentive Bonus Plan, as amended (incorporated by reference to the Company’s Definitive Proxy Statement on Schedule 14A as filed with the Commission on April 6, 2012, File No. 001-14077) |
| [removed: 10.21+] [added: 10.24+] | | Williams-Sonoma, Inc. Pre-2005 Executive Deferral Plan (incorporated by reference to Exhibit 10.40 to the Company’s Annual Report on Form 10-K for the fiscal year ended February 1, 2009 as filed with the Commission on April 2, 2009, File No. 001-14077) |
| [removed: 10.22+] [added: 10.25+] | | Williams-Sonoma, Inc. Amended and Restated Executive Deferred Compensation Plan (incorporated by reference to Exhibit 10.19 to the Company’s Annual Report on Form 10-K for the fiscal year ended February 1, 2015 as filed with the Commission on April 2, 2015, File No. 001-14077) |
| [removed: 10.24] [added: 10.27] | | Memorandum of Understanding between the Company and the State of Mississippi, Mississippi Business Finance Corporation, Desoto County, Mississippi, the City of Olive Branch, Mississippi and Hewson Properties, Inc., dated August 24, 1998 (incorporated by reference to Exhibit 10.6 to the Company’s Quarterly Report on Form 10-Q for the period ended August 2, 1998 as filed with the Commission on September 14, 1998, File No. 001-14077) |
| [removed: 10.25] [added: 10.28] | | Olive Branch Distribution Facility Lease, dated December 1, 1998, between the Company as lessee and WSDC, LLC (the successor-in-interest to Hewson/Desoto Phase I, L.L.C.) as lessor (incorporated by reference to Exhibit 10.3D to the Company’s Annual Report on Form 10-K for the fiscal year ended January 31, 1999 as filed with the Commission on April 30, 1999, File No. 001-14077) |
| [removed: 10.26] [added: 10.29] | | First Amendment, dated September 1, 1999, to the Olive Branch Distribution Facility Lease between the Company as lessee and WSDC, LLC (the successor-in-interest to Hewson/Desoto Phase I, L.L.C.) as lessor, dated December 1, 1998 (incorporated by reference to Exhibit 10.3B to the Company’s Annual Report on Form 10-K for the fiscal year ended January 30, 2000 as filed with the Commission on May 1, 2000, File No. 001-14077) |
| [removed: 10.27] [added: 10.30] | | Lease for an additional Company distribution facility located in Olive Branch, Mississippi between Williams-Sonoma Retail Services, Inc. as lessee and SPI WS II, LLC (the successor-in-interest to Hewson/Desoto Partners, L.L.C.) as lessor, dated November 15, 1999 (incorporated by reference to Exhibit 10.14 to the Company’s Annual Report on Form 10-K for the fiscal year ended January 30, 2000 as filed with the Commission on May 1, 2000, File No. 001-14077) |
| Date: March 30, 2017 | | |
| 10.5 | | Third Amendment to Reimbursement Agreement between the Company, Williams-Sonoma Singapore Pte. Ltd., and Bank of America, N.A., dated as of August 26, 2016 (incorporated by reference to Exhibit 10.1 to the Company’s Quarterly Report on Form 10-Q for the period ended October 30, 2016 as filed with the Commission on December 7, 2016, File No. 001-14077) |
| 10.9 | | Third Amendment to Reimbursement Agreement between the Company, Williams-Sonoma Singapore Pte. Ltd., and Wells Fargo Bank, N.A., dated as of August 26, 2016 (incorporated by reference to Exhibit 10.2 to the Company’s Quarterly Report on Form 10-Q for the period ended October 30, 2016 as filed with the Commission on December 7, 2016, File No. 001-14077) |
| 10.13 | | Third Amendment to Reimbursement Agreement between the Company, Williams-Sonoma Singapore Pte. Ltd., and U.S. Bank National Association, dated as of August 26, 2016 (incorporated by reference to Exhibit 10.3 to the Company’s Quarterly Report on Form 10-Q for the period ended October 30, 2016 as filed with the Commission on December 7, 2016, File No. 001-14077) |
| 10.26+ | | Williams-Sonoma, Inc. 401(k) Plan, as amended and restated effective January 1, 2016 (incorporated by reference to Exhibit 10.23 to the Company’s Annual Report on Form 10-K for the fiscal year ended January 31, 2016 as filed with the Commission on March 31, 2016, File No. 001-14077) |
| 10.33+ | | Amended and Restated 2012 EVP Level Management Retention Plan (incorporated by reference to Exhibit 10.30 to the Company’s Annual Report on Form 10-K for the fiscal year ended January 31, 2016 as filed with the Commission on March 31, 2016, File No. 001-14077) |
| | | |
| | | |
| | | Director |
| Date: March 31, 2016 | | /s/ PATRICK J. CONNOLLY |
| | | Patrick J. Connolly |
| Date: March 31, 2016 | | /s/ LORRAINE TWOHILL |
| 10.23+* | | Williams-Sonoma, Inc. 401(k) Plan, as amended and restated effective January 1, 2016 |
| 10.30+* | | Amended and Restated 2012 EVP Level Management Retention Plan |
An excerpt. Shown here: 40 of 43 rewritten, all 8 added and all 6 removed. The counts are complete. For every sentence, read Item 15. EXHIBITS AND FINANCIAL STATEMENT SCHEDULES in the FY2017 filing and the FY2016 filing.