 filings.tools
Williams-Sonoma (WSM) 10-K risk factor changes: FY2019 vs FY2019
The 2020-02-02 10-K against the 2019-02-03 one, compared heading by heading and sentence by sentence. One of these filings carries no fiscal year tag, so its year is the calendar year of the period end.
Item 1A160 rewritten244 added18 removed244 unchanged
All filing items970 rewritten1,153 added378 removed848 unchanged
Summary
counted, not written
- Item 1A headings could not be compared: only 0 carried over between the two years, which usually means one filing was read wrongly, so none is reported as new or removed.
- Sentence by sentence, 1,153 added, 378 removed, 970 rewritten and 848 unchanged across 17 items that differ.
- Not in this year's filing: Item 1B. UNRESOLVED STAFF COMMENTS.
Sentences by item
22 items, with every count and a link to each item that changed
Underlined words on a shaded ground are new in FY2019; struck-through words were in FY2019. Sentences that are wholly new or wholly gone are labelled rather than marked.
Item 1A. RISK FACTORS
160 rewritten, 244 added, 18 removed, 244 unchanged
[removed: _Declines] [added: Declines] in general economic conditions, and the resulting impact on consumer confidence and consumer spending, could adversely impact our results of [removed: operations._][added: operations.]
[removed: _We] [added: We] are unable to control many of the factors affecting consumer spending, and declines in consumer spending on home furnishings and kitchen products in general could reduce demand for our [removed: products._][added: products.]
[removed: Our business depends on consumer demand for our products and, consequently, is sensitive to a number of factors that influence consumer spending, including general economic conditions, consumer disposable income, fuel prices, recession and fears of recession, unemployment, war and fears of war, inclement] [added: outbreak), adverse] weather, availability of consumer credit, consumer debt levels, conditions in the housing market, interest rates, sales tax rates and rate increases, inflation, consumer confidence in future economic and political conditions, and consumer perceptions of personal well-being and security.
[removed: _If] [added: If] we are unable to identify and analyze factors affecting our business, anticipate changing consumer preferences and buying trends, and manage our inventory commensurate with customer demand, our sales levels and operating results may [removed: decline._][added: decline.]
Our vendors also may not have the capacity to handle our demands or may go out of business [added: or have other delays] in [added: production in] times of economic crisis.
[removed: There is also increased focus, including by governmental and non-governmental] organizations, investors, customers, consumers and other stakeholders, on [added: corporate social responsibility and] sustainability matters.
Our reputation could be damaged if we do not (or are perceived not to) act responsibly with respect to any [added: social or] sustainability matters, which could negatively impact our business and results of operations.
[removed: _We] [added: We] may be exposed to cybersecurity risks and costs associated with credit card fraud, identity theft and business interruption that could cause us to incur unexpected expenses and loss of [removed: revenue._][added: revenue.]
A significant portion of our customer orders are placed through our [removed: e-commerce websites or through our customer care centers.]
In addition, a significant portion of sales made through our retail channel require the [removed: collection of certain customer data, such as credit card information.]
Any security breach could cause consumers to lose confidence in the security of our information systems, including our [removed: e-commerce websites or stores, and choose not to purchase from us.]
[added: Any] security breach could also expose us to risks of data loss, litigation, regulatory investigations and other significant liabilities.
As our business expands globally, we are subject to data privacy and other similar laws in various foreign jurisdictions, such as [added: GDPR in] the European Union.
If we fail to implement appropriate safeguards, detect and provide prompt notice of unauthorized access as required by some [removed: of these] [added: data privacy] laws, or otherwise comply with these laws, we could be subject to potential fines, claims for damages and other remedies, which could be significantly in excess of our insurance coverage and could harm our business.
[removed: _If we are unable to effectively manage our e-commerce] business and digital marketing efforts, our reputation and operating results may be [removed: harmed._][added: harmed.]
[removed: Our e-commerce] channel has been our fastest growing business over the last several years and represents more than half of our sales and profits.
[removed: The success of our e-commerce] business depends, in part, on third parties and factors over which we have limited control.
We must continually respond to changing consumer preferences and buying trends relating to [removed: e-commerce usage, including an emphasis on mobile e-commerce.]
[removed: Our success in e-commerce] has been strengthened in part by our ability to leverage the information we have on our customers to infer customer interests and affinities such that we can personalize the experience they have with us.
[removed: We are also vulnerable to certain additional risks] and [removed: uncertainties associated with our e-commerce and] mobile websites and digital marketing efforts, including: changes in required technology interfaces; website downtime and other technical failures; internet connectivity issues; costs and technical issues as we upgrade our website software; computer viruses; vendor reliability; changes in applicable federal and state regulations, such as the CCPA, and related compliance costs; security breaches; and consumer privacy concerns.
We must keep up to date with competitive technology trends and opportunities that are emerging throughout the retail environment, including the use of new or improved technology, evolving creative user interfaces, and other [removed: e-commerce marketing trends such as paid search, re-targeting, loyalty programs and the proliferation of mobile usage, among others.]
While we endeavor to predict and invest in technology that is most relevant and beneficial to our company, such as our [removed: recent] acquisition of Outward, [removed: Inc.,] [added: Inc. in 2017,] our initiatives may not prove to be successful, may increase our costs, or may not succeed in driving sales or attracting customers.
Our failure to successfully respond to these risks and uncertainties might adversely affect the sales or margin in our [removed: e-commerce business, require us to impair certain assets, and damage our reputation and brands.]
[removed: _Our] [added: Our] dependence on foreign vendors and our increased global operations subject us to a variety of risks and uncertainties that could impact our operations and financial [removed: results._][added: results.]
Approximately [removed: 66%] [added: 65%] of our merchandise purchases in fiscal [removed: 2018] [added: 2019] were sourced from foreign vendors predominantly in Asia and Europe.
This, in turn, might cause such foreign vendors to demand higher prices for merchandise in their effort to offset any lost profits associated with any currency devaluation, delay merchandise [added: shipments to us, or discontinue selling to us, any of which could ultimately reduce our sales or increase our costs.]
We, and our foreign vendors, are also subject to other risks and uncertainties associated with changing [removed: economic] [added: economic, political, social, health] and [removed: political] [added: environmental] conditions [added: and regulations] within and outside of the U.S. These risks and uncertainties include import duties and quotas, compliance with anti-dumping regulations, work stoppages, economic uncertainties and adverse economic conditions (including inflation and recession), government [removed: regulations, employment and labor matters, wars and fears of war, political unrest, natural disasters, public health issues, regulations to address climate change and other trade restrictions.]
We cannot predict whether any of the countries from which our raw materials or products are sourced, or in which our products are currently manufactured or may be manufactured in the future, will be subject to trade restrictions imposed by the U.S. or foreign governments, such as the tariffs [removed: recently] levied by the U.S. against China, or the likelihood, type or effect of any such restrictions.
Any event causing a disruption or delay of imports from foreign vendors, including labor disputes resulting in work [removed: disruption (such as the disruptions at the U.S. West Coast ports in early 2015),] [added: disruption,] the imposition of additional import restrictions, restrictions on the transfer of funds and/or increased tariffs or quotas, [added: war, political unrest, acts of terrorism, natural disasters, adverse weather, climate change, outbreaks of disease] or [removed: both,] [added: other unexpected events,] could increase the cost, reduce the supply of merchandise available to us, or result in excess inventory if merchandise is received after the planned or appropriate selling season, all of which could adversely affect our business, financial condition and operating results.
Furthermore, some or all of our foreign vendors’ operations may be adversely affected by political and financial instability resulting in the disruption of trade from exporting countries, restrictions on the transfer of funds and/or [added: increased tariffs or quotas, war, political unrest, acts of terrorism, natural disasters, adverse weather, climate change, outbreaks of disease or] other trade disruptions.
Our global operations in Asia, Australia and Europe could also be affected by changing economic and political conditions in foreign countries, such as [removed: the decision by British voters to exit the European Union,] [added: Brexit,] which could have a negative effect on our business, financial condition and operating results.
[removed: Non-governmental] organizations might attempt to create an unfavorable impression of our sourcing practices or the practices of some of our foreign vendors that could harm our image.
[removed: _We] [added: We] depend on foreign vendors and third-party agents for timely and effective sourcing of our merchandise, and we may not be able to acquire products in sufficient quantities and at acceptable prices to meet our needs, which would impact our operations and financial [removed: results._][added: results.]
Better than expected sales demand may also lead to customer backorders and lower [removed: in-stock positions of our merchandise, which could negatively affect our business and operating results.]
In addition, we are subject to certain risks that could limit our vendors’ ability to provide us with quality merchandise on a timely basis and at prices that are commercially [removed: acceptable,] [added: acceptable to us,] including risks related to the availability of raw materials, labor disputes, work disruptions or stoppages, union organizing activities, vendor financial liquidity, [removed: inclement] [added: adverse] weather, natural disasters, [removed: public health issues, general economic and] political [removed: conditions and regulations to address climate change.][added: unrest, war, acts of terrorism,]
[removed: _If] [added: If] our vendors fail to adhere to our quality control [removed: standards,] [added: standards and test protocols,] we may delay a product launch or recall a product, which could damage our reputation and negatively affect our operations and financial [removed: results._][added: results.]
[removed: _Our] [added: Our] efforts to expand globally may not be successful and could negatively impact the value of our [removed: brands._][added: brands.]
We are currently growing our business and increasing our global presence by opening new stores outside of the U.S., expanding our franchise [removed: operations,] and [removed: offering shipping globally through third-party vendors.]
[removed: In fiscal] [added: Since] 2013, [removed: we opened our first company-owned retail stores and launched e-commerce websites outside of North America] as part of our overall global expansion [removed: strategy.][added: strategy, we have operated company-owned retail stores and]
While our global expansion to date has been a small part of our business, we plan to continue to increase the number of stores we open both directly and through our franchise [removed: arrangements.][added: and]
The Coronavirus (or
COVID-19)
outbreak is expected to have a material impact on our results of operations, financial position and liquidity.
The outbreak of
COVID-19
continues to grow both in the U.S. and globally, and related government and private sector responsive actions are expected to adversely affect our business operations.
It is currently impossible to predict the effect and ultimate impact of the
COVID-19
pandemic as the situation is rapidly evolving.
In March 2020, the President of the United States declared a national emergency as a result of the
COVID-19
outbreak in the U.S. The pandemic has caused public health officials to recommend precautions to mitigate the spread of the virus, especially when congregating in heavily populated areas, such as malls and shopping centers.
In recent days, there have been mandates from federal, state and local authorities requiring reduction of operating hours and forced temporary closures of
non-essential
retailers and other businesses, which have adversely affected our stores, further negatively impacting our business.
As a result of these developments, to protect our employees, customers and the communities in which we operate, on March 17, 2020, we announced we will be temporarily closing all of our U.S. and Canadian retail stores until at least April 2, 2020 depending upon how the
COVID-19
outbreak evolves.
This is expected to adversely affect our operations, cash flows and liquidity, as our retail store revenues comprise approximately 44% of our net revenues.
Further, after containment of the virus or after some or all of our stores reopen, any significant reduction in consumer willingness to visit malls and shopping centers, levels of consumer spending at our stores, employee willingness to work in our stores, or the prolonged temporary closure of our retail stores or distribution centers, relating to the pandemic or its impact on the economy, consumer sentiment or health concerns, would result in a further loss of revenues, profits, cash flows, and other materially impactful effects on our business and operations.
In addition, we have implemented work-from-home policies for certain employees.
The effects of
shelter-in-place
orders and our work-from-home policies may negatively impact productivity and disrupt our business, the magnitude of which will depend, in part, on the length and severity of the restrictions and other limitations on our ability to conduct our business in the ordinary course.
Although we continue to sell products through our
e-commerce
sites and our distribution centers remain open and operational through the date of filing of this Annual Report, governmental mandates or illness or absence of a substantial number of distribution center employees could require that we temporarily close one or more of our distribution centers, or may prohibit or significantly limit us, or our third party logistics providers from delivering packages to our customers and our stores, which would complicate or prevent our fulfilling
e-commerce
orders and, once some or all of our stores reopen, would complicate or prevent our ability to supply merchandise to our stores.
Further, quarantines,
shelter-in-place
and similar government orders, like the statewide order issued in California, or the perception that such orders, shutdowns or other restrictions on the conduct of business operations could occur, related to
COVID-19
or other infectious diseases, could also impact our vendors who manufacture or
deliver our merchandise to us or our customers, which could adversely affect our ability to acquire and sell our merchandise, thus adversely affecting our results of operations, cash flows and liquidity.
While the extent of the economic impact of
COVID-19
and the duration of that impact may be difficult to assess or predict, the widespread pandemic has resulted in significant disruption of global financial markets, which has significantly impacted the value of our common stock and which may reduce our ability to access further capital, which could in the future negatively affect our liquidity.
In addition, a recession or long-term market correction, resulting from the spread of
COVID-19
##### [Table of Contents](#toc)
Any
In addition, states and the federal government are increasingly enacting laws and regulations to protect consumers against identity theft, and in the future we may be subject to state or federal data privacy laws, such as the California Consumer Privacy Act of 2018 (the “CCPA”) that will become effective in 2020.
In addition, compliance with these laws will likely increase the costs of doing business, especially if we face differing regulatory requirements across multiple jurisdictions and/or a lack of adequate regulatory guidance.
shipments to us, or discontinue selling to us, any of which could ultimately reduce our sales or increase our costs.
The effect of these franchise arrangements on our business and results of
| --- | --- | --- | --- |
We must
may not grow as expected.
There has been a rise in the number of lawsuits against companies like us that gather information in order to market to consumers online or through the mail and, along with other retailers, we have been named in lawsuits for gathering zip code information from our customers.
We believe that we have meritorious defenses against these actions, and we will continue to vigorously defend against them.
There have also been a growing number of consumer protection, data breach, and e-commerce-related patent infringement in recent years.
In addition, changes to any of our software
We provide public guidance on our expected operating and financial results for future periods.
Beginning in fiscal 2019, we have discontinued providing quarterly guidance and instead we will provide guidance on an annual basis only.
In March 2019, our Board of Directors authorized an increase in our stock repurchase program by an additional $500,000,000, as well as an increase in our quarterly cash dividend from $0.43 to $0.48 per common share for an annual cash dividend of $1.92 per share.
in the future.
to replace.
An excerpt. Shown here: 40 of 160 rewritten, 40 of 244 added and all 18 removed. The counts are complete. For every sentence, read Item 1A. RISK FACTORS in the FY2019 filing and the FY2019 filing.
Item 7. MANAGEMENT’S DISCUSSION AND ANALYSIS OF FINANCIAL CONDITION AND RESULTS OF OPERATIONS
131 rewritten, 176 added, 112 removed, 88 unchanged
The following discussion and analysis of our financial condition, results of operations, and liquidity and capital resources for the [removed: 53 weeks ended February 3, 2019 (“fiscal 2018”), the] 52 weeks ended [removed: January 28, 2018] [added: February 2, 2020] (“fiscal [removed: 2017”),] [added: 2019”),] and the [removed: 52] [added: 53] weeks ended [removed: January 29, 2017] [added: February 3, 2019] (“fiscal [removed: 2016”)] [added: 2018”)] should be read in conjunction with our Consolidated Financial Statements and notes thereto.
[removed: As fiscal 2018 is a 53-week] year [removed: as compared to a 52-week year in fiscal 2017, our discussion of fiscal 2018 results below] [added: and] includes approximately $85,000,000 of net revenues and $0.10 of diluted earnings per share associated with the additional week.
[removed: OVERVIEW][added: OVERVIEW]
All brands delivered positive comparable brand revenue growth in fiscal [removed: 2018.][added: 2019.]
Growth in Pottery Barn accelerated from last year, driven by strength in [removed: e-commerce and growth in new businesses: Marketplace and Pottery Barn Apartment, as well as strong upholstery growth.]
The Pottery Barn Kids and Teen business [removed: improved from last year, delivering] [added: delivered] combined comparable brand revenue growth of [removed: 2.8%.][added: 4.5% — its strongest performance in recent years.]
The Williams Sonoma brand delivered comparable brand revenue growth of [removed: 1.7%.][added: 0.4%.]
And, our emerging brands, Rejuvenation and Mark and Graham, [removed: continued to scale with double digit net] [added: combined delivered another year of double-digit] revenue growth [added: as they continue to scale] and [removed: increased profitability.][added: attract new customers.]
[removed: _Results] [added: Results] of [removed: Operations_][added: Operations]
[removed: NET REVENUES][added: NET REVENUES]
[removed: E-commerce net] [added: Net] revenues [removed: include] [added: consist of] sales of merchandise to [added: our] customers through our [removed: e-commerce websites and our catalogs, as well as shipping fees.]
[removed: Shipping] [added: websites, direct-mail catalogs, and at our retail stores and include shipping] fees [removed: consist of revenue] received from customers for delivery of merchandise to their homes.
| [removed: _In thousands_ | | Fiscal 2018 (53 Weeks) | | | | % Total | |] [added: In thousands] | | Fiscal [removed: 2017] [added: 2019] (52 Weeks) | | | | [removed: % Total | | | |] Fiscal [removed: 2016 (52] [added: 2018 (53] Weeks) | | | [removed: | % Total | | |]
Net revenues in fiscal [removed: 2017] [added: 2019] increased by [removed: $208,547,000] [added: $226,415,000] or [removed: 4.1%, compared to fiscal 2016,] [added: 4.0%,] with comparable brand revenue growth of [removed: 3.2%.][added: 6.0%.]
The following table summarizes our net revenues by brand for fiscal [removed: 2018, fiscal 2017] [added: 2019] and fiscal [removed: 2016:][added: 2018:]
| [removed: _In thousands_ | | Fiscal 2018 (53 Weeks) | |] [added: In thousands] | | Fiscal [removed: 2017] [added: 2019] (52 Weeks) | | | | Fiscal [removed: 2016 (52] [added: 2018 (53] Weeks) | | |
| Pottery Barn | | $ | [removed: 2,177,344 | | | $ | 2,066,302] [added: 2,214,397] | | | $ | [removed: 2,024,218] [added: 2,177,344] | |
| West Elm | | | [removed: 1,292,928 | | | | 1,114,339] [added: 1,466,537] | | | | [removed: 971,568] [added: 1,292,928] | |
| Williams Sonoma | | | [removed: 1,056,125 | | | | 1,022,434] [added: 1,032,368] | | | | [removed: 1,002,194] [added: 1,056,125] | |
| Pottery Barn Kids and [removed: Teen_1_ | | | 895,762 |] [added: Teen] | | | [removed: 860,468] [added: 908,561] | | | | [removed: 873,199] [added: 895,762] | |
| [removed: _2_] [added: 1] | [removed: _Primarily] [added: Primarily] consists of net revenues from our international franchise operations, Rejuvenation and Mark and [removed: Graham._] [added: Graham.] | [added: |]
[removed: _Comparable] [added: Comparable] Brand [removed: Revenue_][added: Revenue]
[removed: Comparable brand revenue includes retail comparable store sales and e-commerce] sales, [added: including through our direct-mail catalog,] as well as shipping fees, sales returns and other discounts associated with current period sales.
[added: Comparable stores are defined as] permanent stores where gross square footage did not change by more than 20% in the previous 12 months and which have been open for at least 12 consecutive months without closure for seven or more consecutive days.
Sales to our international franchisees are excluded from comparable brand revenue as their stores and [removed: e-commerce websites are not operated by us.]
| [removed: _Comparable] [added: Comparable] brand revenue growth [removed: (decline)1_ | | Fiscal 2018 (53 Weeks) | |] [added: 1] | | Fiscal [removed: 2017] [added: 2019] (52 Weeks) | | | | Fiscal [removed: 2016 (52] [added: 2018 (53] Weeks) | | |
| Pottery Barn | | | [removed: 1.2% | | | | 1.0%] [added: 4.1%] | | | | [removed: (3.5%] [added: 1.2%] | [removed: )] |
| West Elm | | | [removed: 9.5% | | | | 10.2%] [added: 14.4%] | | | | [removed: 12.8%] [added: 9.5%] | |
| Williams Sonoma | | | [removed: 1.7% | | | | 3.2%] [added: 0.4%] | | | | [removed: 1.3%] [added: 1.7%] | |
| Pottery Barn Kids and Teen | | | [removed: 2.8% | | | | (1.7%] [added: 4.5%] | [removed: )] | | | [removed: (2.8%] [added: 2.8%] | [removed: )] |
| [removed: Total_2_ | | | 3.7% |] [added: Total 2] | | | [removed: 3.2%] [added: 6.0%] | | | | [removed: 0.7%] [added: 3.7%] | |
| [removed: _1_] [added: 1] | [removed: _Comparable] [added: Comparable] brand revenue is calculated on a [removed: 53-week] [added: 52-week] to [removed: 53-week] [added: 52-week] basis for fiscal [removed: 2018] [added: 2019] and on a [removed: 52-week] [added: 53-week] to [removed: 52-week] [added: 53-week] basis for fiscal [removed: 2017 and fiscal 2016._] [added: 2018 .] | [added: |]
| [removed: _2_] [added: 2] | [removed: _Total] [added: Total] comparable brand revenue growth includes the results of Rejuvenation and Mark and [removed: Graham._] [added: Graham.] | [added: |]
[removed: RETAIL] [added: RETAIL] STORE [removed: DATA][added: DATA]
| Store count – beginning of year | | | [removed: 631 | | | | 629] [added: 625] | | | | [removed: 618] [added: 631] | |
| Store [removed: openings_1_ | | | 23 |] [added: openings] | | | [removed: 28] [added: 14] | | | | [removed: 29] [added: 23] | |
| Store [removed: closings_1_ | | | (29 | )] [added: closings] | | | [removed: (26] [added: (25] | ) | | | [removed: (18] [added: (29] | ) |
| Store count – end of year | | | [removed: 625 | | | | 631] [added: 614] | | | | [removed: 629] [added: 625] | |
| Store selling square footage at year-end | | | [removed: 4,105,000 | | | | 4,019,000] [added: 4,129,000] | | | | [removed: 3,951,000] [added: 4,105,000] | |
| Store leased square footage (“LSF”) at year-end | | | [removed: 6,557,000 | | | | 6,451,000] [added: 6,558,000] | | | | [removed: 6,359,000] [added: 6,557,000] | |
53-week
A discussion and analysis of our financial condition, results of operations, and liquidity and capital resources for the
53-weeks
ended February 3, 2019 (“fiscal 2018”), compared to the
52-weeks
ended January 28, 2018 (“fiscal 2017”), can be found under Item 7 in our Annual Report on Form
10-K
for fiscal 2018, filed with the SEC on April 4, 2019, which is available on the SEC’s website at www.sec.gov and under the Financial Reports section of our Investor Relations website.
Williams-Sonoma, Inc. is a specialty retailer of high-quality sustainable products for the home.
These products, representing distinct merchandise strategies — Williams Sonoma, Pottery Barn, Pottery Barn Kids, West Elm, Pottery Barn Teen, Williams Sonoma Home, Rejuvenation, and Mark and Graham — are marketed through
e-commerce
websites, direct-mail catalogs and 614 stores.
These brands are also part of The Key Rewards, our
free-to-join
loyalty program that offers members exclusive benefits across the Williams-Sonoma family of brands.
We operate in the U.S., Puerto Rico, Canada, Australia and the United Kingdom, offer international shipping to customers worldwide, and have unaffiliated franchisees that operate stores in the Middle East, the Philippines, Mexico and South Korea, as well as
e-commerce
websites in certain locations.
In December 2017, we acquired Outward, Inc., a
3-D
imaging and augmented reality platform for the home furnishings and décor industry.
Fiscal 2019 Financial Results
This increase in net revenues was primarily driven by West Elm and Pottery Barn, partially offset by the loss of the additional week of net revenues in fiscal 2018, a fifty-three week year.
Total fiscal 2019 net revenue growth included a 5.4% increase in international revenues primarily related to our franchise operations and strength in our Canadian
e-commerce
business and company-owned United Kingdom operations.
e-commerce
and growth in new businesses: Marketplace and Pottery Barn Apartment, as well as our digital transformation and brand revitalization strategies.
Our expansion across life stages and aesthetics continued to be key drivers of growth and customer acquisition.
West Elm had another year of double-digit net revenue growth and comparable brand revenue growth of 14.4%, on top of 9.5% in fiscal 2018, led by furniture, with strength in dining and bedroom categories, as well as new product introductions.
Gross profit in fiscal 2019 decreased to 36.3% of revenues versus 37.0% in fiscal 2018, primarily driven by lower year-over-year occupancy leverage resulting from one less week of sales in fiscal 2019, increased shipping costs due to a larger mix of furniture and drop-ship sales that are more expensive to ship, as well as the incremental impact from the China tariffs.
We have been executing against an aggressive tariff mitigation plan which includes cost reductions from vendors, moving production out of China to South East Asia and to the United States, cost savings in other areas of the business, as well as select price increases.
Our approach towards mitigating the financial impact of these tariffs all year enabled us to deliver operating income growth, operating margin expansion, and diluted earnings per share growth.
In fiscal 2019, diluted earnings per share was $4.49 (which included a $0.30 impact related to operations and acquisition-related expenses of Outward, Inc., $0.11 related to certain employment-related expenses, and an $0.08 benefit related to a deferred tax liability adjustment) versus $4.05 in fiscal 2018 (which included a $0.25 impact related to Outward, Inc., a $0.12 impact related to impairment and early lease termination charges, a $0.07 impact from employment-related expenses, a $0.05 net tax benefit from the Tax Cuts and Jobs Act and a $0.01 impact of equity accounting rules).
During fiscal 2019, our cross-brand programs also continued to scale.
Our cross-brand loyalty program, The Key, continues to be an impactful driver of revenues and customer acquisition as total membership continued to grow during the year, while our complimentary design service, Design Crew, continued to be a significant revenue driver of sales in store.
Fiscal 2019 was also a strong start for our new cross-brand Business to Business (B2B) division as we delivered several key wins, which establish an important foundation for our future growth and demonstrate the appeal of our differentiated value proposition to B2B clients.
Critical to the success of our growth initiatives in fiscal 2019 has been our continued focus on improving the customer experience.
We enhanced our digital experience with new functionalities and content that enable us to deliver a faster and more personalized experience for our customers.
During the year, we launched a machine-learning search engine that allows us to provide more relevant and personalized search results.
| --- | --- |
Net revenues in fiscal 2018, including the impact of the additional week, increased by $379,234,000, or 7.2%, compared to fiscal 2017, with comparable brand revenue growth of 3.7%.
This increase in net revenues was driven by a 10.9% increase in e-commerce net revenues and a 3.0% increase in retail net revenues, with particular strength in furniture.
Total fiscal 2018 net revenue growth was partially attributable to a 1.6% increase in store leased square footage and a 5.7% increase in international revenues, primarily related to our company-owned international operations, as well as the favorable impact of the adoption of ASU 2014-09 primarily associated with the reclassification of other income from selling, general and administrative expenses into net revenues (see Note A to our Consolidated Financial Statements).
Revenue growth was also supported by our double digit new customer growth, which reflects the success of our strategies to increase customer acquisition and drive our future growth.
Our Baby business continued to gain momentum attracting new customers as the entry point to our brand and through registry creations.
West Elm had another year of double digit net revenue growth driven by strong e-commerce performance and continued strength in the core furniture business.
Across the business, fiscal 2018 was a year of delivering more compelling experiences for our customers.
As part of our strategic priority of digital leadership, we enhanced the e-commerce experience through two differentiators: content and convenience.
In fiscal 2018, we updated our shop path with more accurate and engaging content that is inspirational and drives conversion.
We also enhanced our product information pages with a focus on product quality and reasons to buy.
To provide our customers with omni-channel convenience, we launched Buy Online Pickup In Store in our brands and are in the process of scaling other fulfillment capabilities such as Buy Online Ship To Store and Buy Online Ship From Store.
As a result, our e-commerce revenue growth almost doubled in fiscal 2018.
With over 54% of our business conducted online, we are among the top 25 e-commerce retailers in North America.
We are using cross-brand initiatives to strengthen our position as the resource for all home furnishing, cooking and entertaining needs.
In fiscal 2018, we continued to scale our loyalty program, The Key, where we have seen strong membership growth over the past year, as well as our complimentary design service, Design Crew.
We also launched two new initiatives during the year: Design Crew Room Planner and The One Registry collective, both of which are enabling a more personalized and convenient shopping experience for our customers.
In our supply chain, we continued to drive operational improvements in fiscal 2018.
In our non-furniture business, our order consolidation efforts and continued improvement in distribution center productivity enabled us to lower our cartons-per-order and order-to-delivery time so that our customers received their orders faster this holiday season and with less waste.
Additionally, we were proud to be recognized once again by Barron’s for all of our sustainability efforts across the business.
At a ranking of number 24, we were the only company in our industry to be among the financial publication’s annual list of 100 Most Sustainable U.S. companies.
##### [Table of Contents](#toc)
In summary, 2018 was another year of solid financial and operational accomplishments resulting in earnings and cash flow generation that allowed us to return approximately $435,629,000 to our stockholders through stock repurchases and dividends.
Over the next few years, we plan target whitespace in the market; we plan to drive cross-brand initiatives that leverage our platform; and we plan to bring technology innovation and continued improvement in customer experience.
We have a strong foundation to support the execution of our initiatives in fiscal 2019 and beyond, as well as to deliver long-term shareholder value.
Net revenues consist of e-commerce net revenues and retail net revenues.
Retail net revenues include sales of merchandise to customers at our retail stores and to our franchisees, as well as shipping fees on any products shipped to our customers’ homes.
Revenues are presented net of sales returns and other discounts.
Due to the adoption of ASU 2014-09 in fiscal 2018, certain incentives received from credit card issuers as well as breakage income related to our unredeemed stored-value cards are now presented within net revenues (see Note A to our Consolidated Financial Statements).
| | | | | | | | | | | | | | | | | | | | | | | | | |
| --- | --- | --- | --- | --- | --- | --- | --- | --- | --- | --- | --- | --- | --- | --- | --- | --- | --- | --- | --- | --- | --- | --- | --- | --- |
| E-commerce net revenues | | $ | 3,082,064 | | | | 54.3% | | | $ | 2,778,457 | | | | 52.5% | | | $ | 2,633,602 | | | | 51.8% | |
| Retail net revenues | | | 2,589,529 | | | | 45.7% | | | | 2,513,902 | | | | 47.5% | | | | 2,450,210 | | | | 48.2% | |
| Net revenues | | $ | 5,671,593 | | | | 100.0% | | | $ | 5,292,359 | | | | 100.0% | | | $ | 5,083,812 | | | | 100.0% | |
Net revenues in fiscal 2018, including the impact of the additional week of net revenues, increased by $379,234,000 or 7.2%, compared to fiscal 2017, with comparable brand revenue growth of 3.7%.
This increase in net revenues was driven by a 10.9% increase in e-commerce net revenues (primarily driven by West Elm, Pottery Barn and Pottery Barn Kids and Teen) and a 3.0% increase in retail net revenues (primarily driven by West Elm and Pottery Barn), with particular strength in furniture.
Total fiscal 2018 net revenue growth was partially attributable to a 1.6% increase in store leased square footage and a 5.7% increase in international revenues primarily related to our company-owned international operations, as well as the favorable impact of the adoption of ASU 2014-09 primarily associated with the reclassification of other income from selling, general and administrative expenses into net revenues (see Note A to our Consolidated Financial Statements).
This increase in net revenues was driven by a 5.5% increase in e-commerce net revenues (primarily driven by West Elm, Williams Sonoma and Rejuvenation) and a 2.6% increase in retail net revenues (primarily driven by Pottery Barn and West Elm), with particular strength in furniture.
Total fiscal 2017 net revenue growth was partially attributable to a 1.4% increase in store leased square footage primarily due to 2 net new stores, and a 2.2% increase in international revenues primarily related to our company-owned international operations.
| | | | | | | | | | | | | |
An excerpt. Shown here: 40 of 131 rewritten, 40 of 176 added and 40 of 112 removed. The counts are complete. For every sentence, read Item 7. MANAGEMENT’S DISCUSSION AND ANALYSIS OF FINANCIAL CONDITION AND RESULTS OF OPERATIONS in the FY2019 filing and the FY2019 filing.
Item 7A. QUANTITATIVE AND QUALITATIVE DISCLOSURES ABOUT MARKET RISK
7 rewritten, 3 added, 1 removed, 12 unchanged
[removed: _Interest] [added: Interest] Rate [removed: Risk_][added: Risk]
As of February [removed: 3, 2019,] [added: 2, 2020,] we had $300,000,000 outstanding under the term loan, and during fiscal [removed: 2018] [added: 2019] we had borrowings of [removed: $60,000,000] [added: $100,000,000] under the revolver, all of which were repaid in the fourth quarter of fiscal [removed: 2018.][added: 2019.]
As of February [removed: 3, 2019,] [added: 2, 2020,] our investments, made primarily in interest bearing demand deposit accounts and money market funds, are stated at cost and approximate their fair values.
[removed: _Foreign] [added: Foreign] Currency [removed: Risks_][added: Risks]
We purchase a significant amount of inventory from vendors outside of the U.S. in transactions that are denominated in U.S. dollars and, as such, any foreign currency impact related to these international purchase transactions was not significant to us during fiscal [removed: 2018] [added: 2019] or fiscal [removed: 2017.][added: 2018.]
[removed: In addition, our retail and/or e-commerce] businesses in Canada, Australia and the United Kingdom, and our operations throughout Asia and Europe, expose us to market risk associated with foreign currency exchange rate fluctuations.
While the impact of foreign currency exchange rate fluctuations was not material to us in fiscal [removed: 2018,] [added: 2019,] we have continued to see volatility in the exchange rates in the countries in which we do business.
See Note P: Subsequent Events to our Consolidated Financial Statements.
In addition, our retail and
e-commerce
##### [Table of Contents](#toc)
Item 1. BUSINESS
46 rewritten, 48 added, 8 removed, 40 unchanged
[removed: OVERVIEW][added: OVERVIEW]
Williams-Sonoma, Inc., incorporated in 1973, is a [removed: multi-channel] [added: omni-channel] specialty retailer of high quality products for the home.
[removed: Growth across the Williams-Sonoma, Inc. portfolio has been fueled by three areas of strategic investment: brand experimentation and innovation, for a best-in-class] approach to [removed: multi-channel] [added: omni-channel] retail experiences; operational excellence across the enterprise, from quality product and sourcing, to efficient manufacturing and supply chain; and culture and corporate social responsibility, from commitments to foster women in leadership and embrace diversity, to a healthy impact on our community and environment.
[removed: Today, Williams-Sonoma, Inc. is one of the United States’ largest e-commerce] retailers with some of the best known and most beloved brands in home furnishings.
Our unaffiliated franchisees operate stores in the Middle East, the Philippines, Mexico and South Korea, as well as [removed: e-commerce websites in certain locations.]
[removed: _Williams Sonoma_][added: Williams Sonoma]
[removed: _Pottery Barn_][added: Pottery Barn]
Established in 1949 and acquired by Williams-Sonoma, Inc. in 1986, Pottery Barn is a premier [removed: multi-channel] [added: omni-channel] home furnishings retailer.
[removed: _Pottery] [added: Pottery] Barn [removed: Kids_][added: Kids]
[removed: _West Elm_][added: West Elm]
Launched in 2003, [removed: PBteen] [added: Pottery Barn Teen] is the first home concept to focus exclusively on the teen market.
[removed: PBteen’s] [added: Pottery Barn Teen’s] innovative products are specifically designed to help teens create a comfortable and stylish room that reflects their own individual aesthetic.
[removed: _Rejuvenation_][added: Rejuvenation]
[removed: With design, manufacturing and distribution facilities in Portland, Oregon, Rejuvenation offers a wide assortment of made-to-order] lighting, hardware, furniture and home décor inspired by history, designed for today and made to last for years to come.
[removed: _Mark] [added: Mark] and [removed: Graham_][added: Graham]
Launched in 2012, Mark and Graham is designed to be a premier [added: online] destination for personalized gift buying.
[removed: _Outward_][added: Outward]
[removed: In 2017, we acquired Outward, Inc., a 3-D] imaging and augmented reality platform for the home furnishings and décor industry.
[removed: E-COMMERCE OPERATIONS][added: e-commerce]
As of February [removed: 3, 2019, the e-commerce channel] [added: 2, 2020, we] had the following merchandise strategies: Williams Sonoma, Pottery Barn, Pottery Barn Kids, West Elm, [removed: PBteen,] [added: Pottery Barn Teen,] Williams Sonoma Home, Rejuvenation and Mark and Graham, which sell our products through our [removed: e-commerce websites and direct-mail catalogs.]
We offer shipping from many of our brands to countries worldwide, while our catalogs reach customers throughout the U.S. The [removed: e-commerce channel complements the retail channel by building brand awareness and acting as an effective advertising vehicle.]
[removed: In addition, we believe that our e-commerce] websites and our direct-mail catalogs act as a cost-efficient means of testing market acceptance of new products and new brands.
Leveraging these insights and our [removed: multi-channel] [added: omni-channel] positioning, our marketing efforts, including digital advertising and the circulation of catalogs, are targeted toward driving sales to each of our channels.
Our customer mailings are continually updated to include new prospects and to eliminate [removed: non-responders.]
We also have multi-year franchise agreements with third parties in the Middle East, the Philippines, Mexico and South Korea that currently operate [removed: 108] [added: 129] franchised stores as well as [removed: e-commerce websites in certain locations.]
[removed: The retail channel complements the e-commerce channel] [added: business] by building brand awareness and attracting new customers to our brands.
[removed: SUPPLIERS][added: SUPPLIERS]
We purchase most of our merchandise from numerous foreign and domestic manufacturers and importers, the largest of which accounted for approximately 2% of our purchases during fiscal [removed: 2018.][added: 2019.]
Approximately [removed: 66%] [added: 65%] of our merchandise purchases in fiscal [removed: 2018] [added: 2019] were sourced from foreign vendors, predominantly in Asia and Europe.
[removed: COMPETITION] [added: COMPETITION] AND [removed: SEASONALITY][added: SEASONALITY]
[removed: The specialty e-commerce] and retail businesses are highly competitive.
[removed: Our specialty retail stores, e-commerce websites and direct-mail catalogs compete with other] retailers, [removed: including] large department stores, discount retailers, other specialty retailers offering home-centered [removed: assortments, other e-commerce websites] [added: assortments] and other direct-mail catalogs.
[removed: The substantial sales growth in the direct-to-customer industry within the last decade, particularly in e-commerce,] has encouraged the entry of many new competitors, including discount retailers selling similar products at reduced prices, new business models and an increase in competition from established companies.
We compete on the basis of our brand authority, the quality of our merchandise, service to our customers, our proprietary customer list, our [removed: e-commerce websites and our marketing capabilities, as well as the location and appearance of our stores.]
[removed: EMPLOYEES][added: EMPLOYEES]
As of February [removed: 3, 2019,] [added: 2, 2020,] we had approximately [removed: 28,200] [added: 27,000] employees, of whom approximately [removed: 11,400] [added: 11,600] were full-time.
In preparation for and during our fiscal [removed: 2018] [added: 2019] holiday selling season, we hired approximately [removed: 8,300] [added: 8,500] temporary [removed: employees] [added: employees,] primarily in our retail stores, customer care centers and distribution facilities.
[removed: INTELLECTUAL PROPERTY][added: INTELLECTUAL PROPERTY]
As of February [removed: 3, 2019,] [added: 2, 2020,] we own and/or have applied to register [removed: 146 separate] [added: 164 unique] trademarks and service marks.
We own and/or have applied to register our key brand names as trademarks in the U.S. as well as [removed: 94] [added: 121] additional jurisdictions.
Growth across the Williams-Sonoma, Inc. portfolio has been fueled by three areas of strategic investment: brand experimentation and innovation, for a
best-in-class
Today, Williams-Sonoma, Inc. is one of the United States’ largest
e-commerce
websites in certain locations.
Pottery Barn Teen
With design, manufacturing and distribution facilities in Portland, Oregon, Rejuvenation offers a wide assortment of
made-to-order
In 2017, we acquired Outward, Inc., a
3-D
OPERATIONS
e-commerce
websites, direct-mail catalogs and retail stores.
e-commerce
business complements the retail business by building brand awareness and acting as an effective advertising vehicle.
We believe that our
e-commerce
non-responders.
In addition, the retail business complements the
e-commerce
We operate 614 stores, which include 572 stores in 43 states, Washington, D.C. and Puerto Rico, 20 stores in Canada, 19 stores in Australia and 3 stores in the United Kingdom.
e-commerce
websites in certain locations.
The specialty
e-commerce
Our
e-commerce
websites, direct-mail catalogs and retail stores compete with other retailers, including
e-commerce
The substantial sales growth in the
direct-to-customer
industry within the last decade, particularly in
e-commerce,
e-commerce
websites and our marketing capabilities, as well as the location and appearance of our stores.
As of February 2, 2020, we own and/or have applied to register 277 patents in connection with certain product designs, inventions and proprietary technology.
We file annual reports on Form
10-K,
quarterly reports on Form
10-Q,
##### [Table of Contents](#toc)
_PBteen_
Detailed financial information about the e-commerce channel is found in Note K to our Consolidated Financial Statements.
RETAIL STORES
As of February 3, 2019, the retail channel had the following merchandise strategies: Williams Sonoma, Pottery Barn, Pottery Barn Kids, West Elm and Rejuvenation, which operate 625 stores, comprising 579 stores in 43 states, Washington, D.C. and Puerto Rico, 24 stores in Canada, 19 stores in Australia and 3 stores in the United Kingdom.
Detailed financial information about the retail channel is found in Note K to our Consolidated Financial Statements.
We hold patents on certain product functions, product designs and proprietary technology.
“pbteen.com,” “westelm.com,” “wshome.com,” “williams-sonomainc.com,” “rejuvenation.com” and “markandgraham.com.” Collectively, the trademarks, patents, copyrights, trade dress rights and domain names that we hold are of material importance to us.
An excerpt. Shown here: 40 of 46 rewritten, 40 of 48 added and all 8 removed. The counts are complete. For every sentence, read Item 1. BUSINESS in the FY2019 filing and the FY2019 filing.
Cover and table of contents
60 rewritten, 43 added, 7 removed, 20 unchanged
[removed: ##### [Table of Contents](#toc)][added: TABLE OF CONTENTS]
[removed: UNITED STATES][added: UNITED STATES]
[removed: SECURITIES] [added: SECURITIES] AND EXCHANGE [removed: COMMISSION][added: COMMISSION]
[removed: WASHINGTON,] [added: WASHINGTON,] D.C. [removed: 20549][added: 20549]
[removed: FORM 10-K][added: FORM]
| ☒ | [removed: ANNUAL] [added: ANNUAL] REPORT PURSUANT TO SECTION 13 OR 15(d) OF THE SECURITIES EXCHANGE ACT OF [removed: 1934] [added: 1934] |
For the fiscal year ended February [removed: 3, 2019.][added: 2, 2020.]
| ☐ | [removed: TRANSITION] [added: TRANSITION] REPORT PURSUANT TO SECTION 13 OR 15(d) OF THE SECURITIES EXCHANGE ACT OF [removed: 1934] [added: 1934] |
For the transition period from [removed: to]
Commission file number [removed: 001-14077]
[removed: WILLIAMS-SONOMA, INC.][added: WILLIAMS-SONOMA, INC.]
| [removed: Delaware] [added: Delaware] | | [removed: 94-2203880] [added: 94-2203880] |
| [removed: 3250] [added: 3250] Van Ness Avenue, San Francisco, [removed: CA] [added: CA] | | [removed: 94109] [added: 94109] |
Registrant’s telephone number, including area code: (415) [removed: 421-7900]
| Common Stock, [removed: $.01] par value [added: $.01 per share] | | [added: WSM | |] New York Stock Exchange, Inc. |
| [removed: (Title] [added: Title] of [removed: class)] [added: each class:] | | [removed: (Name] [added: Trading Symbol(s): | | Name] of each exchange on which [removed: registered)] [added: registered:] |
Yes [removed: ☒ No ☐]
Yes [removed: ☐ No ☒]
Indicate by check mark whether the registrant has submitted electronically every Interactive Data File required to be submitted pursuant to Rule 405 of Regulation [removed: S-T (§232.405 of this chapter) during the preceding 12 months (or for such shorter period that the registrant was required to submit such files).]
Indicate by check mark whether the registrant is a large accelerated filer, an accelerated filer, a [removed: non-accelerated filer, a smaller reporting company, or emerging growth company.]
See definitions of “large accelerated filer,” “accelerated filer,” “smaller reporting company,” and “emerging growth company” in Rule [removed: 12b-2 of the Exchange Act.]
[removed: Large accelerated filer ☒ Accelerated filer ☐ Non-accelerated filer ☐ Smaller] [added: filer, a smaller] reporting [removed: company ☐ Emerging] [added: company, or emerging] growth [removed: company ☐][added: company.]
Indicate by check mark whether the registrant is a shell company (as defined in Rule [removed: 12b-2 of the Act).]
As of [removed: July 29, 2018,] [added: August 4, 2019,] the approximate aggregate market value of the registrant’s common stock held by [removed: non-affiliates was $4,678,185,000.]
It is assumed for purposes of this computation that an affiliate includes all persons as of [removed: July 29, 2018] [added: August 4, 2019] listed as executive officers and directors with the Securities and Exchange Commission.
As of March [removed: 31, 2019, 78,563,968] [added: 22, 2020, 77,197,681] shares of the registrant’s common stock were outstanding.
[removed: DOCUMENTS] [added: DOCUMENTS] INCORPORATED BY [removed: REFERENCE][added: REFERENCE]
[removed: Portions of our definitive Proxy Statement for the 2019 Annual Meeting of Stockholders, also referred to in this Annual Report on Form 10-K] as our Proxy Statement, which will be filed with the Securities and Exchange Commission, or SEC, have been incorporated in Part III hereof.
[removed: FORWARD-LOOKING STATEMENTS][added: FORWARD-LOOKING STATEMENTS]
[removed: This Annual Report on Form 10-K] and the letter to stockholders contained in this Annual Report contain forward-looking statements within the “safe harbor” provisions of the Private Securities Litigation Reform Act of 1995 that involve risks and uncertainties, as well as assumptions that, if they do not fully materialize or prove incorrect, could cause our business and operating results to differ materially from those expressed or implied by such forward-looking statements.
[removed: Such forward-looking statements include, without limitation, statements related to: projections of earnings, revenues, growth] and [removed: other financial items; the strength of our business and our brands; our ability to execute strategic priorities and growth initiatives regarding digital leadership, product and technology innovation, cross-brand initiatives,] retail [removed: transformation and operational excellence; our beliefs about our competitive advantages and areas of potential future growth in the market; our ability to drive long-term sustainable returns; the plans, strategies, initiatives and objectives of management for future operations; our brands, products and related initiatives, including our ability to introduce new brands, brand extensions, products and product lines and bring in new customers; our belief that our e-commerce websites and direct-mail catalogs act as a cost-efficient means of testing market acceptance of new products and new brands; the complementary nature of our e-commerce and retail] channels; our marketing efforts; our acquisition of Outward, Inc., including the valuation of intangible assets acquired; our global business and expansion efforts, including franchise, other third-party arrangements and company-owned operations; our ability to attract new customers; the seasonal variations in demand; our ability to recruit, retain and motivate skilled personnel; our belief in the reasonableness of the steps taken to protect the security and confidentiality of the information we collect; our belief in the adequacy of our facilities and the availability of suitable additional or substitute space; our belief in the ultimate resolution of current legal proceedings; the payment of dividends; our stock repurchase program; our capital allocation strategy in fiscal [removed: 2019;] [added: 2020;] our planned use of cash in fiscal [removed: 2019;] [added: 2020;] our compliance with financial covenants; our belief that our cash on hand and available credit facilities will provide adequate liquidity for our business operations over the next 12 months; the impact of the 2017 Tax Cuts and Jobs Act; the impact of tariffs on our business and our results of operations; our belief regarding the effects of potential losses under our indemnification obligations; the impact of inflation; the effects of changes in our inventory reserves; the impact of new accounting pronouncements; [added: the impact of the coronavirus on our retail store operations, global supply chain] and [added: customer spending and demand; and] statements of belief and statements of assumptions underlying any of the foregoing.
[removed: ANNUAL] [added: ANNUAL] REPORT ON FORM [removed: 10-K]
[removed: FISCAL] [added: FISCAL] YEAR ENDED FEBRUARY [removed: 3, 2019][added: 2, 2020]
| | | | | [removed: PAGE] | | [added: PAGE] | [added: | |]
| | | [removed: PART I] | | [added: PART I] | | | [added: | |]
| [added: |] Item 1. | | [removed: [Business](#tx683578_1)] | [added: [Business](#tx856872_1)] | | [added: |] 3 | |
| [added: |] Item 1A. | | [added: |] [Risk [removed: Factors](#tx683578_2)] [added: Factors](#tx856872_2)] | | | 6 | |
| [added: |] Item 1B. | | [added: |] [Unresolved Staff [removed: Comments](#tx683578_3)] [added: Comments](#tx856872_3)] | | | [removed: 22] [added: 24] | |
| [added: |] Item 2. | | [removed: [Properties](#tx683578_4)] | [added: [Properties](#tx856872_4)] | | [removed: 22] | [added: 24] | [added: |]
| [added: |] Item 3. | | [added: |] [Legal [removed: Proceedings](#tx683578_5)] [added: Proceedings](#tx856872_5)] | | | [removed: 23] [added: 25] | |
10-K
to
001-14077
421-7900
| | | | | |
| --- | --- | --- | --- | --- |
No
No
Yes
No
S-T
(§232.405 of this chapter) during the preceding 12 months (or for such shorter period that the registrant was required to submit such files).
Yes
No
non-accelerated
12b-2
of the Exchange Act.
Large accelerated filer
Accelerated filer
Non-accelerated
filer
Smaller reporting company ☐ Emerging growth company ☐
12b-2
of the Act).
Yes
No ☒
non-affiliates
was $4,956,461,000.
Portions of our definitive Proxy Statement for the 2020 Annual Meeting of Stockholders, also referred to in this Annual Report on Form
10-K
This Annual Report on Form
10-K
Such forward-looking statements include, without limitation, statements related to: projections of earnings, revenues, growth and other financial items; the strength of our business and our brands; our ability to execute strategic priorities and growth initiatives regarding digital leadership, product and technology innovation, cross-brand initiatives, retail transformation and operational excellence; our beliefs about our competitive advantages and areas of potential future growth in the market; our ability to drive long-term sustainable returns; the plans, strategies, initiatives and objectives of management for future operations; our brands, products and related initiatives, including our ability to introduce new brands, brand extensions, products and product lines and bring in new customers; our belief that our
e-commerce
websites and direct-mail catalogs act as a cost-efficient means of testing market acceptance of new products and new brands; the complementary nature of our
e-commerce
WILLIAMS-SONOMA, INC.
10-K
| | | | | | | | | |
| --- | --- | --- | --- | --- | --- | --- | --- | --- |
10-K 1 d683578d10k.htm 10-K
| | | |
| --- | --- | --- |
Indicate by check mark if disclosure of delinquent filers pursuant to Item 405 of Regulation S-K (§229.405 of this chapter) is not contained herein, and will not be contained, to the best of registrant’s knowledge, in definitive proxy or information statements incorporated by reference in Part III of this Form 10-K or any amendment to this Form 10-K.
TABLE OF CONTENTS
| | | | | | | |
| --- | --- | --- | --- | --- | --- | --- |
An excerpt. Shown here: 40 of 60 rewritten, 40 of 43 added and all 7 removed. The counts are complete. For every sentence, read Cover and table of contents in the FY2019 filing and the FY2019 filing.
Item 2. PROPERTIES
14 rewritten, 0 added, 2 removed, 21 unchanged
For our store locations, our gross leased store space as of February [removed: 3, 2019] [added: 2, 2020] totaled approximately [removed: 6,557,000] [added: 6,558,000] square feet for [removed: 625] [added: 614] stores compared to approximately [removed: 6,451,000] [added: 6,557,000] square feet for [removed: 631] [added: 625] stores as of [removed: January 28, 2018.][added: February 3, 2019.]
[removed: _Leased Properties_][added: Leased Properties]
The following table summarizes the location and size of our leased facilities occupied by us as of February [removed: 3, 2019:][added: 2, 2020:]
| [removed: _Distribution] [added: Distribution] and Manufacturing [removed: Facilities_] [added: Facilities] | | | | |
| California | | | [removed: 1,432,000] [added: 2,030,000] | |
| Texas | | | [removed: 822,000] [added: 1,064,000] | |
| North Carolina | | | [removed: 412,000] [added: 442,000] | |
| [removed: _Corporate Facilities_] [added: Corporate Facilities] | | | | |
| California | | | [removed: 266,000] [added: 269,000] | |
| [removed: _Customer] [added: Customer] Care [removed: Centers_] [added: Centers] | | | | |
In addition to the above leased properties, we enter into [removed: other] agreements for [added: other] offsite storage needs for our distribution facilities and our retail store locations, as necessary.
[removed: relating] [added: As of February 2, 2020, the total leased space related] to these properties was not material to us and is not included in the occupied square footage reported above.
[removed: _Owned Properties_][added: Owned Properties]
As of February [removed: 3, 2019,] [added: 2, 2020,] we owned 471,000 square feet of space, primarily in California, for our corporate headquarters and certain data center operations.
As of February 3, 2019, the total leased space
##### [Table of Contents](#toc)
Item 4. MINE SAFETY DISCLOSURES
1 rewritten, 0 added, 1 removed, 1 unchanged
[removed: PART II][added: PART II]
##### [Table of Contents](#toc)
Item 5. MARKET FOR REGISTRANT’S COMMON EQUITY, RELATED STOCKHOLDER MATTERS AND ISSUER PURCHASES OF EQUITY SECURITIES
16 rewritten, 10 added, 12 removed, 21 unchanged
[removed: MARKET INFORMATION][added: MARKET INFORMATION]
The closing price of our common stock on the NYSE on March [removed: 31, 2019] [added: 22, 2020] was [removed: $56.27.][added: $36.37.]
[removed: STOCKHOLDERS][added: STOCKHOLDERS]
The number of stockholders of record of our common stock as of March [removed: 31, 2019] [added: 22, 2020] was [removed: 320.][added: 305.]
[removed: PERFORMANCE GRAPH][added: PERFORMANCE GRAPH]
[removed: COMPARISON] [added: COMPARISON] OF FIVE YEAR CUMULATIVE TOTAL [removed: RETURN*][added: RETURN*]
[removed: Among] [added: Among] Williams-Sonoma, Inc., the NYSE Composite [removed: Index,][added: Index,]
[removed: and] [added: and] S&P [removed: Retailing][added: Retailing]
[removed: 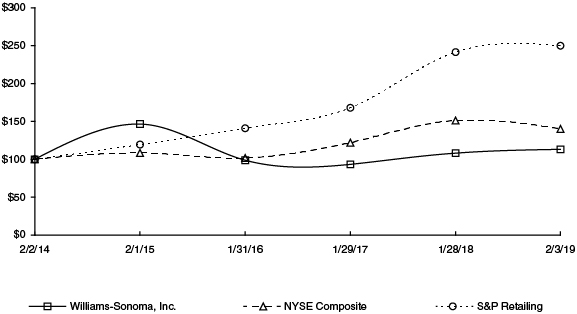][added: ]
| * | $100 invested on [removed: 2/2/14] [added: 2/1/15] in stock or index, including reinvestment of dividends. Fiscal year ending February [removed: 3.] [added: 2, 2020.] |
[removed: * Notes:][added: * Notes:]
[removed: STOCK] [added: STOCK] REPURCHASE [removed: PROGRAMS][added: PROGRAMS]
During fiscal [removed: 2016,] [added: 2019,] we repurchased [removed: 2,871,480] [added: 2,341,931] shares of our common [removed: stock] [added: stock, of which 16,368 shares were designated as treasury stock,] at an average cost of [removed: $52.68] [added: $63.55] per share and a total cost of [removed: $151,272,000.][added: $148,834,000.]
The following table summarizes our repurchases of shares of our common stock during the fourth quarter of fiscal [removed: 2018] [added: 2019] under our stock repurchase program:
| Fiscal period | | | | | Total Number of Shares [removed: Purchased1] [added: Purchased 1] | | | | Average Price Paid Per Share | | | | Total Number of Shares Purchased as Part of a Publicly Announced [removed: Program1] [added: Program 1] | | | | Maximum Dollar Value of Shares That May Yet Be Purchased Under the Program | |
| [removed: _1_] [added: 1] | [removed: _Excludes] [added: Excludes] shares withheld for employee taxes upon vesting of stock-based [removed: awards._] [added: awards.] |
| | | | | | | | | | | | | | | | | | | | | | | | | | |
| --- | --- | --- | --- | --- | --- | --- | --- | --- | --- | --- | --- | --- | --- | --- | --- | --- | --- | --- | --- | --- | --- | --- | --- | --- | --- |
| | | | 2/1/15 | | | | 1/31/16 | | | | 1/29/17 | | | | 1/28/18 | | | | 2/3/19 | | | | 2/2/20 | | |
| Williams-Sonoma, Inc. | | | 100.00 | | | | 67.37 | | | | 63.72 | | | | 73.87 | | | | 77.06 | | | | 102.95 | | |
| NYSE Composite Index | | | 100.00 | | | | 93.70 | | | | 112.69 | | | | 139.56 | | | | 129.47 | | | | 146.66 | | |
| S&P Retailing | | | 100.00 | | | | 118.07 | | | | 140.98 | | | | 203.43 | | | | 210.40 | | | | 253.71 | | |
| November 4, 2019 | | – December 1, 2019 | | | 160,918 | | | | $ 69.90 | | | | 160,918 | | | | $ 599,853,000 | |
| December 2, 2019 | | – December 29, 2019 | | | 158,780 | | | | $ 70.85 | | | | 158,780 | | | | $ 588,604,000 | |
| December 30, 2019 | | – February 2, 2020 | | | 183,262 | | | | $ 74.33 | | | | 183,262 | | | | $ 574,982,000 | |
| Total | | | | | 502,960 | | | | $ 71.81 | | | | 502,960 | | | | $ 574,982,000 | |
| | | | | | | | | | | | | |
| --- | --- | --- | --- | --- | --- | --- | --- | --- | --- | --- | --- | --- |
| | | 2/2/14 | | 2/1/15 | | 1/31/16 | | 1/29/17 | | 1/28/18 | | 2/03/19 |
| Williams-Sonoma, Inc. | | 100.00 | | 146.32 | | 98.58 | | 93.24 | | 108.08 | | 112.76 |
| NYSE Composite Index | | 100.00 | | 108.27 | | 101.44 | | 122.00 | | 151.10 | | 140.18 |
| S&P Retailing | | 100.00 | | 119.10 | | 140.73 | | 167.81 | | 241.26 | | 249.58 |
##### [Table of Contents](#toc)
In March 2019, our Board of Directors authorized an increase in the amount available for repurchase under our existing stock repurchase plan by an additional $500,000,000.
| October 29, 2018 | | – November 25, 2018 | | | 141,671 | | | | $ 59.12 | | | | 141,671 | | | | $ 290,522,000 | |
| November 26, 2018 | | – December 30, 2018 | | | 1,074,046 | | | | $ 48.96 | | | | 1,074,046 | | | | $ 237,934,000 | |
| December 31, 2018 | | – February 3, 2019 | | | 273,455 | | | | $ 51.63 | | | | 273,455 | | | | $ 223,815,000 | |
| Total | | | | | 1,489,172 | | | | $ 50.42 | | | | 1,489,172 | | | | $ 223,815,000 | |
Item 6. SELECTED FINANCIAL DATA
31 rewritten, 2 added, 8 removed, 9 unchanged
[removed: _Five-Year] [added: Five-Year] Selected Financial [removed: Data_][added: Data]
| [removed: _In] [added: In] thousands, except percentages, per share amounts and retail stores [removed: data_] [added: data] | | [removed: _Fiscal 20181_ (53] [added: Fiscal 2019 (52] Weeks) | | | | Fiscal [removed: 2017 (52] [added: 2018 1 (53] Weeks) | | | | Fiscal [removed: 2016] [added: 2017] (52 Weeks) | | | | Fiscal [removed: 2015] [added: 2016] (52 Weeks) | | | | Fiscal [removed: 2014] [added: 2015] (52 Weeks) | | |
| Net revenues | | $ | [removed: 5,671,593] [added: 5,898,008] | | | $ | [removed: 5,292,359] [added: 5,671,593] | | | $ | [removed: 5,083,812] [added: 5,292,359] | | | $ | [removed: 4,976,090] [added: 5,083,812] | | | $ | [removed: 4,698,719] [added: 4,976,090] | |
| Net revenue growth | | | [removed: 7.2%] [added: 4.0%] | | | | [removed: 4.1%] [added: 7.2%] | | | | [removed: 2.2%] [added: 4.1%] | | | | [removed: 5.9%] [added: 2.2%] | | | | [removed: 7.1%] [added: 5.9%] | |
| Comparable brand revenue [removed: growth_2_] [added: growth 2] | | | [removed: 3.7%] [added: 6.0%] | | | | [removed: 3.2%] [added: 3.7%] | | | | [removed: 0.7%] [added: 3.2%] | | | | [removed: 3.7%] [added: 0.7%] | | | | [removed: 7.1%] [added: 3.7%] | |
| Gross profit | | $ | [removed: 2,101,013] [added: 2,139,092] | | | $ | [removed: 1,931,711] [added: 2,101,013] | | | $ | [removed: 1,883,310] [added: 1,931,711] | | | $ | [removed: 1,844,214] [added: 1,883,310] | | | $ | [removed: 1,800,504] [added: 1,844,214] | |
| Gross margin | | | [removed: 37.0%] [added: 36.3%] | | | | [removed: 36.5%] [added: 37.0%] | | | | [removed: 37.0%] [added: 36.5%] | | | | [removed: 37.1%] [added: 37.0%] | | | | [removed: 38.3%] [added: 37.1%] | |
| Operating income | | $ | [removed: 435,953] [added: 465,874] | | | $ | [removed: 453,811] [added: 435,953] | | | $ | [removed: 472,599] [added: 453,811] | | | $ | [removed: 488,634] [added: 472,599] | | | $ | [removed: 502,265] [added: 488,634] | |
| Operating [removed: margin_3_] [added: margin 3] | | | [removed: 7.7%] [added: 7.9%] | | | | [removed: 8.6%] [added: 7.7%] | | | | [removed: 9.3%] [added: 8.6%] | | | | [removed: 9.8%] [added: 9.3%] | | | | [removed: 10.7%] [added: 9.8%] | |
| Net earnings | | $ | [removed: 333,684] [added: 356,062] | | | $ | [removed: 259,545] [added: 333,684] | | | $ | [removed: 305,387] [added: 259,545] | | | $ | [removed: 310,068] [added: 305,387] | | | $ | [removed: 308,854] [added: 310,068] | |
| Basic earnings per share | | $ | [removed: 4.10] [added: 4.56] | | | $ | [removed: 3.03] [added: 4.10] | | | $ | [removed: 3.45] [added: 3.03] | | | $ | [removed: 3.42] [added: 3.45] | | | $ | [removed: 3.30] [added: 3.42] | |
| Diluted earnings per share | | $ | [removed: 4.05] [added: 4.49] | | | $ | [removed: 3.02] [added: 4.05] | | | $ | [removed: 3.41] [added: 3.02] | | | $ | [removed: 3.37] [added: 3.41] | | | $ | [removed: 3.24] [added: 3.37] | |
| Shares used in calculation of earnings per share: Basic | | | [removed: 81,420] [added: 78,108] | | | | [removed: 85,592] [added: 81,420] | | | | [removed: 88,594] [added: 85,592] | | | | [removed: 90,787] [added: 88,594] | | | | [removed: 93,634] [added: 90,787] | |
| Diluted | | | [removed: 82,340] [added: 79,225] | | | | [removed: 86,080] [added: 82,340] | | | | [removed: 89,462] [added: 86,080] | | | | [removed: 92,102] [added: 89,462] | | | | [removed: 95,200] [added: 92,102] | |
| Working [removed: capital_4_] [added: capital 4] | | $ | [removed: 619,531] [added: 146,080] | | | $ | [removed: 628,622] [added: 619,531] | | | $ | [removed: 405,924] [added: 628,622] | | | $ | [removed: 339,673] [added: 405,924] | | | $ | [removed: 515,975] [added: 339,673] | |
| Total assets [added: 4] | | $ | [removed: 2,812,844] [added: 4,054,042] | | | $ | [removed: 2,785,749] [added: 2,812,844] | | | $ | [removed: 2,476,879] [added: 2,785,749] | | | $ | [removed: 2,417,427] [added: 2,476,879] | | | $ | [removed: 2,330,277] [added: 2,417,427] | |
| Return on assets [added: 4] | | | [removed: 11.9%] [added: 10.4%] | | | | [removed: 9.9%] [added: 11.9%] | | | | [removed: 12.5%] [added: 9.9%] | | | | [removed: 13.1%] [added: 12.5%] | | | | [removed: 13.2%] [added: 13.1%] | |
| Net cash provided by operating activities | | $ | [removed: 585,986] [added: 607,294] | | | $ | [removed: 499,704] [added: 585,986] | | | $ | [removed: 524,709] [added: 499,704] | | | $ | [removed: 544,026] [added: 524,709] | | | $ | [removed: 461,697] [added: 544,026] | |
| Capital expenditures | | $ | [removed: 190,102] [added: 186,276] | | | $ | [removed: 189,712] [added: 190,102] | | | $ | [removed: 197,414] [added: 189,712] | | | $ | [removed: 202,935] [added: 197,414] | | | $ | [removed: 204,800] [added: 202,935] | |
| Long-term debt and other long-term liabilities [added: 4] | | $ | [removed: 380,944] [added: 1,180,968] | | | $ | [removed: 372,226] [added: 380,944] | | | $ | [removed: 71,215] [added: 372,226] | | | $ | [removed: 49,713] [added: 71,215] | | | $ | [removed: 62,698] [added: 49,713] | |
| Stockholders’ equity | | $ | [removed: 1,155,714] [added: 1,235,860] | | | $ | [removed: 1,203,566] [added: 1,155,714] | | | $ | [removed: 1,248,220] [added: 1,203,566] | | | $ | [removed: 1,198,226] [added: 1,248,220] | | | $ | [removed: 1,224,706] [added: 1,198,226] | |
| Stockholders’ equity per share (book value) | | $ | [removed: 14.66] [added: 16.02] | | | $ | [removed: 14.37] [added: 14.66] | | | $ | [removed: 14.29] [added: 14.37] | | | $ | [removed: 13.38] [added: 14.29] | | | $ | [removed: 13.33] [added: 13.38] | |
| Return on equity | | | [removed: 28.3%] [added: 29.8%] | | | | [removed: 21.2%] [added: 28.3%] | | | | [removed: 25.0%] [added: 21.2%] | | | | [removed: 25.6%] [added: 25.0%] | | | | [removed: 24.9%] [added: 25.6%] | |
| Annual dividends declared per share | | $ | [removed: 1.72] [added: 1.92] | | | $ | [removed: 1.56] [added: 1.72] | | | $ | [removed: 1.48] [added: 1.56] | | | $ | [removed: 1.40] [added: 1.48] | | | $ | [removed: 1.32] [added: 1.40] | |
| Number of stores at year-end | | | [removed: 625] [added: 614] | | | | [removed: 631] [added: 625] | | | | [removed: 629] [added: 631] | | | | [removed: 618] [added: 629] | | | | [removed: 601] [added: 618] | |
| Store selling square footage at year-end | | | [removed: 4,105,000] [added: 4,129,000] | | | | [removed: 4,019,000] [added: 4,105,000] | | | | [removed: 3,951,000] [added: 4,019,000] | | | | [removed: 3,827,000] [added: 3,951,000] | | | | [removed: 3,684,000] [added: 3,827,000] | |
| Store leased square footage at year-end | | | [removed: 6,557,000] [added: 6,558,000] | | | | [removed: 6,451,000] [added: 6,557,000] | | | | [removed: 6,359,000] [added: 6,451,000] | | | | [removed: 6,163,000] [added: 6,359,000] | | | | [removed: 5,965,000] [added: 6,163,000] | |
| [removed: _1_] [added: 1] | [removed: _In] [added: In] fiscal 2018, we adopted [removed: Accounting Standards Update] [added: ASU] 2014-09, Revenue from Contracts with Customers, using the modified retrospective method. Amounts reported for fiscal 2017 and prior years have not been adjusted, and continue to be reported in accordance with previous revenue recognition guidance. See Note A to the Consolidated Financial [removed: Statements._] [added: Statements.] | |
| [removed: _2_] [added: 2] | [removed: _Comparable] [added: Comparable] brand revenue is calculated on a 52-week to 52-week basis, with the exception of fiscal 2018 which is calculated on a 53-week to 53-week basis. See definition of comparable brand revenue within “Management’s Discussion and Analysis of Financial Condition and Results of [removed: Operations.”_] [added: Operations.”] | |
| [removed: _3_] [added: 3] | [removed: _Operating] [added: Operating] margin is defined as operating income as a percent of net [removed: revenues._] [added: revenues.] | |
The information set forth above is not necessarily indicative of future operations and should be read in conjunction with “Management’s Discussion and Analysis of Financial Condition and Results of Operations” and the Consolidated Financial Statements and notes thereto in this Annual Report on Form [removed: 10-K.]
| 4 | In fiscal 2019, we adopted Accounting Standards Update (“ASU”) 2016-02, Leases, as of the adoption date. Amounts reported for fiscal 2018 and prior years have not been adjusted, and continue to be reported in accordance with previous lease accounting guidance. See Note A to the Consolidated Financial Statements. | |
10-K.
| E-commerce Net Revenues | | | | | | | | | | | | | | | | | | | | |
| E-commerce net revenue growth | | | 10.9% | | | | 5.5% | | | | 4.4% | | | | 6.4% | | | | 12.1% | |
| E-commerce net revenues as a percent of net revenues | | | 54.3% | | | | 52.5% | | | | 51.8% | | | | 50.7% | | | | 50.5% | |
| Retail Net Revenues | | | | | | | | | | | | | | | | | | | | |
| Retail net revenue growth (decline) | | | 3.0% | | | | 2.6% | | | | (0.1% | ) | | | 5.4% | | | | 2.4% | |
| Retail net revenues as a percent of net revenues | | | 45.7% | | | | 47.5% | | | | 48.2% | | | | 49.3% | | | | 49.5% | |
| _4_ | _In fiscal 2015, we prospectively adopted Accounting Standards Update 2015-17, Balance Sheet Classification of Deferred Taxes, and now present both deferred tax assets and deferred tax liabilities as noncurrent in our Consolidated Balance Sheets. Prior balance sheets were not retrospectively adjusted and, as a result, working capital for fiscal 2014 may not be comparable to other years._ | |
##### [Table of Contents](#toc)
Item 8. FINANCIAL STATEMENTS AND SUPPLEMENTARY DATA
409 rewritten, 517 added, 179 removed, 331 unchanged
[removed: _Williams-Sonoma, Inc._][added: Williams-Sonoma, Inc.]
[removed: _Consolidated] [added: Consolidated] Statements of [removed: Earnings_][added: Earnings]
| [removed: _In] [added: In] thousands, except per share [removed: amounts_ |] [added: amounts] | | Fiscal [removed: 2018 (53] [added: 2019 (52] weeks) | | | | Fiscal [removed: 2017 (52] [added: 2018 (53] weeks) | | | | Fiscal [removed: 2016] [added: 2017] (52 weeks) | | [added: |]
| Net revenues | | [added: $] | [removed: 5,671,593] [added: 5,898,008] | | | [added: $] | [removed: 5,292,359] [added: 5,671,593] | | | [added: $] | [removed: 5,083,812] [added: 5,292,359] | |
| Cost of goods sold | | | [removed: 3,570,580] [added: 3,758,916] | | | | [removed: 3,360,648] [added: 3,570,580] | | | | [removed: 3,200,502] [added: 3,360,648] | |
| Gross profit | | | [removed: 2,101,013] [added: 2,139,092] | | | | [removed: 1,931,711] [added: 2,101,013] | | | | [removed: 1,883,310] [added: 1,931,711] | |
| Selling, general and administrative expenses | | | [removed: 1,665,060] [added: 1,673,218] | | | | [removed: 1,477,900] [added: 1,665,060] | | | | [removed: 1,410,711] [added: 1,477,900] | |
| Operating income | | | [removed: 435,953] [added: 465,874] | | | | [removed: 453,811] [added: 435,953] | | | | [removed: 472,599] [added: 453,811] | |
| Interest (income) expense, net | | | [removed: 6,706] [added: 8,853] | | | | [removed: 1,372] [added: 6,706] | | | | [removed: 688] [added: 1,372] | |
| Earnings before income taxes | | | [removed: 429,247] [added: 457,021] | | | | [removed: 452,439] [added: 429,247] | | | | [removed: 471,911] [added: 452,439] | |
| Income taxes | | | [removed: 95,563] [added: 100,959] | | | | [removed: 192,894] [added: 95,563] | | | | [removed: 166,524] [added: 192,894] | |
| Net earnings | | [removed: |] $ [removed: 333,684] | [added: 356,062] | | | $ [removed: 259,545] | [added: 333,684] | | | $ [removed: 305,387] | [added: 259,545] | [added: |]
| Basic earnings per share | | [removed: |] $ [removed: 4.10] | [added: 4.56] | | | $ [removed: 3.03] | [added: 4.10] | | | $ [removed: 3.45] | [added: 3.03] | [added: |]
| Diluted earnings per share | | [removed: |] $ [removed: 4.05] | [added: 4.49] | | | $ [removed: 3.02] | [added: 4.05] | | | $ [removed: 3.41] | [added: 3.02] | [added: |]
| Basic | | | [removed: 81,420] [added: 78,108] | | | | [removed: 85,592] [added: 81,420] | | | | [removed: 88,594] [added: 85,592] | |
| Diluted | | | [removed: 82,340] [added: 79,225] | | | | [removed: 86,080] [added: 82,340] | | | | [removed: 89,462] [added: 86,080] | |
[removed: _See] [added: See] Notes to Consolidated Financial [removed: Statements._][added: Statements.]
[removed: _Consolidated] [added: Consolidated] Statements of Comprehensive [removed: Income_][added: Income]
| [removed: _In thousands_ |] [added: In thousands] | | Fiscal [removed: 2018 (53] [added: 2019 (52] weeks) | | | | Fiscal [removed: 2017 (52] [added: 2018 (53] weeks) | | | | Fiscal [removed: 2016] [added: 2017] (52 weeks) | | [added: |]
| Foreign currency translation adjustments | | | [removed: (5,032] [added: (3,334] | ) | | | [removed: 3,730] [added: (5,032] | [added: )] | | | [removed: 1,523] [added: 3,730] | |
| Change in fair value of derivative financial instruments, net of tax (tax benefit) of [removed: $390, $(259)] [added: $195, $390] and [removed: $(327)] [added: $(259)] | | | [removed: 1,098] [added: 163] | | | | [removed: (715] [added: 1,098] | [removed: )] | | | [removed: (916] [added: (715] | ) |
| Reclassification adjustment for realized (gain) loss on derivative financial instruments, net of tax (tax benefit) of [removed: $122, $(38)] [added: $261, $122] and [removed: $(41)] [added: $(38)] | | | [removed: (357] [added: (343] | ) | | | [removed: 106] [added: (357] | [added: )] | | | 106 | |
| Comprehensive income | | [removed: |] $ [removed: 329,393] | [added: 352,548] | | | $ [removed: 262,666] | [added: 329,393] | | | $ [removed: 306,100] | [added: 262,666] | [added: |]
[removed: _Consolidated] [added: Consolidated] Balance [removed: Sheets_][added: Sheets]
| [removed: _In] [added: In] thousands, except per share [removed: amounts_] [added: amounts] | | Feb. [removed: 3, 2019] [added: 2, 2020] | | | | [removed: Jan. 28, 2018] [added: Feb. 3, 2019] | | |
| Cash and cash equivalents [added: at beginning of year] | | [removed: $] | 338,954 | | | [removed: $] | 390,136 | | [added: | | 213,713 | |]
| Accounts receivable, net | | | [removed: 107,102] [added: 111,737] | | | | [removed: 90,119] [added: 107,102] | |
| Merchandise inventories, net | | | [removed: 1,124,992] [added: 1,100,544] | | | | [removed: 1,061,593] [added: 1,124,992] | |
| Prepaid catalog expenses | | | — | | | | [removed: 20,517] [added: —] | | [added: | | (1,019 | ) |]
| Prepaid expenses | | | [removed: 101,356] [added: 90,426] | | | | [removed: 62,204] [added: 101,356] | |
| Other current assets | | | [removed: 21,939] [added: 20,766] | | | | [removed: 11,876] [added: 21,939] | |
| Total current assets | | | [removed: 1,694,343] [added: 1,755,635] | | | | [removed: 1,636,445] [added: 1,694,343] | |
| Property and equipment, net | | | [removed: 929,635] [added: 929,038] | | | | [removed: 932,283] [added: 929,635] | |
| Deferred income taxes, net | | | [removed: 44,055] [added: 47,977] | | | | [removed: 67,306] [added: 44,055] | |
| Goodwill | | | [removed: 85,382] [added: 85,343] | | | | [removed: 18,838] [added: 85,382] | |
| Other long-term assets, net | | | [removed: 59,429] [added: 69,666] | | | | [removed: 130,877] [added: 59,429] | |
| Total assets | | $ | [removed: 2,812,844] [added: 4,054,042] | | | $ | [removed: 2,785,749] [added: 2,812,844] | |
| Accounts payable | | $ | [removed: 526,702] [added: 521,235] | | | $ | [removed: 457,144] [added: 526,702] | |
| Accrued expenses | | | [removed: 163,559] [added: 175,003] | | | | [removed: 134,207] [added: 163,559] | |
| Gift card and other deferred revenue | | | [removed: 290,445] [added: 289,613] | | | | [removed: 300,607] [added: 290,445] | |
Williams-Sonoma, Inc.
See Notes to Consolidated Financial Statements.
Williams-Sonoma, Inc.
| Cash and cash equivalents | | $ | 432,162 | | | $ | 338,954 | |
| Operating lease right-of-use assets | | | 1,166,383 | | | | — | |
| Current debt | | | 299,818 | | | | — | |
| Operating lease liabilities | | | 227,923 | | | | — | |
| Long-term operating lease liabilities | | | 1,094,579 | | | | — | |
See Notes to Consolidated Financial Statements.
Williams-Sonoma, Inc.
| Net earnings | | | — | | | | — | | | | — | | | | 356,062 | | | | — | | | | — | | | | 356,062 | |
| Conversion/release of stock-based awards 1 | | | 649 | | | | 6 | | | | (27,624 | ) | | | — | | | | — | | | | (134 | ) | | | (27,752 | ) |
| Repurchases of common stock | | | (2,325 | ) | | | (23 | ) | | | (11,658 | ) | | | (136,195 | ) | | | — | | | | (958 | ) | | | (148,834 | ) |
| Dividends declared | | | — | | | | — | | | | — | | | | (156,103 | ) | | | — | | | | — | | | | (156,103 | ) |
| Adoption of accounting pronouncements 3 | | | — | | | | — | | | | — | | | | (3,303 | ) | | | — | | | | — | | | | (3,303 | ) |
| Balance at February 2, 2020 | | | 77,137 | | | $ | 772 | | | $ | 605,822 | | | $ | 644,794 | | | $ | (14,587 | ) | | $ | (941 | ) | | $ | 1,235,860 | |
| 3 | Relates to our adoption of ASU 2016-02, Leases, in fiscal 2019. See Note A. |
See Notes to Consolidated Financial Statements.
Williams-Sonoma, Inc.
| Net earnings | | $ | 356,062 | | | $ | 333,684 | | | $ | 259,545 | |
| Non-cash lease expense | | | 215,810 | | | | — | | | | — | |
| Operating lease liabilities | | | (226,257 | ) | | | — | | | | — | |
See Notes to Consolidated Financial Statements.
Williams-Sonoma, Inc.
e-commerce
websites, direct-mail catalogs and 614 stores.
These brands are also part of The Key Rewards, our
free-to-join
e-commerce
websites in certain locations.
In 2017, we acquired Outward, Inc., a
3-D
53-week
year.
Fiscal 2019, a
52-week
year, ended on February 2, 2020; Fiscal 2018, a
53-week
52-week
year, ended on January 28, 2018.
| --- | --- |
| | | | | | | | | | | | | |
| --- | --- | --- | --- | --- | --- | --- | --- | --- | --- | --- | --- | --- |
| E-commerce net revenues | | | $ 3,082,064 | | | | $ 2,778,457 | | | | $ 2,633,602 | |
| Retail net revenues | | | 2,589,529 | | | | 2,513,902 | | | | 2,450,210 | |
##### [Table of Contents](#toc)
| | | | | | | | | | | | | | | | | | | | | | | | | | | | | |
| Balance at January 31, 2016 | | | 89,563 | | | $ | 896 | | | $ | 541,307 | | | $ | 668,545 | | | $ | (10,616) | | | $ | (1,906 | ) | | $ | 1,198,226 | |
| Net earnings | | | — | | | | — | | | | — | | | | 305,387 | | | | — | | | | — | | | | 305,387 | |
| Exercise of stock-based awards and related tax effect | | | 39 | | | | — | | | | 4,762 | | | | — | | | | — | | | | — | | | | 4,762 | |
| Conversion/release of stock-based awards_1_ | | | 594 | | | | 6 | | | | (26,805 | ) | | | — | | | | — | | | | (263 | ) | | | (27,062 | ) |
| Repurchases of common stock | | | (2,871 | ) | | | (29 | ) | | | (12,684 | ) | | | (138,559 | ) | | | — | | | | — | | | | (151,272 | ) |
| Dividends declared | | | — | | | | — | | | | — | | | | (133,588 | ) | | | — | | | | — | | | | (133,588 | ) |
| Excess tax benefit related to stock-based awards | | | — | | | | — | | | | (4,894 | ) |
| Tax withholdings related to stock-based awards | | | (14,437 | ) | | | (18,130 | ) | | | (27,062 | ) |
| Excess tax benefit related to stock-based awards | | | — | | | | — | | | | 4,894 | |
| Proceeds related to stock-based awards | | | — | | | | — | | | | 1,532 | |
| Cash and cash equivalents at beginning of year | | | 390,136 | | | | 213,713 | | | | 193,647 | |
_Reclassifications_
Certain amounts reported in our Consolidated Balance Sheet as of January 28, 2018 and our Consolidated Statements of Cash Flows for the fifty-two weeks ended January 28, 2018 and January 29, 2017 have been reclassified in order to conform to the current period presentation.
These reclassifications impacted prepaid catalog expenses, prepaid expenses, goodwill, other long-term assets, accounts payable, accrued expenses, gift card and other deferred revenue and other current liabilities.
There was no change to total current assets, total assets, total current liabilities, or cash flows as a result of these reclassifications.
we consider current and anticipated demand, customer preferences and age of the merchandise.
We reserve for obsolescence based on historical trends, aging reports, specific identification and our estimates of future sales and selling prices.
Goodwill is not amortized, but rather is subject to
For leases that contain fixed escalations of the minimum annual lease payment during the original term of the lease, we recognize rent expense on a straight-line basis over the lease term, including the construction period, and record the difference between rent expense and the amount currently payable as deferred rent.
Deferred lease incentives include construction allowances received from landlords, which are amortized on a straight-line basis over the lease term, including the construction period.
For any store or facility closure where a lease obligation still exists, we record the estimated future liability associated with the rental obligation on the cease use date.
merchandise is transferred to the customer.
Prior to the adoption of Auditing Standards Update (“ASU”) 2014-09, _Revenue from Contracts with Customers_ in the first quarter of fiscal 2018, we recorded a reserve for estimated product returns, net of cost of merchandise inventory to be returned, within other current liabilities.
For fiscal 2017 and fiscal 2016, the opening balance of our sales returns reserve was $16,058,000 and $19,113,000, respectively.
For fiscal 2017 and fiscal 2016, provision for sales returns was $302,320,000 and $303,694,000, respectively, and actual sales returns were $306,536,000 and $306,749,000, respectively.
The closing balance of our sales returns reserve was $11,842,000 and $16,058,000 for fiscal 2017 and fiscal 2016, respectively.
In May 2014, the Financial Accounting Standards Board (“FASB”) issued ASU 2014-09, _Revenue from Contracts with Customers_, to clarify the principles of recognizing revenue and create common revenue recognition guidance between U.S. GAAP and International Financial Reporting Standards.
We adopted the ASU on a modified retrospective basis in the first quarter of fiscal 2018 and applied the guidance therein to all applicable contracts that were not complete as of the date of application.
As a result, we recorded an increase to opening retained earnings as of January 29, 2018 of approximately $17,862,000, net of tax, for the cumulative effect adjustments of adopting the ASU.
The adoption of this standard most significantly impacted our Consolidated Financial Statements due to:
| | • | | the reclassification from selling, general and administrative expenses into net revenues for certain incentives received from credit card issuers, |
| --- | --- | --- | --- |
| | • | | the reclassification of breakage income related to our unredeemed stored-value cards from selling, general and administrative expenses into net revenues, as well as the acceleration in the timing of recognizing breakage income, |
An excerpt. Shown here: 40 of 409 rewritten, 40 of 517 added and 40 of 179 removed. The counts are complete. For every sentence, read Item 8. FINANCIAL STATEMENTS AND SUPPLEMENTARY DATA in the FY2019 filing and the FY2019 filing.
Item 9A. CONTROLS AND PROCEDURES
9 rewritten, 6 added, 2 removed, 6 unchanged
[removed: _Evaluation] [added: Evaluation] of Disclosure Controls and [removed: Procedures_][added: Procedures]
As of February [removed: 3, 2019,] [added: 2, 2020,] an evaluation was performed by management, with the participation of our Chief Executive Officer (“CEO”) and our Chief Financial Officer (“CFO”), of the effectiveness of our disclosure controls and procedures.
[added: Based on that evaluation,] our [added: management, including our CEO and CFO, concluded that our] disclosure controls and procedures are effective to ensure that information we are required to disclose in reports that we file or submit under the Securities Exchange Act of 1934 is accumulated and communicated to our management, including our CEO and CFO, as appropriate, to allow for timely discussions regarding required [removed: disclosures, and that such information is recorded, processed, summarized and reported within the time periods specified in the rules and forms of the SEC.]
[removed: _Management’s] [added: Management’s] Report on Internal Control Over Financial [removed: Reporting_][added: Reporting]
Our management assessed the effectiveness of the company’s internal control over financial reporting as of February [removed: 3, 2019.][added: 2, 2020.]
[removed: In making this assessment, we used the criteria set forth by the Committee of Sponsoring Organizations of the Treadway Commission (COSO) in _Internal Control-Integrated Framework (2013)._] Based on our assessment using those criteria, our management concluded that, as of February [removed: 3, 2019,] [added: 2, 2020,] our internal control over financial reporting is effective.
Our independent registered public accounting firm audited the Consolidated Financial Statements included in this Annual Report on Form [removed: 10-K and the company’s internal control over financial reporting.]
Their audit report appears on pages 65 [removed: and 66] [added: through 68] of this Annual Report on Form [removed: 10-K.]
[removed: _Changes] [added: Changes] in Internal Control Over Financial [removed: Reporting_][added: Reporting]
disclosures, and that such information is recorded, processed, summarized and reported within the time periods specified in the rules and forms of the SEC.
In making this assessment, we used the criteria set forth by the Committee of Sponsoring Organizations of the Treadway Commission (COSO) in
Internal Control-Integrated Framework (2013).
10-K
and the company’s internal control over financial reporting.
10-K.
Based on that evaluation, our management, including our CEO and CFO, concluded that
##### [Table of Contents](#toc)
Item 9B. OTHER INFORMATION
1 rewritten, 1 added, 3 removed, 1 unchanged
[removed: PART III][added: PART III]
None.
On April 3, 2019, the Company’s Compensation Committee adopted the Amended and Restated 2012 EVP Level Management Retention Plan (the “MRP”).
The terms of the MRP are substantially identical to the terms of the Company’s 2012 EVP Level Management Retention Plan adopted on November 1, 2012 by the Company’s Compensation Committee, which terms were described in the Company’s Current Report on Form 8-K as filed with the Commission on November 7, 2012.
##### [Table of Contents](#toc)
Item 10. DIRECTORS, EXECUTIVE OFFICERS AND CORPORATE GOVERNANCE
1 rewritten, 1 added, 0 removed, 1 unchanged
Information required by this Item is incorporated by reference herein to information under the headings “Election of Directors,” “Information Concerning Executive Officers,” “Audit and Finance Committee Report,” “Corporate Governance — Corporate Governance Guidelines and Code of Business Conduct and Ethics,” [added: and] “Corporate Governance — Audit and Finance Committee” [removed: and “Section 16(a) Beneficial Ownership Reporting Compliance”] in our Proxy Statement for the [removed: 2019] [added: 2020] Annual Meeting of Stockholders (the “Proxy Statement”).
With regard to the information required by this item regarding compliance with Section 16(a) of the Exchange Act, we will provide disclosure of delinquent Section 16(a) reports, if any, in our Proxy Statement, and such disclosure, if any, is incorporated herein by reference.
Item 14. PRINCIPAL ACCOUNTANT FEES AND SERVICES
1 rewritten, 0 added, 1 removed, 2 unchanged
[removed: PART IV][added: PART IV]
##### [Table of Contents](#toc)
Item 15. EXHIBITS AND FINANCIAL STATEMENT SCHEDULES
71 rewritten, 95 added, 12 removed, 5 unchanged
| [removed: (a)(1)] | [added: (a] | [added: )(1) | |] Financial Statements: | | | | |
| | | [added: | |] The following Consolidated Financial Statements of Williams-Sonoma, Inc. and subsidiaries and the related notes are filed as part of this report pursuant to Item 8: | | | | |
| | | | | [removed: PAGE] | | [added: PAGE] | [added: | |]
| | | [added: | |] [Consolidated Statements of [removed: Earnings](#tx683578_22)] [added: Earnings](#tx856872_22)] | | | [removed: 40] [added: 41] | |
| | | [added: | |] [Consolidated Statements of Comprehensive [removed: Income](#tx683578_23)] [added: Income](#tx856872_23)] | | | [removed: 40] [added: 41] | |
| | | [added: | |] [Consolidated Balance [removed: Sheets](#tx683578_24)] [added: Sheets](#tx856872_24)] | | | [removed: 41] [added: 42] | |
| | | [added: | |] [Consolidated Statements of Stockholders’ [removed: Equity](#tx683578_25)] [added: Equity](#tx856872_25)] | | | [removed: 42] [added: 43] | |
| | | [added: | |] [Consolidated Statements of Cash [removed: Flows](#tx683578_26)] [added: Flows](#tx856872_26)] | | | [removed: 43] [added: 44] | |
| | | [added: | |] [Notes to Consolidated Financial [removed: Statements](#tx683578_27)] [added: Statements](#tx856872_27)] | | | [removed: 44] [added: 45] | |
| | | [added: | |] [Report of Independent Registered Public Accounting [removed: Firm](#tx683578_28)] [added: Firm](#tx856872_28)] | | | 65 | |
| | | [added: | |] [Quarterly Financial [removed: Information](#tx683578_29)] [added: Information](#tx856872_29)] | | | [removed: 67] [added: 68] | |
| [removed: (a)(2)] | [added: (a] | [added: )(2) | |] Financial Statement Schedules: Schedules have been omitted because they are not required, are not applicable, or because the required information, where material, is included in the financial statements, notes, or supplementary financial information. | | | | |
| [removed: (a)(3)] | [added: (a] | [added: )(3) | |] Exhibits: The exhibits listed in the below Exhibit Index are filed or incorporated by reference as part of this Form 10-K | | | | |
| [removed: (b)] | [added: (b] | [added: ) | |] Exhibits: The exhibits listed in the below Exhibit Index are filed or incorporated by reference as part of this Form 10-K | | | | |
| [removed: (c)] | [added: (c] | [added: ) | |] Financial Statement Schedules: Schedules have been omitted because they are not required or are not applicable. | | | | |
[removed: Exhibit Index][added: Exhibit Index]
| [removed: CERTIFICATE] [added: CERTIFICATE] OF INCORPORATION AND [removed: BYLAWS] [added: BYLAWS] | | | [added: | |]
| [added: |] 3.1 | | [added: |] [Amended and Restated Certificate of Incorporation (incorporated by reference to Exhibit 3.1 to the Company’s Current Report on Form 8-K as filed with the Commission on May 25, 2011, File No. 001-14077)](http://www.sec.gov/Archives/edgar/data/719955/000119312511150431/dex31.htm) |
| [added: |] 3.2 | | [added: |] [Amended and Restated Bylaws (incorporated by reference to Exhibit 3.1 to the Company’s Current Report on Form 8-K as filed with the Commission on June 2, 2017, File No. 001-14077)](http://www.sec.gov/Archives/edgar/data/719955/000119312517193028/d406732dex31.htm) |
| [removed: INSTRUMENTS] [added: INSTRUMENTS] DEFINING THE RIGHTS OF SECURITY HOLDERS, INCLUDING [removed: INDENTURES] [added: INDENTURES] | | | [added: | |]
| [added: |] 4.1 | | [added: |] [Form of Common Stock Certificate (incorporated by reference to Exhibit 4.1 to the Company’s Current Report on Form 8-K as filed with the Commission on May 25, 2011, File No. [removed: 001-14077)](http://www.sec.gov/Archives/edgar/data/719955/000119312511150431/dex41.htm)] [added: 001-14077)](https://www.sec.gov/Archives/edgar/data/719955/000119312520088937/d856872dex42.htm)] |
| [removed: FINANCING AGREEMENTS] [added: FINANCING AGREEMENTS] | | | [added: | |]
| [added: |] 10.1 | | [added: |] [Seventh Amended and Restated Credit Agreement, dated January 8, 2018, between the Company and Bank of America, N.A., as administrative agent, letter of credit issuer and swingline lender, Wells Fargo Bank, National Association, as syndication agent and the lenders party thereto (incorporated by reference to Exhibit 10.1 to the Company’s Annual Report on Form 10-K for the fiscal year ended January 28, 2018 as filed with the Commission on March 29, 2018, File No. 001-14077)](http://www.sec.gov/Archives/edgar/data/719955/000119312518102232/d689546dex101.htm) |
| [added: |] 10.2 | | [added: |] [Reimbursement Agreement between the Company, Williams-Sonoma Singapore Pte. Ltd. and Bank of America, N.A., dated as of August 30, 2013 (incorporated by reference to Exhibit 10.1 to the Company’s Quarterly Report on Form 10-Q for the period ended November 3, 2013 as filed with the Commission on December 12, 2013, File No. 001-14077)](http://www.sec.gov/Archives/edgar/data/719955/000119312513471753/d613006dex101.htm) |
| [added: |] 10.3 | | [added: |] [First Amendment to Reimbursement Agreement between the Company, Williams-Sonoma Singapore Pte. Ltd., and Bank of America, N.A., dated as of August 29, 2014 (incorporated by reference to Exhibit 10.1 to the Company’s Quarterly Report on Form 10-Q for the period ended November 2, 2014 as filed with the Commission on December 5, 2014, File No. 001-14077)](http://www.sec.gov/Archives/edgar/data/719955/000119312514434838/d798275dex101.htm) |
| [added: |] 10.4 | | [added: |] [Second Amendment to Reimbursement Agreement between the Company, Williams-Sonoma Singapore Pte. Ltd., and Bank of America, N.A., dated as of August 28, 2015 (incorporated by reference to Exhibit 10.1 to the Company’s Quarterly Report on Form 10-Q for the period ended November 1, 2015 as filed with the Commission on December 11, 2015, File No. 001-14077)](http://www.sec.gov/Archives/edgar/data/719955/000119312515401464/d39336dex101.htm) |
| [added: |] 10.5 | | [added: |] [Third Amendment to Reimbursement Agreement between the Company, Williams-Sonoma Singapore Pte. Ltd., and Bank of America, N.A., dated as of August 26, 2016 (incorporated by reference to Exhibit 10.1 to the Company’s Quarterly Report on Form 10-Q for the period ended October 30, 2016 as filed with the Commission on December 7, 2016, File No. 001-14077)](http://www.sec.gov/Archives/edgar/data/719955/000119312516787485/d268653dex101.htm) |
| [added: |] 10.6 | | [added: |] [Fourth Amendment to Reimbursement Agreement between the Company, Williams-Sonoma Singapore Pte. Ltd., and Bank of America, N.A., dated as of August 25, 2017 (incorporated by reference to Exhibit 10.1 to the Company’s Quarterly Report on Form 10-Q for the period ended October 29, 2017 as filed with the Commission on December 6, 2017, File No. 001-14077)](http://www.sec.gov/Archives/edgar/data/719955/000119312517362895/d466116dex101.htm) |
| [added: |] 10.7 | | [added: |] [Fifth Amendment to Reimbursement Agreement between the Company, Williams-Sonoma Singapore Pte. Ltd., and Bank of America, N.A., dated as of August 24, 2018 (incorporated by reference to Exhibit 10.1 to the Company’s Quarterly Report on Form 10-Q for the period ended October 28, 2018 as filed with the Commission on December 7, 2018, File No. 001-12077)](http://www.sec.gov/Archives/edgar/data/719955/000119312518344956/d563678dex101.htm) |
| [removed: 10.8] | [added: 10.9] | [added: | |] [Reimbursement Agreement between the Company, Williams-Sonoma Singapore Pte. Ltd., and Wells Fargo Bank, N.A., dated as of August 30, 2013 (incorporated by reference to Exhibit 10.2 to the Company’s Quarterly Report on Form 10-Q for the period ended November 3, 2013 as filed with the Commission on December 12, 2013, File No. 001-14077)](http://www.sec.gov/Archives/edgar/data/719955/000119312513471753/d613006dex102.htm) |
| [removed: 10.9] | [added: 10.10] | [added: | |] [First Amendment to Reimbursement Agreement between the Company, Williams-Sonoma Singapore Pte. Ltd., and Wells Fargo Bank, N.A., dated as of August 29, 2014 (incorporated by reference to Exhibit 10.2 to the Company’s Quarterly Report on Form 10-Q for the period ended November 2, 2014 as filed with the Commission on December 5, 2014, File No. 001-14077)](http://www.sec.gov/Archives/edgar/data/719955/000119312514434838/d798275dex102.htm) |
| [removed: 10.10] | [added: 10.11] | [added: | |] [Second Amendment to Reimbursement Agreement between the Company, Williams-Sonoma Singapore Pte. Ltd., and Wells Fargo Bank, N.A., dated as of August 28, 2015 (incorporated by reference to Exhibit 10.2 to the Company’s Quarterly Report on Form 10-Q for the period ended November 1, 2015 as filed with the Commission on December 11, 2015, File No. 001-14077)](http://www.sec.gov/Archives/edgar/data/719955/000119312515401464/d39336dex102.htm) |
| [removed: 10.11] | [added: 10.12] | [added: | |] [Third Amendment to Reimbursement Agreement between the Company, Williams-Sonoma Singapore Pte. Ltd., and Wells Fargo Bank, N.A., dated as of August 26, 2016 (incorporated by reference to Exhibit 10.2 to the Company’s Quarterly Report on Form 10-Q for the period ended October 30, 2016 as filed with the Commission on December 7, 2016, File No. 001-14077)](http://www.sec.gov/Archives/edgar/data/719955/000119312516787485/d268653dex102.htm) |
| [removed: 10.12] | [added: 10.13] | [added: | |] [Fourth Amendment to Reimbursement Agreement between the Company, Williams-Sonoma Singapore Pte. Ltd., and Wells Fargo Bank, N.A., dated as of August 25, 2017 (incorporated by reference to Exhibit 10.1 to the Company’s Quarterly Report on Form 10-Q for the period ended October 29, 2017 as filed with the Commission on December 6, 2017, File No. 001-14077)](http://www.sec.gov/Archives/edgar/data/719955/000119312517362895/d466116dex101.htm) |
| [removed: 10.13] | [added: 10.14] | [added: | |] [Fifth Amendment to Reimbursement Agreement between the Company, Williams-Sonoma Singapore Pte. Ltd., and Wells Fargo Bank, N.A., dated as of August 24, 2018 (incorporated by reference to Exhibit 10.2 to the Company’s Quarterly Report on Form 10-Q for the period ended October 28, 2018 as filed with the Commission on December 7, 2018, File No.001-14077)](http://www.sec.gov/Archives/edgar/data/719955/000119312518344956/d563678dex102.htm) |
| [removed: 10.14] | [added: 10.16] | [added: | |] [Reimbursement Agreement between the Company, Williams-Sonoma Singapore Pte. Ltd., and U.S. Bank National Association, dated as of August 30, 2013 (incorporated by reference to Exhibit 10.3 to the Company’s Quarterly Report on Form 10-Q for the fiscal quarter ended November 3, 2013 as filed with the Commission on December 12, 2013, File No. 001-14077)](http://www.sec.gov/Archives/edgar/data/719955/000119312513471753/d613006dex103.htm) |
| [removed: 10.15] | [added: 10.17] | [added: | |] [First Amendment to Reimbursement Agreement between the Company, Williams-Sonoma Singapore Pte. Ltd., and U.S. Bank National Association, dated as of August 29, 2014 (incorporated by reference to Exhibit 10.3 to the Company’s Quarterly Report on Form 10-Q for the fiscal quarter ended November 2, 2014 as filed with the Commission on December 5, 2014, File No. 001-14077)](http://www.sec.gov/Archives/edgar/data/719955/000119312514434838/d798275dex103.htm) |
| [removed: 10.16] | [added: 10.18] | [added: | |] [Second Amendment to Reimbursement Agreement between the Company, Williams-Sonoma Singapore Pte. Ltd., and U.S. Bank National Association, dated as of August 28, 2015 (incorporated by reference to Exhibit 10.3 to the Company’s Quarterly Report on Form 10-Q for the period ended November 1, 2015 as filed with the Commission on December 11, 2015, File No. 001-14077)](http://www.sec.gov/Archives/edgar/data/719955/000119312515401464/d39336dex103.htm) |
| [removed: 10.17] | [added: 10.19] | [added: | |] [Third Amendment to Reimbursement Agreement between the Company, Williams-Sonoma Singapore Pte. Ltd., and U.S. Bank National Association, dated as of August 26, 2016 (incorporated by reference to Exhibit 10.3 to the Company’s Quarterly Report on Form 10-Q for the period ended October 30, 2016 as filed with the Commission on December 7, 2016, File No. 001-14077)](http://www.sec.gov/Archives/edgar/data/719955/000119312516787485/d268653dex103.htm) |
| [removed: 10.18] | [added: 10.20] | [added: | |] [Fourth Amendment to Reimbursement Agreement between the Company, Williams-Sonoma Singapore Pte. Ltd., and U.S. Bank National Association, dated as of August 25, 2017 (incorporated by reference to Exhibit 10.3 to the Company’s Quarterly Report on Form 10-Q for the period ended October 29, 2017 as filed with the Commission on December 6, 2017, File No. 001-14077)](http://www.sec.gov/Archives/edgar/data/719955/000119312517362895/d466116dex103.htm) |
| | | | | | | | | |
| --- | --- | --- | --- | --- | --- | --- | --- | --- |
| | | | | | | | | |
| | | | | | | | | |
| | | | | | | | | |
| | | | | | | | | |
| | | | | | | | | |
| | | | | | | | | |
| | | | | | | | | |
| | | | | | | | | |
| | | | | | | | | |
| | | | | | | | | |
| | | | | | | | | |
| | | | | | | | | |
| | | | | | | | | |
| | | | | | | | | |
| | | | | | | | | |
| | | | | |
| --- | --- | --- | --- | --- |
| | | | | |
| | | | | |
| | | | | |
| | | | | |
| | | | | |
| | 4.2 | * | | [Description of the Registrant’s Securities Registered Pursuant to Section 12 of the Securities Exchange Act of 1934](https://www.sec.gov/Archives/edgar/data/719955/000119312520088937/d856872dex42.htm) |
| | | | | |
| --- | --- | --- | --- | --- |
| | | | | |
| | | | | |
| | | | | |
| | | | | |
| | | | | |
| | | | | |
| | | | | |
| | | | | |
| | 10.8 | | | [Sixth Amendment to Reimbursement Agreement between the Company, Williams-Sonoma Singapore Pte. Ltd., and Bank of America, N.A., dated as of August 23, 2019 (incorporated by reference to Exhibit 10.1 to the Company’s Quarterly Report on Form 10-Q for the period ended November 3, 2019 as filed with the Commission on December 12, 2019, File No. 001-14077)](http://www.sec.gov/Archives/edgar/data/719955/000119312518344956/d563678dex101.htm) |
| | | | | |
| | | | | |
| | | | | |
| | | | | |
| | | | | | | |
| --- | --- | --- | --- | --- | --- | --- |
| | | |
| --- | --- | --- |
##### [Table of Contents](#toc)
| 10.35+* | | [Amended and Restated 2012 EVP Level Management Retention Plan](https://www.sec.gov/Archives/edgar/data/719955/000119312519097973/d683578dex1035.htm) |
| 101.INS* | | XBRL Instance Document |
| 101.SCH* | | XBRL Taxonomy Extension Schema Document |
| 101.CAL* | | XBRL Taxonomy Extension Calculation Linkbase Document |
| 101.DEF* | | XBRL Taxonomy Extension Definition Linkbase Document |
| 101.LAB* | | XBRL Taxonomy Extension Label Linkbase Document |
| 101.PRE* | | XBRL Taxonomy Extension Presentation Linkbase Document |
An excerpt. Shown here: 40 of 71 rewritten, 40 of 95 added and all 12 removed. The counts are complete. For every sentence, read Item 15. EXHIBITS AND FINANCIAL STATEMENT SCHEDULES in the FY2019 filing and the FY2019 filing.
Item 16. FORM 10-K SUMMARY
12 rewritten, 7 added, 11 removed, 31 unchanged
[removed: SIGNATURES][added: SIGNATURES]
| | | | | [removed: | |] WILLIAMS-SONOMA, INC. | | |
| Date: [removed: April 4, 2019 | |] [added: March 27, 2020] | | | | By | | /s/ LAURA ALBER |
| | | | | | | [removed: | |] Chief Executive Officer |
| Date: [removed: April 4, 2019] [added: March 27, 2020] | | /s/ ADRIAN BELLAMY |
| Date: [removed: April 4, 2019] [added: March 27, 2020] | | /s/ LAURA ALBER |
| | | Chief Executive Officer [added: and Director] |
| Date: [removed: April 4, 2019] [added: March 27, 2020] | | /s/ JULIE WHALEN |
| Date: [removed: April 4, 2019] [added: March 27, 2020] | | /s/ ANNE MULCAHY |
| Date: [removed: April 4, 2019] [added: March 27, 2020] | | /s/ GRACE PUMA |
| Date: [removed: April 4, 2019] [added: March 27, 2020] | | /s/ SABRINA SIMMONS |
| Date: [removed: April 4, 2019] [added: March 27, 2020] | | /s/ FRITS VAN PAASSCHEN |
| | | | | | | |
| --- | --- | --- | --- | --- | --- | --- |
| | | | | | | |
| Date: March 27, 2020 | | /s/ SCOTT DAHNKE |
| | | Scott Dahnke |
| Date: March 27, 2020 | | /s/ WILLIAM READY |
| | | William Ready |
##### [Table of Contents](#toc)
| | | | | | | | | |
| --- | --- | --- | --- | --- | --- | --- | --- | --- |
| | | |
| Date: April 4, 2019 | | /s/ ANTHONY GREENER |
| | | Anthony Greener |
| | | Director |
| Date: April 4, 2019 | | /s/ ROBERT LORD |
| | | Robert Lord |
| Date: April 4, 2019 | | /s/ CHRISTIANA SMITH SHI |
| | | Christiana Smith Shi |
Item 1B. UNRESOLVED STAFF COMMENTS
0 rewritten, 0 added, 1 removed, 0 unchanged
Dropped this year
None.