 filings.tools
Williams-Sonoma (WSM) 10-K risk factor changes: FY2020 vs FY2019
The 2021-01-31 10-K against the 2020-02-02 one, compared heading by heading and sentence by sentence.
Item 1A119 rewritten184 added68 removed430 unchanged
All filing items766 rewritten662 added487 removed1,613 unchanged
Summary
counted, not written
- Item 1A headings could not be compared: only 0 carried over between the two years, which usually means one filing was read wrongly, so none is reported as new or removed.
- Sentence by sentence, 662 added, 487 removed, 766 rewritten and 1,613 unchanged across 15 items that differ.
- New this year: Item 1B. UNRESOLVED STAFF COMMENTS.
Sentences by item
22 items, with every count and a link to each item that changed
Underlined words on a shaded ground are new in FY2020; struck-through words were in FY2019. Sentences that are wholly new or wholly gone are labelled rather than marked.
Item 1A. RISK FACTORS
119 rewritten, 184 added, 68 removed, 430 unchanged
You should carefully consider such risks and uncertainties, together with the other information contained in this report and in our other public [removed: filings.][added: filings before investing in our common stock.]
The [removed: Coronavirus (or]
[removed: As a result] [added: In March 2020, we announced the temporary closures] of [removed: these developments,] [added: all of our retail store operations] to protect our employees, customers and the communities in which we [removed: operate, on March 17, 2020, we announced we will be temporarily closing all of our U.S.] [added: operate] and [removed: Canadian retail stores until at least April 2, 2020 depending upon how] [added: to help contain] the
[removed: In addition, we] [added: We] have [added: also] implemented [added: temporary] work-from-home policies for certain [removed: employees.][added: employees, which continue to be in effect.]
[removed: shelter-in-place][added: “shelter-in-place”.]
e-commerce [added: websites]
[removed: sites and our distribution centers remain open and operational through the date of filing of this Annual Report, governmental mandates or] [added: Governmental mandates,] illness or [added: the] absence of a substantial number of distribution center employees [removed: could] [added: may] require [added: in the future] that we temporarily close one or more of our distribution centers, or may prohibit or significantly limit us, or our [removed: third party] [added: third-party] logistics providers from delivering packages to our customers and our stores, which [removed: would] [added: could] complicate or prevent [removed: our] [added: us from] fulfilling
orders [removed: and, once some or all of our stores reopen, would] [added: and could] complicate or prevent our ability to supply merchandise to our stores.
Further, [removed: quarantines,]
[added: related containment efforts and illnesses could also impact our vendors who manufacture or] deliver our merchandise to us or our customers, which could adversely affect our ability to acquire and sell our merchandise, thus adversely affecting our results of operations, cash flows and liquidity.
[added: pandemic] continues to rapidly evolve.
[removed: impacts] [added: pandemic on] our results, financial position and liquidity will depend on future developments, which are highly uncertain and cannot be predicted, [added: such as the transmission rate of the disease,] including [added: the impact from] new [removed: information which may emerge concerning] [added: variants,] the [removed: severity] [added: extent and effectiveness] of [removed: the pandemic] [added: containment actions] and [added: vaccination rollout, particularly as areas are reopened, and] the [removed: actions to contain][added: impact of these and other factors on our stores, offices, employees, distributors, vendors and customers.]
Our business depends on consumer demand for our products and, consequently, is sensitive to a number of factors that influence consumer spending, including general economic conditions, consumer disposable income, fuel prices, recession and fears of recession, unemployment, war and fears of war, outbreaks of disease (such as the [removed: recent]
[removed: outbreak),] [added: pandemic),] adverse weather, availability of consumer credit, consumer debt levels, conditions in the housing market, interest rates, sales tax rates and rate increases, inflation, consumer confidence in future economic and political conditions, and consumer perceptions of personal well-being and security.
[removed: While we have a growing balance of cash that is held offshore, we] [added: We] currently believe that our available [removed: cash,] cash [removed: equivalents] and cash flow from operations will be sufficient to finance our operations and expected capital requirements for at least the next 12 months unless our retail stores and distribution centers are closed for an extended period of time or we experience a material decline in [removed: revenue relating] [added: revenue, for example, due] to the
However, we might experience periods during which we encounter additional cash needs, and we might need additional [removed: external funding to support our operations.]
Although our credit [removed: facility provides] [added: facilities provide] for a [removed: $500,000,000] [added: total of $700,000,000 in] unsecured revolving [removed: line] [added: lines] of [removed: credit and a $300,000,000 unsecured term loan facility,] [added: credit,] in the event we require additional liquidity from our lenders, such funds may not be available to us on acceptable terms, or at all.
[removed: outbreak,] [added: In addition, in the event we were to breach any of] our [added: financial covenants, our] banks would not be required to provide us with additional funding, or they may require us to renegotiate our existing credit facility on less favorable terms.
In addition, we may not be able to renew our letters of credit that we use to help pay our suppliers, or our [removed: unsecured term loan facility,] [added: credit facilities,] on terms that are acceptable to us, or at all, as the availability of credit facilities may become limited.
[removed: Alternatively, we may be] required to mark down certain products to sell any excess inventory or to sell such inventory through our outlet stores or other liquidation channels at prices which are significantly lower than our retail prices, any of which would negatively impact our business and operating results.
In addition, a significant portion of sales made through our retail channel require the [added: collection of certain customer data, such as credit card information.]
If we are the target of a cybersecurity attack resulting in unauthorized disclosure of our customer data, we may be required to undertake [removed: costly notification procedures.]
As our business expands globally, we are subject to data privacy and other similar laws in various foreign jurisdictions, such as [removed: GDPR] [added: the General Data Protection Regulation (“GDPR”)] in the European [removed: Union.][added: Union and the CCPA.]
The GDPR, CCPA and other such laws and regulations impose new and burdensome obligations, and include substantial uncertainty as to their interpretation, and we may face [added: challenges in addressing their requirements, which could result in fines or penalties, lead us to change our data privacy policies and practices and limit our ability to deliver personalized advertising.]
channel has been our fastest growing business over the last several years and [removed: represents] [added: represented] more than [removed: half] [added: 70%] of our [removed: sales] [added: net revenues] and [removed: profits.][added: profits in fiscal 2020.]
and mobile websites and digital marketing efforts, including: changes in required technology interfaces; website downtime and other technical failures; internet connectivity issues; costs and technical issues as we upgrade our website software; computer viruses; vendor reliability; changes in applicable federal and state regulations, such as the [removed: CCPA,] [added: California Consumer Privacy Act (“CCPA”),] and related compliance costs; security breaches; and consumer privacy concerns.
Approximately 65% of our merchandise purchases in fiscal [removed: 2019] [added: 2020] were sourced from foreign vendors predominantly in Asia and Europe.
We, and our foreign vendors, are also subject to other risks and uncertainties associated with changing economic, political, social, health and environmental conditions and regulations within and outside of the U.S. These risks and uncertainties include import duties and quotas, compliance with anti-dumping regulations, work stoppages, economic uncertainties and adverse economic conditions (including inflation and recession), government [added: regulations, trade restrictions, regulations to address climate change, employment and labor matters, wars and fears of war, political unrest, acts of terrorism, natural disasters, adverse weather, climate change, outbreaks of disease (such as the]
[removed: outbreak),] [added: pandemic),] and other unexpected events.
Furthermore, some or all of our foreign vendors’ operations may be adversely affected by political and financial instability resulting in the disruption of trade from exporting countries, restrictions on the transfer of funds and/or increased tariffs or quotas, war, political unrest, acts of terrorism, natural disasters, adverse weather, [removed: climate change, outbreaks of disease or other trade disruptions.]
For example, the [removed: recent]
[removed: outbreak] [added: pandemic] has [removed: the potential to significantly impact] [added: impacted] our supply chain [removed: if the] [added: by forcing some] factories that manufacture our merchandise [removed: are] [added: to] temporarily [removed: closed] [added: close] or experience worker shortages [removed: or if] [added: and by causing delays in] international [removed: shipping is impacted.][added: shipping.]
In addition, we are subject to certain risks that could limit our vendors’ ability to provide us with quality merchandise on a timely basis and at prices that are commercially acceptable to us, including risks related to the availability of raw materials, labor disputes, work disruptions or stoppages, union organizing activities, vendor financial liquidity, adverse weather, natural disasters, political unrest, war, acts of terrorism, [added: outbreaks of disease (such as the]
[added: affected by natural disasters,] outbreaks of disease (such as the [removed: recent]
[removed: outbreak),] [added: pandemic),] general economic and political conditions and regulations to address climate change.
For example, [removed: if] [added: certain of] our vendors [removed: suffer prolonged] [added: have experienced] work disruptions or stoppages, or transportation or other restrictions, due to [removed: public health conditions such as] the [removed: recent]
[removed: Additionally, changes to the legislative or] regulatory framework regarding product safety or quality may subject companies like ours to more product recalls and result in higher recall-related expenses.
Additionally, global economic or political instability, work disruptions or stoppages, or outbreaks of [removed: diseases, such] [added: diseases (such] as the [removed: recent]
[removed: outbreak,] [added: pandemic),] may delay or harm our efforts to expand globally.
We have unaffiliated franchisees that operate stores in the Middle East, the Philippines, [removed: Mexico and] [added: Mexico,] South Korea, [added: and India,] as well as
Risk Factor Summary
The following is a summary of the risks and uncertainties that could cause our business, financial condition or operating results to be harmed.
We encourage you to carefully review the full risk factors contained in this report in their entirety for additional information regarding these risks and uncertainties.
Risks Related to Our Business
| | • | | Our business has been and may continue to be materially impacted by the COVID-19 pandemic, and the duration and extent to which this will impact our future financial performance remains uncertain. |
| --- | --- | --- | --- |
| | • | | Declines in general economic conditions, and the resulting impact on consumer confidence and consumer spending, could adversely impact our results of operations. |
| --- | --- | --- | --- |
| | • | | We are unable to control many of the factors affecting consumer spending, and declines in consumer spending on home furnishings and kitchen products in general could reduce demand for our products. |
| --- | --- | --- | --- |
| | • | | If we are unable to identify and analyze factors affecting our business, anticipate changing consumer preferences and buying trends, and manage our inventory commensurate with customer demand, our sales levels and operating results may decline. |
| --- | --- | --- | --- |
| | • | | Our business and operating results may be harmed if we are unable to timely and effectively deliver merchandise to our stores and customers. |
| --- | --- | --- | --- |
| | • | | Our failure to successfully manage our order-taking and fulfillment operations could have a negative impact on our business and operating results . |
| --- | --- | --- | --- |
| | • | | We must protect and maintain our brand image and reputation. |
| --- | --- | --- | --- |
| | • | | Our sales may be negatively impacted by increasing competition from companies with brands or products similar to ours. |
| --- | --- | --- | --- |
| | • | | Our facilities and systems, as well as those of our vendors, are vulnerable to natural disasters, adverse weather conditions, technology issues and other unexpected events, any of which could result in an interruption in our business and harm our operating results. |
| --- | --- | --- | --- |
| | • | | If we are unable to effectively manage our e-commerce business and digital marketing efforts, our reputation and operating results may be harmed. |
| --- | --- | --- | --- |
| | • | | Declines in our comparable brand revenues may harm our operating results and cause a decline in the market price of our common stock. |
| --- | --- | --- | --- |
| | • | | Our failure to successfully anticipate merchandise returns might have a negative impact on our business. |
| --- | --- | --- | --- |
| | • | | Our failure to successfully manage the costs and performance of our catalog mailings might have a negative impact on our business. |
| --- | --- | --- | --- |
| | • | | If we are unable to successfully manage the complexities associated with an omni-channel and multi-brand business, we may suffer declines in our existing business and our ability to attract new business. |
| --- | --- | --- | --- |
| | • | | A number of factors that affect our ability to successfully open new stores or close existing stores are beyond our control, and these factors may harm our ability to expand or contract our retail operations and harm our ability to increase our sales and profits. |
| --- | --- | --- | --- |
| | • | | Our inability or failure to protect our intellectual property would have a negative impact on our brands, reputation and operating results. |
| --- | --- | --- | --- |
| | • | | We outsource certain aspects of our business to third-party vendors and are in the process of insourcing certain business functions from third-party vendors, both of which subject us to risks. |
| --- | --- | --- | --- |
| | • | | If we fail to attract and retain key personnel, our business and operating results may be harmed. |
| --- | --- | --- | --- |
| --- | --- |
COVID-19)
outbreak is expected to have a material impact on our results of operations, financial position and liquidity.
The outbreak of
COVID-19
continues to grow both in the U.S. and globally, and related government and private sector responsive actions are expected to adversely affect our business operations.
It is currently impossible to predict the effect and ultimate impact of the
pandemic as the situation is rapidly evolving.
In March 2020, the President of the United States declared a national emergency as a result of the
outbreak in the U.S. The pandemic has caused public health officials to recommend precautions to mitigate the spread of the virus, especially when congregating in heavily populated areas, such as malls and shopping centers.
In recent days, there have been mandates from federal, state and local authorities requiring reduction of operating hours and forced temporary closures of
retailers and other businesses, which have adversely affected our stores, further negatively impacting our business.
outbreak evolves.
This is expected to adversely affect our operations, cash flows and liquidity, as our retail store revenues comprise approximately 44% of our net revenues.
Further, after containment of the virus or after some or all of our stores reopen, any significant reduction in consumer willingness to visit malls and shopping centers, levels of consumer spending at our stores, employee willingness to work in our stores, or the prolonged temporary closure of our retail stores or distribution centers, relating to the pandemic or its impact on the economy, consumer sentiment or health concerns, would result in a further loss of revenues, profits, cash flows, and other materially impactful effects on our business and operations.
The effects of
orders and our work-from-home policies may negatively impact productivity and disrupt our business, the magnitude of which will depend, in part, on the length and severity of the restrictions and other limitations on our ability to conduct our business in the ordinary course.
Although we continue to sell products through our
and similar government orders, like the statewide order issued in California, or the perception that such orders, shutdowns or other restrictions on the conduct of business operations could occur, related to
or other infectious diseases, could also impact our vendors who manufacture or
While the extent of the economic impact of
and the duration of that impact may be difficult to assess or predict, the widespread pandemic has resulted in significant disruption of global financial markets, which has significantly impacted the value of our common stock and which may reduce our ability to access further capital, which could in the future negatively affect our liquidity.
In addition, a recession or long-term market correction, resulting from the spread of
could in the future further materially impact the value of our common stock, impact our access to capital and affect our business in the near and long-term.
The global pandemic of
pandemic or a similar health epidemic is highly uncertain and subject to change.
The extent to which
or treat its impact, among others.
We are also uncertain the impact this pandemic will have on our overall liquidity levels or on future insurance costs, which may increase in the future in order to cover the costs insurance companies may incur related to this outbreak.
outbreak.
In addition, in the event we were to breach any of our financial covenants, including as a result of the impact from the
Further, the providers of such credit may reallocate the available credit to other borrowers.
To maximize our liquidity and increase our available cash on hand in the event of a protracted
outbreak, on March 23, 2020 we drew down $488,000,000 on our revolving line of credit, for an outstanding balance of $500,000,000.
collection of certain customer data, such as credit card information.
In addition, on January 1, 2020, the California Consumer Privacy Act of 2018 (the “CCPA”) became effective.
challenges in addressing their requirements, which could result in fines or penalties, lead us to change our data privacy policies and practices and limit our ability to deliver personalized advertising.
regulations, trade restrictions, regulations to address climate change, employment and labor matters, wars and fears of war, political unrest, acts of terrorism, natural disasters, adverse weather, climate change, outbreaks of disease (such as the recent
outbreak, or other unforeseen events, our ability to acquire merchandise could be adversely impacted, which would adversely affect our results of operations.
stores and/or
An excerpt. Shown here: 40 of 119 rewritten, 40 of 184 added and 40 of 68 removed. The counts are complete. For every sentence, read Item 1A. RISK FACTORS in the FY2020 filing and the FY2019 filing.
Item 7. MANAGEMENT’S DISCUSSION AND ANALYSIS OF FINANCIAL CONDITION AND RESULTS OF OPERATIONS
90 rewritten, 142 added, 108 removed, 187 unchanged
The following discussion and analysis of our financial condition, results of operations, and liquidity and capital resources for the 52 weeks ended [removed: February 2, 2020] [added: January 31, 2021] (“fiscal [removed: 2019”),] [added: 2020”),] and the [removed: 53] [added: 52] weeks ended February [removed: 3, 2019] [added: 2, 2020] (“fiscal [removed: 2018”)] [added: 2019”)] should be read in conjunction with our Consolidated Financial Statements and notes thereto.
A discussion and analysis of our financial condition, results of operations, and liquidity and capital resources for the [added: 52 weeks ended February 2, 2020 (“fiscal 2019”), compared to the 53 weeks ended February 3, 2019 (“fiscal 2018”), can be found under Item 7 in our Annual Report on Form]
for fiscal [removed: 2018,] [added: 2019,] filed with the SEC on [removed: April 4, 2019,] [added: March 27, 2020,] which is available on the SEC’s website at www.sec.gov and under the Financial Reports section of our Investor Relations website.
[removed: These] [added: Our] products, representing distinct merchandise strategies — Williams Sonoma, Pottery Barn, Pottery Barn Kids, [removed: West Elm,] Pottery Barn Teen, [added: West Elm,] Williams Sonoma Home, Rejuvenation, and Mark and Graham — are marketed through
websites, direct-mail catalogs and [removed: 614] [added: retail] stores.
We operate in the U.S., Puerto Rico, Canada, Australia and the United Kingdom, offer international shipping to customers worldwide, and have unaffiliated franchisees that operate stores in the Middle East, the Philippines, [removed: Mexico and] [added: Mexico,] South [removed: Korea,] [added: Korea and India,] as well as
Fiscal [removed: 2019] [added: 2020] Financial Results
[removed: All brands delivered positive comparable] [added: | Comparable] brand revenue growth [removed: in fiscal 2019.][added: | | Fiscal 2020 | | | | Fiscal 2019 | | |]
[removed: The] [added: In our] Pottery Barn Kids and Teen [removed: business] [added: business, we] delivered [removed: combined] [added: 16.6%] comparable brand revenue [removed: growth of 4.5% — its strongest performance] [added: growth, as we continue to amplify our leadership] in [removed: recent years.][added: design and sustainability in the children’s home furnishings business.]
And, our emerging brands, Rejuvenation and Mark and Graham, combined delivered another year of double-digit [added: comparable brand] revenue [removed: growth as they continue to scale and attract new customers.][added: growth.]
In fiscal [removed: 2019,] [added: 2020,] diluted earnings per share was [removed: $4.49] [added: $8.61] (which included a [removed: $0.30] [added: $0.26] impact related to [removed: operations and] [added: store asset impairments, a $0.13 impact from] acquisition-related expenses of Outward, Inc., [added: an] $0.11 [added: impact] related to [removed: certain employment-related expenses,] [added: inventory write-offs,] and [removed: an $0.08] [added: a $0.06] benefit related to [removed: a] [added: the adjustment of certain] deferred tax [removed: liability adjustment)] [added: assets and liabilities)] versus [removed: $4.05] [added: $4.49] in fiscal [removed: 2018] [added: 2019] (which included a [removed: $0.25] [added: $0.30] impact [removed: related to] [added: from acquisition-related expenses and the operations of] Outward, Inc., [removed: a $0.12] [added: an $0.11] impact related to [removed: impairment and early lease termination charges, a $0.07 impact from] [added: certain] employment-related expenses, [removed: a $0.05 net tax] [added: and an $0.08] benefit [removed: from] [added: related to] the [removed: Tax Cuts and Jobs Act and a $0.01 impact] [added: adjustment] of [removed: equity accounting rules).][added: a deferred tax liability).]
[removed: Within our][added: Our]
Looking Ahead to [removed: 2020][added: 2021]
A prolonged [removed: outbreak] [added: pandemic] could further interrupt our operations, our vendors’ operations, [added: the economy] and [removed: impact] [added: overall] consumer spending, which [removed: would] [added: could] have a material impact on our revenues, results of operations, [removed: cash flows] and [removed: liquidity position.][added: cash flows.]
For more information on risks associated with [removed: the]
[removed: outbreak,] please see “Risk Factors” in [added: Part I,] Item 1A.
Our revenues also include sales to our franchisees and wholesale customers, breakage income related to our [removed: store-value] [added: stored-value] cards, and incentives received from credit card issuers in connection with our private label and
The following table summarizes our net revenues by brand for fiscal [removed: 2019] [added: 2020] and fiscal [removed: 2018:][added: 2019:]
| In thousands | | Fiscal [removed: 2019 (52 Weeks)] [added: 2020] | | | | Fiscal [removed: 2018 (53 Weeks)] [added: 2019] | | |
| Pottery Barn | | $ | [removed: 2,214,397] [added: 2,526,241] | | | $ | [removed: 2,177,344] [added: 2,214,397] | |
| West Elm | | | [removed: 1,466,537] [added: 1,682,254] | | | | [removed: 1,292,928] [added: 1,466,537] | |
| Williams Sonoma | | | [removed: 1,032,368] [added: 1,242,271] | | | | [removed: 1,056,125] [added: 1,032,368] | |
| Pottery Barn Kids and Teen | | | [removed: 908,561] [added: 1,042,531] | | | | [removed: 895,762] [added: 908,561] | |
| Other 1 | | | [removed: 276,145] [added: 289,892] | | | | [removed: 249,434] [added: 276,145] | |
| Total | | $ | [removed: 5,898,008] [added: 6,783,189] | | | $ | [removed: 5,671,593] [added: 5,898,008] | |
| Pottery Barn Kids and Teen | | | [removed: 4.5%] [added: 16.6] | | | | [removed: 2.8%] [added: 4.5] | |
| [removed: 2] [added: 1] | Total comparable brand revenue growth includes the results of Rejuvenation and Mark and Graham. | |
| Store count – beginning of year | | | [removed: 625] [added: 614] | | | | [removed: 631] [added: 625] | |
| Store openings | | | [removed: 14] [added: 10] | | | | [removed: 23] [added: 14] | |
| Store closings | | | [removed: (25] [added: (43] | ) | | | [removed: (29] [added: (25] | ) |
| Store count – end of year | | | [removed: 614] [added: 581] | | | | [removed: 625] [added: 614] | |
| Store selling square footage at year-end | | | [removed: 4,129,000] [added: 3,975,000] | | | | [removed: 4,105,000] [added: 4,129,000] | |
| Store leased square footage (“LSF”) at year-end | | | [removed: 6,558,000] [added: 6,301,000] | | | | [removed: 6,557,000] [added: 6,558,000] | |
| | | [removed: Fiscal 2019] | [removed: | | | | | | |] Fiscal [removed: 2018 |] [added: 2020] | [added: 1] | | | [added: Fiscal 2019] | |
| Williams Sonoma | | | [removed: 211] [added: 198] | | | | [removed: 6,900] [added: 6,800] | | | | [removed: 220] [added: 211] | | | | 6,900 | |
| Pottery Barn | | | [removed: 201] [added: 195] | | | | [removed: 14,400] [added: 14,600] | | | | [removed: 205] [added: 201] | | | | [removed: 14,200] [added: 14,400] | |
| West Elm | | | [removed: 118] [added: 121] | | | | 13,100 | | | | [removed: 112] [added: 118] | | | | 13,100 | |
| Pottery Barn Kids | | | [removed: 74] [added: 57] | | | | [removed: 7,700] [added: 7,800] | | | | [removed: 78] [added: 74] | | | | [removed: 7,500] [added: 7,700] | |
| Total | | | [removed: 614] [added: 581] | | | | [removed: 10,700] [added: 10,800] | | | | [removed: 625] [added: 614] | | | | [removed: 10,500] [added: 10,700] | |
| In thousands | | Fiscal [removed: 2019 (52 Weeks)] [added: 2020] | | | | % Net Revenues | | | | Fiscal [removed: 2018 (53 Weeks)] [added: 2019] | | | | % Net Revenues | | |
We are also proud to lead the industry with our ESG efforts.
On March 11, 2020, the World Health Organization declared
to be a global pandemic and recommended containment and mitigation measures worldwide.
In March 2020, we announced the temporary closures of all of our retail store operations to protect our employees, customers and the communities in which we operate and to help contain the
COVID-19
pandemic.
As of January 31, 2021, the majority of our retail stores have reopened for
in-person
shopping.
However, given the continued uncertainty around
COVID-19
due to high rates of infections in certain areas, state and local officials in certain geographies have extended closures or restrictions on retail capacity, which may continue to impact our store traffic and retail revenues, and may result in future store impairments.
Throughout fiscal 2020, we have continued to operate our
sites and distribution centers and continued to deliver products to our customers.
However, governmental mandates, illness, or the absence of a substantial number of distribution center employees may require in the future that we temporarily close one or more of our distribution centers, or may prohibit or significantly limit us, or our third-party logistics providers from delivering packages to our customers and our stores, which could complicate or prevent us from fulfilling
orders and supplying merchandise to our stores.
Net revenues in fiscal 2020 increased by $885,181,000, or 15.0%, compared to fiscal 2019, with comparable brand revenue growth of 17.0% and double-digit comparable brand revenue growth across all our brands.
This was primarily driven by an increase of approximately 44% in
revenues, due to both an increase in demand for our product as well as a larger portion of our net revenues being driven by furniture, which has a higher average selling price, partially offset by a decrease in retail revenues driven by limited capacity in stores and reduced customer store traffic due to
COVID-19.
During fiscal 2020, we delivered double-digit comparable brand revenue growth across all our brands.
The Williams Sonoma brand delivered comparable brand revenue growth of 23.8% as we implemented a content-driven marketing strategy that featured exclusive products and relevant lifestyle stories over promotions.
We also
grew our exclusive products to 70% of our total business, consistent with one of our key strategic initiatives to increase the mix of product that is only available at Williams Sonoma.
In addition to strong core introductions in furniture, we have added a new modern aesthetic that is driving growth and attracting new customers to our brands.
The Pottery Barn brand delivered comparable brand revenue growth of 15.2% and our multi-year work to improve our value proposition is paying off.
Our value-engineered products are attracting new customers and we believe our multi-step finish, high-quality furniture pieces are the best value in the market.
In West Elm, we delivered strong comparable brand revenue growth of 15.2% on top of 14.4% last year.
We continue to build this business with original design and by filling white space in underdeveloped categories.
We ended the year with a cash balance of $1,200,337,000, compared to $432,162,000 last year, which reflects our strong financial performance as well as operating cash flow, which was more than double last year.
In addition to our strong cash balance, we also ended the year with no amount outstanding under our line of credit.
This strong liquidity position allowed us to fund the operations of the business, and to provide shareholder returns of approximately $307,645,000 through dividends and share repurchases.
Throughout fiscal 2020, our three key differentiators were instrumental to our strong financial performance.
They are: our
design, our
digital-first
channel strategy, and our values.
in-house
teams design our own products, create original aesthetics, and work with our talented vendors to bring quality, sustainable products to market.
The majority of our products cannot be found elsewhere and the design, quality, and value that we offer is strong.
| --- | --- |
Fiscal 2018 was a
53-week
year and includes approximately $85,000,000 of net revenues and $0.10 of diluted earnings per share associated with the additional week.
53-weeks
ended February 3, 2019 (“fiscal 2018”), compared to the
52-weeks
ended January 28, 2018 (“fiscal 2017”), can be found under Item 7 in our Annual Report on Form
In December 2017, we acquired Outward, Inc., a
3-D
imaging and augmented reality platform for the home furnishings and décor industry.
Net revenues in fiscal 2019 increased by $226,415,000 or 4.0%, with comparable brand revenue growth of 6.0%.
This increase in net revenues was primarily driven by West Elm and Pottery Barn, partially offset by the loss of the additional week of net revenues in fiscal 2018, a fifty-three week year.
Total fiscal 2019 net revenue growth included a 5.4% increase in international revenues primarily related to our franchise operations and strength in our Canadian
business and company-owned United Kingdom operations.
Growth in Pottery Barn accelerated from last year, driven by strength in
and growth in new businesses: Marketplace and Pottery Barn Apartment, as well as our digital transformation and brand revitalization strategies.
Our expansion across life stages and aesthetics continued to be key drivers of growth and customer acquisition.
West Elm had another year of double-digit net revenue growth and comparable brand revenue growth of 14.4%, on top of 9.5% in fiscal 2018, led by furniture, with strength in dining and bedroom categories, as well as new product introductions.
The Williams Sonoma brand delivered comparable brand revenue growth of 0.4%.
Gross profit in fiscal 2019 decreased to 36.3% of revenues versus 37.0% in fiscal 2018, primarily driven by lower year-over-year occupancy leverage resulting from one less week of sales in fiscal 2019, increased shipping costs due to a larger mix of furniture and drop-ship sales that are more expensive to ship, as well as the incremental impact from the China tariffs.
We have been executing against an aggressive tariff mitigation plan which includes cost reductions from vendors, moving production out of China to South East Asia and to the United States, cost savings in other areas of the business, as well as select price increases.
Our approach towards mitigating the financial impact of these tariffs all year enabled us to deliver operating income growth, operating margin expansion, and diluted earnings per share growth.
During fiscal 2019, our cross-brand programs also continued to scale.
Our cross-brand loyalty program, The Key, continues to be an impactful driver of revenues and customer acquisition as total membership continued to grow during the year, while our complimentary design service, Design Crew, continued to be a significant revenue driver of sales in store.
Fiscal 2019 was also a strong start for our new cross-brand Business to Business (B2B) division as we delivered several key wins, which establish an important foundation for our future growth and demonstrate the appeal of our differentiated value proposition to B2B clients.
Critical to the success of our growth initiatives in fiscal 2019 has been our continued focus on improving the customer experience.
We enhanced our digital experience with new functionalities and content that enable us to deliver a faster and more personalized experience for our customers.
During the year, we launched a machine-learning search engine that allows us to provide more relevant and personalized search results.
We added more storytelling and selling content on our product information pages and further optimized our site navigation.
We also improved our mobile site speed within search and product information pages through enhancements to our Progressive Web App platform.
In addition, we implemented more functional improvements to our Outward-powered Design Crew room planner.
In our supply chain, we continued to drive operational improvements which contributed to another year of strong growth and better customer service.
in-home
furniture delivery network in fiscal 2019, we migrated our order management and fulfillment capabilities to a new platform, which allows us to enhance our furniture delivery scheduling capabilities.
We also made important strides in increasing customer visibility with the installation of an order tracking program, which provides real-time updates on the day of delivery.
Our West Elm West Coast distribution center in Fontana, California is now fully operational, facilitating growth for our West Elm brand on the West Coast, and finally, our
manufacturing operation continues to be a strategic advantage, attracting demand for our
made-to-order
upholstered furniture across all our brands, and enabling more domestic production, which helps to mitigate the impact of the China tariffs.
An excerpt. Shown here: 40 of 90 rewritten, 40 of 142 added and 40 of 108 removed. The counts are complete. For every sentence, read Item 7. MANAGEMENT’S DISCUSSION AND ANALYSIS OF FINANCIAL CONDITION AND RESULTS OF OPERATIONS in the FY2020 filing and the FY2019 filing.
Item 7A. QUANTITATIVE AND QUALITATIVE DISCLOSURES ABOUT MARKET RISK
6 rewritten, 3 added, 3 removed, 13 unchanged
[removed: Our revolver and our term loan] [added: Credit Agreement] each have a variable interest rate which, when drawn upon, subjects us to risks associated with changes in that interest rate.
[removed: As of February 2, 2020, we had $300,000,000 outstanding under] [added: During] the [removed: term loan, and during] [added: first quarter of] fiscal [removed: 2019] [added: 2020,] we had borrowings of [removed: $100,000,000] [added: $487,823,000] under the revolver, all of which were repaid [removed: in] [added: prior to] the [removed: fourth quarter] [added: end] of [added: the] fiscal [removed: 2019.][added: year.]
As of [removed: February 2, 2020,] [added: January 31, 2021,] our investments, made primarily in interest bearing demand deposit accounts and money market funds, are stated at cost and approximate their fair values.
We purchase [removed: a significant amount] [added: the majority] of [added: our] inventory from vendors outside of the U.S. in transactions that are [added: primarily] denominated in U.S. dollars and, as such, any foreign currency impact related to these international purchase transactions was not significant to us during fiscal [removed: 2019] [added: 2020] or fiscal [removed: 2018.][added: 2019.]
[added: In addition, our] businesses in Canada, Australia and the United Kingdom, and our operations throughout Asia and Europe, expose us to market risk associated with foreign currency exchange rate fluctuations.
While the impact of foreign currency exchange rate fluctuations was not material to us in fiscal [removed: 2019,] [added: 2020,] we have continued to see volatility in the exchange rates in the countries in which we do business.
Our revolver, our term loan and our
364-Day
Additionally, as of January 31, 2021, we had $300,000,000 outstanding under our term loan, all of which was repaid in full in February 2021 prior to maturity, and no amount outstanding under our 364-Day Credit Agreement, which has not been drawn upon.
See Note P: Subsequent Events to our Consolidated Financial Statements.
In addition, our retail and
e-commerce
Item 1. BUSINESS
19 rewritten, 116 added, 16 removed, 99 unchanged
Williams-Sonoma, Inc., [added: (“the Company”)] incorporated in 1973, is [removed: a] [added: an] omni-channel specialty retailer of [removed: high quality] [added: high-quality] products for the home.
We operate in the U.S., Puerto Rico, Canada, Australia and the United [removed: Kingdom and] [added: Kingdom,] offer international shipping to customers [removed: worldwide.][added: worldwide, and have unaffiliated franchisees that operate stores in the Middle East, the Philippines, Mexico, South Korea and India, as well as]
As of [removed: February 2, 2020,] [added: January 31, 2021,] we had the following merchandise strategies: Williams Sonoma, Pottery Barn, Pottery Barn Kids, [removed: West Elm,] Pottery Barn Teen, [added: West Elm,] Williams Sonoma Home, Rejuvenation and Mark and Graham, which sell our products through our
We operate [removed: 614] [added: 581] stores, which include [removed: 572] [added: 538] stores in [removed: 43] [added: 42] states, Washington, D.C. and Puerto Rico, [removed: 20] [added: 21] stores in Canada, 19 stores in Australia and 3 stores in the United Kingdom.
We also have multi-year franchise agreements with third parties in the Middle East, the Philippines, [removed: Mexico and] [added: Mexico,] South Korea [added: and India] that currently operate [removed: 129] [added: 136] franchised [removed: stores] [added: locations] as well as
We purchase most of our merchandise from numerous foreign and domestic manufacturers and importers, the largest of which accounted for approximately [removed: 2%] [added: 4%] of our purchases during fiscal [removed: 2019.][added: 2020.]
Approximately 65% of our merchandise purchases in fiscal [removed: 2019] [added: 2020] were sourced from foreign vendors, predominantly in Asia and Europe.
has encouraged the entry of many new competitors, including discount retailers selling [removed: similar] [added: undifferentiated] products at reduced prices, new business models and [removed: an increase] [added: has resulted] in [added: increased] competition from established companies.
As of [removed: February 2, 2020,] [added: January 31, 2021,] we had approximately [removed: 27,000] [added: 21,000] employees, of whom approximately [removed: 11,600] [added: 12,200] were full-time.
In preparation for and during our fiscal [removed: 2019] [added: 2020] holiday selling season, we hired approximately [removed: 8,500] [added: 10,000] temporary employees, primarily in our retail stores, customer care centers and distribution facilities.
As of [removed: February 2, 2020,] [added: January 31, 2021,] we own and/or have applied to register [removed: 164] [added: approximately 179] unique trademarks [removed: and] [added: or] service marks.
We own and/or have applied to register our key brand names [removed: as trademarks] in the U.S. as well as [removed: 121] [added: in 95] additional jurisdictions.
Generally, exclusive rights to the trademarks and service marks are held by Williams-Sonoma, Inc. and are used by our subsidiaries and franchisees under [removed: a] license.
[removed: We also own numerous copyrights and trade dress rights for our products, product packaging, catalogs, books, house] publications, website designs and store designs, among other things, which are used by our subsidiaries and franchisees under [removed: a] license.
As of [removed: February 2, 2020,] [added: January 31, 2021,] we own [removed: and/or] [added: or] have applied to register [removed: 277] [added: approximately 322] patents in connection with certain product designs, inventions and proprietary technology.
Patents [added: in the U.S.] are generally valid for 14 to 20 years as long as their registrations are properly maintained.
In addition, we have registered and maintain numerous Internet domain names, including “williams-sonoma.com,” “potterybarn.com,” “potterybarnkids.com,” “potterybarnteen.com,” “westelm.com,” “wshome.com,” “williams-sonomainc.com,” “rejuvenation.com” and “markandgraham.com.” Collectively, the trademarks, patents, copyrights, trade dress [removed: rights and] [added: rights,] domain [removed: names] [added: names, trade secrets and other proprietary technology] that we hold are of material importance to us.
Forms [added: 8-K]
Information on our website is not, and will [removed: not] [added: not,] be [removed: deemed,] [added: deemed] a part of this report or incorporated into any other filings we make with the SEC.
Williams-Sonoma, Inc. is the world’s largest digital-first, design-led and sustainable home retailer.
Our products represent distinct merchandise strategies — Williams Sonoma, Pottery Barn, Pottery Barn Kids, Pottery Barn Teen, West Elm, Williams Sonoma Home, Rejuvenation, and Mark and Graham — are marketed through
These brands are also part of The Key Rewards, our
free-to-join
loyalty program that offers members exclusive benefits across the Williams-Sonoma family of brands.
We are also proud to lead the industry with our Environmental, Social and Governance (“ESG”) efforts.
America’s most meaningful, beautiful design source, Pottery Barn brings together good products, people and values — seeking inspiration, quality, sustainability and service in everything we do.
Thoughtfully designed and crafted to last, Pottery Barn’s furniture, bedding, lighting, rugs, table essentials, decorative accessories and more can be loved for a lifetime.
Kids are, and have always been, the inspiration behind what we do at Pottery Barn Kids.
Since 1999, it’s been our mission to bring the utmost in quality, sustainability, safety and style into every family’s home.
Most importantly, all our designs are rigorously tested to meet the highest child safety standards and expertly crafted from the best materials to last beyond their childhood years.
Our purpose is to make safe and sustainable designs that inspire teens to create the world they want to live in.
We’re designing everything from organic bedding to multi-purpose furniture that adapts and lasts.
Our mission is to create for the future.
websites, direct-mail catalogs and retail stores.
We compete on the basis of our brand authority, the quality of our merchandise, our customer service, our proprietary customer list, our e-commerce websites and marketing capabilities, the location and appearance of our stores, as well as our in-house design, our digital-first channel strategy, and our values, which we believe have become increasingly relevant and set us apart from our competitors.
Our in-house teams design our own products and work with our talented vendors to bring quality, sustainable products to market through our high-touch multichannel platform.
HUMAN CAPITAL MANAGEMENT
None of our employees are represented by a collective bargaining agreement.
In fiscal 2020, we announced three new ESG pillars as key areas of focus for our company.
One of those three pillars is “People” in keeping with our long-held “People First” culture.
This includes the following areas of focus:
Employee Engagement
We conduct an annual Associate Opinion Survey to directly engage with and collect feedback from our associates, which we use to improve the experience of our teams.
Our human resources department maintains an open-door policy for associates to report concerns, and we provide an anonymous reporting hotline, available in multiple languages and managed by an independent company not affiliated with us.
We strive to deliver a workplace experience where the quality of our engagement with fellow associates, business partners and customers matches the quality of the products and services we bring to the marketplace.
Talent Development
We invest in our employees through accessible resources and structured training programs that help our associates to create the career they envision for themselves.
We offer a large selection of development opportunities for our employees including
in-person
and online learning, as well as professional development courses, such as goal setting, unconscious bias and inclusive leadership training.
We have a company-wide
Advisor Program, which matches associates in a Manager and above role with
non-managers
to form advisor/advisee relationships to provide career guidance and receive support in working through career and development challenges.
Additionally, our LEAD program — Leadership Education and Development — provides a leadership training program for nominated Directors and Vice Presidents.
We also foster other team-based programs to develop talent at all levels of the Company, supplying associates with new skills and training.
Through these programs, we give our associates the tools to succeed, learn new skills and develop their careers.
Diversity, Equity and Inclusion
Associate engagement and retention require an understanding of the needs of a diverse, creative and purpose-driven workforce.
Today, Williams-Sonoma, Inc. is one of the United States’ largest
e-commerce
retailers with some of the best known and most beloved brands in home furnishings.
Our unaffiliated franchisees operate stores in the Middle East, the Philippines, Mexico and South Korea, as well as
The brand was founded on the idea that home furnishings should be exceptional in comfort, quality, style and value.
Pottery Barn’s stores, website, and catalogs are specially designed to make shopping an enjoyable experience, with inspirational lifestyle displays dedicated to every space in the home.
Pottery Barn products include furniture, bedding, bathroom accessories, rugs, curtains, lighting, tabletop, outdoor and decorative accessories.
Launched in 1999, Pottery Barn Kids serves as an inspirational destination for creating childhood memories by decorating nurseries, bedrooms and play spaces.
Pottery Barn Kids offers exclusive, innovative and high-quality products designed specifically for creating magical spaces where children can play, laugh, learn and grow.
The brand offers a complete line of furniture, bedding, lighting, decorative accents and more for teen bedrooms, dorm rooms, study spaces and lounges.
Pottery Barn Teen’s innovative products are specifically designed to help teens create a comfortable and stylish room that reflects their own individual aesthetic.
We compete on the basis of our brand authority, the quality of our merchandise, service to our customers, our proprietary customer list, our
websites and our marketing capabilities, as well as the location and appearance of our stores.
We believe that we compare favorably with many of our current competitors with respect to some or all of these factors.
EMPLOYEES
8-K
An excerpt. Shown here: all 19 rewritten, 40 of 116 added and all 16 removed. The counts are complete. For every sentence, read Item 1. BUSINESS in the FY2020 filing and the FY2019 filing.
Cover and table of contents
39 rewritten, 11 added, 5 removed, 69 unchanged
For the fiscal year ended [removed: February 2, 2020.][added: January 31, 2021.]
Registrant’s telephone number, including area code: [removed: (415)]
[added: (415)] 421-7900
Yes [added: ☒ No ☐]
[removed: non-accelerated][added: ☒ Accelerated filer ☐ Non-accelerated]
Large accelerated [removed: filer]
[removed: Accelerated] filer [added: ☐]
As of August [removed: 4, 2019,] [added: 2, 2020,] the approximate aggregate market value of the registrant’s common stock held by
It is assumed for purposes of this computation that an affiliate includes all persons as of August [removed: 4, 2019] [added: 2, 2020] listed as executive officers and directors with the Securities and Exchange Commission.
As of March [removed: 22, 2020, 77,197,681] [added: 21, 2021, 76,192,973] shares of the registrant’s common stock were outstanding.
Portions of our definitive Proxy Statement for the [removed: 2020] [added: 2021] Annual Meeting of Stockholders, also referred to in this Annual Report on Form
and retail channels; our marketing efforts; our acquisition of Outward, Inc., including the valuation of intangible assets acquired; our global business and expansion efforts, including franchise, other third-party arrangements and company-owned operations; our ability to attract new customers; the seasonal variations in demand; our ability to recruit, retain and motivate skilled personnel; our belief in the reasonableness of the steps taken to protect the security and confidentiality of the information we collect; our belief in the adequacy of our facilities and the availability of suitable additional or substitute space; our belief in the ultimate resolution of current legal proceedings; the payment of dividends; our stock repurchase program; our capital allocation strategy in fiscal [removed: 2020;] [added: 2021;] our planned use of cash in fiscal [removed: 2020;] [added: 2021;] our compliance with financial covenants; our belief that our cash on hand and available credit facilities will provide adequate liquidity for our business operations over the next 12 months; the impact of the 2017 Tax Cuts and Jobs Act; the impact of tariffs on our business and our results of operations; our belief regarding the effects of potential losses under our indemnification obligations; the impact of inflation; the effects of changes in our inventory reserves; the impact of new accounting pronouncements; the impact of the coronavirus on our retail store operations, global supply chain and customer spending and demand; and statements of belief and statements of assumptions underlying any of the foregoing.
FISCAL YEAR ENDED [removed: FEBRUARY 2, 2020][added: JANUARY 31, 2021]
| | | | | [removed: | |] PAGE | | |
| | | [removed: | |] PART I | | | | |
| [removed: |] Item 1. | | [removed: | [Business](#tx856872_1)] [added: [Business](#tx93631_1)] | | | 3 | |
| [removed: |] Item 1A. | | [removed: |] [Risk [removed: Factors](#tx856872_2)] [added: Factors](#tx93631_2)] | | | [removed: 6] [added: 8] | |
| [removed: |] Item 1B. | | [removed: |] [Unresolved Staff [removed: Comments](#tx856872_3)] [added: Comments](#tx93631_3)] | | | [removed: 24] [added: 29] | |
| [removed: |] Item 2. | | [removed: | [Properties](#tx856872_4)] [added: [Properties](#tx93631_4)] | | | [removed: 24] [added: 29] | |
| [removed: |] Item 3. | | [removed: |] [Legal [removed: Proceedings](#tx856872_5)] [added: Proceedings](#tx93631_5)] | | | [removed: 25] [added: 30] | |
| [removed: |] Item 4. | | [removed: |] [Mine Safety [removed: Disclosures](#tx856872_6)] [added: Disclosures](#tx93631_6)] | | | [removed: 26] [added: 30] | |
| | | [removed: | |] PART II | | | | |
| [removed: |] Item 5. | | [removed: |] [Market for Registrant’s Common Equity, Related Stockholder Matters and Issuer Purchases of Equity [removed: Securities](#tx856872_7)] [added: Securities](#tx93631_7)] | | | [removed: 27] [added: 31] | |
| [removed: |] Item 6. | | [removed: |] [Selected Financial [removed: Data](#tx856872_8)] [added: Data](#tx93631_8)] | | | [removed: 29] [added: 33] | |
| [removed: |] Item 7. | | [removed: |] [Management’s Discussion and Analysis of Financial Condition and Results of [removed: Operations](#tx856872_9)] [added: Operations](#tx93631_9)] | | | [removed: 30] [added: 34] | |
| [removed: |] Item 7A. | | [removed: |] [Quantitative and Qualitative Disclosures About Market [removed: Risk](#tx856872_10)] [added: Risk](#tx93631_10)] | | | [removed: 40] [added: 45] | |
| [removed: |] Item 8. | | [removed: |] [Financial Statements and Supplementary [removed: Data](#tx856872_11)] [added: Data](#tx93631_11)] | | | [removed: 41] [added: 46] | |
| [removed: |] Item 9. | | [removed: |] [Changes in and Disagreements with Accountants on Accounting and Financial [removed: Disclosure](#tx856872_12)] [added: Disclosure](#tx93631_12)] | | | [removed: 68] [added: 72] | |
| [removed: |] Item 9A. | | [removed: |] [Controls and [removed: Procedures](#tx856872_13)] [added: Procedures](#tx93631_13)] | | | [removed: 68] [added: 72] | |
| [removed: |] Item 9B. | | [removed: |] [Other [removed: Information](#tx856872_14)] [added: Information](#tx93631_14)] | | | [removed: 69] [added: 73] | |
| | | [removed: | |] PART III | | | | |
| [removed: |] Item 10. | | [removed: |] [Directors, Executive Officers and Corporate [removed: Governance](#tx856872_15)] [added: Governance](#tx93631_16)] | | | [removed: 70] [added: 74] | |
| [removed: |] Item 11. | | [removed: |] [Executive [removed: Compensation](#tx856872_16)] [added: Compensation](#tx93631_17)] | | | [removed: 70] [added: 74] | |
| [removed: |] Item 12. | | [removed: |] [Security Ownership of Certain Beneficial Owners and Management and Related Stockholder [removed: Matters](#tx856872_17)] [added: Matters](#tx93631_18)] | | | [removed: 70] [added: 74] | |
| [removed: |] Item 13. | | [removed: |] [Certain Relationships and Related Transactions, and Director [removed: Independence](#tx856872_18)] [added: Independence](#tx93631_19)] | | | [removed: 70] [added: 74] | |
| [removed: |] Item 14. | | [removed: |] [Principal Accountant Fees and [removed: Services](#tx856872_19)] [added: Services](#tx93631_20)] | | | [removed: 70] [added: 74] | |
| | | [removed: | |] PART IV | | | | |
| [removed: |] Item 15. | | [removed: |] [Exhibits and Financial Statement [removed: Schedules](#tx856872_20)] [added: Schedules](#tx93631_22)] | | | [removed: 71] [added: 75] | |
| [removed: |] Item 16. | | [removed: |] [Form 10-K [removed: Summary](#tx856872_21)] [added: Summary](#tx93631_23)] | | | [removed: 76] [added: 81] | |
Yes ☐ No ☒
Yes ☒ No ☐
Yes ☒ No ☐
Indicate by check mark whether the registrant has filed a report on and attestation to its management’s assessment of the effectiveness of its internal control over financial reporting under Section 404(b) of the Sarbanes-Oxley Act (15 U.S.C. 7262(b)) by the registered public accounting firm that prepared or issued its audit report.
Yes ☐ No ☒
was $6,720,032,000.
| | | | | | | |
| --- | --- | --- | --- | --- | --- | --- |
| | | | | | | |
| | | | | | | |
| | | | | | | |
No
No ☒
was $4,956,461,000.
| | | | | | | | | |
| --- | --- | --- | --- | --- | --- | --- | --- | --- |
Item 1B. UNRESOLVED STAFF COMMENTS
0 rewritten, 2 added, 0 removed, 0 unchanged
New section this year
| --- | --- |
None.
Item 2. PROPERTIES
8 rewritten, 0 added, 0 removed, 27 unchanged
For our store locations, our gross leased store space as of [removed: February 2, 2020] [added: January 31, 2021] totaled approximately [removed: 6,558,000] [added: 6,301,000] square feet for [removed: 614] [added: 581] stores compared to approximately [removed: 6,557,000] [added: 6,558,000] square feet for [removed: 625] [added: 614] stores as of February [removed: 3, 2019.][added: 2, 2020.]
The following table summarizes the location and size of our leased facilities occupied by us as of [removed: February 2, 2020:][added: January 31, 2021:]
| Location | | [added: |] Occupied Square Footage (Approximate) | | [removed: |]
| Mississippi | | | [removed: 2,165,000] [added: 2,258,000] | |
| Texas | | | [removed: 1,064,000] [added: 1,298,000] | |
| Ohio | | | [removed: 265,000] [added: 153,000] | |
As of [removed: February 2, 2020,] [added: January 31, 2021,] the total leased space related to these properties was not material to us and is not included in the occupied square footage reported above.
As of [removed: February 2, 2020,] [added: January 31, 2021,] we owned 471,000 square feet of space, primarily in California, for our corporate headquarters and certain data center operations.
Item 5. MARKET FOR REGISTRANT’S COMMON EQUITY, RELATED STOCKHOLDER MATTERS AND ISSUER PURCHASES OF EQUITY SECURITIES
8 rewritten, 12 added, 10 removed, 29 unchanged
The closing price of our common stock on the NYSE on March [removed: 22, 2020] [added: 21, 2021] was [removed: $36.37.][added: $174.84.]
The number of stockholders of record of our common stock as of March [removed: 22, 2020] [added: 21, 2021] was [removed: 305.][added: 299.]
[removed: ][added: 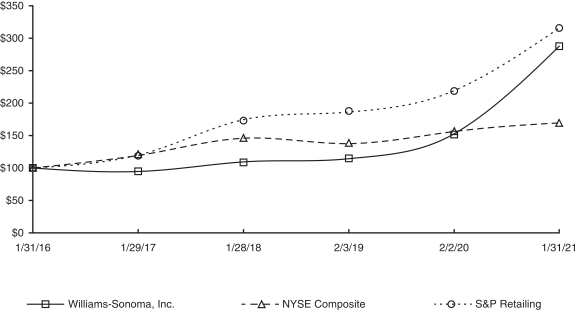]
| * | $100 invested on [removed: 2/1/15] [added: 1/31/16] in stock or index, including reinvestment of dividends. Fiscal year ending [removed: February 2, 2020.] [added: January 31, 2021.] |
[removed: *] Notes:
STOCK REPURCHASE [removed: PROGRAMS][added: PROGRAM]
During fiscal [removed: 2017,] [added: 2020,] we repurchased [removed: 4,050,697] [added: 1,496,100] shares of our common stock at an average cost of [removed: $48.43] [added: $100.26] per share and a total cost of [removed: $196,179,000.][added: $150,000,000.]
The following table summarizes our repurchases of shares of our common stock during the fourth quarter of fiscal [removed: 2019] [added: 2020] under our stock repurchase program:
| | | | | | | | | | | | | |
| --- | --- | --- | --- | --- | --- | --- | --- | --- | --- | --- | --- | --- |
| | | 1/31/16 | | 1/29/17 | | 1/28/18 | | 2/3/19 | | 2/2/20 | | 1/31/21 |
| Williams-Sonoma, Inc. | | $100.00 | | $94.58 | | $109.64 | | $114.38 | | $152.80 | | $287.90 |
| NYSE Composite Index | | $100.00 | | $119.63 | | $146.03 | | $137.82 | | $156.52 | | $169.59 |
| S&P Retailing | | $100.00 | | $120.09 | | $174.49 | | $186.29 | | $219.46 | | $316.05 |
As of January 31, 2021, there was approximately $424,982,000 remaining under our current stock repurchase program.
In March 2021, our Board of Directors authorized a new stock repurchase program for $1,000,000,000, which replaced our existing program.
| November 2, 2020 – November 29, 2020 | | | | | 125,310 | | | | $ 98.91 | | | | 125,310 | | | | $ 453,539,000 | |
| November 30, 2020 – December 27, 2020 | | | | | 116,800 | | | | $ 108.75 | | | | 116,800 | | | | $ 440,837,000 | |
| December 28, 2020 – January 31, 2021 | | | | | 134,655 | | | | $ 117.75 | | | | 134,655 | | | | $ 424,982,000 | |
| Total | | | | | 376,765 | | | | $ 108.69 | | | | 376,765 | | | | $ 424,982,000 | |
| | | | | | | | | | | | | | | | | | | | | | | | | | |
| --- | --- | --- | --- | --- | --- | --- | --- | --- | --- | --- | --- | --- | --- | --- | --- | --- | --- | --- | --- | --- | --- | --- | --- | --- | --- |
| | | | 2/1/15 | | | | 1/31/16 | | | | 1/29/17 | | | | 1/28/18 | | | | 2/3/19 | | | | 2/2/20 | | |
| Williams-Sonoma, Inc. | | | 100.00 | | | | 67.37 | | | | 63.72 | | | | 73.87 | | | | 77.06 | | | | 102.95 | | |
| NYSE Composite Index | | | 100.00 | | | | 93.70 | | | | 112.69 | | | | 139.56 | | | | 129.47 | | | | 146.66 | | |
| S&P Retailing | | | 100.00 | | | | 118.07 | | | | 140.98 | | | | 203.43 | | | | 210.40 | | | | 253.71 | | |
| November 4, 2019 | | – December 1, 2019 | | | 160,918 | | | | $ 69.90 | | | | 160,918 | | | | $ 599,853,000 | |
| December 2, 2019 | | – December 29, 2019 | | | 158,780 | | | | $ 70.85 | | | | 158,780 | | | | $ 588,604,000 | |
| December 30, 2019 | | – February 2, 2020 | | | 183,262 | | | | $ 74.33 | | | | 183,262 | | | | $ 574,982,000 | |
| Total | | | | | 502,960 | | | | $ 71.81 | | | | 502,960 | | | | $ 574,982,000 | |
Item 6. SELECTED FINANCIAL DATA
30 rewritten, 4 added, 1 removed, 8 unchanged
| In thousands, except percentages, per share amounts and retail stores data | | Fiscal [removed: 2019] [added: 2020] (52 Weeks) | | | | Fiscal [removed: 2018 1 (53] [added: 2019 (52] Weeks) | | | | Fiscal [removed: 2017 (52] [added: 2018 1 (53] Weeks) | | | | Fiscal [removed: 2016] [added: 2017] (52 Weeks) | | | | Fiscal [removed: 2015] [added: 2016] (52 Weeks) | | |
| Net revenues | | $ | [removed: 5,898,008] [added: 6,783,189] | | | $ | [removed: 5,671,593] [added: 5,898,008] | | | $ | [removed: 5,292,359] [added: 5,671,593] | | | $ | [removed: 5,083,812] [added: 5,292,359] | | | $ | [removed: 4,976,090] [added: 5,083,812] | |
| Net revenue growth | | | [removed: 4.0%] [added: 15.0%] | | | | [removed: 7.2%] [added: 4.0%] | | | | [removed: 4.1%] [added: 7.2%] | | | | [removed: 2.2%] [added: 4.1%] | | | | [removed: 5.9%] [added: 2.2%] | |
| Comparable brand revenue growth 2 | | | [removed: 6.0%] [added: 17.0%] | | | | [removed: 3.7%] [added: 6.0%] | | | | [removed: 3.2%] [added: 3.7%] | | | | [removed: 0.7%] [added: 3.2%] | | | | [removed: 3.7%] [added: 0.7%] | |
| Gross profit | | $ | [removed: 2,139,092] [added: 2,636,269] | | | $ | [removed: 2,101,013] [added: 2,139,092] | | | $ | [removed: 1,931,711] [added: 2,101,013] | | | $ | [removed: 1,883,310] [added: 1,931,711] | | | $ | [removed: 1,844,214] [added: 1,883,310] | |
| Gross margin | | | [removed: 36.3%] [added: 38.9%] | | | | [removed: 37.0%] [added: 36.3%] | | | | [removed: 36.5%] [added: 37.0%] | | | | [removed: 37.0%] [added: 36.5%] | | | | [removed: 37.1%] [added: 37.0%] | |
| Operating income | | $ | [removed: 465,874] [added: 910,697] | | | $ | [removed: 435,953] [added: 465,874] | | | $ | [removed: 453,811] [added: 435,953] | | | $ | [removed: 472,599] [added: 453,811] | | | $ | [removed: 488,634] [added: 472,599] | |
| Operating margin 3 | | | [removed: 7.9%] [added: 13.4%] | | | | [removed: 7.7%] [added: 7.9%] | | | | [removed: 8.6%] [added: 7.7%] | | | | [removed: 9.3%] [added: 8.6%] | | | | [removed: 9.8%] [added: 9.3%] | |
| Net earnings | | $ | [removed: 356,062] [added: 680,714] | | | $ | [removed: 333,684] [added: 356,062] | | | $ | [removed: 259,545] [added: 333,684] | | | $ | [removed: 305,387] [added: 259,545] | | | $ | [removed: 310,068] [added: 305,387] | |
| Basic earnings per share | | $ | [removed: 4.56] [added: 8.81] | | | $ | [removed: 4.10] [added: 4.56] | | | $ | [removed: 3.03] [added: 4.10] | | | $ | [removed: 3.45] [added: 3.03] | | | $ | [removed: 3.42] [added: 3.45] | |
| Diluted earnings per share | | $ | [removed: 4.49] [added: 8.61] | | | $ | [removed: 4.05] [added: 4.49] | | | $ | [removed: 3.02] [added: 4.05] | | | $ | [removed: 3.41] [added: 3.02] | | | $ | [removed: 3.37] [added: 3.41] | |
| Shares used in calculation of earnings per share: Basic | | | [removed: 78,108] [added: 77,260] | | | | [removed: 81,420] [added: 78,108] | | | | [removed: 85,592] [added: 81,420] | | | | [removed: 88,594] [added: 85,592] | | | | [removed: 90,787] [added: 88,594] | |
| Diluted | | | [removed: 79,225] [added: 79,055] | | | | [removed: 82,340] [added: 79,225] | | | | [removed: 86,080] [added: 82,340] | | | | [removed: 89,462] [added: 86,080] | | | | [removed: 92,102] [added: 89,462] | |
| Working capital 4 | | $ | [removed: 146,080] [added: 619,080] | | | $ | [removed: 619,531] [added: 146,080] | | | $ | [removed: 628,622] [added: 619,531] | | | $ | [removed: 405,924] [added: 628,622] | | | $ | [removed: 339,673] [added: 405,924] | |
| Total assets 4 | | $ | [removed: 4,054,042] [added: 4,661,424] | | | $ | [removed: 2,812,844] [added: 4,054,042] | | | $ | [removed: 2,785,749] [added: 2,812,844] | | | $ | [removed: 2,476,879] [added: 2,785,749] | | | $ | [removed: 2,417,427] [added: 2,476,879] | |
| Return on assets 4 | | | [removed: 10.4%] [added: 15.6%] | | | | [removed: 11.9%] [added: 10.4%] | | | | [removed: 9.9%] [added: 11.9%] | | | | [removed: 12.5%] [added: 9.9%] | | | | [removed: 13.1%] [added: 12.5%] | |
| Net cash provided by operating activities | | $ | [removed: 607,294] [added: 1,274,848] | | | $ | [removed: 585,986] [added: 607,294] | | | $ | [removed: 499,704] [added: 585,986] | | | $ | [removed: 524,709] [added: 499,704] | | | $ | [removed: 544,026] [added: 524,709] | |
| Capital expenditures | | $ | [removed: 186,276] [added: 169,513] | | | $ | [removed: 190,102] [added: 186,276] | | | $ | [removed: 189,712] [added: 190,102] | | | $ | [removed: 197,414] [added: 189,712] | | | $ | [removed: 202,935] [added: 197,414] | |
| Long-term debt and other long-term liabilities 4 | | $ | [removed: 1,180,968] [added: 1,141,627] | | | $ | [removed: 380,944] [added: 1,180,968] | | | $ | [removed: 372,226] [added: 380,944] | | | $ | [removed: 71,215] [added: 372,226] | | | $ | [removed: 49,713] [added: 71,215] | |
| Stockholders’ equity | | $ | [removed: 1,235,860] [added: 1,651,185] | | | $ | [removed: 1,155,714] [added: 1,235,860] | | | $ | [removed: 1,203,566] [added: 1,155,714] | | | $ | [removed: 1,248,220] [added: 1,203,566] | | | $ | [removed: 1,198,226] [added: 1,248,220] | |
| Stockholders’ equity per share (book value) | | $ | [removed: 16.02] [added: 21.63] | | | $ | [removed: 14.66] [added: 16.02] | | | $ | [removed: 14.37] [added: 14.66] | | | $ | [removed: 14.29] [added: 14.37] | | | $ | [removed: 13.38] [added: 14.29] | |
| Return on equity | | | [removed: 29.8%] [added: 47.2%] | | | | [removed: 28.3%] [added: 29.8%] | | | | [removed: 21.2%] [added: 28.3%] | | | | [removed: 25.0%] [added: 21.2%] | | | | [removed: 25.6%] [added: 25.0%] | |
| Annual dividends declared per share | | $ | [removed: 1.92] [added: 2.02] | | | $ | [removed: 1.72] [added: 1.92] | | | $ | [removed: 1.56] [added: 1.72] | | | $ | [removed: 1.48] [added: 1.56] | | | $ | [removed: 1.40] [added: 1.48] | |
| Number of stores at year-end | | | [removed: 614] [added: 581] | | | | [removed: 625] [added: 614] | | | | [removed: 631] [added: 625] | | | | [removed: 629] [added: 631] | | | | [removed: 618] [added: 629] | |
| Store selling square footage at year-end | | | [removed: 4,129,000] [added: 3,975,000] | | | | [removed: 4,105,000] [added: 4,129,000] | | | | [removed: 4,019,000] [added: 4,105,000] | | | | [removed: 3,951,000] [added: 4,019,000] | | | | [removed: 3,827,000] [added: 3,951,000] | |
| Store leased square footage at year-end | | | [removed: 6,558,000] [added: 6,301,000] | | | | [removed: 6,557,000] [added: 6,558,000] | | | | [removed: 6,451,000] [added: 6,557,000] | | | | [removed: 6,359,000] [added: 6,451,000] | | | | [removed: 6,163,000] [added: 6,359,000] | |
| 1 | In fiscal 2018, we adopted [removed: ASU] [added: Accounting Standards Update (“ASU”)] 2014-09, Revenue from Contracts with Customers, using the modified retrospective method. Amounts reported for fiscal 2017 and [removed: prior years] [added: fiscal 2016] have not been adjusted, and continue to be reported in accordance with previous revenue recognition guidance. [removed: See Note A to the Consolidated Financial Statements.] | [removed: |]
| 2 | Comparable brand revenue is calculated on a 52-week to 52-week basis, with the exception of fiscal 2018 which is calculated on a 53-week to 53-week basis. See definition of comparable brand revenue within “Management’s Discussion and Analysis of Financial Condition and Results of Operations.” | [removed: |]
| 3 | Operating margin is defined as operating income as a percent of net revenues. | [removed: |]
| 4 | In fiscal 2019, we adopted [removed: Accounting Standards Update (“ASU”)] [added: ASU] 2016-02, Leases, as of the adoption date. Amounts reported for fiscal 2018 and prior years have not been adjusted, and continue to be reported in accordance with previous lease accounting guidance. See Note A to the Consolidated Financial Statements. | [removed: |]
| --- | --- |
| --- | --- |
| --- | --- |
| --- | --- |
| --- | --- | --- |
Item 8. FINANCIAL STATEMENTS AND SUPPLEMENTARY DATA
365 rewritten, 176 added, 268 removed, 575 unchanged
| In thousands, except per share amounts | | [added: |] Fiscal [removed: 2019] [added: 2020] (52 weeks) | | | | Fiscal [removed: 2018 (53] [added: 2019 (52] weeks) | | | | Fiscal [removed: 2017 (52] [added: 2018 (53] weeks) | | [removed: |]
| Net revenues | | $ | [removed: 5,898,008] [added: 6,783,189] | | | $ | [removed: 5,671,593] [added: 5,898,008] | | | $ | [removed: 5,292,359] [added: 5,671,593] | |
| Cost of goods sold | | | [removed: 3,758,916] [added: 4,146,920] | | | | [removed: 3,570,580] [added: 3,758,916] | | | | [removed: 3,360,648] [added: 3,570,580] | |
| Gross profit | | | [removed: 2,139,092] [added: 2,636,269] | | | | [removed: 2,101,013] [added: 2,139,092] | | | | [removed: 1,931,711] [added: 2,101,013] | |
| Selling, general and administrative expenses | | | [removed: 1,673,218] [added: 1,725,572] | | | | [removed: 1,665,060] [added: 1,673,218] | | | | [removed: 1,477,900] [added: 1,665,060] | |
| Operating income | | | [removed: 465,874] [added: 910,697] | | | | [removed: 435,953] [added: 465,874] | | | | [removed: 453,811] [added: 435,953] | |
| Interest [removed: (income)] expense, net | | | [removed: 8,853] [added: 16,231] | | | | [removed: 6,706] [added: 8,853] | | | | [removed: 1,372] [added: 6,706] | |
| Earnings before income taxes | | | [removed: 457,021] [added: 894,466] | | | | [removed: 429,247] [added: 457,021] | | | | [removed: 452,439] [added: 429,247] | |
| Income taxes | | | [removed: 100,959] [added: 213,752] | | | | [removed: 95,563] [added: 100,959] | | | | [removed: 192,894] [added: 95,563] | |
| Net earnings | | $ | [removed: 356,062] [added: 680,714] | | | $ | [removed: 333,684] [added: 356,062] | | | $ | [removed: 259,545] [added: 333,684] | |
| Basic earnings per share | | $ | [removed: 4.56] [added: 8.81] | | | $ | [removed: 4.10] [added: 4.56] | | | $ | [removed: 3.03] [added: 4.10] | |
| Diluted earnings per share | | $ | [removed: 4.49] [added: 8.61] | | | $ | [removed: 4.05] [added: 4.49] | | | $ | [removed: 3.02] [added: 4.05] | |
| Basic | | | [removed: 78,108] [added: 77,260] | | | | [removed: 81,420] [added: 78,108] | | | | [removed: 85,592] [added: 81,420] | |
| Diluted | | | [removed: 79,225] [added: 79,055] | | | | [removed: 82,340] [added: 79,225] | | | | [removed: 86,080] [added: 82,340] | |
| In thousands | | [added: |] Fiscal [removed: 2019] [added: 2020] (52 weeks) | | | | Fiscal [removed: 2018 (53] [added: 2019 (52] weeks) | | | | Fiscal [removed: 2017 (52] [added: 2018 (53] weeks) | | [removed: |]
| Foreign currency translation adjustments | | | [removed: (3,334] [added: 8,195] | [removed: )] | | | [removed: (5,032] [added: (3,334] | ) | | | [removed: 3,730] [added: (5,032] | [added: )] |
| Change in fair value of derivative financial instruments, net of tax (tax benefit) of [removed: $195, $390] [added: $(113), $ 195] and [removed: $(259)] [added: $390] | | | [removed: 163] [added: (315] | [added: )] | | | [removed: 1,098] [added: 163] | | | | [removed: (715] [added: 1,098] | [removed: )] |
| Reclassification adjustment for realized (gain) loss on derivative financial instruments, net of tax (tax benefit) of [removed: $261, $122] [added: $149, $261] and [removed: $(38)] [added: $122] | | | [removed: (343] [added: (410] | ) | | | [removed: (357] [added: (343] | ) | | | [removed: 106] [added: (357] | [added: )] |
| Comprehensive income | | [added: |] $ [added: 688,184] | [removed: 352,548] | | | $ [added: 352,548] | [removed: 329,393] | | | $ [removed: | 262,666] [added: 329,393] | |
| In thousands, except per share amounts | | [removed: Feb. 2, 2020] [added: Jan. 31, 2021] | | | | Feb. [removed: 3, 2019] [added: 2, 2020] | | |
| Cash and cash equivalents [added: at beginning of year] | | [removed: $] | 432,162 | | | [removed: $] | 338,954 | | [added: | | 390,136 | |]
| Accounts receivable, net | | | [removed: 111,737] [added: 143,728] | | | | [removed: 107,102] [added: 111,737] | |
| Merchandise inventories, net | | | [removed: 1,100,544] [added: 1,006,299] | | | | [removed: 1,124,992] [added: 1,100,544] | |
| Prepaid expenses | | | [removed: 90,426] [added: 93,822] | | | | [removed: 101,356] [added: 90,426] | |
| Other current assets | | | [removed: 20,766] [added: 22,894] | | | | [removed: 21,939] [added: 20,766] | |
| Total current assets | | | [removed: 1,755,635] [added: 2,467,080] | | | | [removed: 1,694,343] [added: 1,755,635] | |
| Property and equipment, net | | | [removed: 929,038] [added: 873,894] | | | | [removed: 929,635] [added: 929,038] | |
| Operating lease right-of-use assets | | | [removed: 1,166,383] [added: 1,086,009] | | | | [removed: —] [added: 1,166,383] | |
| Deferred income taxes, net | | | [removed: 47,977] [added: 61,854] | | | | [removed: 44,055] [added: 47,977] | |
| Goodwill | | | [removed: 85,343] [added: 85,446] | | | | [removed: 85,382] [added: 85,343] | |
| Other long-term assets, net | | | [removed: 69,666] [added: 87,141] | | | | [removed: 59,429] [added: 69,666] | |
| Total assets | | $ | [removed: 4,054,042] [added: 4,661,424] | | | $ | [removed: 2,812,844] [added: 4,054,042] | |
| Accounts payable | | $ | [removed: 521,235] [added: 542,992] | | | $ | [removed: 526,702] [added: 521,235] | |
| Accrued expenses | | | [removed: 175,003] [added: 267,592] | | | | [removed: 163,559] [added: 175,003] | |
| Gift card and other deferred revenue | | | [removed: 289,613] [added: 373,164] | | | | [removed: 290,445] [added: 289,613] | |
| Income taxes payable | | | [removed: 22,501] [added: 69,476] | | | | [removed: 21,461] [added: 22,501] | |
| Current debt | | | [removed: 299,818] [added: 299,350] | | | | [removed: —] [added: 299,818] | |
| Operating lease liabilities | | | [removed: 227,923] [added: 209,754] | | | | [removed: —] [added: 227,923] | |
| Other current liabilities | | | [removed: 73,462] [added: 85,672] | | | | [removed: 72,645] [added: 73,462] | |
| Total current liabilities | | | [removed: 1,609,555] [added: 1,848,000] | | | | [removed: 1,074,812] [added: 1,609,555] | |
| Net earnings | | | $ 680,714 | | | | $ 356,062 | | | | $ 333,684 | |
| Cash and cash equivalents | | $ | 1,200,337 | | | $ | 432,162 | |
| Deferred lease incentives | | | 20,612 | | | | 27,659 | |
| | | | | | | | | | | | | | | | | | | | | | | | | | | | | |
| Net earnings | | | — | | | | — | | | | — | | | | 680,714 | | | | — | | | | — | | | | 680,714 | |
| Conversion/release of stock-based awards 1 | | | 699 | | | | 7 | | | | (31,565 | ) | | | — | | | | — | | | | (171 | ) | | | (31,729 | ) |
| Repurchases of common stock | | | (1,496 | ) | | | (15 | ) | | | (7,569 | ) | | | (142,416 | ) | | | — | | | | — | | | | (150,000 | ) |
| Dividends declared | | | — | | | | — | | | | — | | | | (163,316 | ) | | | — | | | | — | | | | (163,316 | ) |
| Balance at January 31, 2021 | | | 76,340 | | | $ | 764 | | | $ | 638,375 | | | $ | 1,019,762 | | | $ | (7,117 | ) | | $ | (599 | ) | | $ | 1,651,185 | |
| Net earnings | | $ | 680,714 | | | $ | 356,062 | | | $ | 333,684 | |
We are also proud to lead the industry with our Environmental, Social and Governance (“ESG”) efforts.
year, ended on February 3, 2019.
year-end.
, respectively.
Given the material reductions in our retail store revenues and operating income during fiscal 2020 as a result of the COVID-19 pandemic, we evaluated our estimates and assumptions related to our stores’ future sales and cash flows, and performed a comprehensive review of our stores’ long-lived assets for impairment, including both property and equipment and operating lease
assets, at an individual store level.
Our assumptions
account for the estimated impact on future cash flows from the recent temporary store closures and capacity restrictions, including reduced store traffic and longer recovery times in those stores we have
re-opened,
as well as the reinstatement of closures or restrictions on retail capacity in certain areas.
These events and changes in circumstances, including a more prolonged and/or severe
pandemic and the reinstatement of closures or restrictions on retail capacity, may lead to increased impairment risk in the future; therefore, we will continue to monitor events and changes in circumstances that may indicate the need to test our long-lived assets, including goodwill, for potential impairment.
During fiscal 2020, we recognized asset impairment charges of approximately $19,204,000 related to property and equipment and $7,865,000 related to
During fiscal 2018, we recognized asset impairment charges of approximately $9,639,000 related to property and equipment for our retail stores, which is recognized within selling, general and administrative expenses.
right-of
Throughout fiscal 2020, we finalized rent concession negotiations with the majority of our store landlords due to the impact of temporary store closures from
We
considered the Financial Accounting Standards Board’s (“FASB”) guidance regarding lease modifications as a result of the effects of
and elected to apply the temporary practical expedient to account for lease changes as variable rent unless an amendment resulted in a substantial change in our lease obligations, in which case the amendment was accounted for as a remeasurement event, and we remeasured the lease liability and
asset.
The incremental
As of January 31, 2021 and February 2, 2020, we had goodwill of $85,446,000 and $85,343,000,
We currently do not expect the impact of COVID-19 to significantly affect the long-term estimates or assumptions of revenue and operating income growth, nor the long-term strategies of our brands considered in our goodwill assessment.
Accordingly,
Revenue from estimated unredeemed stored-value
cards (“breakage”) is
months from issuance.
Diluted earnings per share is computed as net earnings divided by the weighted
The adoption of this ASU resulted in an increase in total long-term assets and total liabilities of approximately
Financial Instruments—Credit Losses
| --- | --- | --- | --- | --- | --- | --- | --- | --- | --- | --- | --- | --- |
| Long-term debt | | | — | | | | 299,620 | |
| Balance at January 29, 2017 | | | 87,325 | | | $ | 873 | | | $ | 556,928 | | | $ | 701,702 | | | $ | (9,903 | ) | | $ | (1,380 | ) | | $ | 1,248,220 | |
| Net earnings | | | — | | | | — | | | | — | | | | 259,545 | | | | — | | | | — | | | | 259,545 | |
| Conversion/release of stock-based awards 1 | | | 452 | | | | 5 | | | | (17,810 | ) | | | — | | | | — | | | | (325 | ) | | | (18,130 | ) |
| Repurchases of common stock | | | (4,051 | ) | | | (41 | ) | | | (18,518 | ) | | | (177,620 | ) | | | — | | | | — | | | | (196,179 | ) |
| Dividends declared | | | — | | | | — | | | | — | | | | (135,779 | ) | | | — | | | | — | | | | (135,779 | ) |
| Prepaid catalog expenses | | | — | | | | — | | | | (1,019 | ) |
| Deferred rent and lease incentives | | | — | | | | 24,929 | | | | 28,226 | |
| Acquisition of Outward, Inc., net of cash received | | | — | | | | — | | | | (80,528 | ) |
| Proceeds from issuance of long-term debt | | | — | | | | — | | | | 300,000 | |
| Other | | | — | | | | — | | | | (1,197 | ) |
| Cash and cash equivalents at beginning of year | | | 338,954 | | | | 390,136 | | | | 213,713 | |
e-commerce
In 2017, we acquired Outward, Inc., a
3-D
imaging and augmented reality platform for the home furnishings and décor industry.
year, ended on January 28, 2018.
percentage
of net sales based on historical shrinkage results, cycle count results within our distribution centers, expectations of future shrinkage and current inventory levels.
year-end,
with the exception of a cycle count reserve based on the historical cycle count results in our distribution centers.
This reserve was not material to our Consolidated Financial Statements as of February 2, 2020.
| --- | --- | --- |
value
During fiscal 2019, we recorded an approximate
Standards Update (“ASU”)
During fiscal 2018, we recorded asset impairment charges of
9,639,000
During fiscal 2017, we did not record any asset impairment charges.
centers
and certain equipment for our U.S. and foreign operations with initial terms generally ranging from 2 to 22 years.
non-lease
future cash flows, using a discount rate that approximates our weighted average cost of capital.
Revenue
As of February 2, 2020 and February 3, 2019, we recorded a liability for expected sales returns of approximately
25,456,000 and $26,276,000
9,941,000
10,030,000
within other current assets in our Consolidated Balance Sheet.
An excerpt. Shown here: 40 of 365 rewritten, 40 of 176 added and 40 of 268 removed. The counts are complete. For every sentence, read Item 8. FINANCIAL STATEMENTS AND SUPPLEMENTARY DATA in the FY2020 filing and the FY2019 filing.
Item 9A. CONTROLS AND PROCEDURES
6 rewritten, 0 added, 1 removed, 14 unchanged
As of [removed: February 2, 2020,] [added: January 31, 2021,] an evaluation was performed by management, with the participation of our Chief Executive Officer (“CEO”) and our Chief Financial Officer (“CFO”), of the effectiveness of our disclosure controls and procedures.
Based on that evaluation, our management, including our CEO and CFO, concluded that our disclosure controls and procedures are effective to ensure that information we are required to disclose in reports that we file or submit under the Securities Exchange Act of 1934 is accumulated and communicated to our management, including our CEO and CFO, as appropriate, to allow for timely discussions regarding required [added: disclosures, and that such information is recorded, processed, summarized and reported within the time periods specified in the rules and forms of the SEC.]
Our management assessed the effectiveness of the [removed: company’s] [added: Company’s] internal control over financial reporting as of [removed: February 2, 2020.][added: January 31, 2021.]
Based on our assessment using those criteria, our management concluded that, as of [removed: February 2, 2020,] [added: January 31, 2021,] our internal control over financial reporting is effective.
Their audit report appears on pages [removed: 65] [added: 69] through [removed: 68] [added: 71] of this Annual Report on Form
There [removed: was] [added: were] no [removed: change] [added: significant changes] in our internal control over financial reporting that occurred during [removed: our most recent fiscal] [added: the fourth] quarter [added: of fiscal 2020,] that [removed: has] materially affected, or [removed: is] [added: are] reasonably likely to materially affect, our internal control over financial reporting.
disclosures, and that such information is recorded, processed, summarized and reported within the time periods specified in the rules and forms of the SEC.
Item 10. DIRECTORS, EXECUTIVE OFFICERS AND CORPORATE GOVERNANCE
1 rewritten, 0 added, 0 removed, 2 unchanged
Information required by this Item is incorporated by reference herein to information under the headings “Election of Directors,” “Information Concerning Executive Officers,” “Audit and Finance Committee Report,” “Corporate Governance — Corporate Governance Guidelines and Code of Business Conduct and Ethics,” and “Corporate Governance — Audit and Finance Committee” in our Proxy Statement for the [removed: 2020] [added: 2021] Annual Meeting of Stockholders (the “Proxy Statement”).
Item 14. PRINCIPAL ACCOUNTANT FEES AND SERVICES
1 rewritten, 0 added, 0 removed, 2 unchanged
Information required by this Item is incorporated by reference herein to information under the headings “Audit and Finance Committee Report” and “Proposal [removed: 3] [added: 4] — Ratification of Selection of Independent Registered Public Accounting Firm — Deloitte Fees and Services” in our Proxy Statement.
Item 15. EXHIBITS AND FINANCIAL STATEMENT SCHEDULES
66 rewritten, 12 added, 1 removed, 104 unchanged
| | | | | [Consolidated Statements of [removed: Earnings](#tx856872_22)] [added: Earnings](#tx93631_101)] | | | [removed: 41] [added: 46] | |
| | | | | [Consolidated Statements of Comprehensive [removed: Income](#tx856872_23)] [added: Income](#tx93631_102)] | | | [removed: 41] [added: 46] | |
| | | | | [Consolidated Balance [removed: Sheets](#tx856872_24)] [added: Sheets](#tx93631_103)] | | | [removed: 42] [added: 47] | |
| | | | | [Consolidated Statements of Stockholders’ [removed: Equity](#tx856872_25)] [added: Equity](#tx93631_104)] | | | [removed: 43] [added: 48] | |
| | | | | [Consolidated Statements of Cash [removed: Flows](#tx856872_26)] [added: Flows](#tx93631_105)] | | | [removed: 44] [added: 49] | |
| | | | | [Notes to Consolidated Financial [removed: Statements](#tx856872_27)] [added: Statements](#tx93631_106)] | | | [removed: 45] [added: 50] | |
| | | | | [Report of Independent Registered Public Accounting [removed: Firm](#tx856872_28)] [added: Firm](#tx93631_107)] | | | [removed: 65] [added: 69] | |
| | | | | [Quarterly Financial [removed: Information](#tx856872_29)] [added: Information](#tx93631_108)] | | | [removed: 68] [added: 72] | |
| [added: |] CERTIFICATE OF INCORPORATION AND BYLAWS | | | | [removed: |]
| | 3.2 | | | [Amended and Restated Bylaws [added: of Williams-Sonoma, Inc., effective June 3, 2020] (incorporated by reference to Exhibit 3.1 to the Company’s Current Report on Form 8-K as filed with the Commission on June [removed: 2, 2017,] [added: 9, 2020,] File No. [removed: 001-14077)](http://www.sec.gov/Archives/edgar/data/719955/000119312517193028/d406732dex31.htm)] [added: 001-14077)](http://www.sec.gov/Archives/edgar/data/719955/000119312520164672/d887906dex31.htm)] |
| [added: |] INSTRUMENTS DEFINING THE RIGHTS OF SECURITY HOLDERS, INCLUDING INDENTURES | | | | [removed: |]
| | 4.1 | | | [Form of Common Stock Certificate (incorporated by reference to Exhibit 4.1 to the Company’s Current Report on Form 8-K as filed with the Commission on May 25, 2011, File No. [removed: 001-14077)](https://www.sec.gov/Archives/edgar/data/719955/000119312520088937/d856872dex42.htm)] [added: 001-14077)](http://www.sec.gov/Archives/edgar/data/719955/000119312511150431/dex41.htm)] |
| [added: |] FINANCING AGREEMENTS | | | | [removed: |]
| | [removed: 10.2] [added: 10.3] | | | [Reimbursement Agreement between the Company, Williams-Sonoma Singapore Pte. Ltd. and Bank of America, N.A., dated as of August 30, 2013 (incorporated by reference to Exhibit 10.1 to the Company’s Quarterly Report on Form 10-Q for the period ended November 3, 2013 as filed with the Commission on December 12, 2013, File No. 001-14077)](http://www.sec.gov/Archives/edgar/data/719955/000119312513471753/d613006dex101.htm) |
| | [removed: 10.3] [added: 10.4] | | | [First Amendment to Reimbursement Agreement between the Company, Williams-Sonoma Singapore Pte. Ltd., and Bank of America, N.A., dated as of August 29, 2014 (incorporated by reference to Exhibit 10.1 to the Company’s Quarterly Report on Form 10-Q for the period ended November 2, 2014 as filed with the Commission on December 5, 2014, File No. 001-14077)](http://www.sec.gov/Archives/edgar/data/719955/000119312514434838/d798275dex101.htm) |
| | [removed: 10.4] [added: 10.5] | | | [Second Amendment to Reimbursement Agreement between the Company, Williams-Sonoma Singapore Pte. Ltd., and Bank of America, N.A., dated as of August 28, 2015 (incorporated by reference to Exhibit 10.1 to the Company’s Quarterly Report on Form 10-Q for the period ended November 1, 2015 as filed with the Commission on December 11, 2015, File No. 001-14077)](http://www.sec.gov/Archives/edgar/data/719955/000119312515401464/d39336dex101.htm) |
| | [removed: 10.5] [added: 10.6] | | | [Third Amendment to Reimbursement Agreement between the Company, Williams-Sonoma Singapore Pte. Ltd., and Bank of America, N.A., dated as of August 26, 2016 (incorporated by reference to Exhibit 10.1 to the Company’s Quarterly Report on Form 10-Q for the period ended October 30, 2016 as filed with the Commission on December 7, 2016, File No. 001-14077)](http://www.sec.gov/Archives/edgar/data/719955/000119312516787485/d268653dex101.htm) |
| | [removed: 10.6] [added: 10.7] | | | [Fourth Amendment to Reimbursement Agreement between the Company, Williams-Sonoma Singapore Pte. Ltd., and Bank of America, N.A., dated as of August 25, 2017 (incorporated by reference to Exhibit 10.1 to the Company’s Quarterly Report on Form 10-Q for the period ended October 29, 2017 as filed with the Commission on December 6, 2017, File No. 001-14077)](http://www.sec.gov/Archives/edgar/data/719955/000119312517362895/d466116dex101.htm) |
| | [removed: 10.7] [added: 10.8] | | | [Fifth Amendment to Reimbursement Agreement between the Company, Williams-Sonoma Singapore Pte. Ltd., and Bank of America, N.A., dated as of August 24, 2018 (incorporated by reference to Exhibit 10.1 to the Company’s Quarterly Report on Form 10-Q for the period ended October 28, 2018 as filed with the Commission on December 7, 2018, File No. [removed: 001-12077)](http://www.sec.gov/Archives/edgar/data/719955/000119312518344956/d563678dex101.htm)] [added: 001-14077)](http://www.sec.gov/Archives/edgar/data/719955/000119312518344956/d563678dex101.htm)] |
| | [removed: 10.8] [added: 10.9] | | | [Sixth Amendment to Reimbursement Agreement between the Company, Williams-Sonoma Singapore Pte. Ltd., and Bank of America, N.A., dated as of August 23, 2019 (incorporated by reference to Exhibit 10.1 to the Company’s Quarterly Report on Form 10-Q for the period ended November 3, 2019 as filed with the Commission on December 12, 2019, File No. [removed: 001-14077)](http://www.sec.gov/Archives/edgar/data/719955/000119312518344956/d563678dex101.htm)] [added: 001-14077)](http://www.sec.gov/Archives/edgar/data/719955/000119312519312802/d813200dex101.htm)] |
| | [removed: 10.9] [added: 10.11] | | | [Reimbursement Agreement between the Company, Williams-Sonoma Singapore Pte. Ltd., and Wells Fargo Bank, N.A., dated as of August 30, 2013 (incorporated by reference to Exhibit 10.2 to the Company’s Quarterly Report on Form 10-Q for the period ended November 3, 2013 as filed with the Commission on December 12, 2013, File No. 001-14077)](http://www.sec.gov/Archives/edgar/data/719955/000119312513471753/d613006dex102.htm) |
| | [removed: 10.10] [added: 10.12] | | | [First Amendment to Reimbursement Agreement between the Company, Williams-Sonoma Singapore Pte. Ltd., and Wells Fargo Bank, N.A., dated as of August 29, 2014 (incorporated by reference to Exhibit 10.2 to the Company’s Quarterly Report on Form 10-Q for the period ended November 2, 2014 as filed with the Commission on December 5, 2014, File No. 001-14077)](http://www.sec.gov/Archives/edgar/data/719955/000119312514434838/d798275dex102.htm) |
| | [removed: 10.11] [added: 10.13] | | | [Second Amendment to Reimbursement Agreement between the Company, Williams-Sonoma Singapore Pte. Ltd., and Wells Fargo Bank, N.A., dated as of August 28, 2015 (incorporated by reference to Exhibit 10.2 to the Company’s Quarterly Report on Form 10-Q for the period ended November 1, 2015 as filed with the Commission on December 11, 2015, File No. 001-14077)](http://www.sec.gov/Archives/edgar/data/719955/000119312515401464/d39336dex102.htm) |
| | [removed: 10.12] [added: 10.14] | | | [Third Amendment to Reimbursement Agreement between the Company, Williams-Sonoma Singapore Pte. Ltd., and Wells Fargo Bank, N.A., dated as of August 26, 2016 (incorporated by reference to Exhibit 10.2 to the Company’s Quarterly Report on Form 10-Q for the period ended October 30, 2016 as filed with the Commission on December 7, 2016, File No. 001-14077)](http://www.sec.gov/Archives/edgar/data/719955/000119312516787485/d268653dex102.htm) |
| | [removed: 10.13] [added: 10.15] | | | [Fourth Amendment to Reimbursement Agreement between the Company, Williams-Sonoma Singapore Pte. Ltd., and Wells Fargo Bank, N.A., dated as of August 25, 2017 (incorporated by reference to Exhibit [removed: 10.1] [added: 10.2] to the Company’s Quarterly Report on Form 10-Q for the period ended October 29, 2017 as filed with the Commission on December 6, 2017, File No. [removed: 001-14077)](http://www.sec.gov/Archives/edgar/data/719955/000119312517362895/d466116dex101.htm)] [added: 001-14077)](http://www.sec.gov/Archives/edgar/data/0000719955/000119312517362895/d466116dex102.htm)] |
| | [removed: 10.14] [added: 10.16] | | | [Fifth Amendment to Reimbursement Agreement between the Company, Williams-Sonoma Singapore Pte. Ltd., and Wells Fargo Bank, N.A., dated as of August 24, 2018 (incorporated by reference to Exhibit 10.2 to the Company’s Quarterly Report on Form 10-Q for the period ended October 28, 2018 as filed with the Commission on December 7, 2018, File [removed: No.001-14077)](http://www.sec.gov/Archives/edgar/data/719955/000119312518344956/d563678dex102.htm)] [added: No. 001-14077)](http://www.sec.gov/Archives/edgar/data/719955/000119312518344956/d563678dex102.htm)] |
| | [removed: 10.15] [added: 10.17] | | | [Sixth Amendment to Reimbursement Agreement between the Company, Williams-Sonoma Singapore Pte. Ltd., and Wells Fargo Bank, N.A., dated as of August 23, 2019 (incorporated by reference to Exhibit 10.2 to the Company’s Quarterly Report on Form 10-Q for the period ended November 3, 2019 as filed with the Commission on December 12, 2019, File No. [removed: 001-14077)](http://www.sec.gov/Archives/edgar/data/719955/000119312518344956/d563678dex101.htm)] [added: 001-14077)](http://www.sec.gov/Archives/edgar/data/719955/000119312519312802/d813200dex102.htm)] |
| | [removed: 10.16] [added: 10.19] | | | [Reimbursement Agreement between the Company, Williams-Sonoma Singapore Pte. Ltd., and U.S. Bank National Association, dated as of August 30, 2013 (incorporated by reference to Exhibit 10.3 to the Company’s Quarterly Report on Form 10-Q for the fiscal quarter ended November 3, 2013 as filed with the Commission on December 12, 2013, File No. 001-14077)](http://www.sec.gov/Archives/edgar/data/719955/000119312513471753/d613006dex103.htm) |
| | [removed: 10.17] [added: 10.20] | | | [First Amendment to Reimbursement Agreement between the Company, Williams-Sonoma Singapore Pte. Ltd., and U.S. Bank National Association, dated as of August 29, 2014 (incorporated by reference to Exhibit 10.3 to the Company’s Quarterly Report on Form 10-Q for the fiscal quarter ended November 2, 2014 as filed with the Commission on December 5, 2014, File No. 001-14077)](http://www.sec.gov/Archives/edgar/data/719955/000119312514434838/d798275dex103.htm) |
| | [removed: 10.18] [added: 10.21] | | | [Second Amendment to Reimbursement Agreement between the Company, Williams-Sonoma Singapore Pte. Ltd., and U.S. Bank National Association, dated as of August 28, 2015 (incorporated by reference to Exhibit 10.3 to the Company’s Quarterly Report on Form 10-Q for the period ended November 1, 2015 as filed with the Commission on December 11, 2015, File No. 001-14077)](http://www.sec.gov/Archives/edgar/data/719955/000119312515401464/d39336dex103.htm) |
| | [removed: 10.19] [added: 10.22] | | | [Third Amendment to Reimbursement Agreement between the Company, Williams-Sonoma Singapore Pte. Ltd., and U.S. Bank National Association, dated as of August 26, 2016 (incorporated by reference to Exhibit 10.3 to the Company’s Quarterly Report on Form 10-Q for the period ended October 30, 2016 as filed with the Commission on December 7, 2016, File No. 001-14077)](http://www.sec.gov/Archives/edgar/data/719955/000119312516787485/d268653dex103.htm) |
| | [removed: 10.20] [added: 10.23] | | | [Fourth Amendment to Reimbursement Agreement between the Company, Williams-Sonoma Singapore Pte. Ltd., and U.S. Bank National Association, dated as of August 25, 2017 (incorporated by reference to Exhibit 10.3 to the Company’s Quarterly Report on Form 10-Q for the period ended October 29, 2017 as filed with the Commission on December 6, 2017, File No. 001-14077)](http://www.sec.gov/Archives/edgar/data/719955/000119312517362895/d466116dex103.htm) |
| | [removed: 10.21] [added: 10.24] | | | [Fifth Amendment to Reimbursement Agreement between the Company, Williams-Sonoma Singapore Pte. Ltd., and U.S. Bank National Association, dated as of August 24, 2018 (incorporated by reference to Exhibit 10.3 to the Company’s Quarterly Report on the Form 10-Q for the period ended October 28, 2018 as filed with the Commission on December 7, 2018, File No. 001-14077)](http://www.sec.gov/Archives/edgar/data/719955/000119312518344956/d563678dex103.htm) |
| | [removed: 10.22] [added: 10.25] | | | [Sixth Amendment to Reimbursement Agreement between the Company, Williams-Sonoma Singapore Pte. Ltd., and U.S. Bank National Association, dated as of August 23, 2019 (incorporated by reference to Exhibit 10.3 to the Company’s Quarterly Report on Form 10-Q for the period ended November 3, 2019 as filed with the Commission on December 12, 2019, File No. [removed: 001-14077)](http://www.sec.gov/Archives/edgar/data/719955/000119312518344956/d563678dex101.htm)] [added: 001-14077)](http://www.sec.gov/Archives/edgar/data/719955/000119312519312802/d813200dex103.htm)] |
| [added: |] STOCK PLANS | | | | [removed: |]
| | [removed: 10.23+] [added: 10.28+] | | | [Williams-Sonoma, Inc. 2001 Long-Term Incentive Plan, as amended (incorporated by reference to Exhibit A to the Company’s definitive proxy statement as filed on April 13, 2018, File No. 001-14077)](http://www.sec.gov/Archives/edgar/data/719955/000119312518116995/d561100ddef14a.htm#toc561100_26) |
| | [removed: 10.24+] [added: 10.29+] | | | [Form of Williams-Sonoma, Inc. 2001 Long-Term Incentive Plan Restricted Stock Unit Award Agreement for Grants to Non-Employee Directors (incorporated by reference to Exhibit 10.1 to the Company’s Quarterly Report on Form 10-Q for the period ended May 5, 2019 as filed with the Commission on June 14, 2019, File No. 001-14077)](http://www.sec.gov/Archives/edgar/data/719955/000119312514234823/d712968dex101.htm) |
| | [removed: 10.25+] [added: 10.30+] | | | [Form of Williams-Sonoma, Inc. 2001 Long-Term Incentive Plan Restricted Stock Unit Award Agreement for Grants to Employees (incorporated by reference to Exhibit [removed: 10.2] [added: 10.1] to the Company’s Quarterly Report on Form 10-Q for the period ended August 4, 2019 as filed with the Commission on September 12, 2019, File No. [removed: 001-14077)](http://www.sec.gov/Archives/edgar/data/719955/000119312514234823/d712968dex102.htm)] [added: 001-14077)](http://www.sec.gov/Archives/edgar/data/719955/000119312519244032/d775044dex101.htm)] |
| | [removed: 10.26+] [added: 10.31+] | | | [Form of Williams-Sonoma, Inc. 2001 Long-Term Incentive Plan Performance Stock Unit Award Agreement for Grants to Employees (incorporated by reference to Exhibit 10.15 to the Company’s Annual Report on Form 10-K for the fiscal year ended February 2, 2014 as filed with the Commission on April 3, 2014, File No. 001-14077)](http://www.sec.gov/Archives/edgar/data/719955/000119312514129974/d659151dex1015.htm) |
| | [removed: 10.27+] [added: 10.32+] | | | [Form of Williams-Sonoma, Inc. 2001 Long-Term Incentive Plan Retention Restricted Stock Unit Award Agreement for Grants to Employees (incorporated by reference to Exhibit 10.1 to the Company’s Quarterly Report on Form 10-Q for the period ended July 30, 2017 as filed with the Commission on September 8, 2017, File No. 001-14077)](http://www.sec.gov/Archives/edgar/data/719955/000119312517280597/d424250dex101.htm) |
| | 4.2 | | | [Description of Registrant’s Securities (incorporated by reference to Exhibit 4.2 to the Company’s Annual Report on Form 10-K for the fiscal year ended February 2, 2020 as filed with the Commission on March 27, 2020, File No. 001-14077)](http://www.sec.gov/Archives/edgar/data/719955/000119312520088937/d856872dex42.htm) |
| | 10.2 | | | [First Amendment to Seventh Amended and Restated Credit Agreement, dated January 8, 2018 (as amended on May 11, 2020), between the Company and Bank of America, N.A., as administrative agent, letter of credit issuer and swingline lender, Wells Fargo Bank, National Association, as syndication agent and the lenders party thereto (incorporated by reference to Exhibit 10.1 to the Company’s Quarterly Report on Form 10-Q for the period ended August 2, 2020 as filed with the Commission on September 9, 2020, File No. 001-14077)](http://www.sec.gov/Archives/edgar/data/719955/000119312520242226/d87421dex101.htm) |
| | 10.10 | | | [Seventh Amendment to Reimbursement Agreement between the Company, Williams-Sonoma Singapore Pte. Ltd., and Bank of America, N.A., dated as of August 23, 2020 (incorporated by reference to Exhibit 10.1 to the Company’s Quarterly Report on Form 10-Q for the period ended November 1, 2020 as filed with the Commission on December 7, 2020, File No. 001-14077)](http://www.sec.gov/Archives/edgar/data/719955/000119312520310847/d97689dex101.htm) |
| | 10.18 | | | [Seventh Amendment to Reimbursement Agreement between the Company, Williams-Sonoma Singapore Pte. Ltd., and Wells Fargo Bank, N.A., dated as of August 23, 2020 (incorporated by reference to Exhibit 10.2 to the Company’s Quarterly Report on Form 10-Q for the period ended November 1, 2020 as filed with the Commission on December 7, 2020, File No. 001-14077)](http://www.sec.gov/Archives/edgar/data/719955/000119312520310847/d97689dex102.htm) |
| | 10.26 | | | [Seventh Amendment to Reimbursement Agreement between the Company, Williams-Sonoma Singapore Pte. Ltd., and U.S. Bank National Association, dated as of August 23, 2020 (incorporated by reference to Exhibit 10.3 to the Company’s Quarterly Report on Form 10-Q for the period ended November 1, 2020 as filed with the Commission on December 7, 2020, File No. 001-14077)](http://www.sec.gov/Archives/edgar/data/719955/000119312520310847/d97689dex103.htm) |
| | 10.27 | | | [364-Day Credit Agreement, dated May 11, 2020, among the Company and Bank of America, N.A., as agent, Fifth Third Bank, National Association and U.S. Bank National Association, as co-syndication agents and the lenders party thereto (incorporated by reference to Exhibit 10.2 to the Company’s Quarterly Report on Form 10-Q for the period ended August 2, 2020 as filed with the Commission on September 9, 2020, File No. 001-14077)](http://www.sec.gov/Archives/edgar/data/719955/000119312520242226/d87421dex102.htm) |
| | | | | |
| | | | | |
| | | | | |
| | | | | |
| | | | | |
| | | | | |
| | 4.2 | * | | [Description of the Registrant’s Securities Registered Pursuant to Section 12 of the Securities Exchange Act of 1934](https://www.sec.gov/Archives/edgar/data/719955/000119312520088937/d856872dex42.htm) |
An excerpt. Shown here: 40 of 66 rewritten, all 12 added and all 1 removed. The counts are complete. For every sentence, read Item 15. EXHIBITS AND FINANCIAL STATEMENT SCHEDULES in the FY2020 filing and the FY2019 filing.
Item 16. FORM 10-K SUMMARY
8 rewritten, 0 added, 6 removed, 34 unchanged
| Date: March [removed: 27, 2020] [added: 30, 2021] | | | | By | | [removed: /s/] [added: /S/] LAURA ALBER |
| Date: March [removed: 27, 2020] [added: 30, 2021] | | /s/ LAURA ALBER |
| Date: March [removed: 27, 2020] [added: 30, 2021] | | /s/ JULIE WHALEN |
| Date: March [removed: 27, 2020] [added: 30, 2021] | | /s/ SCOTT DAHNKE |
| Date: March [removed: 27, 2020] [added: 30, 2021] | | /s/ ANNE MULCAHY |
| Date: March [removed: 27, 2020] [added: 30, 2021] | | /s/ WILLIAM READY |
| Date: March [removed: 27, 2020] [added: 30, 2021] | | /s/ SABRINA SIMMONS |
| Date: March [removed: 27, 2020] [added: 30, 2021] | | /s/ FRITS VAN PAASSCHEN |
| | | |
| Date: March 27, 2020 | | /s/ ADRIAN BELLAMY |
| | | Adrian Bellamy |
| | | Director |
| Date: March 27, 2020 | | /s/ GRACE PUMA |
| | | Grace Puma |