 filings.tools
Item 5. Market for Registrant’s Common Equity, Related Stockholder Matters and Issuer Purchases of Equity Securities
3K characters. Original on sec.gov ·
Item 5. Market for Registrant’s Common Equity, Related Stockholder Matters and Issuer Purchases of Equity Securities
Stock Information: Price Range and Common Stock
Our Class A common stock is traded on the NASDAQ Stock Market under the symbol ZBRA. The following table shows the high and low trade prices for each fiscal quarter in 2016 and 2015, as reported by the NASDAQ Stock Market.
| 2016 | High | Low | 2015 | High | Low | |||||||||||||
| First Quarter | $ | 70.30 | $ | 52.14 | First Quarter | $ | 92.48 | $ | 74.40 | |||||||||
| Second Quarter | 68.49 | 48.51 | Second Quarter | 119.47 | 88.41 | |||||||||||||
| Third Quarter | 71.61 | 46.13 | Third Quarter | 117.00 | 71.95 | |||||||||||||
| Fourth Quarter | 88.00 | 62.91 | Fourth Quarter | 83.02 | 63.92 |
Source: The NASDAQ Stock Market
At February 20, 2017, the last reported price for the Class A common stock was $85.99 per share, and there were 140 registered stockholders of record for Zebra’s Class A common stock. In addition, we had approximately 25,868 stockholders who owned our stock in street name.
Dividend Policy
Since our initial public offering in 1991, we have not declared any cash dividends or distributions on our capital stock. We currently do not anticipate paying any cash dividends in the foreseeable future.
Treasury Shares
We did not purchase shares of Zebra Class A common stock during 2016 as part of the purchase plan program.
In November 2011, our Board authorized the purchase of up to an additional 3,000,000 shares under the purchase plan program and the maximum number of shares that may yet be purchased under the program is 665,475. The November 2011 authorization does not have an expiration date.
Stock Performance Graph
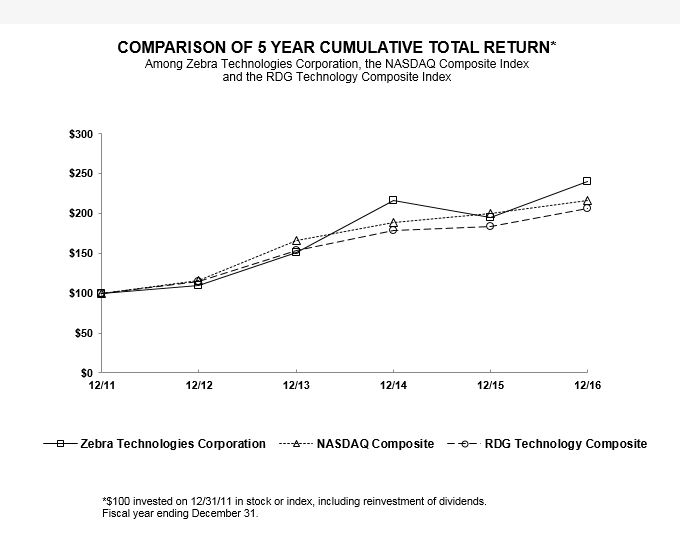
This graph compares the cumulative annual change since December 31, 2011, of the total stockholder return of Zebra Technologies Corporation Class A common stock with the cumulative return on the following published indices: (i) the RDG Technology Composite; and (ii) the NASDAQ Composite Market Index, during the same period. The comparison assumes that $100 was invested in each of the Company’s Class A common stock, the stocks comprising the RDG Technology Composite and the stocks comprising the NASDAQ Composite Market Index on December 31, 2011. The comparison assumes that all dividends were reinvested at the end of the month in which they were paid.
Previous: Item 4. Mine Safety Disclosures · Next: Item 6. Selected Financial Data