 filings.tools
Alexandria Real Estate Equities 10-K 2023-12-31
Filed 2024-01-29. 23 sections, 1091K characters. Original on sec.gov · Markdown · JSON
Cover and table of contents
UNITED STATES
SECURITIES AND EXCHANGE COMMISSION
Washington, D.C. 20549
FORM 10-K
(Mark One) ☒ ANNUAL REPORT PURSUANT TO SECTION 13 OR 15(d) OF THE SECURITIES EXCHANGE ACT OF 1934
For the fiscal year ended December 31, 2023
Commission file number 1-12993
ALEXANDRIA REAL ESTATE EQUITIES, INC.
(Exact name of registrant as specified in its charter)
| Maryland | 95-4502084 | |||||||
| (State or other jurisdiction of incorporation or organization) | (I.R.S. Employer Identification Number) |
26 North Euclid Avenue, Pasadena, California 91101
(Address of principal executive offices) (Zip code)
(626) 578-0777
(Registrant’s telephone number, including area code)
Securities registered pursuant to Section 12(b) of the Act:
| Title of each class | Trading Symbol(s) | Name of each exchange on which registered | ||||||
| Common Stock, $0.01 par value per share | ARE | New York Stock Exchange |
Securities registered pursuant to Section 12(g) of the Act: None
Indicate by check mark if the registrant is a well-known seasoned issuer, as defined in Rule 405 of the Securities Act. Yes ☒ No ☐
Indicate by check mark if the registrant is not required to file reports pursuant to Section 13 or Section 15(d) of the Act. Yes ☐ No ☒
Indicate by check mark whether the registrant (1) has filed all reports required to be filed by Section 13 or 15(d) of the Securities Exchange Act of 1934 during the preceding 12 months (or for such shorter period that the registrant was required to file such reports), and (2) has been subject to such filing requirements for the past 90 days. Yes ☒ No ☐
Indicate by check mark whether the registrant has submitted electronically every Interactive Data File required to be submitted pursuant to Rule 405 of Regulation S-T (§ 232.405 of this chapter) during the preceding 12 months (or for such shorter period that the registrant was required to submit such files). Yes ☒ No ☐
Indicate by check mark whether the registrant is a large accelerated filer, an accelerated filer, a non-accelerated filer, a smaller reporting company, or an emerging growth company. See the definitions of “large accelerated filer,” “accelerated filer,” “smaller reporting company,” and “emerging growth company” in Rule 12b-2 of the Exchange Act.
| Large accelerated filer | ☒ | Smaller reporting company | ☐ | |||||||||||
| Accelerated filer | ☐ | Emerging growth company | ☐ | |||||||||||
| Non-accelerated filer | ☐ |
If an emerging growth company, indicate by check mark if the registrant has elected not to use the extended transition period for complying with any new or revised financial accounting standards provided pursuant to Section 13(a) of the Exchange Act. ☐
Indicate by check mark whether the registrant has filed a report on and attestation to its management’s assessment of the effectiveness of its internal control over financial reporting under Section 404(b) of the Sarbanes-Oxley Act (15 U.S.C. 7262(b)) by the registered public accounting firm that prepared or issued its audit report. ☒
If securities are registered pursuant to Section 12(b) of the Act, indicate by check mark whether the financial statements of the registrant included in the filing reflect the correction of an error to previously issued financial statements. ☐
Indicate by check mark whether any of those error corrections are restatements that required a recovery analysis of incentive-based compensation received by any of the registrant’s executive officers during the relevant recovery period pursuant to §240.10D-1(b). ☐
Indicate by check mark whether the registrant is a shell company (as defined in Rule 12b-2 of the Exchange Act). Yes ☐ No ☒
The aggregate market value of the shares of Common Stock held by non-affiliates of registrant was approximately $19.5 billion based on the closing price for such shares on the New York Stock Exchange on June 30, 2023.
As of January 12, 2024, 174,968,259 shares of common stock were outstanding.
Documents Incorporated by Reference
Part III of this annual report on Form 10-K incorporates certain information by reference from the registrant’s definitive proxy statement to be filed within 120 days of the end of the fiscal year covered by this annual report on Form 10-K in connection with the registrant’s annual meeting of stockholders to be held on or about May 14, 2024.
INDEX TO FORM 10-K
ALEXANDRIA REAL ESTATE EQUITIES, INC.
GLOSSARY
The following abbreviations or acronyms that may be used in this document shall have the adjacent meanings set forth below:
| ASU | Accounting Standards Update | ||||
| ATM | At the Market | ||||
| CIP | Construction in Progress | ||||
| EPS | Earnings per Share | ||||
| FASB | Financial Accounting Standards Board | ||||
| FDA | U.S. Food and Drug Administration | ||||
| FDIC | Federal Deposit Insurance Corporation | ||||
| FFO | Funds From Operations | ||||
| GAAP | U.S. Generally Accepted Accounting Principles | ||||
| HVAC | Heating, Ventilation, and Air Conditioning | ||||
| IRS | Internal Revenue Service | ||||
| JV | Joint Venture | ||||
| LEED® | Leadership in Energy and Environmental Design | ||||
| Nareit | National Association of Real Estate Investment Trusts | ||||
| NAV | Net Asset Value | ||||
| NYSE | New York Stock Exchange | ||||
| REIT | Real Estate Investment Trust | ||||
| RSF | Rentable Square Feet/Foot | ||||
| SEC | Securities and Exchange Commission | ||||
| SF | Square Feet/Foot | ||||
| SoDo | South of Downtown submarket of Seattle | ||||
| SOFR | Secured Overnight Financing Rate | ||||
| SoMa | South of Market submarket of San Francisco | ||||
| U.S. | United States | ||||
| VIE | Variable Interest Entity |
PART I
Forward-looking statements
Certain information and statements included in this annual report on Form 10-K, including, without limitation, statements containing the words “forecast,” “guidance,” “goals,” “projects,” “estimates,” “anticipates,” “believes,” “expects,” “intends,” “may,” “plans,” “seeks,” “should,” “targets,” or “will,” or the negative of those words or similar words, constitute “forward-looking statements” within the meaning of Section 27A of the Securities Act of 1933, as amended, and Section 21E of the Securities Exchange Act of 1934, as amended. Forward-looking statements involve inherent risks and uncertainties regarding events, conditions, and financial trends that may affect our future plans of operations, business strategy, results of operations, and financial position. A number of important factors could cause actual results to differ materially from those included within or contemplated by the forward-looking statements, including, but not limited to, the description of risks and uncertainties in “Item 1A. Risk factors” in this annual report on Form 10-K. Additional information regarding risk factors that may affect us is included in “Item 7. Management’s discussion and analysis of financial condition and results of operations” in this annual report on Form 10-K. Readers of our annual report on Form 10-K should also read our SEC and other publicly filed documents for further discussion regarding such factors.
As used in this annual report on Form 10-K, references to the “Company,” “Alexandria,” “ARE,” “we,” “us,” and “our” refer to Alexandria Real Estate Equities, Inc. and its consolidated subsidiaries. The following discussion should be read in conjunction with our consolidated financial statements and notes thereto under “Item 15. Exhibits and financial statement schedules” in this annual report on Form 10-K.
Item 1. BUSINESS
Overview
We are a Maryland corporation formed in October 1994 that has elected to be taxed as a REIT for federal income tax purposes. Alexandria Real Estate Equities, Inc. (NYSE: ARE), an S&P 500® company, is a best-in-class, mission-driven life science REIT making a positive and lasting impact on the world. As the pioneer of the life science real estate niche since our founding in 1994, Alexandria is the preeminent and longest-tenured owner, operator, and developer of collaborative life science, agtech, and advanced technology mega campuses in AAA innovation cluster locations, including Greater Boston, the San Francisco Bay Area, New York City, San Diego, Seattle, Maryland, and Research Triangle. Alexandria has a total market capitalization of $33.1 billion and an asset base in North America of 73.5 million SF as of December 31, 2023. This asset base includes 42.0 million RSF of operating properties, 5.5 million RSF of Class A/A+ properties undergoing construction and one near-term project expected to commence construction in the next two years, 2.1 million RSF of priority anticipated development and redevelopment projects, and 23.9 million SF of future development projects.
We develop dynamic mega campuses and vibrant ecosystems that enable and inspire the world’s most brilliant minds and innovative companies to create life-changing scientific and technological innovations. We believe in the utmost professionalism, humility, and teamwork. Our tenants include multinational pharmaceutical companies; public and private biotechnology companies; life science product, service, and medical device companies; digital health, technology, and agtech companies; academic and medical research institutions; U.S. government research agencies; non-profit organizations; and venture capital firms. Alexandria has a longstanding and proven track record of developing Class A/A+ properties clustered in life science, agtech, and advanced technology mega campuses that provide our innovative tenants with highly dynamic and collaborative environments that enhance their ability to successfully recruit and retain world-class talent and inspire productivity, efficiency, creativity, and success. Alexandria also provides strategic capital to transformative life science, agrifoodtech, climate innovation, and technology companies through our venture capital platform. We believe our unique business model and diligent underwriting ensure a high-quality and diverse tenant base that results in higher occupancy levels, longer lease terms, higher rental income, higher returns, and greater long-term asset value.
As of December 31, 2023, we had 411 properties in North America consisting of approximately 47.2 million RSF of operating properties and new Class A/A+ development and redevelopment properties under construction, including 68 operating properties and development projects that are held by consolidated real estate joint ventures and four properties that are held by unconsolidated real estate joint ventures. The occupancy percentage of our operating properties in North America was 94.6% as of December 31, 2023. The 10-year average occupancy percentage of our operating properties as of December 31, 2023 was 96%. Investment-grade or publicly traded large cap tenants represented 52% of our total annual rental revenue in effect as of December 31, 2023. Additional information regarding our consolidated and unconsolidated real estate joint ventures is included in “Item 7. Management’s discussion and analysis of financial condition and results of operations” in this annual report on Form 10-K. Additional information regarding risk factors that may affect us is included in “Item 1A. Risk factors” and “Item 7. Management’s discussion and analysis of financial condition and results of operations” in this annual report on Form 10-K.
Business objective and strategies
Our primary business objective is to maximize long-term asset value and stockholder returns based on a multifaceted platform of internal and external growth. A key element of our strategy is our unique focus on Class A/A+ properties located in collaborative life science, agtech, and advanced technology mega campuses in AAA innovation clusters. These key campus locations are generally characterized by high barriers to entry for new landlords, high barriers to exit for tenants, and a limited supply of available space. They generally represent highly desirable locations for tenancy by life science, agtech, and technology entities because of their close proximity to concentrations of specialized skills, knowledge, institutions, and related businesses. Our strategy also includes drawing upon our deep and broad real estate, life science, agtech, and technology relationships in order to identify and attract new and leading tenants and to source additional value-creation real estate.
Our tenant base is broad and diverse within the life science, agtech, and technology industries and reflects our focus on regional, national, and international tenants with substantial financial and operational resources. For a more detailed description of our properties and tenants, refer to “Item 2. Properties” in this annual report on Form 10-K. We have an experienced Board of Directors (the “Board”) and are led by an executive and senior management team with extensive experience in the real estate, life science, agtech, and technology industries.
Acquisitions
We seek to identify and acquire high-quality properties in our cluster markets. Critical evaluation of prospective property acquisitions is an essential component of our acquisition strategy. When evaluating acquisition opportunities, we assess a full range of matters relating to the prospective property or properties, including:
-
Proximity to centers of innovation and technological advances;
-
Location of the property and our strategy in the relevant market, including our mega campus strategy;
-
Quality of existing and prospective tenants;
-
Condition and capacity of the building infrastructure;
-
Physical condition of the structure and common area improvements;
-
Quality and generic characteristics of the improvements;
-
Opportunities available for leasing vacant space and for re-tenanting or renewing occupied space;
-
Availability of and/or ability to add appropriate tenant amenities;
-
Availability of land for future ground-up development of new space;
-
Opportunities to generate higher rent through redevelopment of existing space;
-
The property’s unlevered yields;
-
Potential impacts of climate change and extreme weather conditions; and
-
Our ability to increase the property’s long-term financial returns.
Development, redevelopment, and pre-construction
A key component of our business model is our disciplined allocation of capital to the development and redevelopment of new Class A/A+ properties, and property enhancements identified during the underwriting of certain acquired properties, located in collaborative life science, agtech, and advanced technology mega campuses in AAA innovation clusters. These projects are generally focused on providing high-quality, generic, and reusable spaces that meet the real estate requirements of a wide range of tenants. Upon completion, each value-creation project is expected to generate increases in rental income, net operating income, and cash flows. Our development and redevelopment projects are generally in locations that are highly desirable to high-quality entities, which we believe results in higher occupancy levels, longer lease terms, higher rental income, higher returns, and greater long-term asset value.
Development projects generally consist of the ground-up development of generic and reusable laboratory facilities. Redevelopment projects consist of the permanent change in use of acquired office, warehouse, or shell space into laboratory, agtech, or advanced technology space. We generally will not commence new development projects for aboveground construction of new Class A/A+ laboratory, agtech, and advanced technology space without first securing significant pre-leasing for such space, except when there is solid market demand for high-quality Class A/A+ properties.
Pre-construction activities include entitlements, permitting, design, site work, and other activities preceding commencement of construction of aboveground building improvements. The advancement of pre-construction efforts is focused on reducing the time required to deliver projects to prospective tenants. These critical activities add significant value for future ground-up development and are required for the vertical construction of buildings. Ultimately, these projects will provide high-quality facilities and are expected to generate significant revenue and cash flows.
Another key component of our business model is our value-creation redevelopment of acquired office, warehouse, or shell space into high-quality, generic, and reusable laboratory space that can be leased at higher rental rates. Our redevelopment strategy generally includes significant pre-leasing of projects prior to the commencement of redevelopment.
Non-real estate investments
We also hold strategic investments in publicly traded companies and privately held entities primarily involved in the life science, agtech, and technology industries. We invest primarily in highly innovative entities whose focus on the development of therapies and products that advance human health and transform patients’ lives is aligned with Alexandria’s purpose of making a positive and meaningful impact on the health, safety, and well-being of the global community. Our status as a REIT limits our ability to make such non-real estate investments. Therefore, we conduct, and will continue to conduct, our non-real estate investment activities in a manner that complies with REIT requirements.
Balance sheet and financial strategy
We seek to maximize balance sheet liquidity and flexibility, cash flows, and cash available for distribution to our stockholders through the ownership, operation, management, and selective acquisition, development, and redevelopment of new Class A/A+ properties located in collaborative life science, agtech, and advanced technology mega campuses in AAA innovation clusters, as well as the prudent management of our balance sheet. In particular, we seek to maximize balance sheet liquidity and flexibility, cash flows, and cash available for distribution to our stockholders by:
-
Maintaining access to diverse sources of capital, which include, among others, net cash flows from operating activities after dividends, incremental leverage-neutral debt supported by growth in EBITDA, strategic value harvesting and asset recycling through real estate dispositions and sales of partial interests, non-real estate investment sales, sales of equity, and joint venture capital;
-
Maintaining significant liquidity through borrowing capacity under our unsecured senior line of credit and commercial paper program, secured construction loans, marketable securities, issuances of forward equity contracts from time to time, and cash, cash equivalents, and restricted cash;
-
Continuing to improve our credit profile;
-
Minimizing the amount of debt maturing in a single year;
-
Maintaining commitment to long-term capital to fund growth;
-
Maintaining low to modest leverage;
-
Minimizing variable interest rate risk;
-
Generating high-quality, strong, and increasing operating cash flows;
-
Selectively selling real estate assets, including land parcels, non-core and “core-like” operating assets, and sales of partial interests, and reinvesting the proceeds into our highly leased value-creation development and redevelopment projects;
-
Allocating capital to Class A/A+ properties located in collaborative life science, agtech, and advanced technology mega campuses in AAA innovation clusters;
-
Maintaining geographic diversity in intellectual centers of innovation;
-
Selectively acquiring high-quality life science, agtech, and advanced technology space in our target innovation cluster submarkets at prices that enable us to realize attractive returns;
-
Selectively developing properties in our target innovation cluster submarkets;
-
Selectively redeveloping acquired office, warehouse, or shell space, or newly acquired properties, into high-quality, generic, and reusable laboratory space that can be leased at higher rental rates in our target innovation cluster submarkets;
-
Renewing existing tenant space at higher rental rates to the extent possible;
-
Minimizing tenant improvement costs;
-
Improving investment returns through the leasing of vacant space and the replacing of existing tenants with new tenants at higher rental rates;
-
Executing leases with high-quality tenants and proactively monitoring tenant health;
-
Maintaining solid occupancy while attaining high rental rates;
-
Realizing contractual rental rate escalations; and
-
Implementing effective cost control measures, including negotiating pass-through provisions in tenant leases for operating expenses and certain capital expenditures.
Competition
In general, other laboratory and technology properties are located in close proximity to our properties. The amount of rentable space available in any market could have a material effect on our ability to rent space and on the rental rates we can attain for our properties. In addition, we compete for investment opportunities with other REITs, insurance companies, pension and investment funds, private equity entities, partnerships, developers, investment companies, owners/occupants, and foreign investors. Many of these entities have substantially greater financial resources than we do and may be able to invest more than we can or accept more risk than we are willing to accept. These entities may be less sensitive to risks with respect to the creditworthiness of a tenant or the overall expected returns from real estate investments. In addition, as a result of their financial resources, our competitors may offer more free rent concessions, lower rental rates, or higher tenant improvement allowances in order to attract tenants. These leasing incentives could hinder our ability to maintain or raise rents and attract or retain tenants. Competition may also reduce the number of suitable investment opportunities available to us or may increase the bargaining power of property owners seeking to sell. Competition in acquiring existing properties and land, both from institutional capital sources and from other REITs, has been very strong over the past several years; however, we believe we have differentiated ourselves from our competitors. Alexandria pioneered the life science real estate niche with our founding in 1994, and today is the preeminent and longest-tenured owner, operator, and developer of life science, agtech, and advanced technology mega campuses in AAA innovation cluster locations. We continue to maintain and cultivate many of the most important and strategic relationships in the life science, agtech, and technology industries.
Financial information about our reportable segment
Refer to Note 2 – “Summary of significant accounting policies” to our consolidated financial statements under Item 15 in this annual report on Form 10-K for information about our one reportable segment.
Regulation
General
Properties in our markets are subject to various laws, ordinances, and regulations, including regulations relating to common areas. We believe we have the necessary permits and approvals to operate each of our properties.
Americans with Disabilities Act
Our properties must comply with Title III of the Americans with Disabilities Act of 1990 (“ADA”) to the extent that such properties are “public accommodations” as defined by the ADA. The ADA may require removal of structural barriers to permit access by persons with disabilities in certain public areas of our properties where such removal is readily achievable. We believe that our properties are in substantial compliance with the ADA and that we will not be required to incur substantial capital expenditures to address the requirements of the ADA. However, noncompliance with the ADA could result in the imposition of fines or an award of damages to private litigants. The obligation to make readily achievable accommodations is an ongoing one, and we will continue to assess our properties and make alterations as appropriate in this respect.
Environmental matters
Under various environmental protection laws, a current or previous owner or operator of real estate may be liable for contamination resulting from the presence or discharge of hazardous or toxic substances at that property and may be required to investigate and remediate contamination located on or emanating from that property. Such laws often impose liability without regard to whether the owner or operator knew of, or was responsible for, the presence of the contaminants, and the liability may be joint and several. Previous owners may have used some of our properties for industrial and other purposes, so those properties may contain some level of environmental contamination. The presence of contamination or the failure to remediate contamination at our properties may expose us to third-party liability or may materially adversely affect our ability to sell, lease, or develop the real estate or to borrow capital using the real estate as collateral.
State regulations, such as California’s Connelly Act and Proposition 65, among others, require certain building owners and operators to disclose information on the presence of asbestos or other harmful substances. Some of our properties may have asbestos-containing building materials. Environmental laws require that asbestos-containing building materials be properly managed and maintained and may impose fines and penalties on building owners or operators for failure to comply with these requirements. These laws may also allow third parties to seek recovery from owners or operators for personal injury associated with exposure to asbestos-containing building materials.
In addition, some of our tenants handle hazardous substances and wastes as part of their routine operations at our properties. Environmental laws and regulations subject our tenants, and potentially us, to liability resulting from such activities. Environmental liabilities could also affect a tenant’s ability to make rental payments to us. We require our tenants to comply with these environmental laws and regulations and to indemnify us against any related liabilities.
Independent environmental consultants have conducted Phase I or similar environmental site assessments on the properties in our portfolio. Site assessments are intended to discover and evaluate information regarding the environmental condition of the surveyed property and surrounding properties and do not generally include soil samplings, subsurface investigations, or an asbestos survey. To date, these assessments have not revealed any material environmental liability that we believe would have a material adverse effect on our business, assets, or results of operations, and ongoing expenditures to comply with existing environmental regulations are not expected to be material. Nevertheless, it is possible that the assessments on our properties have not revealed all environmental conditions, liabilities, or compliance concerns that may have arisen after the review was completed or may arise in the future; and future laws, ordinances, or regulations may also impose additional material environmental liabilities.
Insurance
With respect to our properties, we carry commercial general liability insurance, and all-risk property insurance, including business interruption and loss of rental income coverage. We select policy specifications and insured limits that we believe to be appropriate given the relative risk of loss and the cost of the coverage. In addition, we have obtained earthquake insurance for certain properties located in the vicinity of known active earthquake zones in an amount and with deductibles we believe are commercially reasonable. We also carry environmental insurance and title insurance policies on our properties. We generally obtain title insurance policies when we acquire a property, with each policy covering an amount equal to the initial purchase price of each property. Accordingly, any of our title insurance policies may be in an amount less than the current value of the related property. Additional information about risk factors that may affect us is included in “Item 1A. Risk factors” in this annual report on Form 10-K.
Available information
Copies of our annual reports on Form 10-K, quarterly reports on Form 10-Q, and current reports on Form 8-K, including any amendments to the foregoing reports, are available, free of charge, through our corporate website at www.are.com as soon as is reasonably practicable after such material is electronically filed with, or furnished to, the SEC. The current charters of our Board of Directors’ Audit, Compensation, and Nominating & Governance Committees, along with our Corporate Governance Guidelines and Business Integrity Policy and Procedures for Reporting Non-Compliance (the “Business Integrity Policy”), are also available on our corporate website. Additionally, any amendments to, and waivers of, our Business Integrity Policy that apply to our Chief Executive Officer or our Chief Financial Officer will be available free of charge on our corporate website in accordance with applicable SEC and NYSE requirements. Written requests should be sent to Alexandria Real Estate Equities, Inc., 26 North Euclid Avenue, Pasadena, California 91101, Attention: Investor Relations. The public may also download these materials from the SEC’s website at www.sec.gov.
Human capital
As of December 31, 2023, we had 568 employees. We place a significant focus on building loyalty and trusted relationships with our employees. We have a Business Integrity Policy that applies to all of our employees, and its receipt and review by each employee is documented and verified annually. To promote an exceptional corporate culture, Alexandria continuously monitors employee satisfaction, seeks employee feedback, and proactively enhances our employee offerings. We participate in annual performance reviews with our employees and conduct formal employee surveys, and our talent management team holds regular meetings with employees to continuously gather feedback and improve the employee experience. The positive employee experience is evidenced by our low voluntary and total turnover rates averaging 4.1% and 8.3%, respectively, over the last five years, from 2019 to 2023, which are substantially lower than the average voluntary and total turnover rates of 14.0% and 19.0%, respectively, as reported for the REIT industry in the 2023 Nareit Compensation & Benefits Survey (data for 2022).
We recognize that the fundamental strength of Alexandria results from the contributions of each and every team member within the organization and that our future growth is dependent upon the same. Alexandria devotes extraordinary efforts to hiring, developing, and retaining our talented employees, and we understand firsthand that the health, happiness, and well-being of our best-in-class team are key factors to the success of our employees and that of the Company.
We have an exceptional track record of identifying highly qualified candidates for promotion from within the Company. Alexandria’s executive and senior management teams, represented by our senior vice presidents and above, consist of 60 individuals, averaging 23 years of real estate experience, including 13 years with Alexandria. Moreover, our executive management team alone averages 18 years of experience with the Company. Alexandria’s executive and senior management teams have unique experience and expertise in creating, owning, and operating highly dynamic and collaborative mega campuses in key life science, agtech, and advanced technology cluster locations. These teams include regional market directors with leading reputations and longstanding relationships within the life science, agtech, and technology communities in their respective innovation clusters. We believe that our expertise, experience, reputation, and key relationships in the real estate, life science, agtech, and technology industries provide Alexandria with significant competitive advantages in attracting new business opportunities.
Building a diverse board of directors and inclusive workforce
Our Corporate Governance Guidelines highlight our Board of Directors’ focus on diversity at the board level. The guidelines explicitly state the Board of Directors’ commitment to considering qualified women and minority director candidates, as well as its policy of requesting an initial list of diverse candidates from any search firm it retains.
We strive to create an open and respectful environment where our employees can actively contribute, have access to opportunities and resources, and realize their full potential. As an equal opportunity employer, we have an Equal Employment Opportunity Policy and a Diversity, Equal Employment Opportunity, and Fair Labor Policy that emphasizes inclusion through hiring and compensation practices and considers a pool of diverse candidates for open positions and internal advancement opportunities.
Furthermore, as a federal government contractor, Alexandria maintains affirmative action plans, which set forth the policies, practices, and procedures to which the Company is committed in order to ensure that our policies of nondiscrimination and affirmative action are followed for qualified females, minorities, individuals with disabilities, and protected veterans. To address issues related to pay discrimination, the Company has a ban on any and all inquiries into an applicant’s salary history, and we incorporate fair pay reviews into every employment compensation decision. To reinforce our corporate culture of respect, diversity, and inclusion, we provide anti-harassment training annually.
Providing exceptional benefits to support our employees’ medical and financial health and well-being
We provide a comprehensive benefits package intended to meet and/or exceed the needs of our employees and their families. Our company-sponsored suite of benefits covers 100% of the premiums for our employees and their dependents and includes, but is not limited to, a high-coverage, low-deductible preferred provider organization (“PPO”) medical plan, a 24/7 telehealth and concierge medical care services program, PPO dental and orthodontia coverage, a generous vision plan, comprehensive prescription drug plan, infertility and family planning benefits, short-term and long-term disability benefits, and life and accidental death and dismemberment coverage. These benefits support the health of our employees and their families, their overall well-being, and their future plans, and also reward their operational excellence.
In addition, we have prioritized our employees’ total well-being with additional benefits that focus on their emotional, mental, physical, financial, and social health including:
-
100% company-paid therapy and life coaching** to help our employees and their eligible dependents prioritize their mental health and provide timely access to professional help;
-
Additional company-paid holidays and paid time off** to encourage employees to rest and recharge;
-
24/7 telehealth** and medical care;
-
Expert-led internal webinar series** leveraging our world-class life science network to educate and inform our employees on relevant and engaging subjects;
-
Wellness reimbursement benefit** for fitness, self-defense, mindfulness applications, subscriptions, and classes, and home exercise equipment to encourage our employees to stay mentally and physically fit;
-
Enhanced social connectedness through Alexandria’s Operation CARE program** for giving to, fundraising for, and volunteering at any eligible non-profit organization(s) of an employee’s choosing, including:
-
Paid volunteer time off** of up to16 hours per calendar year,
-
Matching gifts** of up to $5,000 per calendar year,
-
Volunteer rewards** of up to $10,000 per calendar year donated by Alexandria based on time volunteered ($2,500 donated per 25 hours);
-
Alexandria Lifeline****™** – Alexandria’s unparalleled network in the life science community affords us access to deep medical expertise. Alexandria Lifeline makes this expertise available to our employees and their immediate family members who are suffering from a serious illness or injury and would benefit from specialized medical care.
Investing in professional development and training
Alexandria champions our people as our greatest asset. To attract and retain the best talent, we provide meaningful opportunities for growth and development. We offer a variety of learning opportunities, including custom, cohort-based development programs that leverage social learning, instructor-led trainings, on-demand trainings and resources, and a highly utilized mentoring program.
Development programs and trainings include topics such as leadership development, project management, business writing, change management, interviewing, presentations, productivity, effective one-on-ones, goal setting, delegation, communication, and feedback.
Our mentoring program enables employees to partner with senior leaders throughout the organization for support and career guidance. To further customize development, we partner with key functional leaders to design and implement learning programs for specific functional teams and curated learning cohorts. Lastly, our executive coaching program supports high-potential leaders in their career progression.
To continuously monitor and improve employee performance and engagement, we use employee engagement surveys, the most recent of which was conducted in 2022 and yielded an employee participation rate of 91.4%.
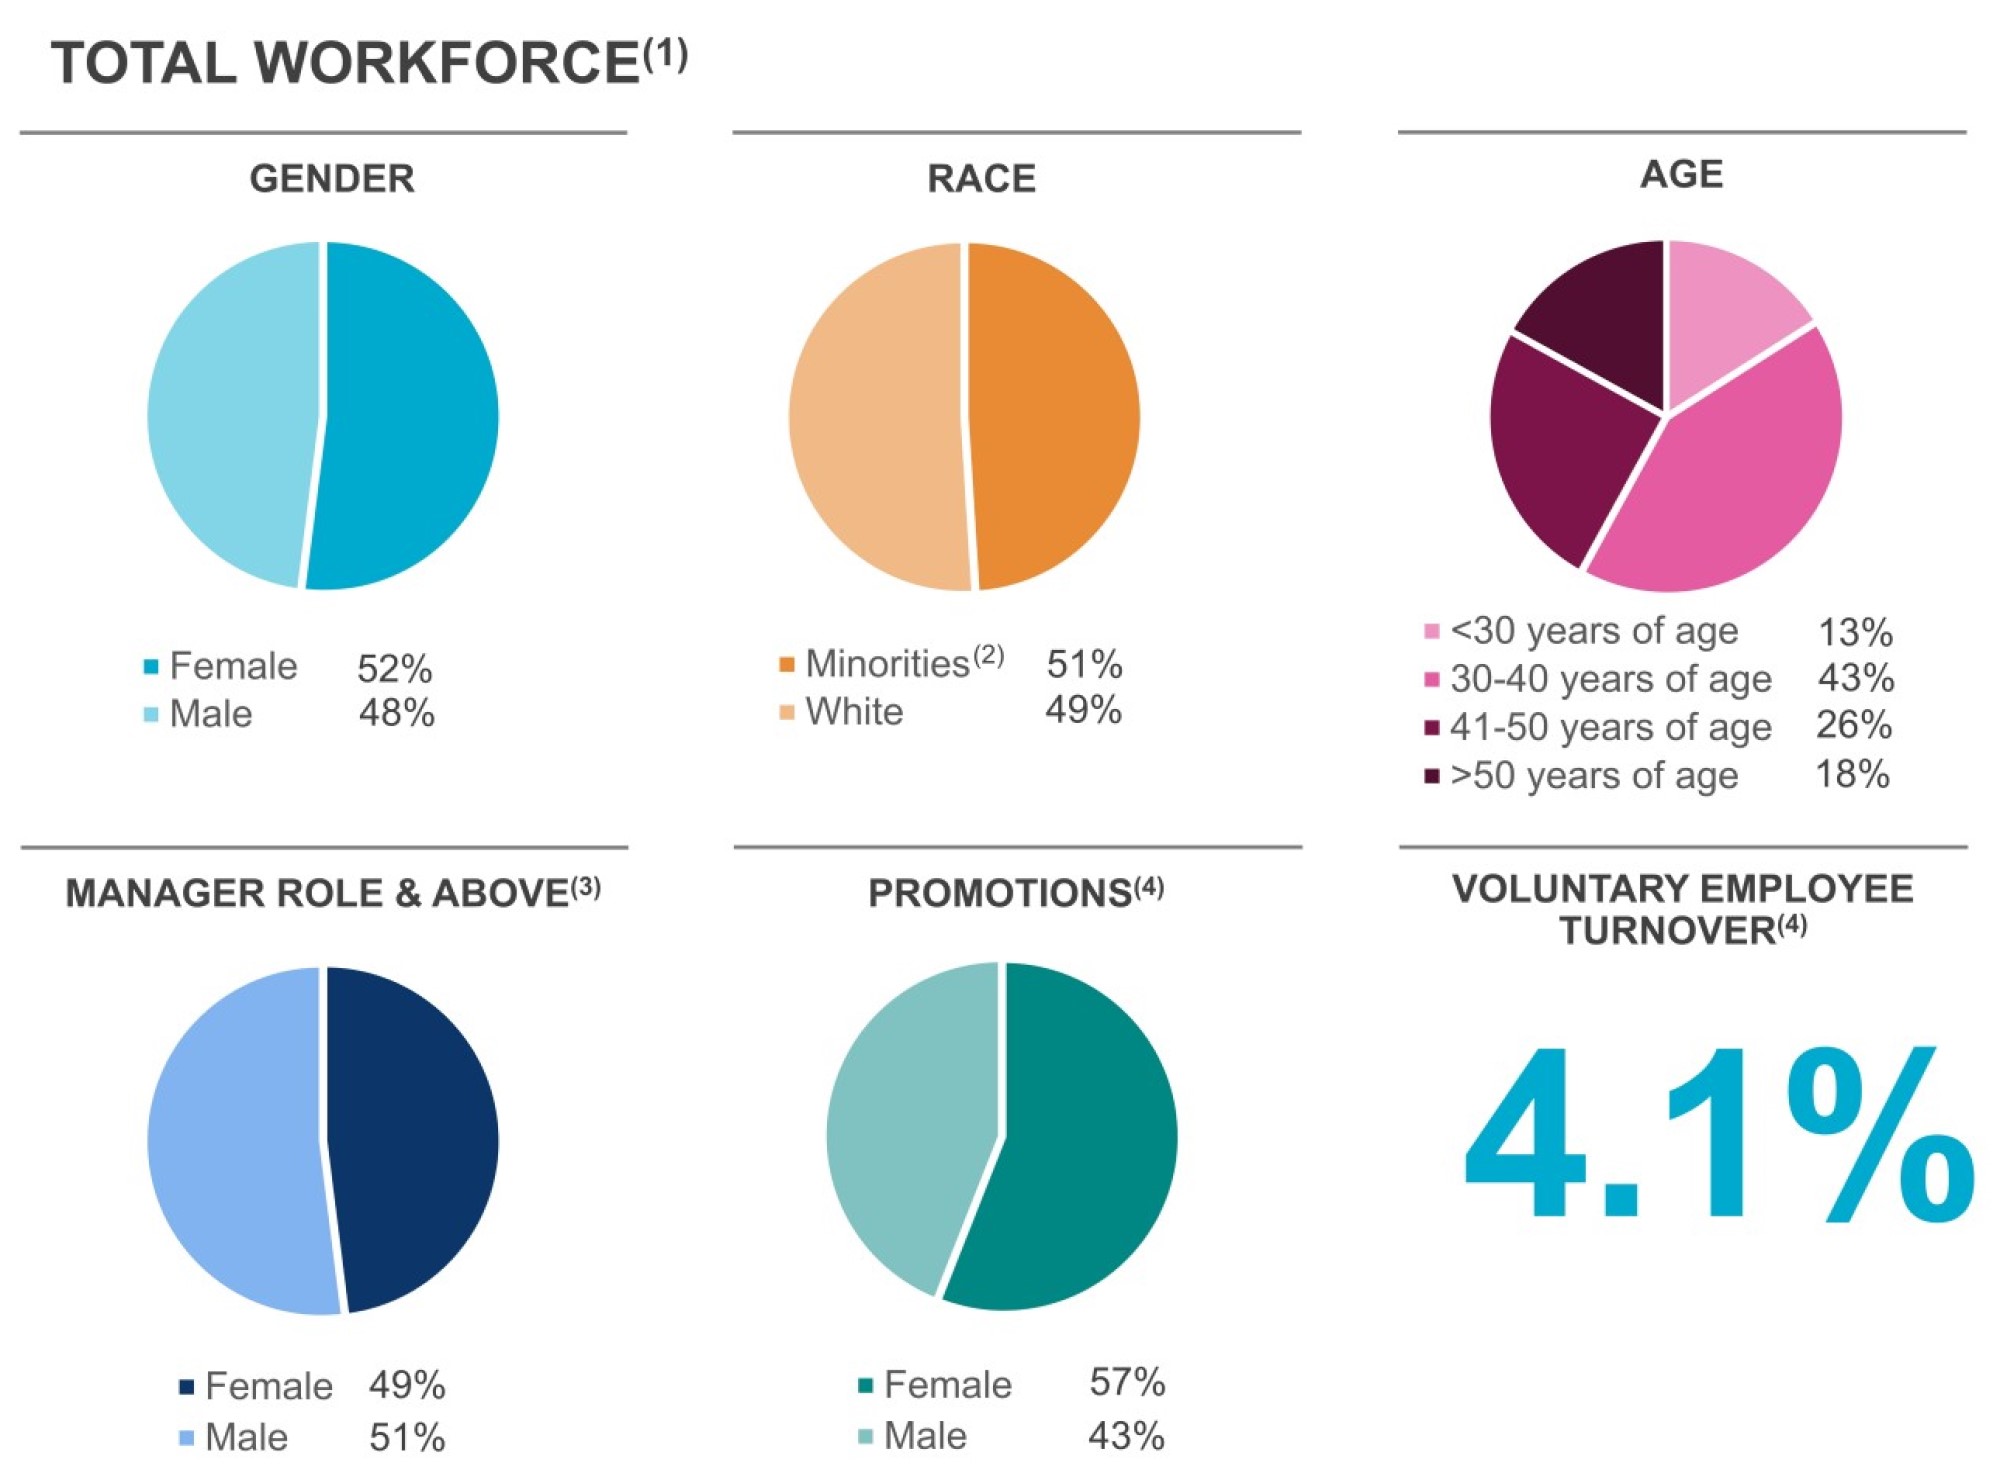
(1)As of December 31, 2023, unless stated otherwise. We determine race and gender based on our employees' self-identification or other information compiled to meet requirements of the U.S. government.
(2)Minorities are defined to include individuals of Asian, Black/African American, Hispanic/Latino, Native American, Pacific Islander, or multiracial background.
(3)Managers and above include individuals who lead others and/or oversee projects.
(4)Represents a five-year average from 2019 to 2023.
Item 1A. RISK FACTORS
Overview
The following risk factors may adversely affect our overall business, financial condition, results of operations, and cash flows; our ability to make distributions to our stockholders; our access to capital; or the market price of our common stock, as further described in each risk factor below. In addition to the information set forth in this annual report on Form 10-K, one should carefully review and consider the information contained in our other reports and periodic filings that we make with the SEC. Those risk factors could materially affect our overall business, financial condition, results of operations, and cash flows; our ability to make distributions to our stockholders; our access to capital; or the market price of our common stock. The risks that we describe in our public filings are not the only risks that we face. Additional risks and uncertainties not presently known to us, or that we currently consider immaterial, also may materially adversely affect our business, financial condition, and results of operations. Additional information regarding forward-looking statements is included in the beginning of Part I in this annual report on Form 10-K.
Risk factors summary
An investment in our securities involves various risks. Such risks, including those set forth in the summary of material risks in this Item 1A, should be carefully considered before purchasing our securities.
Risks related to operating factors
-
We may be unable to identify and complete acquisitions, investments, or development or redevelopment projects or to successfully and profitably operate properties.
-
We could default on our ground leases or be unable to renew or re-lease our land or space on favorable terms or at all. Our tenants may also be unable to pay us rent.
-
The cost of maintaining and improving the quality of our properties may be higher than anticipated, and we may be unable to pass any increased operating costs through to our tenants, which can result in reduced cash flows and profitability.
-
We could be held liable for environmental damages resulting from our tenants’ use of hazardous materials, or from harmful mold, poor air quality, or other defects from our properties, or we could face increased costs in complying with other environmental laws.
-
The loss of services of any of our senior officers or key employees and increased competition for skilled personnel could adversely affect us and/or increase our labor costs.
-
We rely on a limited number of vendors to provide utilities and other services at our properties, and disruption in such services may have an adverse effect on our operations and financial condition.
-
Our insurance policies may not adequately cover all of our potential losses, or we may incur costs due to the financial condition of our insurance carriers.
-
We may change business policies without stockholder approval.
-
Failure to maintain effective internal control over financial reporting could have a material adverse effect on our business.
-
If we failed to qualify as a REIT, we would be taxed at corporate rates and would not be able to take certain deductions when computing our taxable income.
-
We may not be able to raise sufficient capital to fund our operations due to adverse changes in our credit ratings, our inability to refinance our existing debt or issue new debt, or our inability to sell existing real estate and non-real estate assets timely or at optimal prices.
-
We may invest or spend the net proceeds from our equity or debt offerings in ways with which our investors may not agree and in ways that may not earn a profit.
-
Our debt service obligations may restrict our ability to engage in some business activities or cause other adverse effects on our business.
-
We face risks and liabilities associated with our investments (including those in connection with short-term liquid investments) and the companies in which we invest (including properties owned through partnerships, limited liability companies, and joint ventures, as well as through our non-real estate venture investment portfolio), which expose us to risks similar to those of our tenant base and additional risks inherent in venture capital investing. We may be limited in our ability to diversify our investments.
Risks related to market and industry factors
-
There are limits on ownership of our stock under which a stockholder may lose beneficial ownership of its shares, as well as certain provisions of our charter and bylaws that may delay or prevent transactions that otherwise may be desirable to our stockholders.
-
Possible future sales of shares of our common stock could adversely affect its market price.
-
We are dependent on the health of the life science, agtech, and technology industries, and changes within these industries, increased competition, or the inability of our tenants and non-real estate equity investments within these industries to obtain funding for research, development, and other operations may adversely impact their ability to make rental payments to us or adversely impact their value.
-
Market disruption and volatility, poor economic conditions in the capital markets and global economy, including in connection with a widespread pandemic or outbreak of a highly infectious or contagious disease, and tight labor markets could adversely affect the value of the companies in which we hold equity investments or the ability of tenants and the companies in which we invest to continue operations, raise additional capital, or access capital from venture capital investors or financial institutions on favorable terms or at all.
Risks related to government and global factors
-
Actions, policy, or key leadership changes in government agencies, or changes to laws or regulations, including those related to tax, accounting, debt, derivatives, government spending, or funding (including those related to the FDA, the National Institutes of Health (the “NIH”), the SEC, and other agencies), and drug and healthcare pricing, costs, and programs could have a significant negative impact on the overall economy, our tenants and companies in which we invest, and our business.
-
Partial or complete government shutdown resulting in temporary closures of agencies could adversely affect our tenants (some of which are also government agencies) and the companies in which we invest, including delays in the commercialization of such companies’ products, decreased funding of research and development, or delays surrounding approval of budget proposals.
-
The outbreak of any highly infectious or contagious disease could adversely impact our financial condition and results of operations, and/or that of our tenants and non-real estate investments.
Risks related to general and other factors
-
Social, political, and economic instability, unrest, significant changes, and other circumstances beyond our control, including circumstances related to changes in the U.S. political landscape, could adversely affect our business operations.
-
Seasonal weather conditions, climate change and severe weather, changes in the availability of transportation or labor, and other related factors may affect our ability to conduct business, the products and services of our tenants, or the availability of such products and services of our tenants and the companies in which we invest.
-
We may be unable to meet our sustainability goals.
-
Changes in privacy and information security laws, regulations, policies, and contractual obligations related to data privacy and security, or our failure to comply with such requirements, could subject us to fines or penalties or increase our cost of doing business, compliance risks, and potential liability and otherwise adversely affect our business or results of operations.
-
System failures or security incidents through cyberattacks, intrusions, or other methods could disrupt our information technology networks, ent
Showing the first 8K of 233K characters. Open the full section
Item 1B. UNRESOLVED STAFF COMMENTS
None.
Item 1C. CYBERSECURITY
Risk management and strategy
Our corporate information technology, communication networks, enterprise applications, accounting and financial reporting platforms, and related systems, and those that we offer to our tenants are necessary for the operation of our business. We use these systems, among others, to manage our tenant and vendor relationships, for internal communications, for accounting to operate record-keeping function, and for many other key aspects of our business. Our business operations rely on the secure collection, storage, transmission, and other processing of proprietary, confidential, and sensitive data.
We have implemented and maintain various information security processes designed to identify, assess and manage material risks from cybersecurity threats to our critical computer networks, third-party hosted services, communications systems, hardware and software, and our critical data, including intellectual property, confidential information that is proprietary, strategic or competitive in nature, and tenant data (“Information Systems and Data”).
We rely on a multidisciplinary team, including our information security function, legal department, management, and third-party service providers, as described further below, to identify, assess, and manage cybersecurity threats and risks. We identify and assess risks from cybersecurity threats by monitoring and evaluating our threat environment and our risk profile using various methods including, for example, using manual and automated tools, subscribing to reports and services that identify cybersecurity threats, analyzing reports of threats and threat actors, conducting scans of the threat environment, evaluating our industry’s risk profile, utilizing internal and external audits, and conducting threat and vulnerability assessments.
Depending on the environment, we implement and maintain various technical, physical, and organizational measures, processes, standards, and/or policies designed to manage and mitigate material risks from cybersecurity threats to our Information Systems and Data, including risk assessments, incident detection and response, vulnerability management, disaster recovery and business continuity plans, internal controls within our accounting and financial reporting functions, encryption of data, network security controls, access controls, physical security, asset management, systems monitoring, vendor risk management program, employee training, and penetration testing.
We work with third parties from time to time that assist us to identify, assess, and manage cybersecurity risks, including professional services firms, consulting firms, threat intelligence service providers, and penetration testing firms.
To operate our business, we utilize certain third-party service providers to perform a variety of functions. We seek to engage reliable, reputable service providers that maintain cybersecurity programs. Depending on the nature of the services provided, the sensitivity and quantity of information processed, and the identity of the service provider, our vendor management process may include reviewing the cybersecurity practices of such provider, contractually imposing obligations on the provider, conducting security assessments, and conducting periodic reassessments during their engagement.
We are not aware of any risks from cybersecurity threats, including as a result of any cybersecurity incidents, which have materially affected or are reasonably likely to materially affect our Company, including our business strategy, results of operations, or financial condition. Refer to “Item 1A. Risk factors” in this annual report on Form 10-K, including “If our information technology networks or data, or those of third parties upon which we rely, are or were disrupted or otherwise compromised, we could experience costly remediation or other expenses, liability under federal and state laws, and litigation and investigations, any of which could result in substantial reputational damage and materially and adversely affect our business, financial condition, results of operations, cash flows, and the market price of our common stock”, for additional discussion about cybersecurity-related risks.
Governance
Our Board of Directors holds oversight responsibility over the Company’s strategy and risk management, including material risks related to cybersecurity threats. This oversight is executed directly by the Board of Directors and through its committees. The Audit Committee of the Board of Directors (the “Audit Committee”) oversees the management of systemic risks, including cybersecurity, in accordance with its charter. The Audit Committee engages in regular discussions with management regarding the Company’s significant financial risk exposures and the measures implemented to monitor and control these risks, including those that may result from material cybersecurity threats. These discussions include the Company’s risk assessment and risk management policies.
Our management, represented by our Chief Technology Officer, Greg C. Thomas, and our Chief Financial Officer and Treasurer, Marc E. Binda, leads our cybersecurity risk assessment and management processes and oversees their implementation and maintenance.
Greg C. Thomas is an experienced information technology professional in our information technology department and has served as Chief Technology Officer since 2018. He works with the Company’s internal information technology department and external partners to monitor and improve our cybersecurity capabilities. Mr. Thomas possesses a proven real estate industry track record of guiding organizations through strategic technology, organizational, risk mitigation, process improvement initiatives, and digital transformations. He also possesses extensive experience in technology and cybersecurity, gained over his career spanning more than 30 years, including as Chief Information Officer at two other large real estate firms, as well as in leadership roles within the real estate industry technology practices of Ernst & Young LLP and Deloitte LLP. He earned Bachelor of Science degrees in Systems Analysis and Finance from Miami University.
Marc E. Binda, CPA, is an experienced risk management professional in our finance and risk management function and has served as Chief Financial Officer since September 2023 and as Treasurer since April 2018. Mr. Binda previously served as Executive Vice President – Finance and Treasurer from June 2019 to September 2023, as Senior Vice President – Finance and Treasurer from April 2018 to June 2019, as Senior Vice President – Finance from April 2012 to April 2018, and in other capacities from January 2005 to April 2012. Mr. Binda currently oversees key functions for the Company’s accounting, finance, and treasury strategies, including risk management. In addition, Mr. Binda leads the Company’s cybersecurity risk oversight and the development and enhancement of internal controls designed to prevent, detect, address, and mitigate the risk of cyber incidents.
Management, in coordination with our information technology department, is responsible for hiring appropriate personnel, helping to integrate cybersecurity risk considerations into the Company’s overall risk management strategy, and communicating key priorities to relevant personnel. Management is responsible for approving budgets, approving cybersecurity processes, and reviewing cybersecurity assessments and other cybersecurity-related matters.
Our cybersecurity incident response and vulnerability management processes are designed to escalate certain cybersecurity incidents to members of management depending on the circumstances. Management, including the Chief Technology Officer and Chief Financial Officer and Treasurer, serves on the Company’s incident response team to help the Company mitigate and remediate cybersecurity incidents of which they are notified. In addition, the Company’s incident response processes include reporting to the Audit Committee for certain cybersecurity incidents. The Audit Committee holds quarterly meetings and receives periodic reports from management, including our Chief Technology Officer and Chief Financial Officer and Treasurer, concerning the Company’s significant cybersecurity threats and risk and the processes the Company has implemented to address them.
Item 2. PROPERTIES
General
As of December 31, 2023, we had 411 properties in North America consisting of approximately 47.2 million RSF of operating properties and new Class A/A+ development and redevelopment properties under construction, including 68 properties that are held by consolidated real estate joint ventures and four properties that are held by unconsolidated real estate joint ventures. The occupancy percentage of our operating properties in North America was 94.6% as of December 31, 2023. The exteriors of our properties typically resemble traditional office properties, but the interior infrastructures are designed to accommodate the needs of life science, agtech, and technology tenants. These improvements typically are generic rather than specific to a particular tenant. As a result, we believe that the improvements have long-term value and utility and are usable by a wide range of tenants. Improvements to our properties typically include:
-
Reinforced concrete floors;
-
Upgraded roof loading capacity;
-
Increased floor-to-ceiling heights;
-
Heavy-duty HVAC systems;
-
Enhanced environmental control technology;
-
Significantly upgraded electrical, gas, and plumbing infrastructure; and
-
Laboratory benches.
As of December 31, 2023, we held a fee simple interest in each of our properties, with the exception of 36 properties in North America subject to ground leasehold interests, which accounted for approximately 9% of our total number of properties. Of these 36 properties, we held 10 properties in the Greater Boston market, 20 properties in the San Francisco Bay Area market, two properties in the New York City market, one property in the Seattle market, one property in the Maryland market, and two properties in the Research Triangle market. During the year ended December 31, 2023, as a percentage of net operating income our ground lease rental expense aggregated 1.5%. Refer to our consolidated financial statements and notes thereto in “Item 15. Exhibits and financial statement schedules” in this annual report on Form 10-K for further discussion.
As of December 31, 2023, we had over 1,000 leases with a total of approximately 800 tenants, and 198, or 48%, of our 411 properties were single-tenant properties. Leases in our multi-tenant buildings typically have initial terms of 4 to 11 years, while leases in our single-tenant buildings typically have initial terms of 11 to 21 years. Additionally, as of December 31, 2023:
-
Investment-grade or publicly traded large cap tenants represented 52% of our total annual rental revenue;
-
Approximately 96% of our leases (on an annual rental revenue basis) contained effective annual rent escalations approximating 3% that were either fixed or indexed based on a consumer price index or other index;
-
Approximately 94% of our leases (on an annual rental revenue basis) were triple net leases, which require tenants to pay substantially all real estate taxes, insurance, utilities, repairs and maintenance, common area expenses, and other operating expenses (including increases thereto) in addition to base rent; and
-
Approximately 93% of our leases (on an annual rental revenue basis) provided for the recapture of capital expenditures (such as HVAC maintenance and/or replacement, roof replacement, and parking lot resurfacing) that we believe would typically be borne by the landlord in traditional office leases.
Our leases also typically give us the right to review and approve tenant alterations to the property. Generally, tenant-installed improvements to the properties are reusable generic improvements and remain our property after termination of the lease at our election. However, we are permitted under the terms of most of our leases to require that the tenant, at its expense, remove certain non-generic improvements and restore the premises to their original condition.
Refer to the definitions of “Annual rental revenue” and “Operating statistics” in the “Non-GAAP measures and definitions” section under “Item 7. Management’s discussion and analysis of financial condition and results of operations” in this annual report on Form 10-K for a description of the basis used to compute the aforementioned measures.
Locations of properties
The locations of our properties are diversified among a number of Class A/A+ assets strategically clustered in life science, agtech, and advanced technology mega campuses in AAA innovation cluster markets. The following table sets forth the total RSF, number of properties, and annual rental revenue in effect as of December 31, 2023 in each of our markets in North America (dollars in thousands, except per RSF amounts):
| RSF | Number of Properties | Annual Rental Revenue | ||||||||||||||||||||||||||||||||||||||||||||||||||||||
| Market | Operating | Development | Redevelopment | Total | % of Total | Total | % of Total | Per RSF | ||||||||||||||||||||||||||||||||||||||||||||||||
| Greater Boston | 10,836,743 | 975,419 | 1,304,051 | (1) | 13,116,213 | 28 | % | 72 | $ | 820,759 | 38 | % | $ | 79.82 | ||||||||||||||||||||||||||||||||||||||||||
| San Francisco Bay Area | 7,906,198 | 498,142 | 300,010 | 8,704,350 | 18 | 67 | 460,272 | 21 | 66.04 | |||||||||||||||||||||||||||||||||||||||||||||||
| New York City | 922,477 | — | — | 922,477 | 2 | 4 | 72,993 | 3 | 92.75 | |||||||||||||||||||||||||||||||||||||||||||||||
| San Diego | 7,831,370 | 1,187,796 | — | 9,019,166 | 19 | 90 | 320,460 | 14 | 43.48 | |||||||||||||||||||||||||||||||||||||||||||||||
| Seattle | 2,962,995 | 33,349 | 148,890 | 3,145,234 | 7 | 44 | 131,377 | 6 | 46.57 | |||||||||||||||||||||||||||||||||||||||||||||||
| Maryland | 3,582,494 | 510,601 | — | 4,093,095 | 9 | 51 | 123,780 | 6 | 36.57 | |||||||||||||||||||||||||||||||||||||||||||||||
| Research Triangle | 3,840,876 | — | — | 3,840,876 | 8 | 39 | 120,982 | 6 | 32.20 | |||||||||||||||||||||||||||||||||||||||||||||||
| Texas | 1,845,159 | — | 73,298 | 1,918,457 | 4 | 15 | 57,591 | 3 | 32.80 | |||||||||||||||||||||||||||||||||||||||||||||||
| Canada | 898,740 | — | 172,936 | 1,071,676 | 2 | 12 | 17,222 | 1 | 22.01 | |||||||||||||||||||||||||||||||||||||||||||||||
| Non-cluster/other markets | 347,806 | — | — | 347,806 | 1 | 10 | 15,827 | 1 | 57.96 | |||||||||||||||||||||||||||||||||||||||||||||||
| Properties held for sale | 1,049,135 |
Showing the first 8K of 219K characters. Open the full section
Item 3. LEGAL PROCEEDINGS
To our knowledge, no legal proceedings are pending against us, other than routine actions and administrative proceedings, and other actions not deemed material, substantially all of which are expected to be covered by liability insurance and which, in the aggregate, are not expected to have a material adverse effect on our financial condition, results of operations, or cash flows.
Item 4. MINE SAFETY DISCLOSURES
Not applicable.
PART II
Item 5. MARKET FOR REGISTRANT’S COMMON EQUITY, RELATED STOCKHOLDER MATTERS, AND ISSUER PURCHASES OF EQUITY SECURITIES
Our common stock is traded on the NYSE under the symbol “ARE.” On January 12, 2024, the last reported sales price per share of our common stock was $126.25, and there were 622 holders of record of our common stock (excluding beneficial owners whose shares are held in the name of Cede & Co.).
To maintain our qualification as a REIT, we must make annual distributions to stockholders of at least 90% of our taxable income for the current taxable year, determined without regard to deductions for dividends paid and excluding any net capital gains. Under certain circumstances, we may be required to make distributions in excess of cash flows available for distribution to meet these distribution requirements. In such a case, we may borrow funds or may raise funds through the issuance of additional debt or equity capital. No dividends can be paid on our common stock unless we have paid full cumulative dividends on our preferred stock. As of December 31, 2023, we had no outstanding shares of preferred stock. Future distributions on our common stock will be determined by, and made at the discretion of, our Board of Directors and will depend on a number of factors, including actual cash available for distribution to our stockholders, our financial condition and capital requirements, the annual distribution requirements under the REIT provisions of the Internal Revenue Code, restrictions under Maryland law, and such other factors as our Board of Directors deems relevant. We cannot assure our stockholders that we will make any future distributions.
Refer to “Item 12. Security ownership of certain beneficial owners and management and related stockholder matters” in this annual report on Form 10-K for information on securities authorized for issuance under equity compensation plans.
Item 6. [RESERVED]
Item 7. MANAGEMENT’S DISCUSSION AND ANALYSIS OF FINANCIAL CONDITION AND RESULTS OF OPERATIONS
The following discussion should be read in conjunction with our consolidated financial statements and notes thereto under “Item 15. Exhibits and financial statement schedules” in this annual report on Form 10-K. Forward-looking statements involve inherent risks and uncertainties regarding events, conditions, and financial trends that may affect our future plans of operations, business strategy, results of operations, and financial position. A number of important factors could cause actual results to differ materially from those included within or contemplated by such forward-looking statements, including, but not limited to, those described within this “Item 7. Management’s discussion and analysis of financial condition and results of operations” in this annual report on Form 10-K. We do not undertake any responsibility to update any of these factors or to announce publicly any revisions to any of the forward-looking statements contained in this or any other document, whether as a result of new information, future events, or otherwise.
As used in this annual report on Form 10-K, references to the “Company,” “Alexandria,” “ARE,” “we,” “us,” and “our” refer to Alexandria Real Estate Equities, Inc. and its consolidated subsidiaries.
Executive summary
Operating results
| Year Ended December 31, | ||||||||||||||||||||||||||
| 2023 | 2022 | |||||||||||||||||||||||||
| Net income attributable to Alexandria’s common stockholders – diluted: | ||||||||||||||||||||||||||
| In millions | $ | 92.4 | $ | 513.3 | ||||||||||||||||||||||
| Per share | $ | 0.54 | $ | 3.18 | ||||||||||||||||||||||
| Funds from operations attributable to Alexandria’s common stockholders – diluted, as adjusted: | ||||||||||||||||||||||||||
| In millions | $ | 1,532.3 | $ | 1,361.7 | ||||||||||||||||||||||
| Per share | $ | 8.97 | $ | 8.42 |
For additional information, refer to “Funds from operations and funds from operations, as adjusted, attributable to Alexandria Real Estate Equities, Inc.’s common stockholders” in the “Non-GAAP measures and definitions” section and to the tabular presentation of these items in the “Results of operations” section within this Item 7 in this annual report on Form 10-K.
An operationally excellent, industry-leading REIT with a high-quality, diverse client base to support growing revenues, stable cash flows, and strong margins
| Percentage of total annual rental revenue in effect from mega campuses as of December 31, 2023 | 75 | % | ||||||||||||
| Percentage of total annual rental revenue in effect from investment-grade or publicly traded large cap tenants as of December 31, 2023 | 52 | % | ||||||||||||
| Sustained strength in tenant collections: | ||||||||||||||
| Low tenant receivables as of December 31, 2023 | $ | 8.2 | million | |||||||||||
| January 2024 tenant rents and receivables collected as of the date of this report | 99.4 | % | ||||||||||||
| Tenant rents and receivables for the three months ended December 31, 2023 collected as of the date of this report | 99.9 | % | ||||||||||||
| Occupancy of operating properties in North America as of December 31, 2023 | 94.6 | % | ||||||||||||
| Adjusted EBITDA margin for the three months ended December 31, 2023 | 69 | % | ||||||||||||
| Weighted-average remaining lease term as of December 31, 2023: | ||||||||||||||
| Top 20 tenants | 9.6 | years | ||||||||||||
| All tenants | 7.4 | years | ||||||||||||
Solid annual leasing volume and rental rate increases with continued long lease terms
-
Solid leasing volume aggregating 4.3 million RSF for the year ended December 31, 2023.
-
Weighted-average lease term of 11.3 years for the year ended December 31, 2023, above our historically long weighted-average lease term of 8.8 years over the last 10 years.
-
76% of our leasing activity during the last twelve months was generated from our existing tenant base.
| 2023 | |||||||||||
| Total leasing activity – RSF | 4,306,072 | ||||||||||
| Leasing of development and redevelopment space – RSF | 596,533 | ||||||||||
| Lease renewals and re-leasing of space: | |||||||||||
| RSF (included in total leasing activity above) | 3,046,386 | ||||||||||
| Rental rate increase | 29.4% | (1) | |||||||||
| Rental rate increase (cash basis) | 15.8% | (1) | |||||||||
(1)Includes the re-lease of 99,557 RSF to Cargo Therapeutics at 835 Industrial at a 4.1% decline in the cash rental rate compared with the rate from the former tenant that was less than three years into a 10-year lease. Excluding this lease, the rental rate increase on renewals and re-leasing of space was 32.4% and 17.0% (cash basis) for 2023.
Continued solid net operating income and internal growth
-
Total revenues of $2.9 billion, up 11.5%, for the year ended December 31, 2023, compared to $2.6 billion for the year ended December 31, 2022.
-
Net operating income (cash basis) of $1.8 billion for the year ended December 31, 2023, up $185.8 million, or 11.5%, compared to the year ended December 31, 2022.
-
Same property net operating income growth of 3.4% and 4.6% (cash basis) for the year ended December 31, 2023, compared to the year ended December 31, 2022.
-
96% of our leases contain contractual annual rent escalations approximating 3%.
Consistent dividend strategy focuses on retaining significant net cash flows from operating activities after dividends for reinvestment
-
Common stock dividend declared for the three months ended December 31, 2023 of $1.27 per common share, aggregating $4.96 per common share for the year ended December 31, 2023, up 24 cents, or 5%, over the year ended December 31, 2022.
-
Dividend yield of 4.0% as of December 31, 2023.
-
Dividend payout ratio of 56% for the three months ended December 31, 2023.
-
Average annual dividend per-share growth of 6% from 2019 to 2023.
-
Significant net cash flows from operating activities after dividends retained for reinvestment aggregating $1.9 million for the years ended December 31, 2019 through 2023.
Execution of our value harvesting and asset recycling 2023 self-funding strategy
Our 2023 capital plan included $1.4 billion in funding primarily from dispositions and partial interest sales, of which $439.0 million was completed during the three months ended December 31, 2023, and focused on the enhancement of our asset base through the following (in millions):
| Completed in |
Showing the first 8K of 250K characters. Open the full section
Item 7A. QUANTITATIVE AND QUALITATIVE DISCLOSURES ABOUT MARKET RISK
Interest rate risk
The primary market risk to which we believe we may be exposed is interest rate risk, which may result from many factors, including government monetary and tax policies, domestic and international economic and political considerations, and other factors that are beyond our control.
In order to modify and manage the interest rate characteristics of our outstanding debt and to limit the effects of interest rate risks on our operations, we may utilize a variety of financial instruments, including interest rate hedge agreements, caps, floors, and other interest rate exchange contracts. The use of these types of instruments to hedge a portion of our exposure to changes in interest rates may carry additional risks, such as counterparty credit risk and the legal enforceability of hedge agreements. As of December 31, 2023, we did not have any outstanding interest rate hedge agreements.
Our future earnings and fair values relating to our outstanding debt are primarily dependent upon prevalent market rates of interest. The following tables illustrate the effect of a 1% change in interest rates, assuming a zero percent interest rate floor, on our fixed- and variable-rate debt as of December 31, 2023 and 2022 (in thousands):
| December 31, | |||||||||||
| 2023 | 2022 | ||||||||||
| Annualized effect on future earnings due to variable-rate debt: | |||||||||||
| Rate increase of 1% | $ | (339) | $ | (597) | |||||||
| Rate decrease of 1% | $ | 339 | $ | 597 | |||||||
| Effect on fair value of total consolidated debt: | |||||||||||
| Rate increase of 1% | $ | (742,460) | $ | (668,639) | |||||||
| Rate decrease of 1% | $ | 847,335 | $ | 759,638 |
These amounts are determined by considering the effect of the hypothetical interest rates on our borrowings as of December 31, 2023 and 2022, respectively. These analyses do not consider the effects of the reduced level of overall economic activity that could exist in such an environment. Furthermore, in the event of a change of such magnitude, we would consider taking actions to further mitigate our exposure to the change. Because of the uncertainty of the specific actions that would be taken and their possible effects, the sensitivity analyses assume no changes in our capital structure.
Equity price risk
We have exposure to equity price market risk because we hold equity investments in publicly traded companies and privately held entities. All of our investments in actively traded public companies are reflected in our consolidated balance sheets at fair value. Our investments in privately held entities that report NAV per share are measured at fair value using NAV as a practical expedient to fair value. Our equity investments in privately held entities that do not report NAV per share are measured at cost less impairments, adjusted for observable price changes during the period. Changes in fair value of public investments, changes in NAV per share reported by privately held entities, and observable price changes of privately held entities that do not report NAV per share are classified as investment income in our consolidated statements of operations. There is no assurance that future declines in value will not have a material adverse effect on our future results of operations. The following table illustrates the effect that a 10% change in the value of our equity investments would have on earnings as of December 31, 2023 and 2022 (in thousands):
| December 31, | |||||||||||
| 2023 | 2022 | ||||||||||
| Equity price risk: | |||||||||||
| Fair value increase of 10% | $ | 144,952 | $ | 161,507 | |||||||
| Fair value decrease of 10% | $ | (144,952) | $ | (161,507) |
Foreign currency exchange rate risk
We have exposure to foreign currency exchange rate risk related to our subsidiaries operating in Canada and Asia. The functional currencies of our foreign subsidiaries are the local currencies in each respective country. Gains or losses resulting from the translation of our foreign subsidiaries’ balance sheets and statements of operations are classified in accumulated other comprehensive income (loss) as a separate component of total equity and are excluded from net income (loss). Gains or losses will be reflected in our consolidated statements of operations when there is a sale or partial sale of our investment in these operations or upon a complete or substantially complete liquidation of the investment. The following tables illustrate the effect that a 10% change in foreign currency rates relative to the U.S. dollar would have on our potential future earnings and on the fair value of our net investment in foreign subsidiaries based on our current operating assets outside the U.S. as of December 31, 2023 and 2022 (in thousands):
| December 31, | |||||||||||
| 2023 | 2022 | ||||||||||
| Effect on potential future earnings due to foreign currency exchange rate: | |||||||||||
| Rate increase of 10% | $ | 311 | $ | 147 | |||||||
| Rate decrease of 10% | $ | (311) | $ | (147) | |||||||
| Effect on the fair value of net investment in foreign subsidiaries due to foreign currency exchange rate: | |||||||||||
| Rate increase of 10% | $ | 37,346 | $ | 22,523 | |||||||
| Rate decrease of 10% | $ | (37,346) | $ | (22,523) |
The sensitivity analyses assume a parallel shift of all foreign currency exchange rates with respect to the U.S. dollar; however, foreign currency exchange rates do not typically move in such a manner, and actual results may differ materially.
Our exposure to market risk elements for the year ended December 31, 2023 was consistent with the risk elements presented above, including the effects of changes in interest rates, equity prices, and foreign currency exchange rates.
Item 8. FINANCIAL STATEMENTS AND SUPPLEMENTARY DATA
The information required by this Item is included as a separate section in this annual report on Form 10-K. Refer to “Item 15. Exhibits and financial statement schedules.”
Item 9. CHANGES IN AND DISAGREEMENTS WITH ACCOUNTANTS ON ACCOUNTING AND FINANCIAL DISCLOSURE
None.
Item 9A. CONTROLS AND PROCEDURES
Evaluation of disclosure controls and procedures
As of December 31, 2023, we had performed an evaluation, under the supervision of our principal executive officers and principal financial officer of the effectiveness of the design and operation of our disclosure controls and procedures. These controls and procedures have been designed to ensure that information required for disclosure is recorded, processed, summarized, and reported within the requisite time periods. Based on our evaluation, the principal executive officers and principal financial officer concluded that our disclosure controls and procedures were effective as of December 31, 2023.
Changes in internal control over financial reporting
There has not been any change in our internal control over financial reporting during the three months ended December 31, 2023 that has materially affected, or is reasonably likely to materially affect, our internal control over financial reporting.
Management’s annual report on internal control over financial reporting
The management of Alexandria Real Estate Equities, Inc. and its subsidiaries (the “Company”) is responsible for establishing and maintaining adequate internal control over financial reporting. Internal control over financial reporting is defined in Rule 13a-15(f) and 15d-15(f) promulgated under the Securities Exchange Act of 1934, as amended, and is a process designed by, or under the supervision of, the CEOs and the CFO and effected by the Company’s Board of Directors, management, and other personnel to provide reasonable assurance regarding the reliability of financial reporting and the preparation of financial statements for external reporting purposes in accordance with GAAP. The Company’s internal control over financial reporting includes those policies and procedures that (i) pertain to the maintenance of records that, in reasonable detail, accurately and fairly reflect the transactions and dispositions of assets; (ii) provide reasonable assurance that transactions are recorded as necessary to permit preparation of financial statements in accordance with GAAP, and that receipts and expenditures are being made only in accordance with the authorizations of the Company’s management and directors; and (iii) provide reasonable assurance regarding prevention or timely detection of unauthorized acquisition, use, or disposition of assets that could have a material effect on the financial statements.
Because of its inherent limitations, internal control over financial reporting may not prevent or detect misstatements. Projections of any evaluation of effectiveness to future periods are subject to the risk that controls may become inadequate because of changes in conditions, or that the degree of compliance with the policies or procedures may deteriorate.
Management has assessed the effectiveness of the Company’s internal control over financial reporting as of December 31, 2023 and 2022. In making its assessment, management has utilized the criteria set forth in the 2013 framework issued by the Committee of Sponsoring Organizations of the Treadway Commission in Internal Control – Integrated Framework (COSO 2013). Management concluded that based on its assessment, the Company’s internal control over financial reporting was effective as of December 31, 2023. The effectiveness of our internal control over financial reporting as of December 31, 2023 has been audited by Ernst & Young LLP, an independent registered accounting firm, as stated in its report, which is included herein.
Report of Independent Registered Public Accounting Firm
To the Stockholders and the Board of Directors of Alexandria Real Estate Equities, Inc.
Opinion on Internal Control Over Financial Reporting
We have audited Alexandria Real Estate Equities, Inc.’s internal control over financial reporting as of December 31, 2023, based on criteria established in Internal Control-Integrated Framework issued by the Committee of Sponsoring Organizations of the Treadway Commission (2013 framework) (the COSO criteria). In our opinion, Alexandria Real Estate Equities, Inc. (the Company) maintained, in all material respects, effective internal control over financial reporting as of December 31, 2023, based on the COSO criteria.
We also have audited, in accordance with the standards of the Public Company Accounting Oversight Board (United States) (PCAOB), the consolidated balance sheets of the Company as of December 31, 2023 and 2022, the related consolidated statements of operations, comprehensive income, changes in stockholders’ equity and noncontrolling interests and cash flows for each of the three years in the period ended December 31, 2023 and the related notes and financial statement schedule listed in the Index at Item 15 and our report dated January 29, 2024, expressed an unqualified opinion thereon.
Basis for Opinion
The Company’s management is responsible for maintaining effective internal control over financial reporting and for its assessment of the effectiveness of internal control over financial reporting included in the accompanying Management’s annual report on internal control over financial reporting. Our responsibility is to express an opinion on the Company’s internal control over financial reporting based on our audit. We are a public accounting firm registered with the PCAOB and are required to be independent with respect to the Company in accordance with the U.S. federal securities laws and the applicable rules and regulations of the Securities and Exchange Commission and the PCAOB.
We conducted our audit in accordance with the standards of the PCAOB. Those standards require that we plan and perform the audit to obtain reasonable assurance about whether effective internal control over financial reporting was maintained in all material respects.
Our audit included obtaining an understanding of internal control over financial reporting, assessing the risk that a material weakness exists, testing and evaluating the design and operating effectiveness of internal control based on the assessed risk, and performing such other procedures as we considered necessary in the circumstances. We believe that our audit provides a reasonable basis for our opinion.
Definition and Limitations of Internal Control Over Financial Reporting
A company’s internal control over financial reporting is a process designed to provide reasonable assurance regarding the reliability of financial reporting and the preparation of financial statements for external purposes in accordance with generally accepted accounting principles. A company’s internal control over financial reporting includes those policies and procedures that (1) pertain to the maintenance of records that, in reasonable detail, accurately and fairly reflect the transactions and dispositions of the assets of the company; (2) provide reasonable assurance that transactions are recorded as necessary to permit preparation of financial statements in accordance with generally accepted accounting principles, and that receipts and expenditures of the company are being made only in accordance with authorizations of management and directors of the company; and (3) provide reasonable assurance regarding prevention or timely detection of unauthorized acquisition, use, or disposition of the company’s assets that could have a material effect on the financial statements.
Because of its inherent limitations, internal control over financial reporting may not prevent or detect misstatements. Also, projections of any evaluation of effectiveness to future periods are subject to the risk that controls may become inadequate because of changes in conditions, or that the degree of compliance with the policies or procedures may deteriorate.
/s/ Ernst & Young LLP
Los Angeles, California
January 29, 2024
Item 9B. OTHER INFORMATION
Disclosure of 10b5-1 plans
None of our officers or directors had any contract, instruction, or written plan for the purchase or sale of our securities that was intended to satisfy the affirmative defense conditions of Rule 10b5-1(c) or any “non-Rule 10b5-1 trading arrangement” in effect at any time during the year ended December 31, 2023.
Item 9C. DISCLOSURE REGARDING FOREIGN JURISDICTIONS THAT PREVENT INSPECTIONS
Not applicable.
PART III
Item 10. DIRECTORS, EXECUTIVE OFFICERS, AND CORPORATE GOVERNANCE
The information required by this Item is incorporated herein by reference from our definitive proxy statement for our 2024 annual meeting of stockholders to be filed pursuant to Regulation 14A within 120 days after the end of our fiscal year (the “2024 Proxy Statement”) under the captions “Directors and Executive Officers” and “Corporate Governance Guidelines and Code of Ethics.”
Item 11. EXECUTIVE COMPENSATION
The information required by this Item is incorporated herein by reference from our 2024 Proxy Statement under the caption “Executive Compensation.”
Item 12. SECURITY OWNERSHIP OF CERTAIN BENEFICIAL OWNERS AND MANAGEMENT AND RELATED STOCKHOLDER MATTERS
The following table sets forth information on the Company’s equity compensation plan as of December 31, 2023:
Equity Compensation Plan Information
| Number of securities to be issued upon exercise of outstanding options, warrants, and rights (a) | Weighted-average exercise price of outstanding options, warrants, and rights (b) | Number of securities remaining available for future issuance under equity compensation plans (excluding securities reflected in column (a)) (c) | ||||||||||||||||||
| Equity Compensation Plan Approved by Stockholders — Amended and Restated 1997 Stock Award and Incentive Plan | — | — | 2,708,800 |
The other information required by this Item is incorporated herein by reference from our 2024 Proxy Statement under the caption “Security Ownership of Certain Beneficial Owners and Management.”
Item 13. CERTAIN RELATIONSHIPS AND RELATED TRANSACTIONS, AND DIRECTOR INDEPENDENCE
The information required by this Item is incorporated herein by reference from our 2024 Proxy Statement under the captions “Certain Relationships and Related Transactions,” “Policies and Procedures with Respect to Related-Person Transactions,” and “Director Independence.”
Item 14. PRINCIPAL ACCOUNTANT FEES AND SERVICES
The information required by this Item is incorporated herein by reference from our 2024 Proxy Statement under the caption “Fees Billed by Independent Registered Public Accountants.”
PART IV
Item 15. EXHIBITS AND FINANCIAL STATEMENT SCHEDULES
(a)(1) and (2) Financial Statements and Financial Statement Schedule
The financial statements and financial statement schedule required by this Item are included as a separate section in this annual report on Form 10-K beginning on page F-1.
| Page | |||||
| Report of Independent Registered Public Accounting Firm (PCAOB ID: 00042) | F-1 | ||||
| Audited Consolidated Financial Statements of Alexandria Real Estate Equities, Inc.: | |||||
| Consolidated Balance Sheets as of December 31, 2023 and 2022 | F-3 | ||||
| Consolidated Financial Statements for the Years Ended December 31, 2023, 2022, and 2021: | |||||
| Consolidated Statements of Operations | F-4 | ||||
| Consolidated Statements of Comprehensive Income | F-5 | ||||
| Consolidated Statements of Changes in Stockholders’ Equity and Noncontrolling Interests | F-6 | ||||
| Consolidated Statements of Cash Flows | F-8 | ||||
| Notes to Consolidated Financial Statements | F-10 | ||||
| Schedule III – Consolidated Financial Statement Schedule of Real Estate and Accumulated Depreciation | F-51 |
(a)(3) Exhibits
| Exhibit Number | Exhibit Title | Incorporated by Reference to: | Date Filed | |||||||||||||||||
| 4.3* | Supplemental Indenture No. 4, dated as of July 18, 2014, among the Company, as Issuer, Alexandria Real Estate Equities, L.P., as Guarantor, and the Bank of New York Mellon Trust Company, N.A., as Trustee | Form 8-K | July 18, 2014 | |||||||||||||||||
| 4.4* | Form of 4.500% Senior Notes due 2029 (included in Exhibit 4.3 above) | Form 8-K | July 18, 2014 | |||||||||||||||||
| 4.5* | [Indenture, dated as of November 17, 2015, among the Company, as Issuer, Alexandria Real Estate Equities, L.P., as Guarantor, and Wilmington Trust, National Association, as Trustee](http://www.sec.gov/Archiv |
Showing the first 8K of 317K characters. Open the full section