 filings.tools
Alexandria Real Estate Equities (ARE) 10-K risk factor changes: FY2023 vs FY2022
The 2023-12-31 10-K against the 2022-12-31 one, compared heading by heading and sentence by sentence.
Item 1A192 rewritten128 added179 removed954 unchanged
All filing items1,826 rewritten1,350 added1,175 removed3,358 unchanged
Summary
counted, not written
- Item 1A lists 86 risk factor headings: 5 new, 9 reworded and 72 unchanged since FY2022. 7 headings from FY2022 no longer appear.
- Sentence by sentence, 1,350 added, 1,175 removed, 1,826 rewritten and 3,358 unchanged across 16 items that differ.
- New this year: Item 1C. CYBERSECURITY.
New Item 1A headings (5)
- The outbreak of any highly infectious or contagious disease could adversely impact or cause disruption to our financial condition and results of operations.
- We are subject to evolving privacy and information security laws, regulations, policies, and contractual obligations related to data privacy and security. Changes to these requirements, or our noncompliance therewith, could subject us to fines or penalties, increased costs of doing business, compliance risks, and potential liability and could materially and adversely affect our business, financial condition, and results of operations.
- If our information technology networks or data, or those of third parties upon which we rely, are or were disrupted or otherwise compromised, we could experience costly remediation or other expenses, liability under federal and state laws, and litigation and investigations, any of which could result in substantial reputational damage and materially and adversely affect our business, financial condition, results of operations, cash flows, and the market price of our common stock.
- Short sellers may engage in manipulative activity intended to drive down the market price of our common stock, which could result in a material diversion of our management’s time and may also lead to related governmental or regulatory inquiries or other legal actions, among other effects.
- We hold a portion of our cash and cash equivalents in deposit accounts that could be adversely affected if the financial institutions holding such deposits fail.
Removed Item 1A headings (7)
- Monetary policy actions by the U.S. Federal Reserve could adversely impact our financial condition and our ability to make distributions to our stockholders.
- The provisions of the Dodd-Frank Wall Street Reform and Consumer Protection Act (the “Dodd-Frank Act”) may subject us to substantial additional federal regulation and may adversely affect our business, results of operations, cash flows, or financial condition.
- The replacement of LIBOR with SOFR or another alternative reference rate may adversely affect interest expense related to outstanding debt.
- The outbreak of highly infectious or contagious diseases could adversely impact or cause disruption to our financial condition and results of operations. Further, the spread of COVID-19 has caused severe disruptions in the U.S. and global economies, may further disrupt financial markets, and could create widespread business continuity issues.
- Security incidents through cyber attacks, cyber intrusions, or other methods could disrupt our information technology networks, enterprise applications, and related systems; cause a loss of assets, system availability, or data; give rise to remediation or other expenses; expose us to liability under federal and state laws; and subject us to litigation and investigations, which could result in substantial reputational damage and materially and adversely affect our business, financial condition, results of operations, and cash flows, and the market price of our common stock.
- The ongoing implementation of derivatives regulations could have an adverse impact on our ability to hedge risks associated with our business.
- We are subject to risks from potential fluctuations in exchange rates between the U.S. dollar and foreign currencies.
Reworded Item 1A headings (9)
- If our
[removed: revenues are less than][added: expenses exceed] our[removed: expenses,][added: revenues,] we may have to borrow additional funds, and we may not be able to make distributions to our stockholders. - The loss of services of any of our [added: executive and/or] senior officers could adversely affect us.
- We are dependent on third parties to manage
[removed: the][added: certain] amenities at our properties. [removed: We][added: Our tenants and venture investments] are[removed: dependent on][added: primarily in] the life science, agtech, and technology industries, and changes within these industries may adversely impact our revenues from lease payments, the value of our non-real estate investments, and our operating results.- Market and other external factors may adversely impact the valuation of our [added: non-real estate] equity investments.
- Market and other external factors may negatively impact the liquidity of our [added: non-real estate] equity investments.
- The outbreak
[removed: of the coronavirus disease,]or[removed: COVID-19, or the future outbreak][added: spread] of any[removed: other]highly infectious or contagious[removed: diseases,][added: disease] could adversely impact or cause disruption to our tenants’ financial condition and results of operations, which may adversely impact our ability to generate income sufficient to meet operating expenses or generate income and capital appreciation. - We may invest or spend the net proceeds from the offerings of our unsecured senior notes payable
[removed: due in April 2026, May 2032, and March 2034][added: earmarked for Eligible Green Projects (the “Green Bonds”)] in ways investors may not agree with and in ways that may not earn a profit. - Failure of the U.S. federal government to manage its fiscal matters or to
[removed: raise or further suspend the debt ceiling, and changes in the amount of federal debt,][added: avoid a government shutdown] may negatively impact the economic environment and adversely impact our results of operations.
A heading is new when no FY2022 heading matches it after ignoring case and punctuation, and reworded when it shares at least 60 percent of its words with one that went away. All current risk factor headings.
Sentences by item
23 items, with every count and a link to each item that changed
Underlined words on a shaded ground are new in FY2023; struck-through words were in FY2022. Sentences that are wholly new or wholly gone are labelled rather than marked.
Item 1A. RISK FACTORS
192 rewritten, 128 added, 179 removed, 954 unchanged
- We may not be able to raise sufficient capital to fund our operations due to adverse changes in our credit ratings, our inability to refinance our existing debt or issue new debt, or our inability to sell existing [removed: properties timely.][added: real estate and non-real estate assets timely or at optimal prices.]
- Market disruption and volatility, poor economic conditions in the capital markets and global economy, including in connection with a widespread pandemic or outbreak of [removed: disease (such as COVID-19),] [added: a highly infectious or contagious disease,] and tight labor markets could adversely affect the value of the companies in which we hold equity investments or the ability of tenants and the companies in which we invest to continue operations, raise additional capital, or access capital from venture capital investors or financial institutions on favorable terms or at all.
- The outbreak of [removed: COVID-19, or the future outbreak of] any [removed: other] highly infectious or contagious [removed: diseases,] [added: disease] could adversely impact [removed: or cause disruption to] our financial condition and results of operations, and/or [removed: to the financial condition and results of operations] [added: that] of our tenants and non-real estate investments.
- System failures or security incidents through [removed: cyber attacks,] [added: cyberattacks,] intrusions, or other methods could disrupt our information technology networks, enterprise applications, and related systems, cause a loss of assets or data, give rise to remediation or other expenses, expose us to liability under federal and state laws, and subject us to litigation and investigations, which could result in substantial reputational damage and adversely affect our business and financial condition.
We have not encountered significant difficulty collaborating with our suppliers and contractors and obtaining materials and skilled labor, nor experienced significant delays [removed: or increases in overall project costs] due to disputes, work stoppages, or contractors’ misconduct or failure to perform.
In addition, new [removed: energy-related] [added: climate change-related] initiatives entered into [added: by the U.S. government] in collaboration with partner countries through global climate agreements may impose stricter requirements for building materials, such as lumber, steel, and concrete, which could significantly increase our construction costs if the manufacturers and suppliers of our materials are burdened with expensive cap-and-trade or similar [removed: energy-related] regulations or requirements, and the costs of which are passed onto customers like us.
Our ability to continue to identify and develop relationships with a sufficient network of qualified suppliers who can adequately meet our construction timing and quality standards can be a significant challenge, particularly [removed: if] [added: in the event of] global supply chain [removed: disruptions continue to persist into 2023.][added: disruptions.]
While we are not aware of such issues materially affecting our tenants to date, it is possible that these issues may affect our tenants [added: adversely] in the [removed: future, and continued supply chain and procurement disruptions could potentially impact such tenants adversely.][added: future.]
[removed: Upon] [added: Prior to the] expiration of a ground lease and all of its options, we may not be able to renegotiate a new lease on favorable terms, if at all.
- We may not be able to acquire or sell properties when desired or [removed: needed,] [added: needed] due to the illiquid nature of real estate assets.
- We may not be able to complete improvements required to maintain or improve [removed: space,] [added: space] due to unanticipated delays, significant cost increases by our vendors, or cancellation of construction resulting from shortages in the supply of necessary construction materials.
Under these joint venture arrangements, any disagreements between our partners and us may result in delayed [added: or unfavorable] decisions.
As of December 31, [removed: 2022,] [added: 2023,] approximately [removed: 93%] [added: 94%] of our leases (on an annual rental revenue basis) were triple net leases, which require tenants to pay substantially all real estate and other rent-related taxes, insurance, utilities, security, common area expenses, and other operating expenses (including increases thereto) in addition to base rent.
Our operating expenses may increase as a result of tax reassessments that our properties are subject to on a regular basis (annually, triennially, etc.), which [removed: normally] [added: may] result in increases in property taxes [removed: over time] as property values [removed: increase.][added: increase over time.]
From time to time, lawmakers and political coalitions initiate efforts to repeal or amend Proposition 13 to eliminate its application to commercial and industrial [removed: properties.][added: properties, which, if successful, may prohibit or limit the passing of increased property tax assessments onto tenants.]
[removed: Compliance] [added: In addition, compliance] with various laws passed in California and other states in which we conduct business may result in cost increases due to new constraints on our business and the effects of potential non-compliance by us or third-party service providers.
During the [removed: twelve months] [added: year] ended December [removed: 2022,] [added: 31, 2023,] the consumer price index [added: (“CPI”)] rose by approximately [removed: 6.5%, compared to the twelve months ended December 2021.][added: 3.4%.]
Our operating expenses are incurred in connection with, among others, [removed: the] property-related contracted services such as janitorial and engineering services, utilities, security, repairs and maintenance, and insurance.
[removed: In] [added: As discussed previously, in] California, property taxes are not reassessed based on changes in the fair value of the underlying real estate asset but are instead limited to a maximum 2% annual increase by law.
As of December 31, [removed: 2022,] [added: 2023,] approximately [removed: 93%] [added: 94%] of our existing leases (on an annual rental revenue basis) were triple net leases, which allow us to recover operating expenses, and approximately 93% of our existing leases (on an annual rental revenue basis) also provided for the recapture of capital expenditures.
[removed: As a result, we do not believe that inflation would result] [added: Due to our ability to largely recover increases] in [added: operating expenses from our triple net leases, inflation typically does not have] a significant adverse effect on our net operating income, results of operations, and operating cash flows at the property level.
However, there is no guarantee that our tenants would be able to absorb these expense increases and [removed: be able] to continue to pay us their portion of operating expenses, capital expenditures, and [removed: rent.][added: rent, or to be able to continue operating their businesses or conducting research and development activities altogether.]
Alternatively, our tenants may decide to relocate to areas with lower rent and operating [removed: expenses,] [added: expenses] where we may not currently own properties, [removed: and] [added: and, as a result,] our tenants may cease [removed: to lease] [added: leasing] properties from us.
Annually, our employee compensation is adjusted to reflect merit increases; however, to maintain our ability to successfully compete for the best talent, especially in a talent shortage environment, rising inflation rates may require us to provide compensation increases beyond historical annual merit increases, which may unexpectedly [removed: or] [added: and/or] significantly increase our compensation costs.
Similarly, technology services and professional service fees are also subject to the impact of inflation and [removed: expected to] [added: generally] increase proportionately with increasing market prices for such services.
Consequently, inflation may increase our general and administrative expenses over [removed: time and may adversely impact our results of operations and operating cash flows.][added: time.]
[removed: Also, during] [added: During] inflationary periods, interest rates have historically increased.
[removed: In March 2022, in an attempt] [added: For instance,] to [removed: curb] [added: control] the [removed: inflation rate,] [added: rate of inflation,] the Board of Governors of the Federal Reserve System (the “U.S. Federal Reserve”) raised its benchmark federal funds rate [removed: by 0.25%] [added: from nearly zero in March 2022] to a range between [removed: 0.25%] [added: 5.25%] and [removed: 0.50%, the first increase since] [added: 5.50% as of] December [removed: 2018.][added: 31, 2023.]
[removed: The effect of inflation on] [added: A continued increase in] interest rates could increase our financing costs over time, either through near-term borrowings on our variable-rate unsecured senior line of credit and commercial paper program, refinancing of our existing borrowings, or the issuance of new debt.
Consequently, prolonged periods of higher interest rates may negatively impact the valuation of our real estate asset portfolio and [removed: result in the decline] [added: lead to higher cost] of [removed: our stock price and market capitalization and] [added: capital and/or] lower sales proceeds from future real estate [removed: dispositions, which in turn could adversely affect our financial condition and our ability to make distributions to our stockholders.][added: dispositions.]
As of December 31, [removed: 2022,] [added: 2023,] approximately 96% of our leases (on an annual rental revenue basis) contained effective annual rent escalations approximating 3% that were either fixed or indexed based on [removed: a consumer price index] [added: the CPI] or [removed: other] [added: another] index.
We have long-term lease agreements with our tenants, of which [removed: 3%–11%] [added: 3%–12%] (based on occupied RSF) expire each [removed: year primarily over the next ten years.][added: year.]
However, [removed: the impact of] [added: during inflationary periods in which] the [removed: current rate of] inflation [removed: of 6.5% may not be adequately offset by some of our] [added: rate exceeds the] annual rent [removed: escalations, and it is possible that] [added: escalation percentages within our lease contracts, these rate escalations or] the resetting of rents from our renewal and re-leasing activities [removed: would] [added: may] not [removed: fully] [added: adequately] offset the impact of [removed: the current inflation rate.][added: inflation.]
Additionally, inflationary pricing may [removed: have a negative effect on] [added: increase] the construction costs necessary to complete our development and redevelopment projects, including, but not limited to, costs of construction materials, labor, and services from third-party contractors and suppliers.
We rely on a number of [removed: these] third-party suppliers and contractors to supply raw materials, skilled labor, and services for our construction projects.
However, it is not guaranteed that our budget contingencies would accurately account for potential construction cost [removed: increases given the current severity of inflation and variety of contributing factors.][added: increases.]
We have not encountered significant difficulty collaborating with [removed: our] [added: these] third-party suppliers and contractors and obtaining materials and skilled labor, nor experienced significant delays or increases in overall project costs due to the factors discussed above.
While we do not rely on any single supplier or vendor for the majority of our materials and skilled labor, we may experience difficulties obtaining necessary materials from suppliers or vendors whose supply chains might become impacted by economic or political changes, outmoded technology, aging infrastructure, shortages of shipping containers and/or means of transportation, or difficulties obtaining adequate skilled labor from third-party [removed: contractors in a tight labor market.][added: contractors.]
It is uncertain whether we would be able to [added: continue to] source the essential commodities, supplies, materials, and skilled labor timely or at all without incurring significant costs or delays, particularly during times of economic uncertainty resulting from events outside of our [removed: control, including, but not limited to, effects of the COVID-19 pandemic, federal policies, and the ongoing Russia-Ukraine war.][added: control.]
[removed: As a result,] [added: The realization of any of the aforementioned risks could adversely affect] our financial condition, results of operations, and cash flows, [added: our stock price and market capitalization,] as well as our ability to pay [removed: dividends, could be adversely affected over time.][added: dividends.]
- Changes in privacy and information security laws, regulations, policies, and contractual obligations related to data privacy and security, or our failure to comply with such requirements, could subject us to fines or penalties or increase our cost of doing business, compliance risks, and potential liability and otherwise adversely affect our business or results of operations.
- We may be unable to proceed with our development or redevelopment projects as anticipated due to changing zoning, land use, building, occupancy, or other government codes or regulations.
During the past three years, the CPI peaked at 9.1%.
Although there are expectations that the U.S. Federal Reserve will begin reducing the federal funds rate in 2024, these expectations might not materialize.
- Short selling of our common stock or related derivative securities;
- The publication or dissemination of opinions, characterizations, or disinformation that are intended to create negative market momentum, including through the use of social media;
- Risks associated with generative artificial intelligence tools and large language models and the conclusions that these tools and models may draw about our business and prospects in connection with the dissemination of negative opinions, characterizations, or disinformation;
- Disruptions in the banking sector or failures of financial institutions that we or our tenants may or may not have business relationships with;
We have a small portfolio of operating properties outside the U.S., primarily in Canada.
- Our partners may have banking or financial relationships with institutions that become insolvent or otherwise fail, which could affect our access to capital;
- Our joint venture partners may have rights to sell their interests to us, which we may face challenges in fulfilling due to potential capital constraints, or alternatively, if we elect not to buy their interests, we may be forced to sell the underlying asset when we otherwise would not decide to do so;
Our all-risk property insurance currently provides a $2.0 billion per occurrence limit for our operating portfolio.
There is no assurance that we will maintain current levels of insurance coverage in the future.
For properties in California, coverage is $335 million, per occurrence and has an annual aggregate limit, subject to a 5% deductible of the property’s replacement value.
For the Seattle region, the coverage is $200 million, per occurrence and has an annual aggregate limit, subject to a 2% deductible.
Nevertheless, a major earthquake in any region could lead to substantial losses, potentially exceeding our insurance coverage and resulting in material aggregate deductible amounts.
This could adversely affect our business, financial condition, results
of operations, and cash flows.
We regularly evaluate the insurance market, including for coverage against terrorism, earthquakes, and other catastrophic events.
However, we cannot predict the availability and affordability of such coverage in the future.
Should the premiums for our earthquake and other insurance policies become prohibitively expensive or if we decide to self-insure some of our risks, we may modify or discontinue the coverage for some or all of our properties.
For our properties in wildfire- or flood-prone areas, we are evaluating mitigation strategies and potential operational and physical improvements.
- *Flood-resilience measures*.
We cannot predict the future availability of insurance coverage against any risk of loss.
Insurance companies may discontinue coverage for certain risks, or, if offered, such coverage may become excessively expensive.
To qualify as a REIT, we must satisfy a number of requirements, including those regarding the ownership of our stock and the composition of our assets and gross income.
We must also make distributions to stockholders aggregating at least 90% of our annual REIT taxable income, excluding net capital gains.
We currently own, and may acquire in the future, direct or indirect interests in one or more entities that have elected or may elect to be taxed as REITs under the Internal Revenue Code, which are subject to the various REIT qualification requirements and limitations described herein.
If any of these entities were to fail to qualify as a REIT, then (i) the entity would become subject to federal and state income taxes, (ii) shares in such an entity would cease to be qualifying assets for purposes of asset tests applicable to REITs, and (iii) we may fail certain of the asset tests applicable to REITs, in which event we would fail to qualify as a REIT unless we qualify for certain relief provisions.
In addition, we currently own interests in certain taxable REIT subsidiaries and may continue to acquire such interests in the future.
A taxable REIT subsidiary is a corporation (or entity treated as a corporation for federal income tax purposes), other than a REIT, that has made a joint election with a parent REIT (which directly or indirectly owns stock in the REIT subsidiary) to be treated as a taxable REIT subsidiary.
The subsidiary is subject to federal and state income taxes as a regular C corporation and is further subject to a 100% excise tax for certain transactions between the taxable REIT subsidiary and its parent REIT that are not conducted on an arm’s-length basis.
We intend to structure our transactions with any taxable REIT subsidiaries that we own to ensure that they are entered into on arm’s-length terms to avoid incurring the 100% excise tax mentioned above.
However, there can be no assurance that we will be able to successfully structure future transactions to avoid being subject to the 100% excise tax, which may adversely impact our cash flows, ability to make distributions to stockholders, and results of operations.
Similarly, we rely on a limited number of vendors that provide utilities services to our properties in other regions.
There is no guarantee that similar events of bankruptcy or distress would not cause unanticipated disruptions in service to any of our properties in affected areas.
- REIT qualification;
It is also possible that our tenants or venture investments within these industries may be adversely affected by crises involving financial institutions with which they have business relationships.
On March 10, 2023, Silicon Valley Bank (“SVB”), the 16th largest bank in the U.S. at the time and headquartered in California, was closed by the California Department of Financial Protection and Innovation, which appointed the FDIC as receiver.
SVB was a provider of commercial and private banking products and services to industries including life science, technology, and healthcare.
- The replacement of LIBOR with SOFR (or another alternative reference rate) and uncertainty related to the volatility of SOFR may adversely affect interest expense related to outstanding variable-rate debt.
- We are subject to risks from potential fluctuations in exchange rates between the U.S. dollar and certain foreign currencies and downgrades of domestic and foreign government sovereign credit ratings.
In addition, we expect to incur higher costs as a result of doing business in California and certain other states.
The recent increases in the consumer price index began during the COVID-19 pandemic and were attributed to disruption in global supply chains and labor shortages.
During the COVID-19 pandemic, the federal government instituted a series of stimulus policies, aggregating approximately $6 trillion, which may have contributed to strong consumer demand and increased consumer spending.
During 2022, China encountered its largest COVID-19 outbreak since the pandemic began in 2020, with approximately two-thirds of the country’s provinces experiencing sustained outbreaks of the virus.
In response, several of China’s largest factory cities ordered lockdowns, which, among its other impacts, imposed strains on the global supply chain and halted production of key consumer goods.
At the end of 2022, China eased its lockdowns significantly, but it is unknown whether such actions will reduce global supply chain strains or result in a new surge of COVID-19 infections and hospitalizations.
Additional supply chain disruptions have been caused by a shortage of long-haul truck drivers and protests by the same.
In addition, federal policies and recent global events may have exacerbated, and may continue to exacerbate, increases in the consumer price index.
Those events include the following:
- In recent years, energy policy in the U.S. has lacked a consistent approach.
Since 2015, during various administrations, the U.S. has joined, abandoned, and rejoined the Paris climate accord.
In addition, the energy policy of the federal government in recent years has, at various times, either limited or increased the production of fossil fuels in the U.S. On March 31, 2022, in response to increases in oil prices, President Biden authorized the release of 1 million barrels per day for the following six months — over 180 million barrels in total — from the Strategic Petroleum Reserve.
In addition, the administration encouraged U.S. oil producers to utilize the approximately 9,000 approved but unused permits for production of oil and gas on federal lands.
- Beginning in late 2021, as political tensions between Russia and Ukraine escalated, Russia amassed troops on the Ukrainian border, and in February 2022, Russia invaded Ukraine.
In response, global economic sanctions were imposed on Russia by the U.S. and the European Union (“EU”), among others.
- In mid-2022, the U.S. administration requested for members of the Organization of the Petroleum Exporting Countries (“OPEC”), including Saudi Arabia and the United Arab Emirates, to significantly increase crude oil production as a way to calm soaring prices on oil.
Conflicts in the Middle East, including a civil war in Yemen where the Saudi government has been heavily involved, also hindered any significant increase in oil production by OPEC beyond a modest increase in the summer months.
In October 2022, due to uncertainty in the global economy and oil market outlook, OPEC announced it would decrease oil production by 2 million barrels a day, the largest cut since the COVID-19 pandemic began.
- On December 5, 2022, the agreement of the G-7 countries to ban their companies from insuring, financing or shipping Russian oil sold at or above $60 a barrel came into effect in the U.S., EU, and the United Kingdom (“U.K.”).
In response, Russia threatened to cut off oil exports which could lead to an increase in global prices.
These factors appear to have had a significant impact on increases to the consumer price index and large fluctuations in energy costs, as reflected in crude oil prices that increased from $60–$70 per barrel in mid-2021 to more than $120 per barrel in March 2022, shortly after Russia’s invasion of Ukraine, then declined during the second half of 2022 and remained at approximately $70–$80 per barrel at the end of 2022.
During inflationary periods, we expect to recover increases in operating expenses from our triple net leases.
Also, due to rising costs, they may be unable to continue operating their businesses or conducting research and development activities altogether.
The success of our business depends in large part on our ability to operate our properties effectively.
If we are unable to retain our tenants or withstand increases in operating expenses, capital expenditures, and rental costs, we may be unable to meet our financial expectations, which may adversely affect our financial condition, results of operations, cash flows, and our ability to make distributions to our stockholders.
In addition, through a series of rapid federal funds rate increases in May 2022, June 2022, July 2022, September 2022, November 2022, and December 2022, the U.S. Federal Reserve increased the federal funds rate to a range between 4.25% and 4.50%.
In addition, on April 5, 2022, the U.S. Federal Reserve confirmed its plan to reduce its balance sheet at a rapid pace beginning in May 2022, effectively concluding the nearly 15-year-long quantitative easing era (in which the U.S. Federal Reserve effectively increased liquidity to consumers and businesses) and launching a reverse process known as quantitative tightening.
Our exposure to increases in interest rates in the short term is limited to our variable-rate borrowings, which consist of borrowings under our unsecured senior line of credit and commercial paper program and SOFR-based secured notes payable.
Amounts issued under our commercial paper program typically mature in less than 30 days and no later than 397 days from the date of issuance and require repayment or refinancing upon maturity.
As a result, during inflationary periods in which the inflation rate exceeds the annual rent escalation percentages within our lease contracts, we may not adequately mitigate the impact of inflation, which may adversely affect our business, financial condition, results of operations, and cash flows.
During 2021 and 2022, industry prices for certain construction materials, including steel, copper, lumber, plywood, concrete, electrical materials, and HVAC materials, experienced significant increases as a result of low inventories; surging demand; underinvestment in infrastructure; tariffs imposed on imports of foreign steel, including on products from key competitors in the EU and China (tariffs in the U.S. on EU exports of steel and aluminum were lifted, effective January 2022); significant changes in the U.S. steel production landscape stemming from the consolidation of certain steel-producing companies; and increases in global commodity and raw materials prices exacerbated by supply and energy shortages that have emerged since the Russia-Ukraine war in 2022.
As a result, the increase in costs of construction materials, heightened by recent inflationary pressure from events noted above, including the Russia-Ukraine conflict, may result in corresponding increases in our overall construction costs.
Our reliance on a number of third-party suppliers and contractors may also make such investment opportunities unattainable if we are unable to sufficiently fund our projects due to significant cost increases or are unable to obtain the resources and materials to do so reasonably due to disrupted supply chains.
We have eight operating properties in Canada and one operating property in China.
As a result, the amount of our earthquake insurance coverage may be insufficient to cover our losses, and aggregate deductible amounts may be material, which could adversely affect our business, financial condition, results of operations, and cash flows.
For our properties located in the areas prone to wildfires or flooding, we are evaluating the extent to which we have mitigations in place and which operational and physical improvements may be made.
As a result, there can be no assurance that climate change and severe weather will not have a material adverse effect on our properties, operations, or business.
The availability of coverage against certain types of losses, such as from terrorism or toxic mold, has become more limited and, when available, carries a significantly higher cost.
An excerpt. Shown here: 40 of 192 rewritten, 40 of 128 added and 40 of 179 removed. The counts are complete. For every sentence, read Item 1A. RISK FACTORS in the FY2023 filing and the FY2022 filing.
Item 7. MANAGEMENT’S DISCUSSION AND ANALYSIS OF FINANCIAL CONDITION AND RESULTS OF OPERATIONS
580 rewritten, 488 added, 444 removed, 661 unchanged
[removed: ][added: ]
[removed: 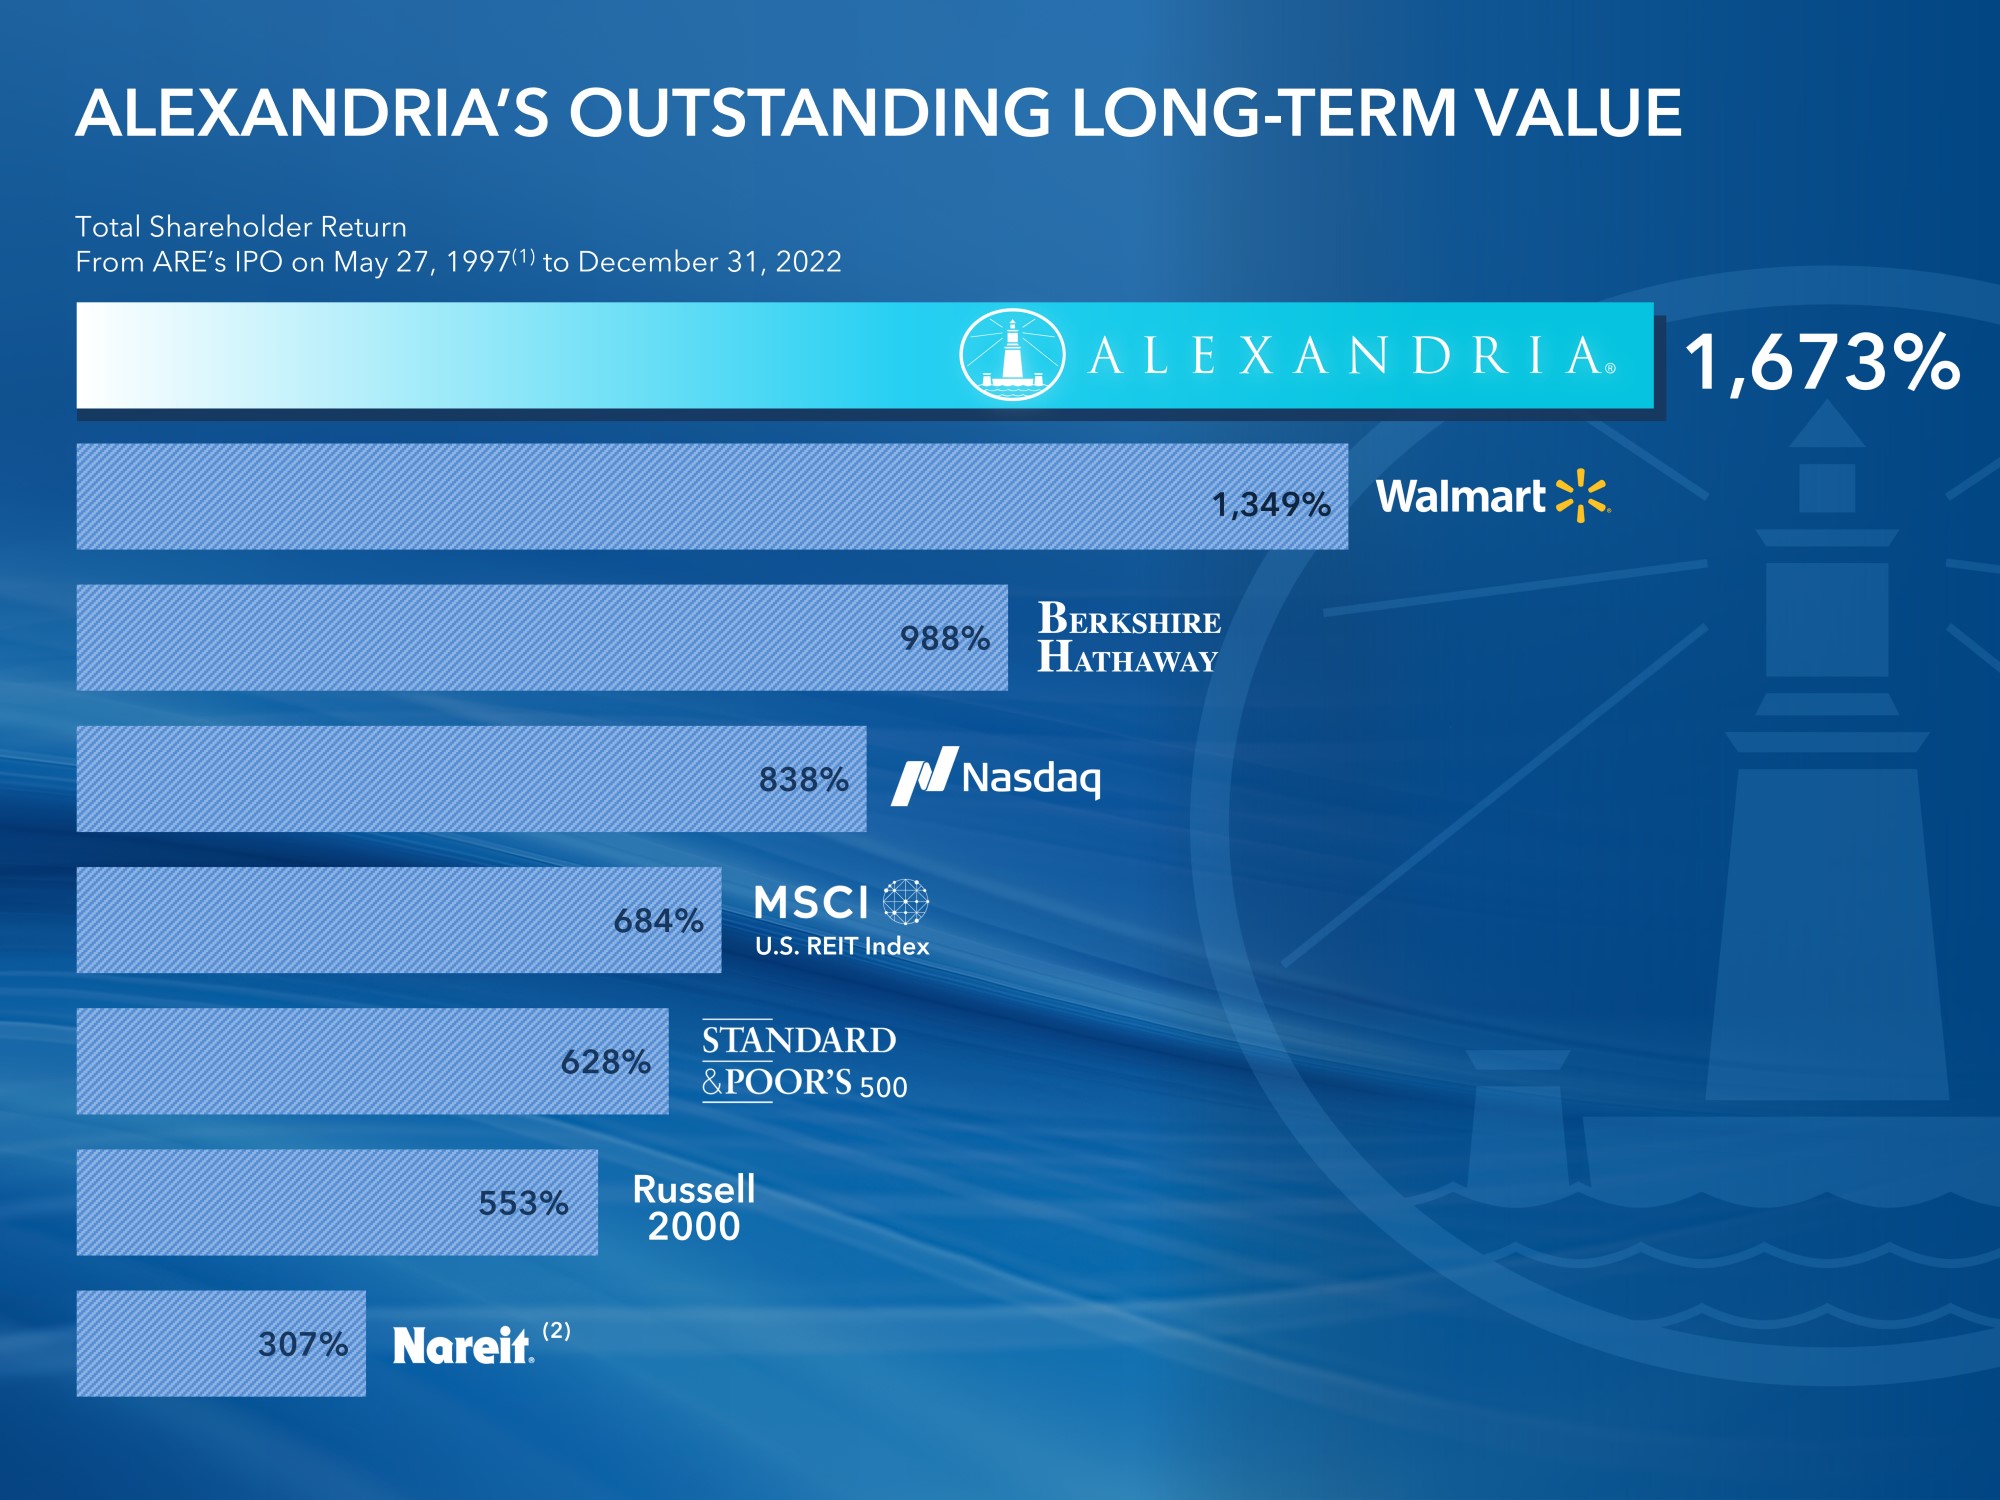][added: ]
[removed: ][added: |  | | | | | | 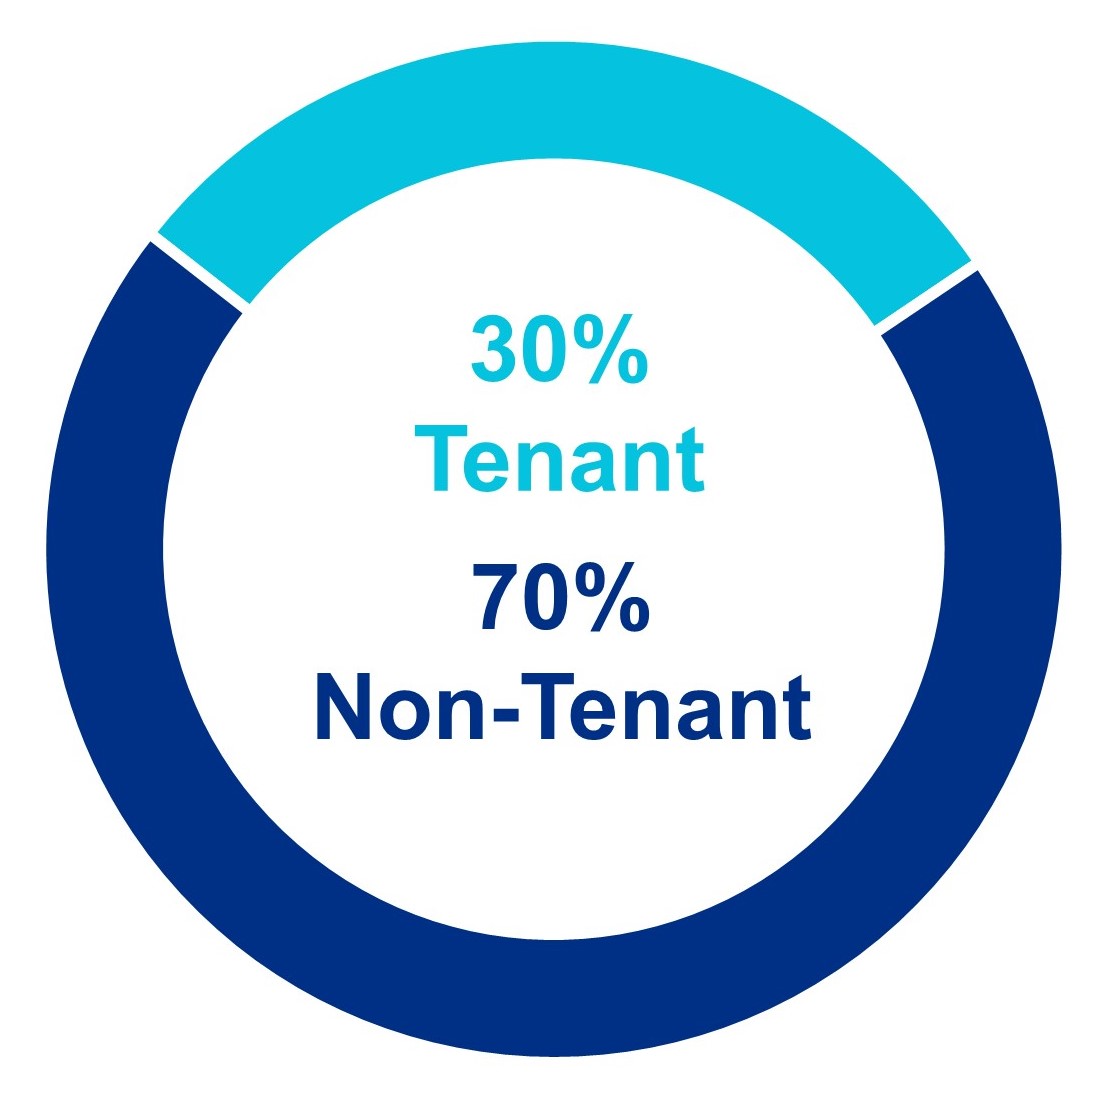 | | |]
[removed: (1)Quarter] [added: (4)Quarter] annualized.
Refer to [added: the definitions of “Fixed-charge coverage ratio” and] “Net debt and preferred stock to Adjusted EBITDA” in the “Non-GAAP measures and definitions” section within this Item 7 for additional details.
[removed: 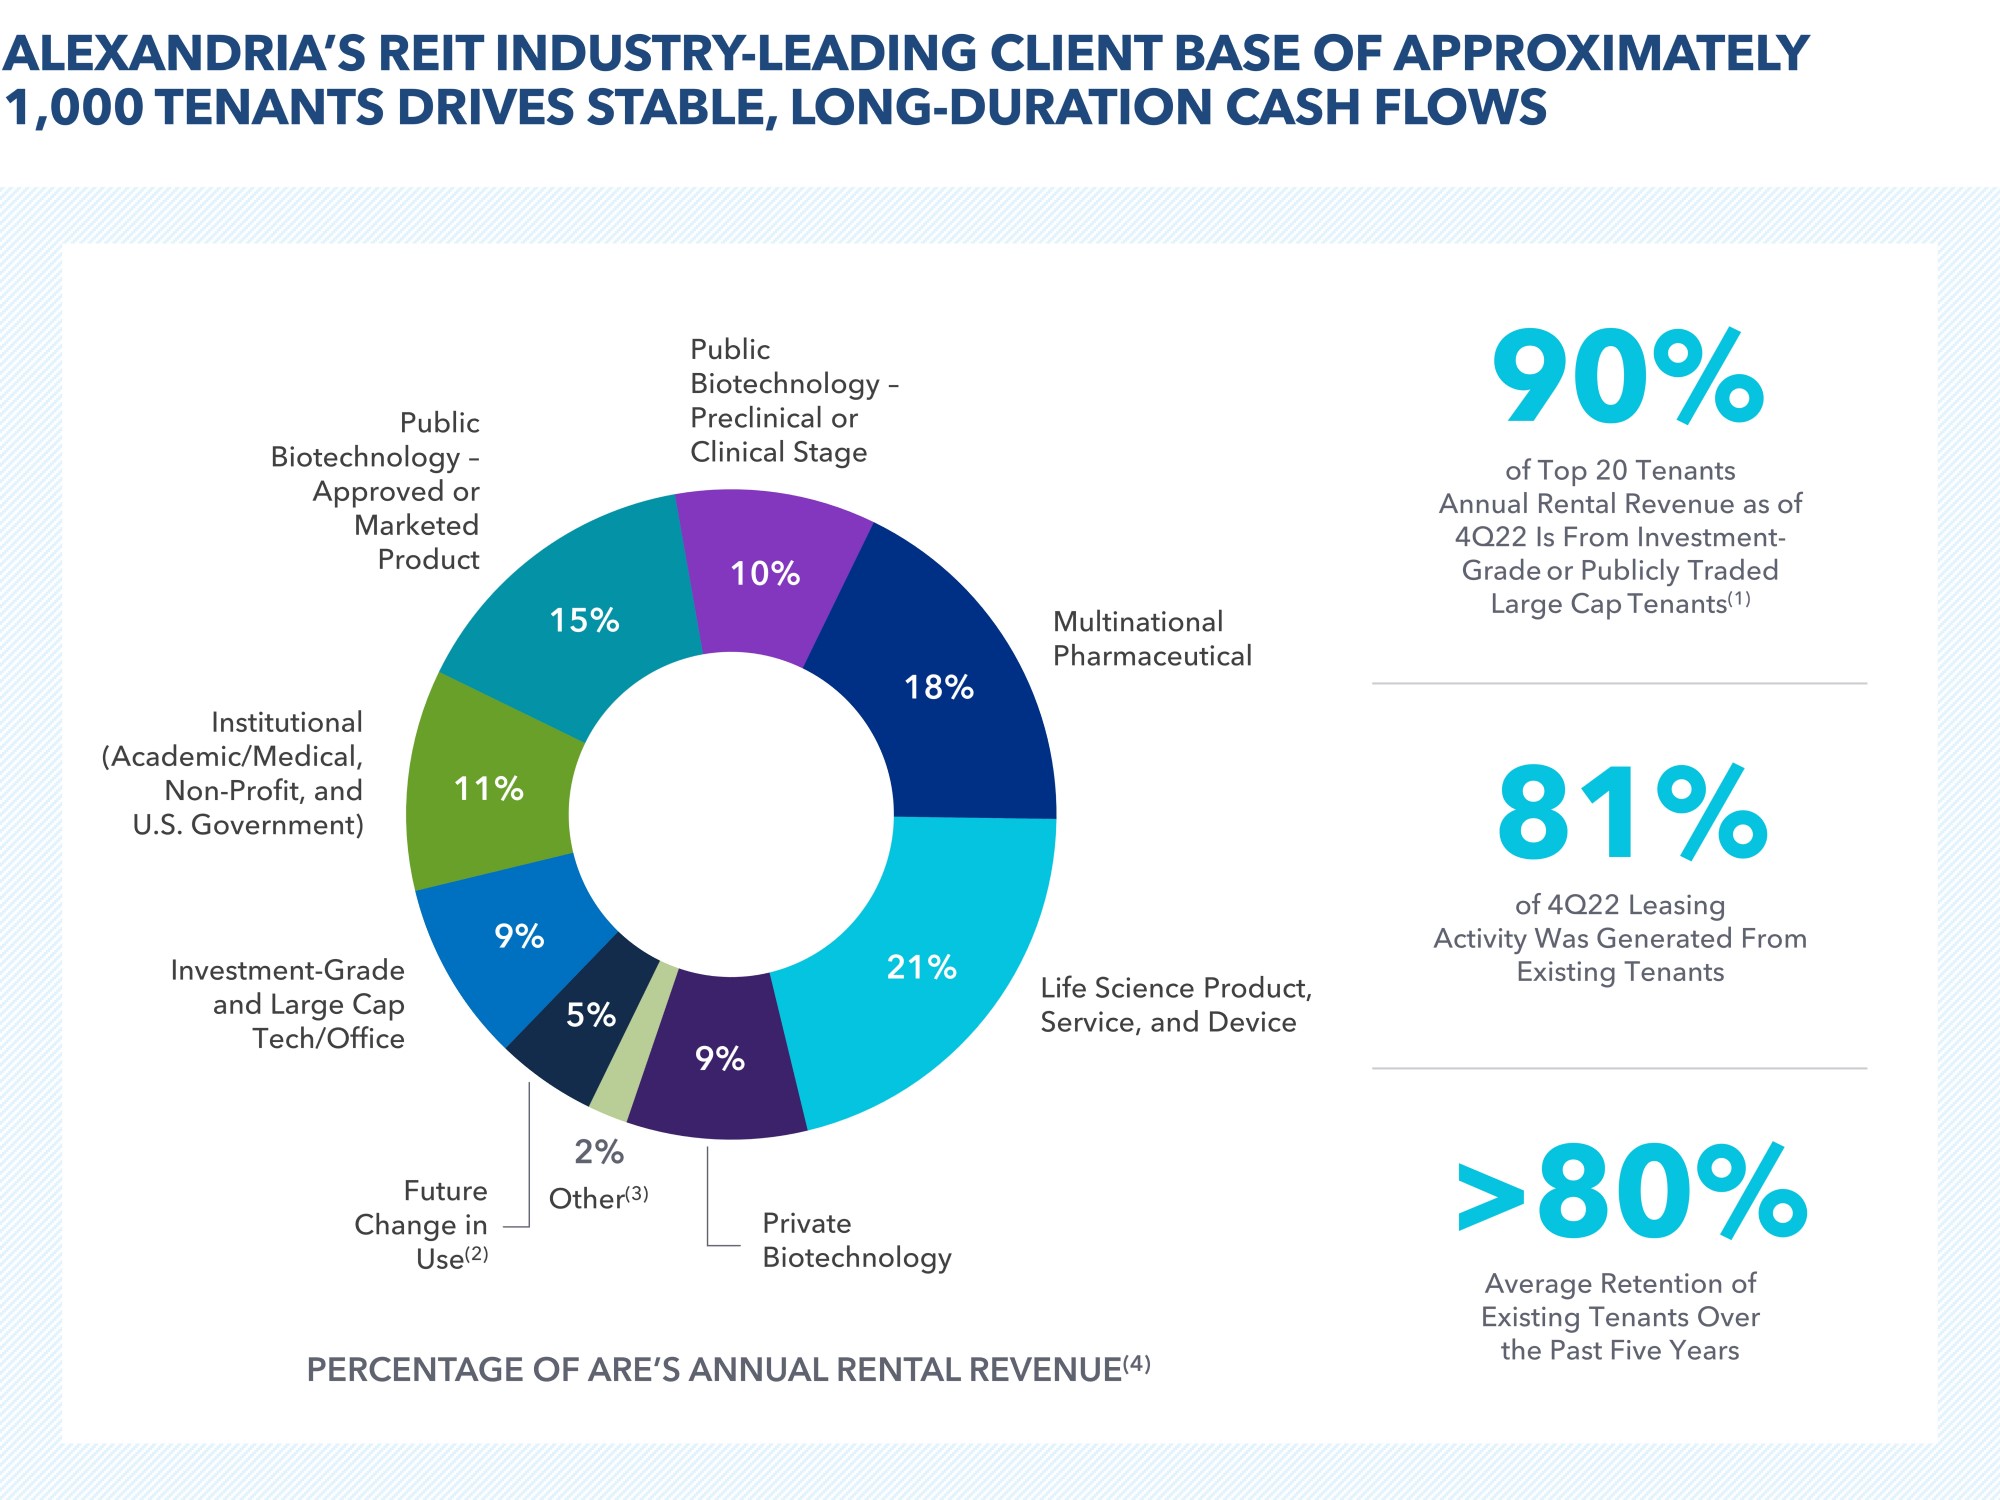][added: | | | | | | | 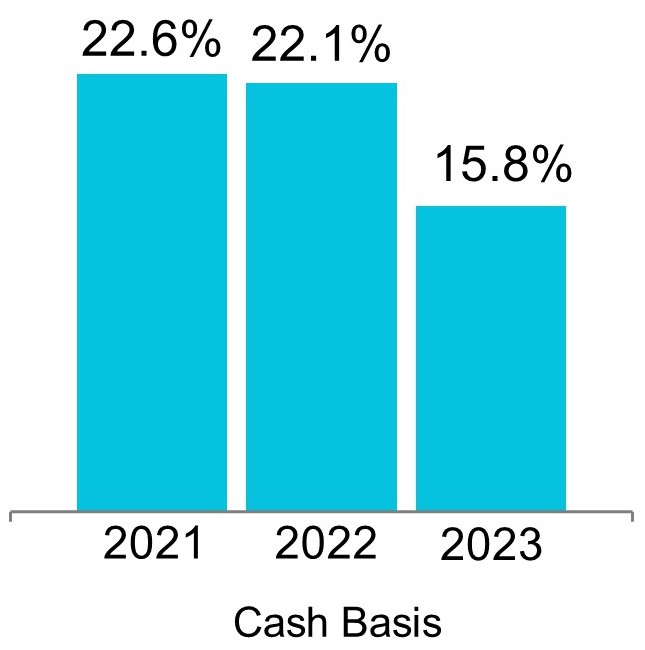 | | | | | | | | | | | | | | | | | | | | | | | | | | |]
[removed: (1)Represents the percentage] [added: - As] of [removed: our annual rental revenue generated by] [added: December 31, 2023, 92% of] our top 20 tenants [removed: that are also] [added: annual rental revenue is derived from] investment-grade or [added: large-cap] publicly traded [removed: large cap tenants.][added: companies, the highest in our 30-year history;]
[removed: Refer] [added: For operating metrics based on annual rental revenue, refer] to [added: the definition of] “Annual rental revenue” [removed: and “Investment-grade or publicly traded large cap tenants”] in [removed: the] [added: this] “Non-GAAP measures and definitions” section within this Item 7 [removed: for additional details.][added: in this annual report on Form 10-K.]
[removed: (4)Represents] [added: (3)Percentages calculated based on] annual rental revenue in effect as of December 31, [removed: 2022.][added: 2023.]
Refer to [removed: “Annual rental revenue” in the] [added: “Same properties” and] “Non-GAAP measures and definitions” [removed: section] within this Item 7 for additional details.
[removed: 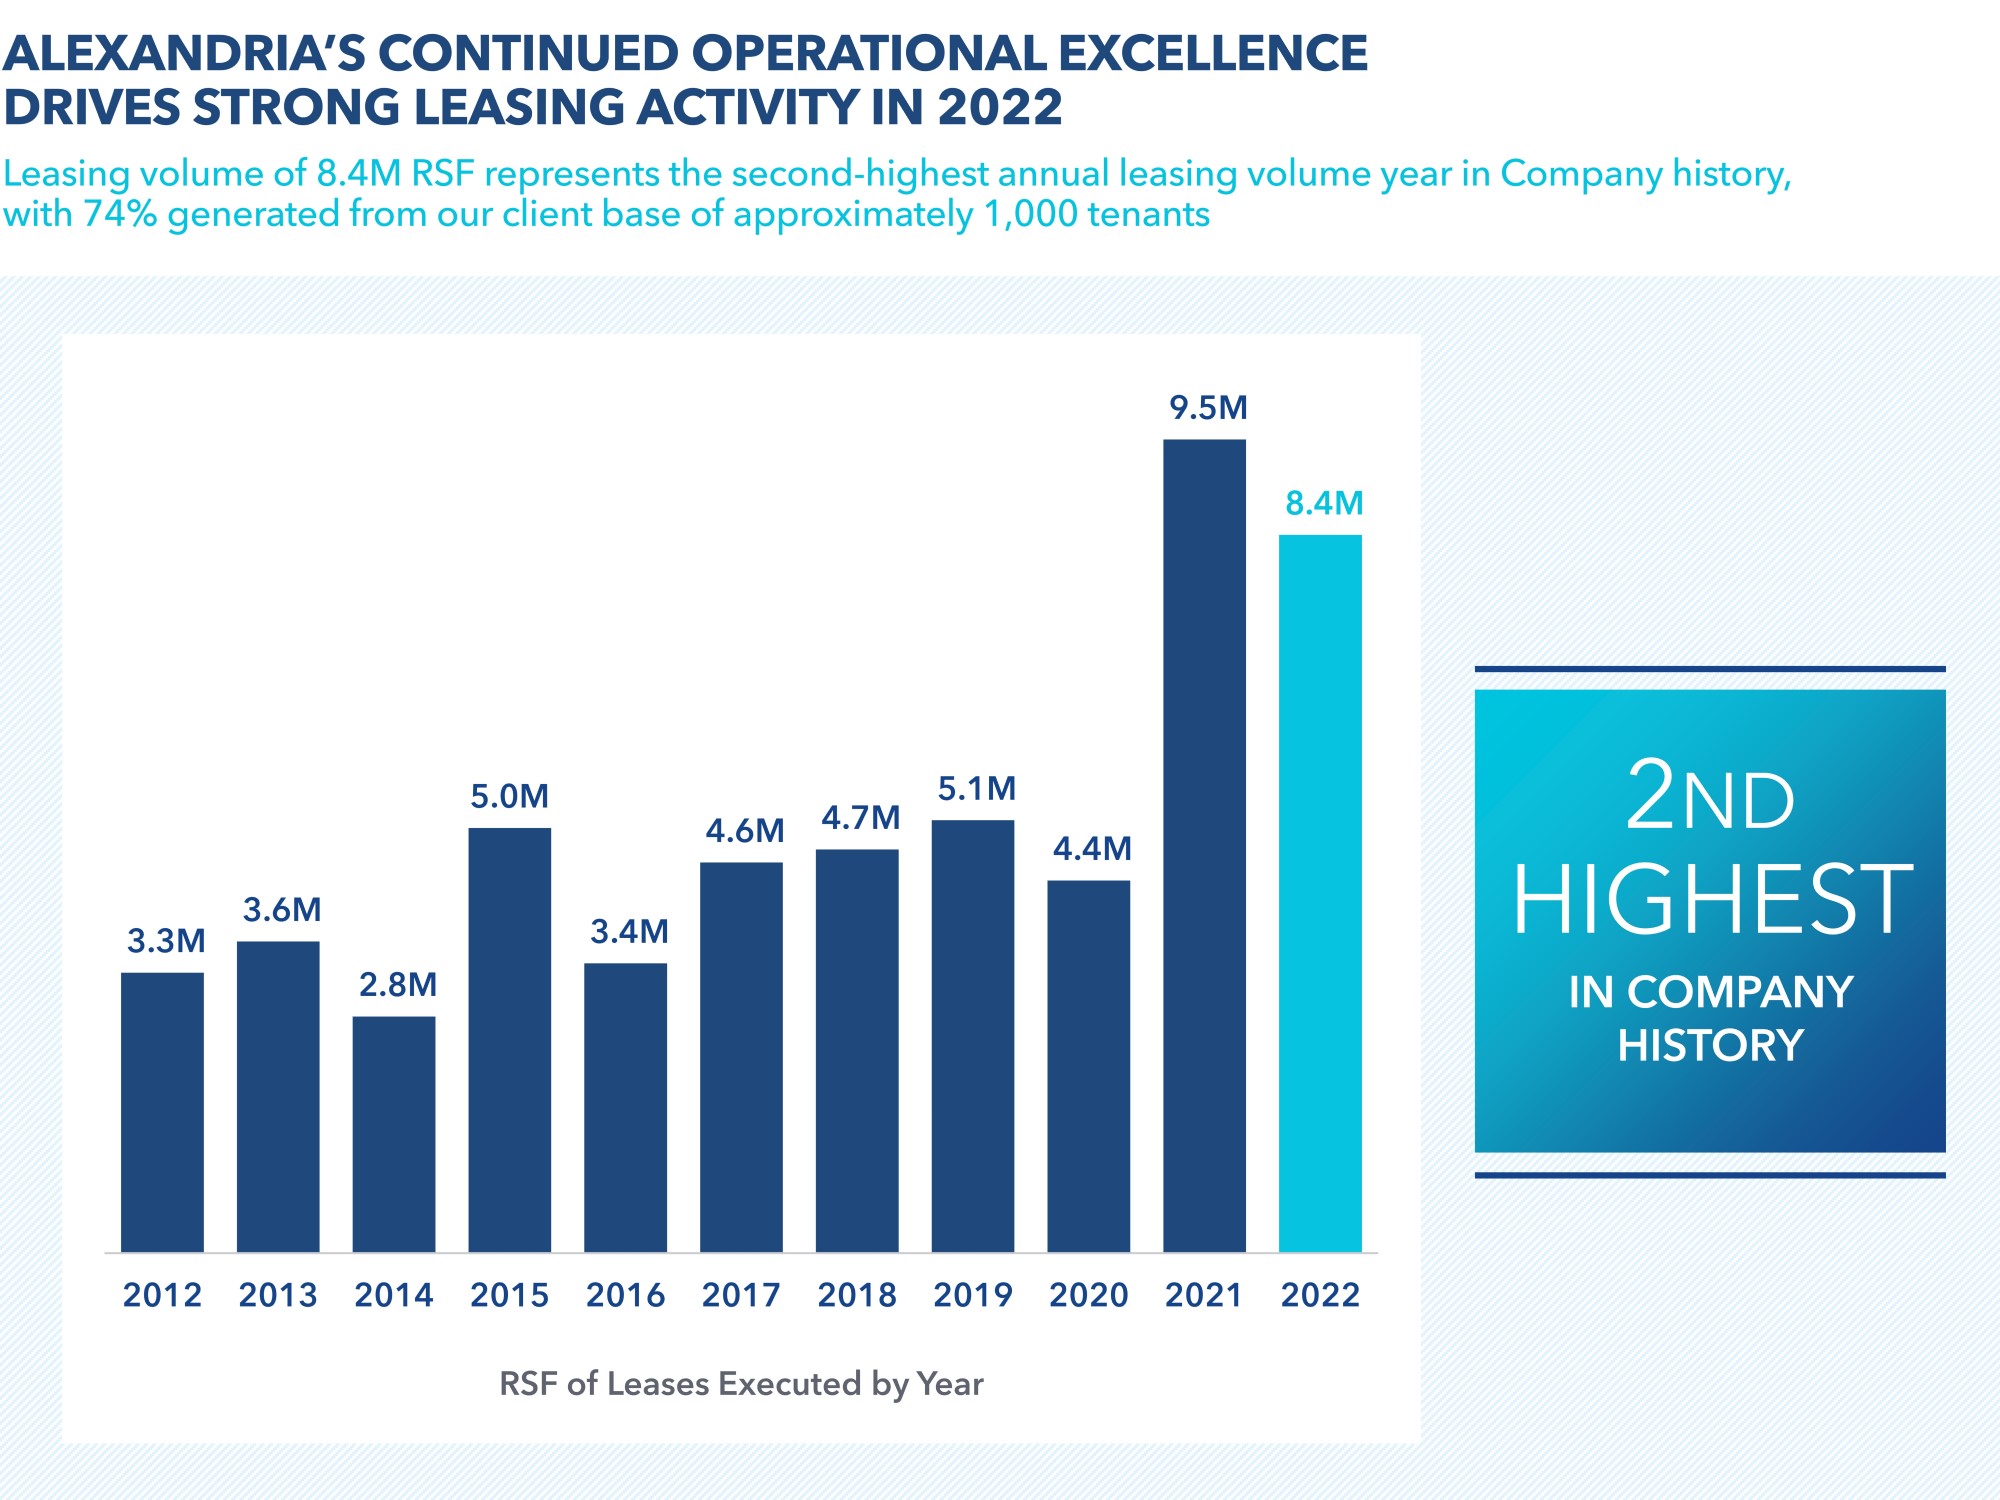][added: | $5.8B | | | | | | | | |  | | | | | | | | | | | |]
[removed: 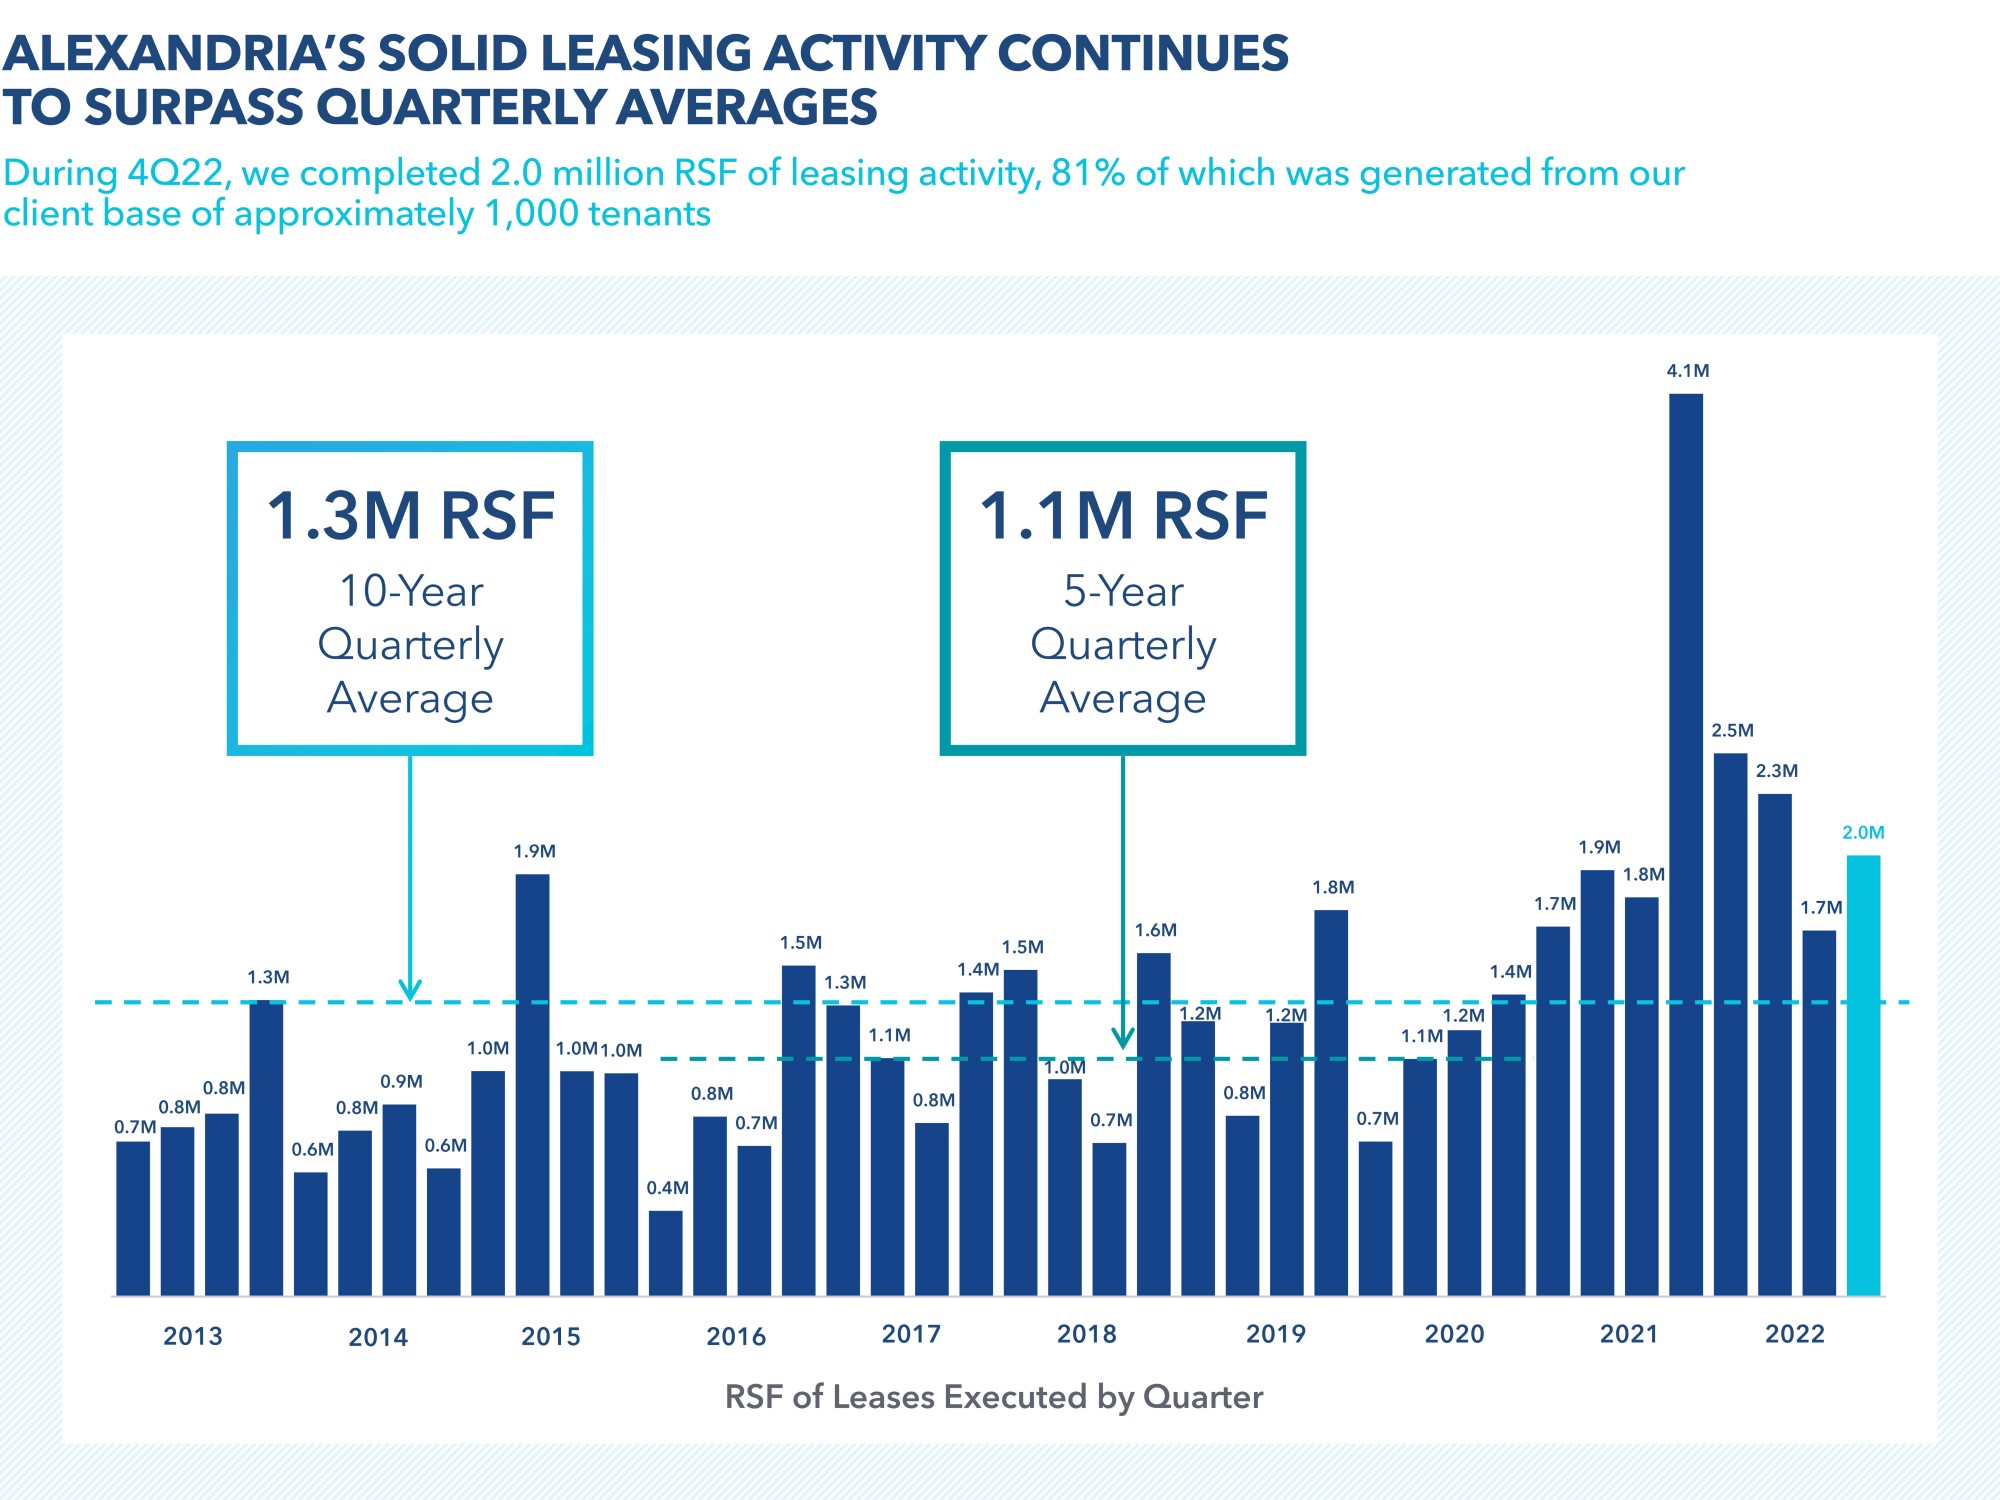][added: |  | | | | | | | | |  | | | | | | | | | | | | | | | | | | | | | | | |]
| | | | | | | [removed: 2022 | | | | | | 2021] [added: 2023] | | | | | | [added: 2022] | | | | | | [added: 2021] | | |
| *In millions* | | | | | | $ | [removed: 513.3] [added: 92.4] | | | | | $ | [removed: 563.4] [added: 513.3] | | | | | | | | | | | | | |
| *Per share* | | | | | | $ | [removed: 3.18] [added: 0.54] | | | | | $ | [removed: 3.82] [added: 3.18] | | | | | | | | | | | | | |
| *In millions* | | | | | | $ | [removed: 1,361.7] [added: 1,532.3] | | | | | $ | [removed: 1,144.9] [added: 1,361.7] | | | | | | | | | | | | | |
| *Per share* | | | | | | $ | [removed: 8.42] [added: 8.97] | | | | | $ | [removed: 7.76] [added: 8.42] | | | | | | | | | | | | | |
*An operationally excellent, industry-leading REIT with a [removed: high-quality] [added: high-quality, diverse] client base [removed: of approximately 1,000 tenants supporting high-quality] [added: to support growing] revenues, [added: stable] cash flows, and strong margins*
| Percentage of total annual rental revenue in effect from investment-grade or publicly traded large cap tenants [added: as of December 31, 2023] | | | | | | | | | [removed: 48] [added: 52] | | % | | | |
| [removed: Tenant] [added: Low tenant] receivables as of December 31, [removed: 2022] [added: 2023] | | | | | | | | | $ | [removed: 7.6] [added: 8.2] | | million | | |
| January [removed: 2023] [added: 2024] tenant [removed: rent] [added: rents] and receivables collected as of the date of this report | | | | | | | | | 99.4 | | % | | | |
| Occupancy of operating properties in North America [added: as of December 31, 2023] | | | | | | | | | [removed: 94.8] [added: 94.6] | | % | | | |
| Operating margin | | | | | | [added: 69%] | | | [removed: 70] | | [removed: %] | [removed: (1)] [added: 70%] | | |
| Adjusted EBITDA margin | | | | | | [added: 69%] | | | [removed: 69] | | [removed: %] | [removed: (1)] [added: 69%] | | | [added: | | | 69% | | | | | | 69% | | |]
| Weighted-average remaining lease [removed: term:] [added: term as of December 31, 2023:] | | | | | | | | | | | | | | |
| All tenants | | | | | | | | | [removed: 7.1] [added: 7.4] | | | years | | |
| Top 20 tenants | | | | | | | | | [removed: 9.4] [added: 9.6] | | | years | | |
[removed: (1)For] [added: (2)Represents percentages for] the three months ended December 31, [removed: 2022.][added: 2023.]
[removed: *Second-highest] [added: *Solid] annual leasing volume and rental rate increases [removed: (cash basis)*][added: with continued long lease terms*]
[removed: - Rental] [added: Excluding this lease, the rental] rate increase [removed: (cash basis) of 22.1%] on [removed: lease] renewals and re-leasing of space [removed: represents the second highest rental rate growth] [added: was 32.4% and 17.0%] (cash basis) [removed: in Company history.][added: for 2023.]
| | | | | | | [added: 2023 | | | | | |] 2022 | | | | | | [added: | | | | | | | | |]
| Total leasing activity – RSF | | | | | | [removed: 8,405,587] [added: 4,306,072] | | | | | |
| Leasing of development and redevelopment space – RSF | | | | | | [removed: 2,828,539] [added: 596,533] | | | | | |
| RSF (included in total leasing activity above) | | | | | | [removed: 4,540,325] [added: 3,046,386] | | | | | |
| Rental rate increases | | | | | | [removed: 31.0%] [added: 11.0%] | | | | | | [added: 19.0% | | | | | |]
| Rental rate increases (cash basis) | | | | | | [removed: 22.1%] [added: 5.0%] | | | | | | [added: 13.0% | | | | | |]
*Continued [removed: strong] [added: solid] net operating income and internal [removed: growth, including highest annual same property growth in Company history*][added: growth*]
- Total revenues of [removed: $2.6] [added: $2.9] billion, up [removed: 22.5%,] [added: 11.5%,] for the year ended December 31, [removed: 2022,] [added: 2023,] compared to [removed: $2.1] [added: $2.6] billion for the year ended December 31, [removed: 2021.][added: 2022.]
- Net operating income (cash basis) of [removed: $1.6] [added: $1.8] billion for the year ended December 31, [removed: 2022, increased by $292.8] [added: 2023, up $185.8] million, or [removed: 22.2%,] [added: 11.5%,] compared to the year ended December 31, [removed: 2021.][added: 2022.]
- Same property net operating income growth of [removed: 6.6%] [added: 3.4%] and [removed: 9.6%] [added: 4.6%] (cash basis) for the year ended December 31, [removed: 2022,] [added: 2023,] compared to the year ended December 31, [removed: 2021, with both increases representing the highest growth in Company history.][added: 2022.]
| Percentage of total annual rental revenue in effect from mega campuses as of December 31, 2023 | | | | | | | | | 75 | | % | | | |
| Tenant rents and receivables for the three months ended December 31, 2023 collected as of the date of this report | | | | | | | | | 99.9 | | % | | | |
- Solid leasing volume aggregating 4.3 million RSF for the year ended December 31, 2023.
- Weighted-average lease term of 11.3 years for the year ended December 31, 2023, above our historically long weighted-average lease term of 8.8 years over the last 10 years.
- 76% of our leasing activity during the last twelve months was generated from our existing tenant base.
| | | | | | | 2023 | | | | | |
| Rental rate increase | | | | | | 29.4% | | | (1) | | |
(1)Includes the re-lease of 99,557 RSF to Cargo Therapeutics at 835 Industrial at a 4.1% decline in the cash rental rate compared with the rate from the former tenant that was less than three years into a 10-year lease.
- Significant net cash flows from operating activities after dividends retained for reinvestment aggregating $1.9 million for the years ended December 31, 2019 through 2023.
*Execution of our value harvesting and asset recycling 2023 self-funding strategy*
Our 2023 capital plan included $1.4 billion in funding primarily from dispositions and partial interest sales, of which $439.0 million was completed during the three months ended December 31, 2023, and focused on the enhancement of our asset base through the following (in millions):
| | | | | | | Completed in 2023 | | |
| Value harvesting dispositions of 100% interest in properties not integral to our mega campus strategy | | | | | | $ | 1,042 | |
| Strategic dispositions and partial interest sales | | | | | | 273 | | |
| Proceeds of forward equity sales agreements entered into during 2022 and settled during the three months ended December 31, 2023 | | | | | | 104 | | |
| Total | | | | | | $ | 1,419 | |
In January 2024, our existing ATM program became inactive upon expiration of the associated shelf registration.
We expect to file a new shelf registration and ATM program in the near future.
*Alexandria’s highly leased value-creation pipeline delivered the highest incremental annual net operating income in Company history of $145 million and $265 million, commencing during the three months and year ended December 31, 2023, respectively, and drives future incremental annual net operating income aggregating $495 million*
Deliveries during the three months ended December 31, 2023 include:
- Accelerated delivery of 462,100 RSF at 325 Binney Street in our Cambridge submarket, which is 100% leased to Moderna, Inc.;
- 345,996 RSF at 15 Necco Street in our Seaport Innovation District submarket, which is 97% leased to Eli Lilly and Company;
- 278,282 RSF at 1150 Eastlake Avenue East, a multi-tenant building, in our Lake Union submarket, which is 100% leased; and
- 88,038 RSF at 6040 George Watts Hill Drive in our Research Triangle submarket, which is 100% leased to FUJIFILM Diosynth Biotechnologies.
Initial free rent has a weighted-average burn-off period of 10 months.
- 66% of RSF in our value-creation pipeline is within our mega campuses.
| *(dollars in millions)* | | | | | | Incremental Annual Net Operating Income | | | | | | RSF | | | | | | Leased/Negotiating Percentage | | | | | |
| Placed into service: | | | | | | | | | | | | | | | | | | | | | | | |
| Nine months ended September 30, 2023 | | | | | | $ | 120 | | | | | 1,290,721 | | | | | | 100% | | | | | |
| Three months ended December 31, 2023 | | | | | | 145 | | | | | | 1,228,604 | | | | | | 99 | | | | | |
| Total placed into service in 2023 | | | | | | $ | 265 | | | | | 2,519,325 | | | | | | 100% | | | | | |
| Expected to be placed into service(1): | | | | | | | | | | | | | | | | | | | | | | | |
| Fiscal year 2024 | | | | | | $ | 149 | | (2) | | | 5,697,062 | | | | | | 60%(3) | | | | | |
| Fiscal year 2025 | | | | | | 146 | | | | | | | | | | | | | | | | | |
| First quarter of 2026 through fourth quarter of 2027 | | | | | | 200 | | | | | | | | | | | | | | | | | |
| | | | | | | $ | 495 | | | | | | | | | | | | | | | | |
(1)Represents expected incremental annual net operating income to be placed into service, including partial deliveries that stabilize in future years.
(2)Includes 1.4 million RSF expected to be stabilized in 2024 and is 93% leased.
Refer to the initial and stabilized occupancy years in the “New Class A/A+ development and redevelopment properties: current projects” section under Item 2 in this annual report on Form 10-K for additional information.
Trends that may affect our future results
Sources: Bloomberg and S&P Global Market Intelligence.
Assumes reinvestment of dividends.
(1)Alexandria’s IPO priced at $20.00 per share on May 27, 1997.
(2)Represents the FTSE Nareit Equity Office Index.
As of December 31, 2022.
(2)Represents annual rental revenue currently generated from space that is targeted for a future change in use, including 1.1% of total annual rental revenue that is generated from covered land play projects.
The weighted-average remaining term of these leases is 5.2 years.
(3)Our other tenants, which aggregate 2.0% of our annual rental revenue, comprise technology, professional services, finance, telecommunications, and construction/real estate companies and less than 1.0% of retail-related tenants by annual rental revenue.
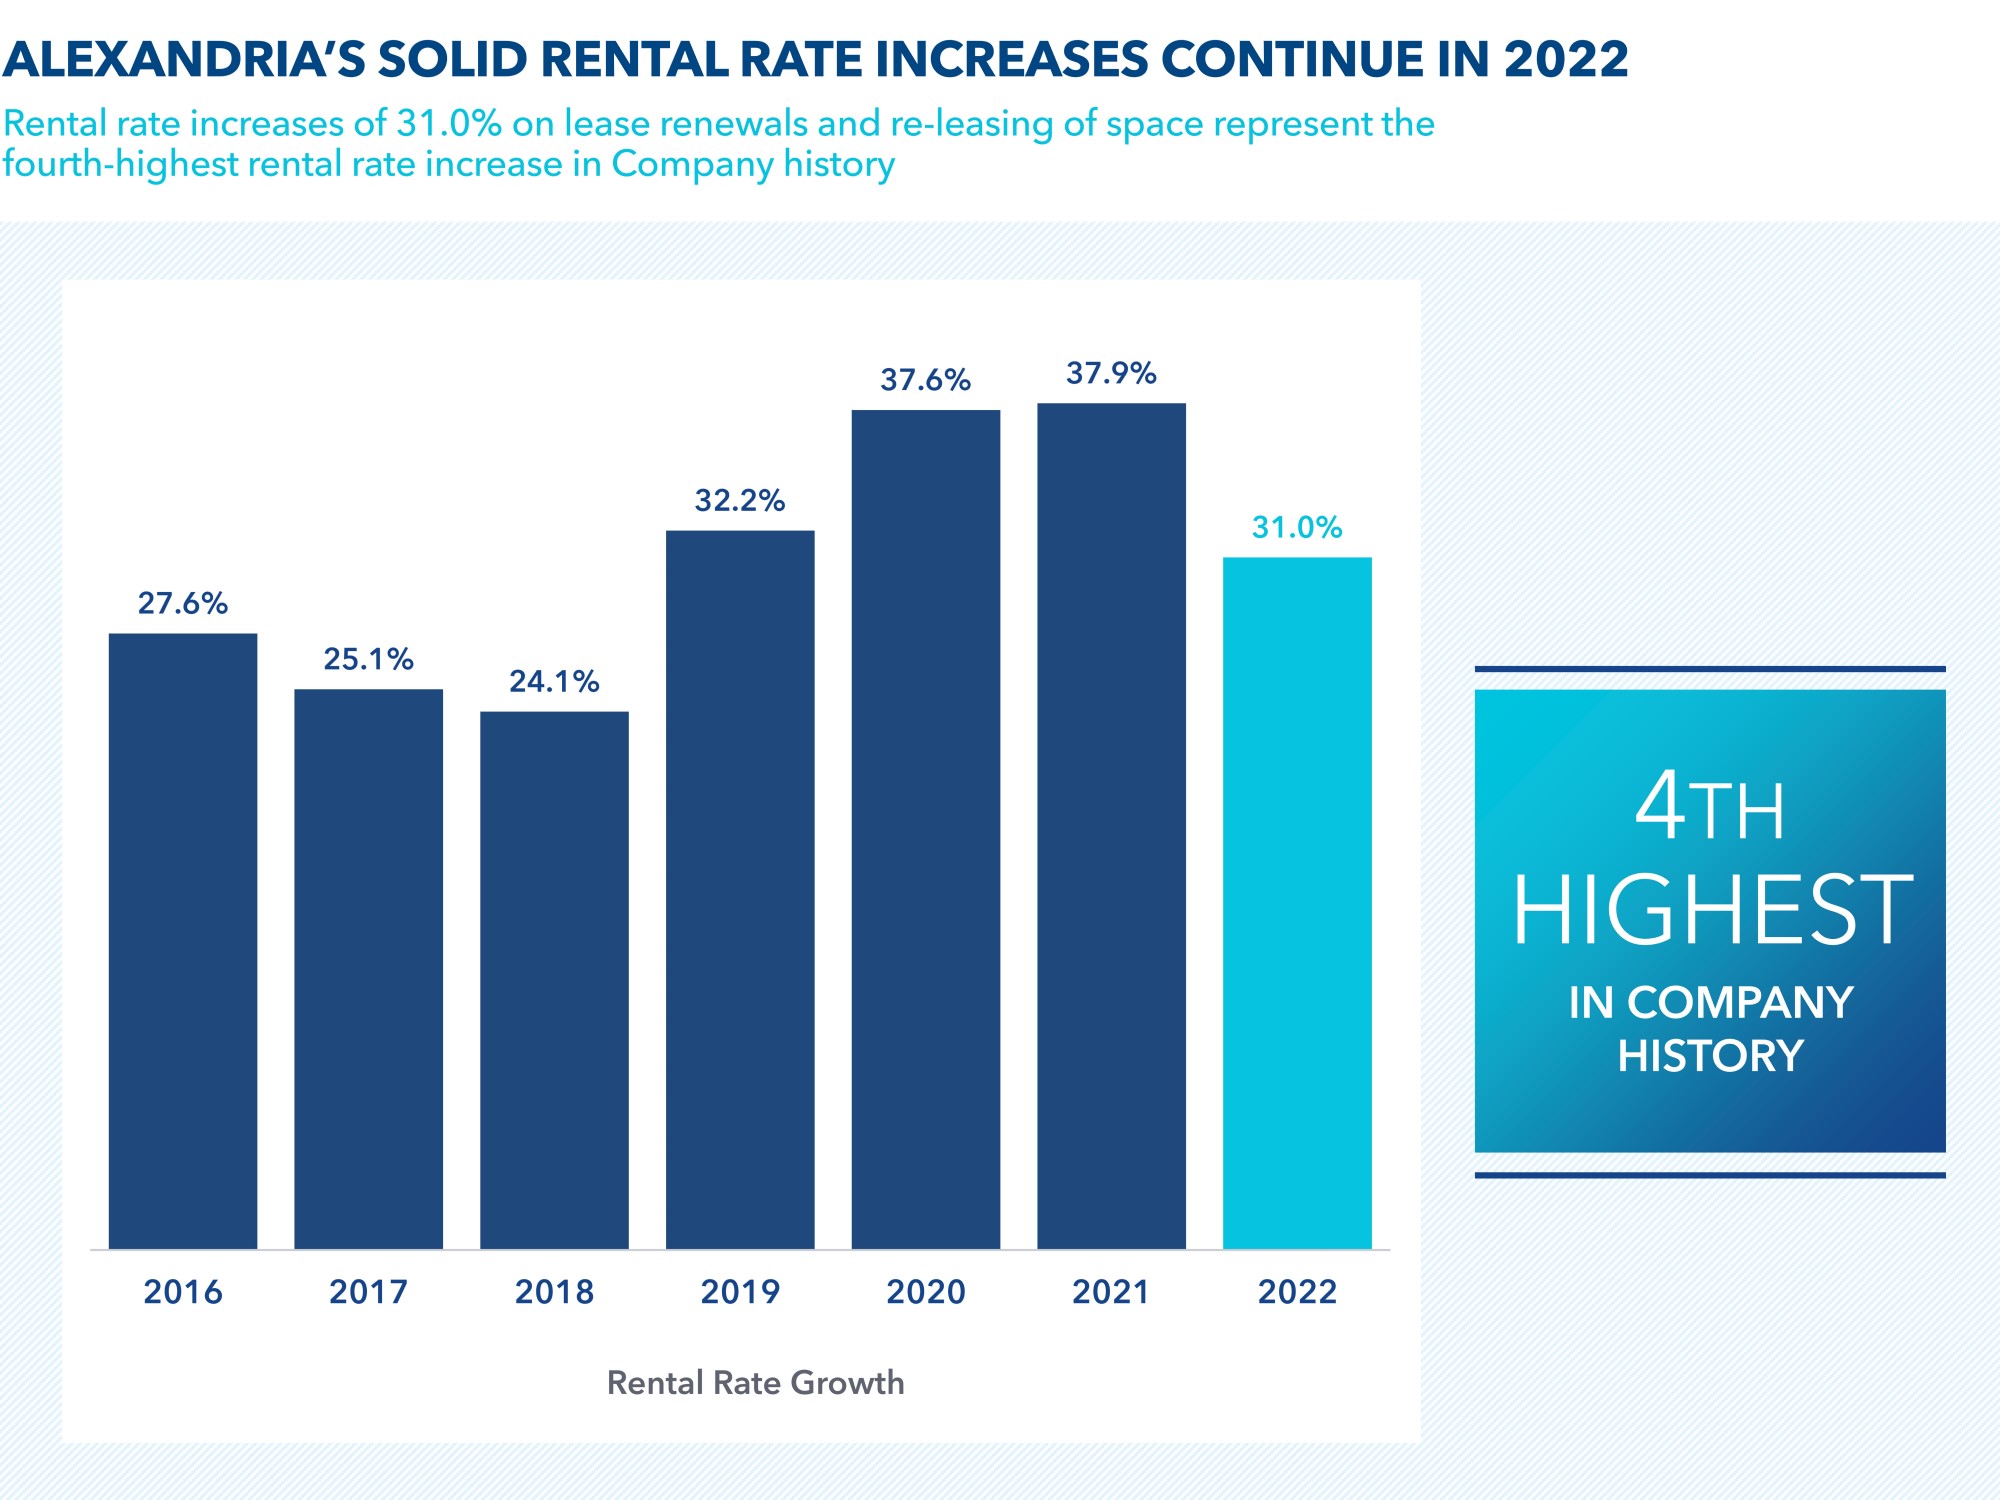
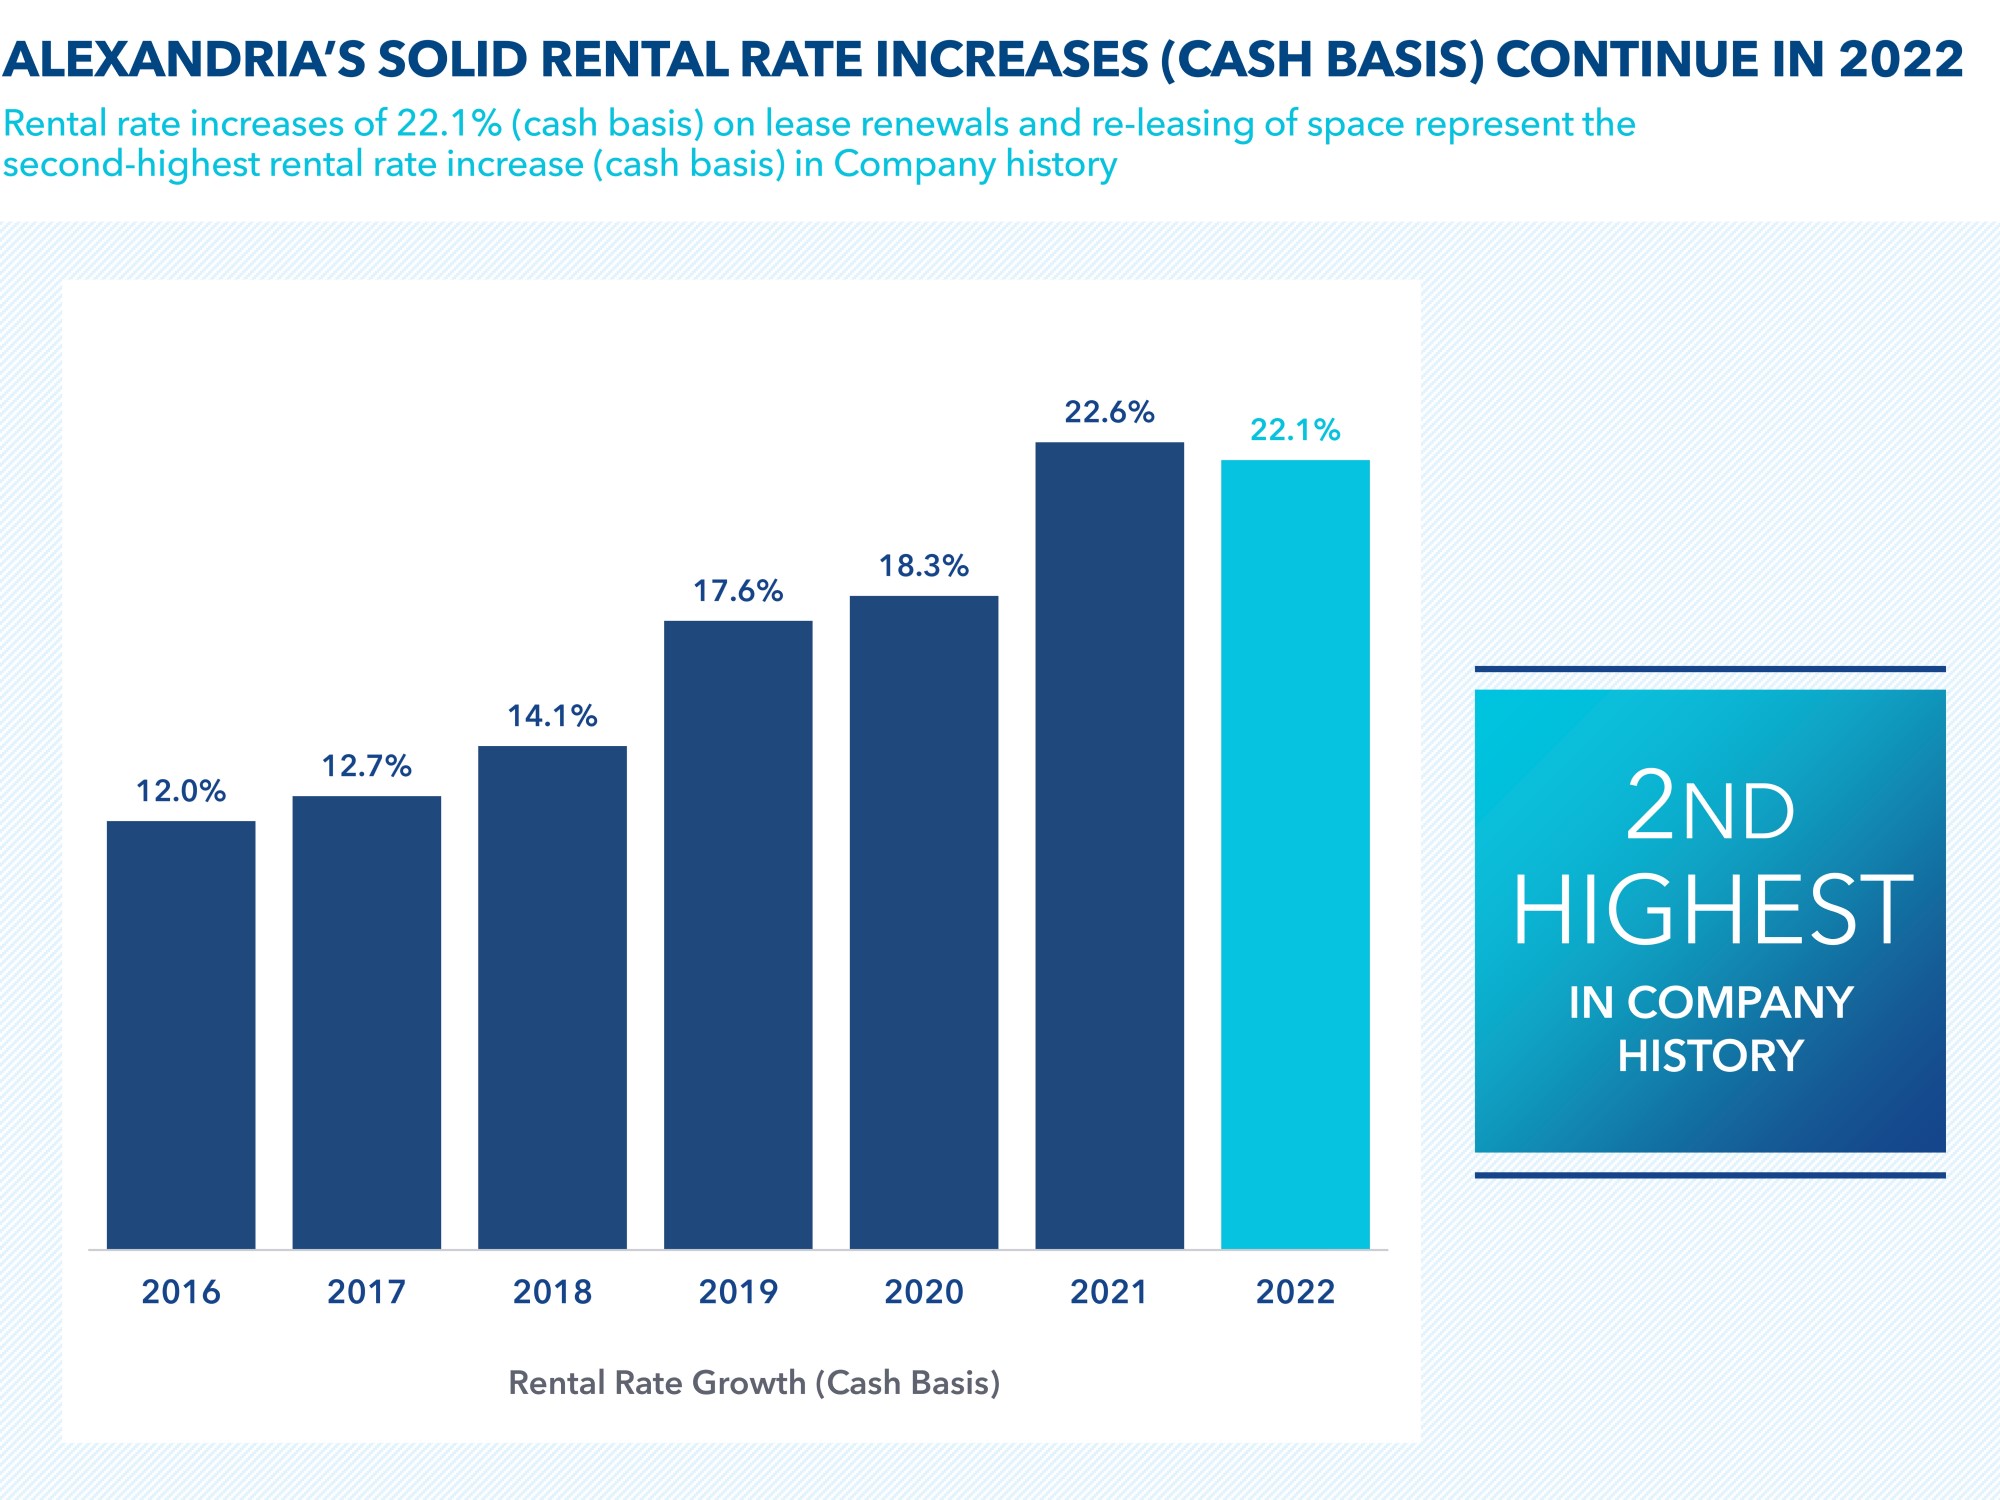
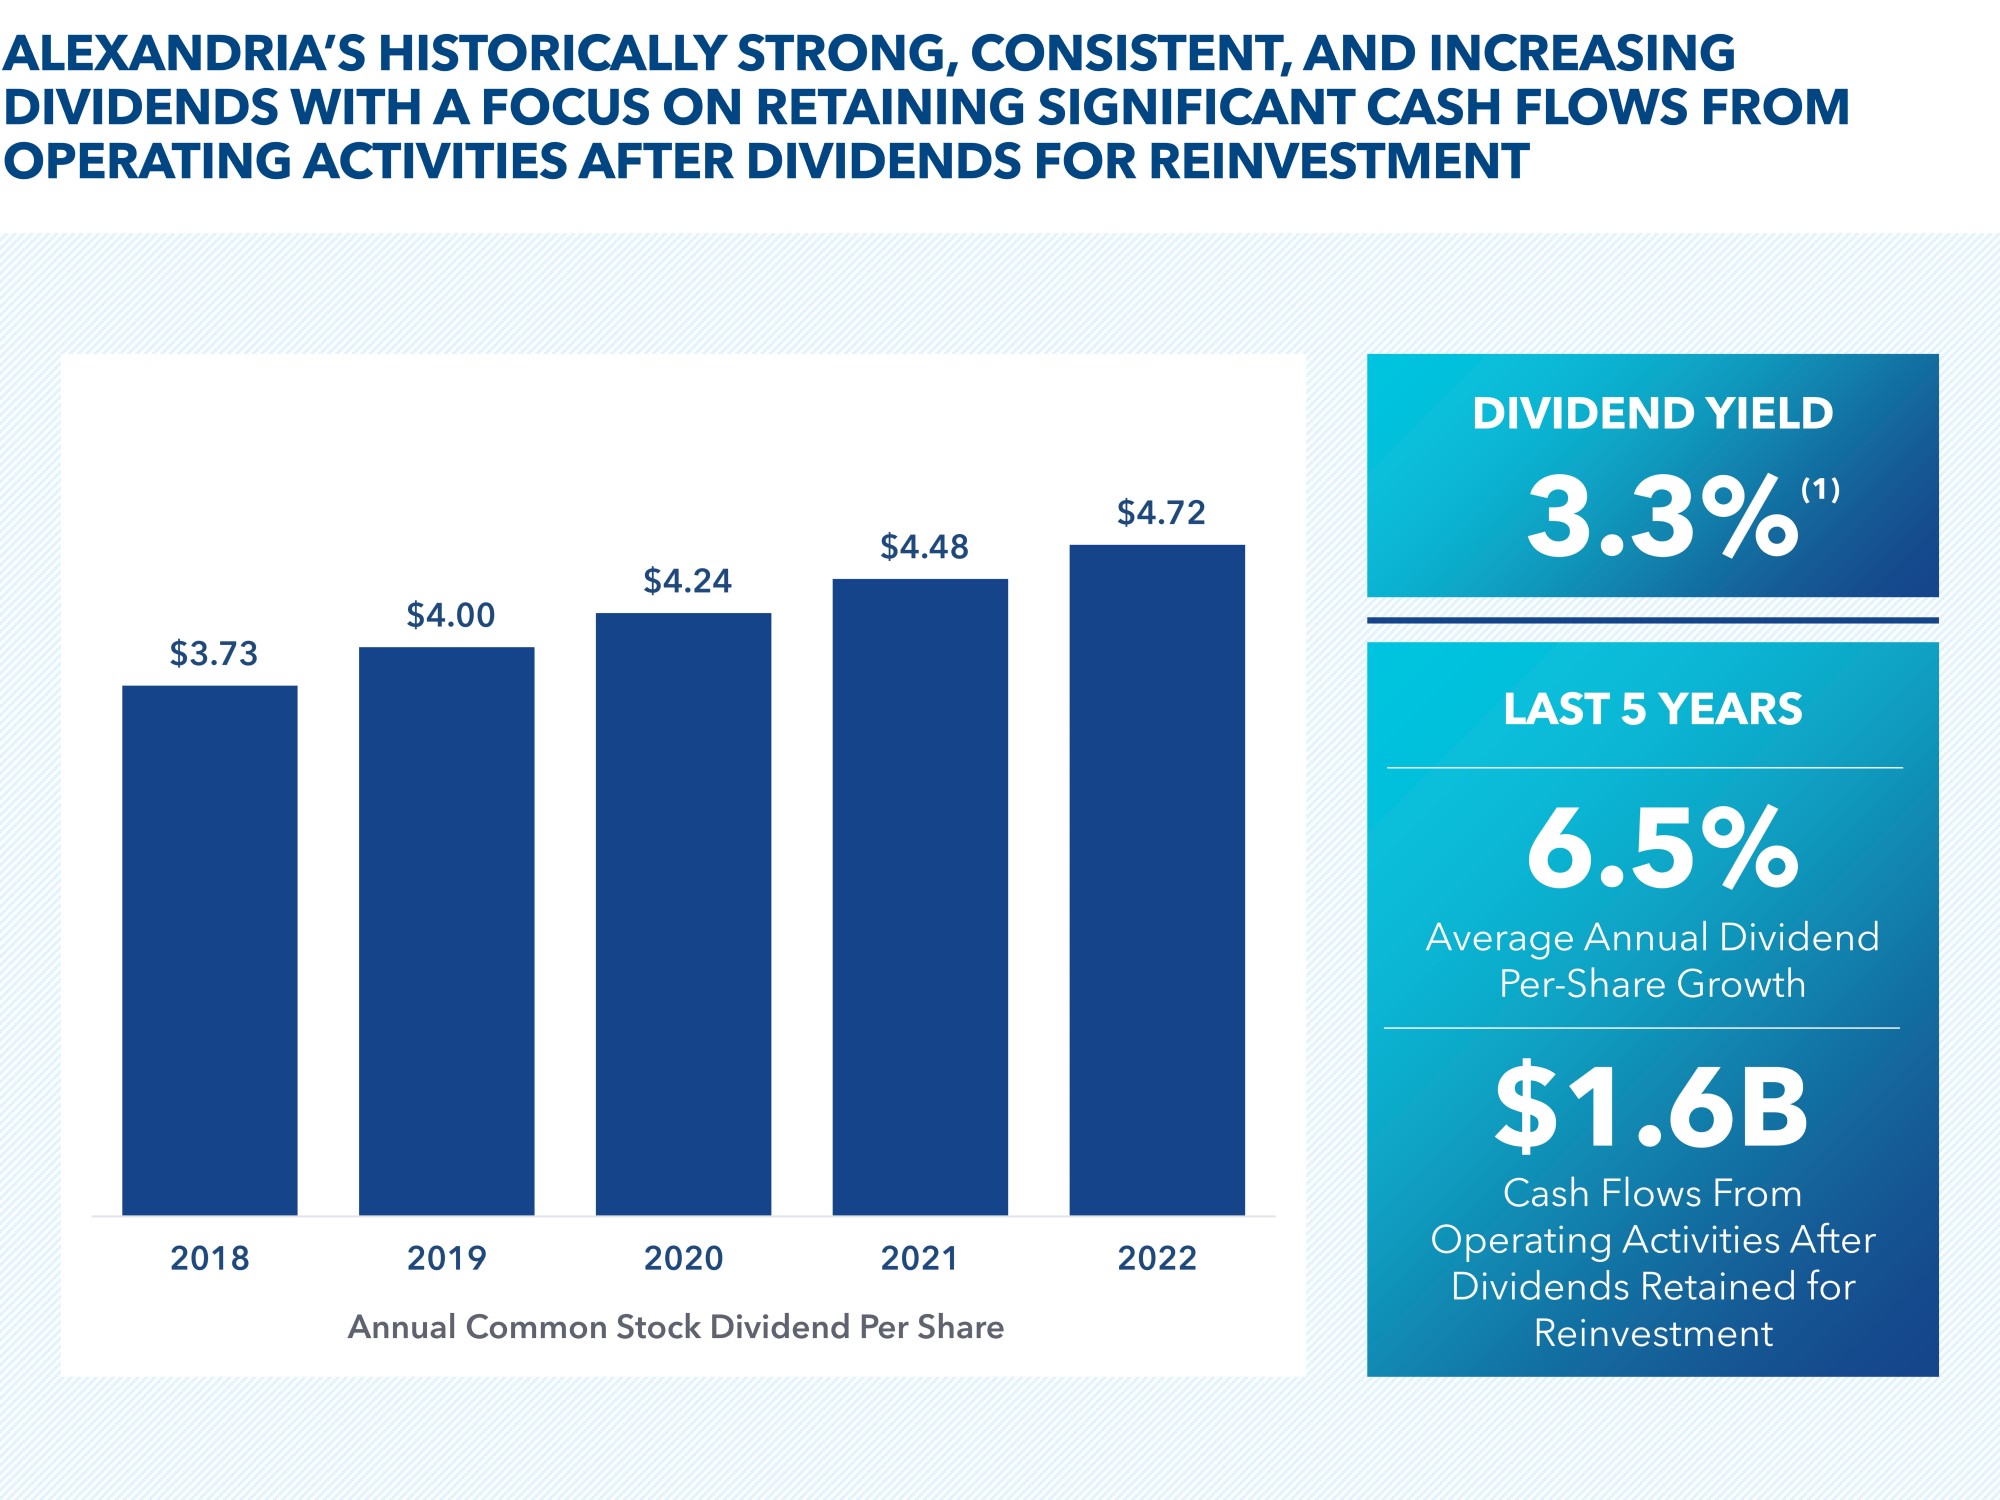
(1)Based on the closing price of common stock as of December 31, 2022 of $145.67 and the common stock dividend declared for the three months ended December 31, 2022 of $1.21 annualized.
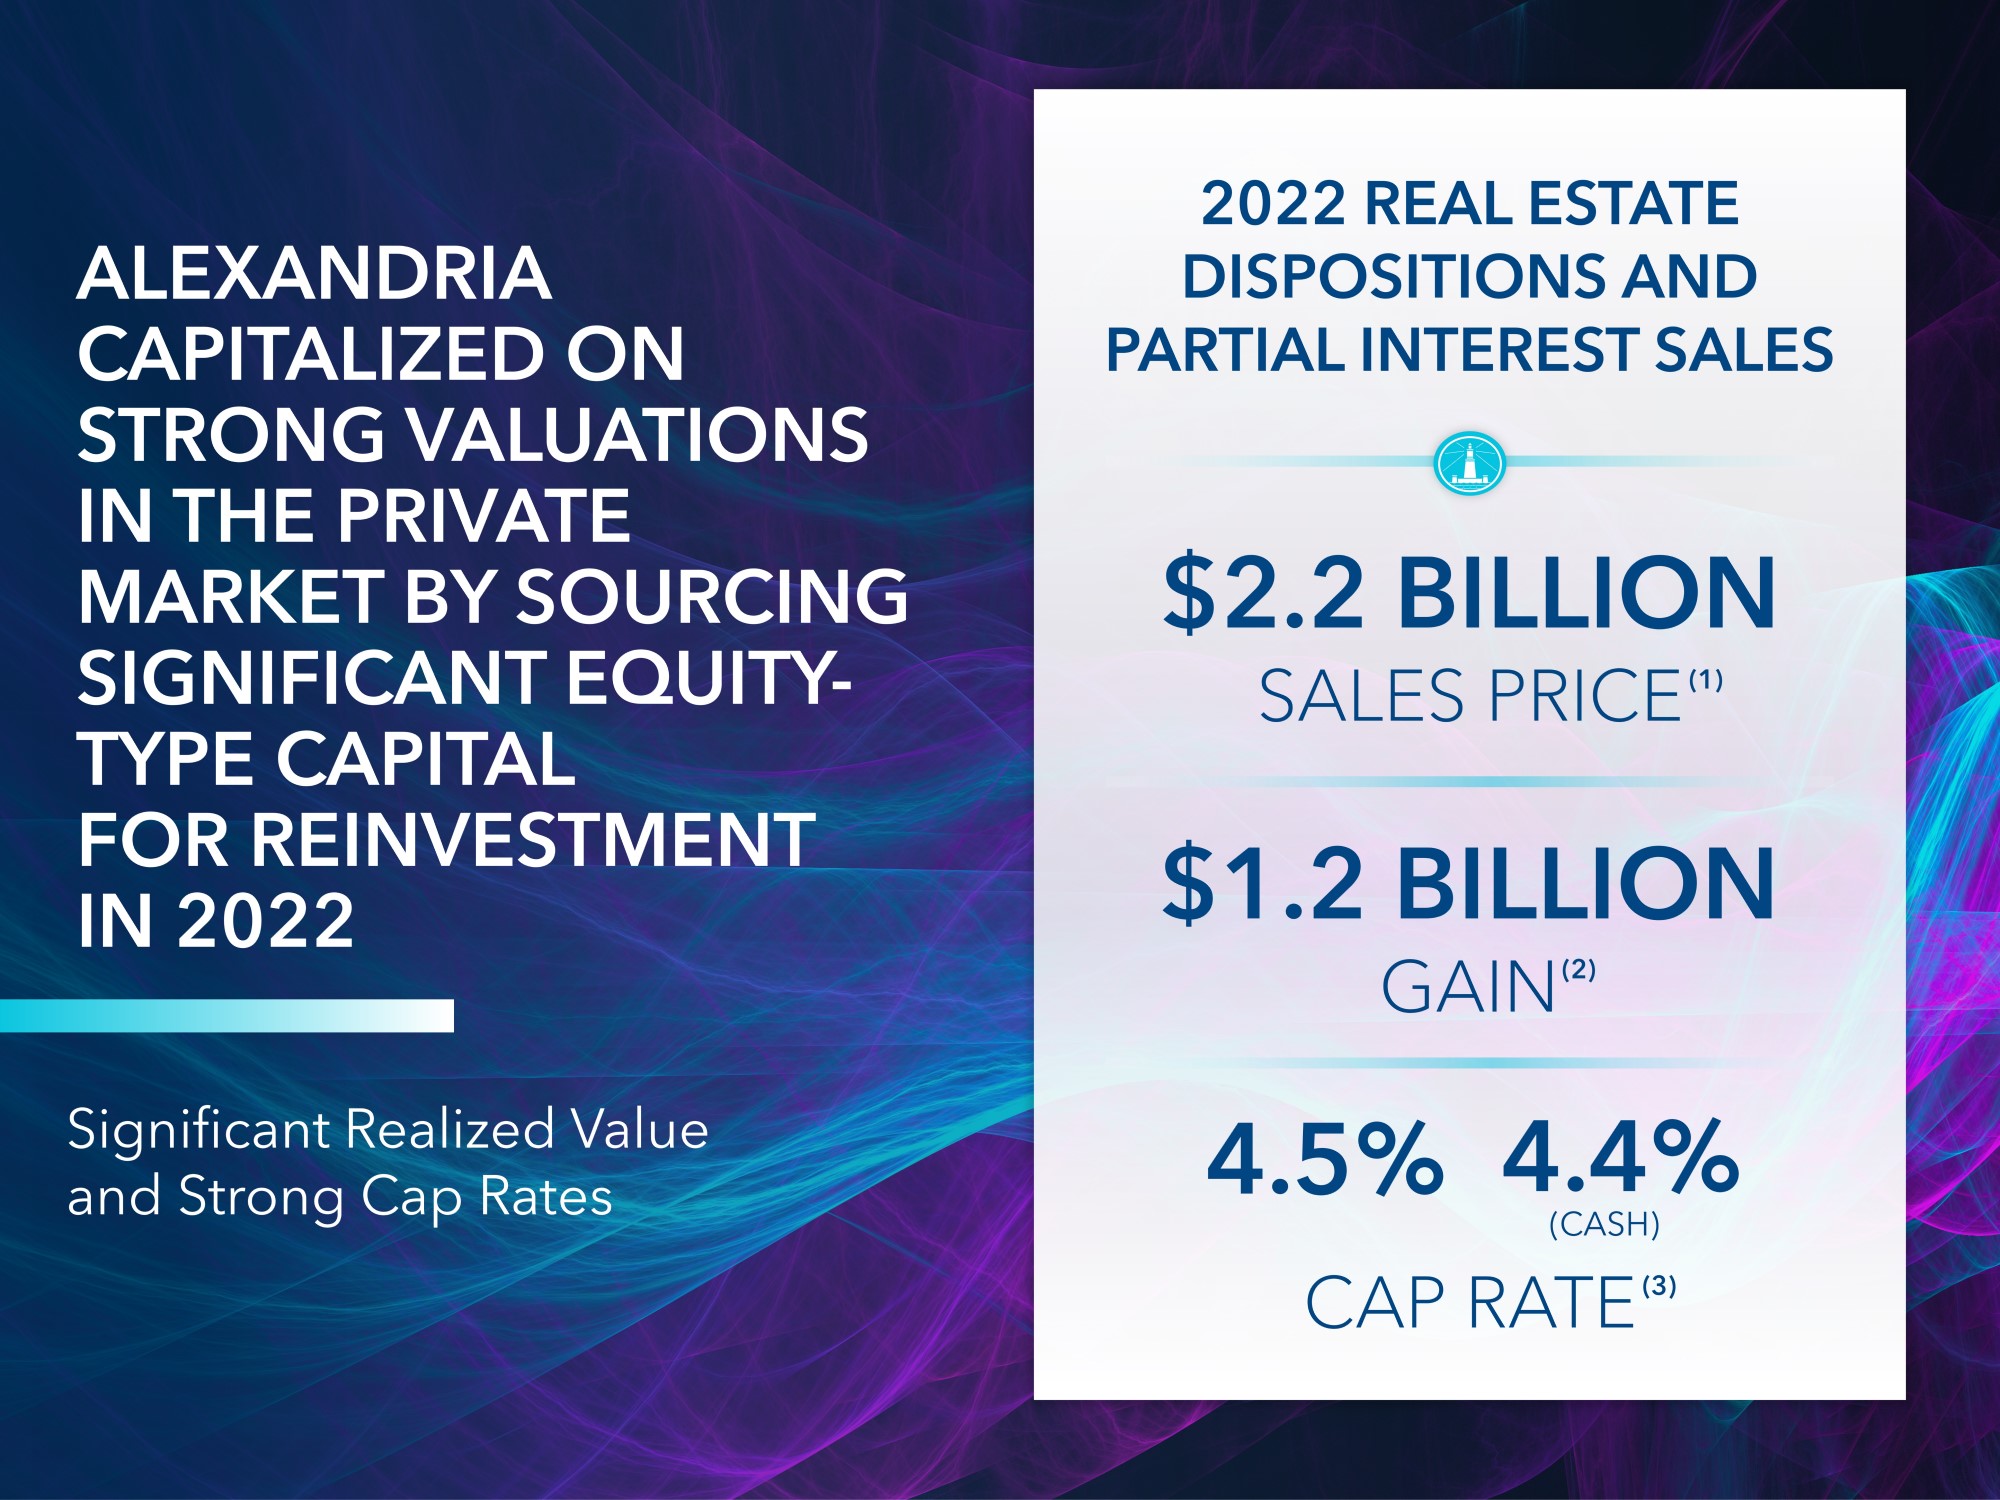
(1)Includes initial proceeds from our joint venture partners’ contribution toward construction projects.
(2)Represents the aggregate gain and consideration in excess of book value recognized on dispositions and partial interest sales, respectively.
(3)Represents the weighted-average capitalization rates for stabilized operating assets.
Refer to “Net operating income” in the “Non-GAAP measures and definitions” section within this Item 7 for additional details and its reconciliation from the most directly comparable financial measures presented in accordance with GAAP.
(1)As of December 31, 2022.
Represents projects under construction aggregating 5.6 million RSF and seven near-term projects aggregating 2.0 million RSF expected to commence construction during the next four quarters.
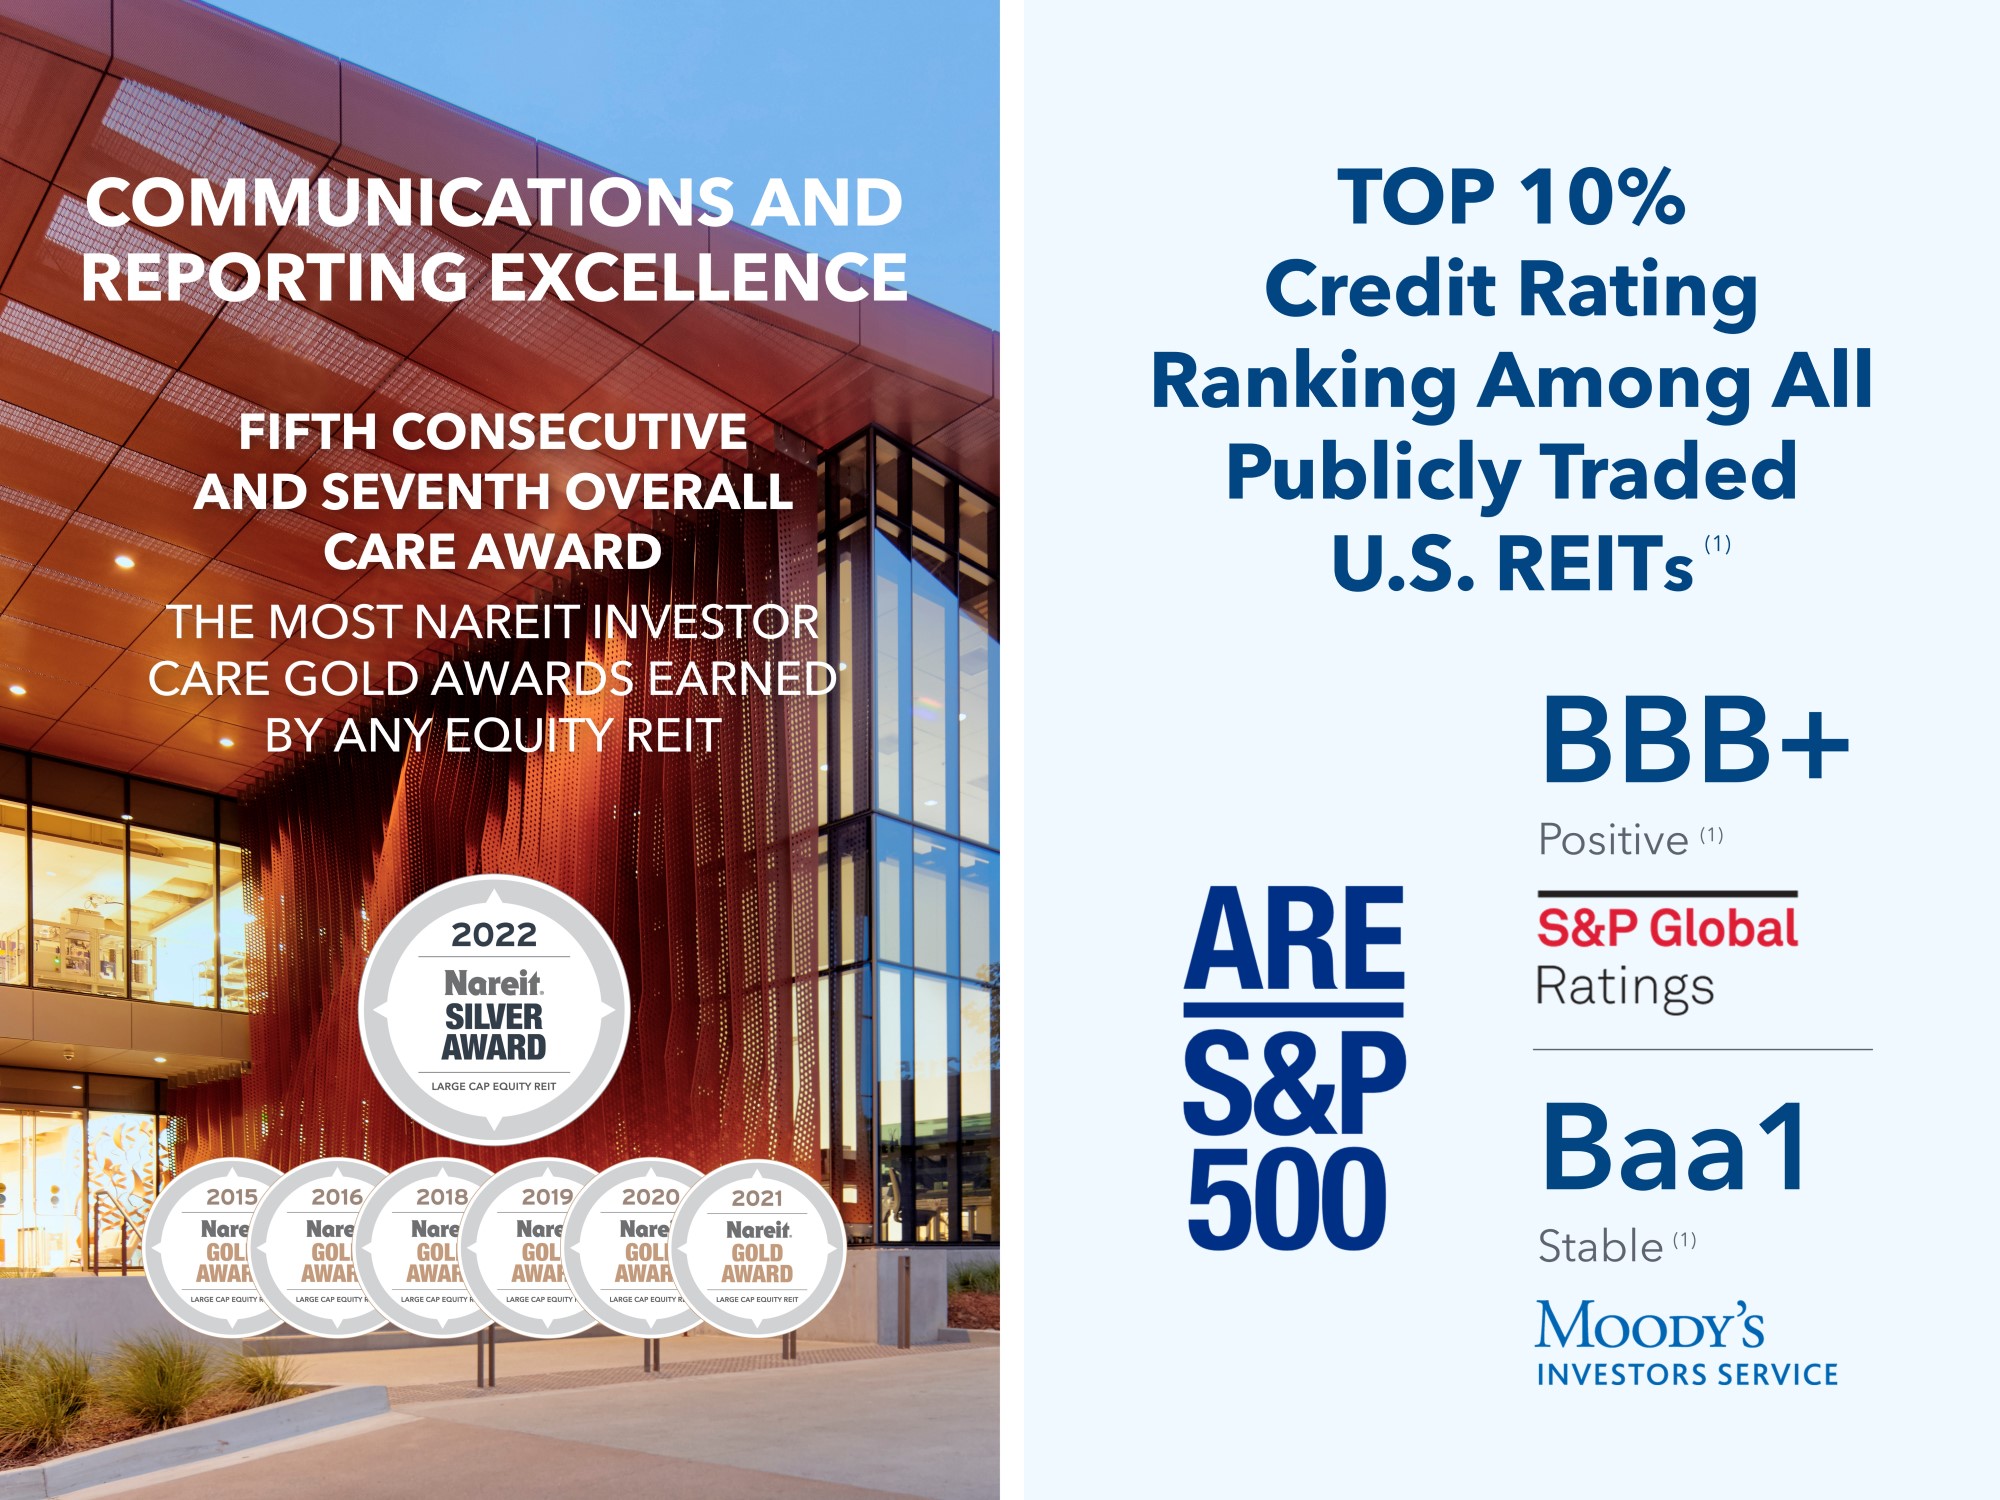
(1)A credit rating is not a recommendation to buy, sell, or hold securities and may be subject to revision or withdrawal at any time.
Top 10% ranking represents credit rating levels from Moody’s Investors Service and S&P Global Ratings for publicly traded U.S. REITs, from Bloomberg Professional Services as of December 31, 2022.
The operating results shown above include certain items related to corporate-level investing and financing decisions.
*•*Annual leasing volume of 8.4 million RSF in 2022 represents the second highest in Company history, with 74% generated from our client base of approximately 1,000 tenants.
| | | | | | | | | | | | |
| --- | --- | --- | --- | --- | --- | --- | --- | --- | --- | --- | --- |
- Our 2022 same property growth outperformed our 10-year averages of 3.6% and 6.7% (cash basis) as a result of an increase in same property occupancy of 100 bps and early lease renewals that commenced in late 2021/early 2022.
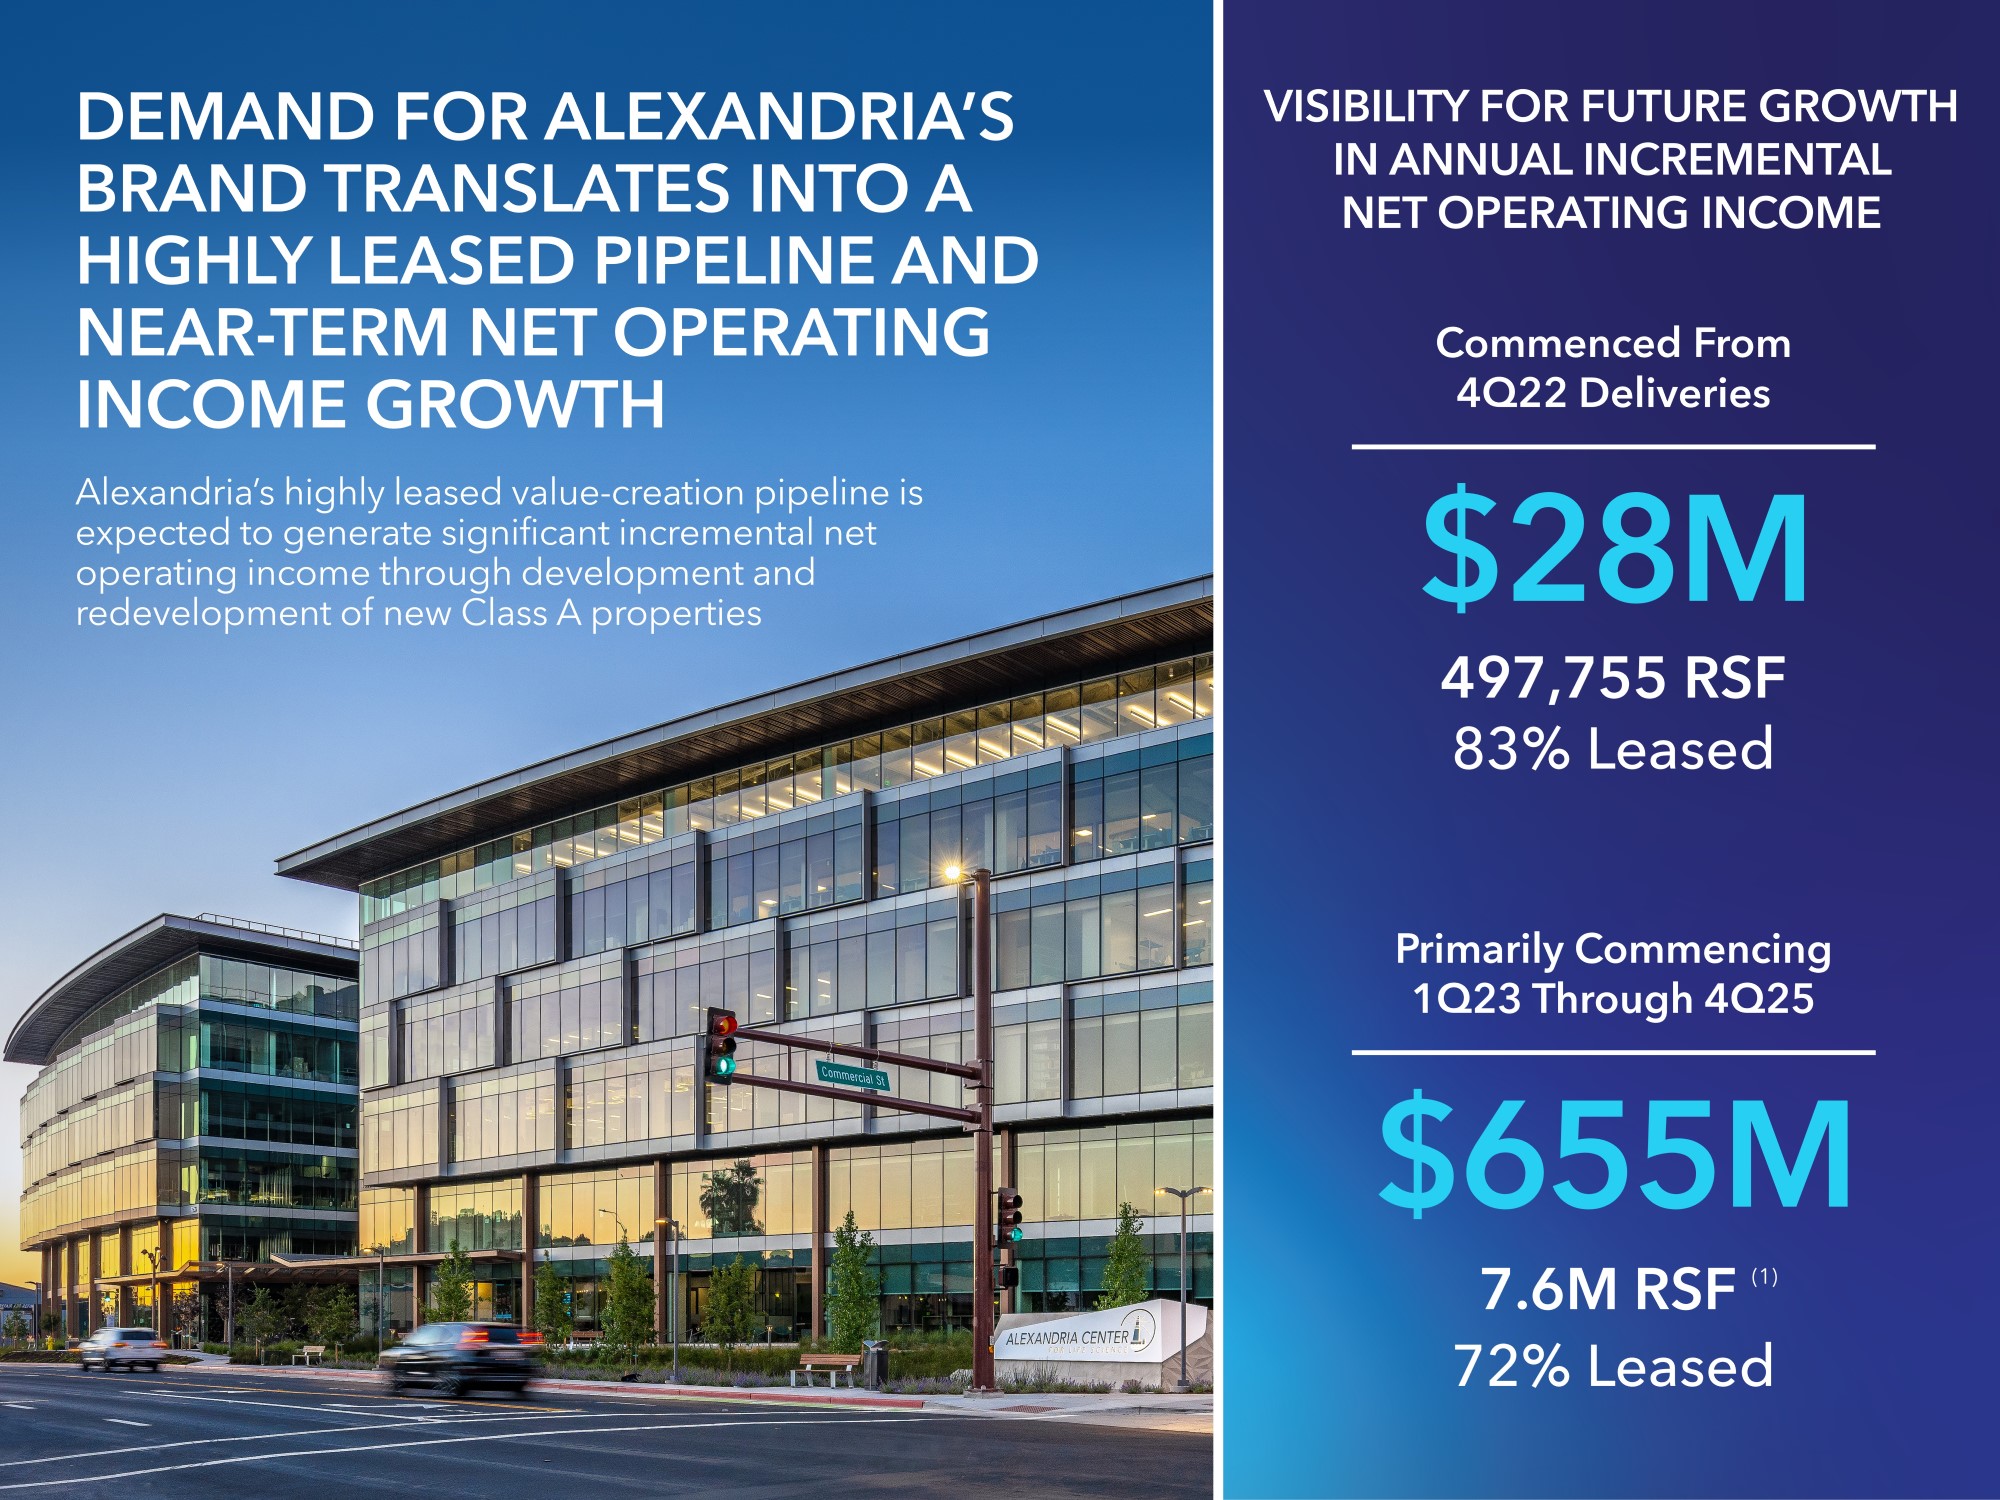
*Alexandria’s value-creation pipeline drives visibility for future growth aggregating over $655 million of incremental net operating income*
- Highly leased value-creation pipeline of current and seven near-term projects expected to generate greater than $655 million of incremental net operating income, primarily commencing from the first quarter of 2023 through the fourth quarter of 2025.
- 7.6 million RSF of value-creation projects, which are 72% leased.
*Delivery and commencement of value-creation projects*
- Commenced two development projects aggregating 467,567 RSF during the three months ended December 31, 2022, including 212,796 RSF at 1450 Owens Street in our Mission Bay submarket, which will be 100% funded by our joint venture partner, and 254,771 RSF at 10075 Barnes Canyon Road in our Sorrento Mesa submarket, which will be 50% funded by our joint venture partner.
| Under construction projects 68% leased/negotiating | | | | | | | | | 10% | | | | | | | | | | | | | | |
*•*81% of construction costs related to active development and redevelopment projects aggregating 5.6 million RSF are under a guaranteed maximum price (“GMP”) contract or other fixed contracts.
Our budgets also include construction cost contingencies in GMP contracts plus additional landlord contingencies that generally range from 3% to 5%.
*Alexandria is at the vanguard of innovation for a high-quality client base of approximately 1,000 tenants, focused on accommodating their current needs and providing them with a path for future growth*
- During the year ended December 31, 2022, we completed acquisitions in our key life science cluster submarkets aggregating 10.2 million SF, which comprise 9.5 million RSF of value-creation opportunities and 0.7 million RSF of operating space, for an aggregate purchase price of $2.8 billion.
An excerpt. Shown here: 40 of 580 rewritten, 40 of 488 added and 40 of 444 removed. The counts are complete. For every sentence, read Item 7. MANAGEMENT’S DISCUSSION AND ANALYSIS OF FINANCIAL CONDITION AND RESULTS OF OPERATIONS in the FY2023 filing and the FY2022 filing.
Item 7A. QUANTITATIVE AND QUALITATIVE DISCLOSURES ABOUT MARKET RISK
16 rewritten, 3 added, 1 removed, 37 unchanged
As of December 31, [removed: 2022,] [added: 2023,] we did not have any outstanding interest rate hedge agreements.
The following tables illustrate the effect of a 1% change in interest rates, assuming a zero percent interest rate floor, on our fixed- and variable-rate debt as of December 31, [removed: 2022] [added: 2023] and [removed: 2021] [added: 2022] (in thousands):
| Rate increase of 1% | | | $ | [removed: (597)] [added: (339)] | | | | | $ | [removed: (527)] [added: (597)] | |
| Rate decrease of 1% | | | $ | [removed: 597] [added: 339] | | | | | $ | [removed: 106] [added: 597] | |
| Rate increase of 1% | | | $ | [removed: (668,639)] [added: (742,460)] | | | | | $ | [removed: (811,028)] [added: (668,639)] | |
| Rate decrease of 1% | | | $ | [removed: 759,638] [added: 847,335] | | | | | $ | [removed: 944,392] [added: 759,638] | |
These amounts are determined by considering the effect of the hypothetical interest rates on our borrowings as of December 31, [removed: 2022] [added: 2023] and [removed: 2021,] [added: 2022,] respectively.
The following table illustrates the effect that a 10% change in the value of our equity investments would have on earnings as of December 31, [removed: 2022] [added: 2023] and [removed: 2021] [added: 2022] (in thousands):
| Fair value increase of 10% | | | $ | [removed: 161,507] [added: 144,952] | | | | | $ | [removed: 187,656] [added: 161,507] | |
| Fair value decrease of 10% | | | $ | [removed: (161,507)] [added: (144,952)] | | | | | $ | [removed: (187,656)] [added: (161,507)] | |
The following tables illustrate the effect that a 10% change in foreign currency rates relative to the U.S. dollar would have on our potential future earnings and on the fair value of our net investment in foreign subsidiaries based on our current operating assets outside the U.S. as of December 31, [removed: 2022] [added: 2023] and [removed: 2021] [added: 2022] (in thousands):
| Rate increase of 10% | | | $ | [removed: 147] [added: 311] | | | | | $ | [removed: 120] [added: 147] | |
| Rate decrease of 10% | | | $ | [removed: (147)] [added: (311)] | | | | | $ | [removed: (120)] [added: (147)] | |
| Rate increase of 10% | | | $ | [removed: 22,523] [added: 37,346] | | | | | $ | [removed: 18,790] [added: 22,523] | |
| Rate decrease of 10% | | | $ | [removed: (22,523)] [added: (37,346)] | | | | | $ | [removed: (18,790)] [added: (22,523)] | |
Our exposure to market risk elements for the year ended December 31, [removed: 2022] [added: 2023] was consistent with the risk elements presented above, including the effects of changes in interest rates, equity prices, and foreign currency exchange rates.
| | | | 2023 | | | | | | 2022 | | |
| | | | 2023 | | | | | | 2022 | | |
| | | | 2023 | | | | | | 2022 | | |
| | | | 2022 | | | | | | 2021 | | |
Item 1. BUSINESS
59 rewritten, 12 added, 8 removed, 130 unchanged
As the pioneer of the life science real estate niche since [removed: its] [added: our] founding in 1994, Alexandria is the preeminent and longest-tenured owner, operator, and developer of collaborative life science, agtech, and [added: advanced] technology [added: mega] campuses in AAA innovation cluster locations, including Greater Boston, the San Francisco Bay Area, New York City, San Diego, Seattle, Maryland, and Research Triangle.
We develop dynamic [removed: urban cluster] [added: mega] campuses and vibrant ecosystems that enable and inspire the world’s most brilliant minds and innovative companies to create life-changing scientific and technological [removed: breakthroughs.][added: innovations.]
Alexandria has a longstanding and proven track record of developing Class [removed: A] [added: A/A+] properties clustered in life science, agtech, and [added: advanced] technology [added: mega] campuses that provide our innovative tenants with highly dynamic and collaborative environments that enhance their ability to successfully recruit and retain world-class talent and inspire productivity, efficiency, creativity, and success.
[removed: Our portfolio includes 64] [added: As of December 31, 2023, we had 411 properties in North America consisting of approximately 47.2 million RSF of] operating properties and [added: new Class A/A+] development [added: and redevelopment properties under construction, including 68 operating properties and development] projects that are held by consolidated real estate joint ventures and four properties that are held by unconsolidated real estate joint ventures.
The occupancy percentage of our operating properties in North America was [removed: 94.8%] [added: 94.6%] as of December 31, [removed: 2022.][added: 2023.]
[removed: Our] [added: The] 10-year average occupancy percentage of our operating properties as of December 31, [removed: 2022] [added: 2023] was 96%.
Investment-grade or publicly traded large cap tenants represented [removed: 48%] [added: 52%] of our total annual rental revenue in effect as of December 31, [removed: 2022.][added: 2023.]
Our primary business objective is to maximize long-term asset value and [removed: shareholder] [added: stockholder] returns based on a multifaceted platform of internal and external growth.
A key element of our strategy is our unique focus on Class [removed: A] [added: A/A+] properties located in collaborative life science, agtech, and [added: advanced] technology [added: mega] campuses in AAA innovation clusters.
We have an experienced Board of Directors [added: (the “Board”)] and are led by an executive and senior management team with extensive experience in the real estate, life science, agtech, and technology industries.
We seek to identify and acquire high-quality properties in our [removed: target] cluster markets.
A key component of our business model is our disciplined allocation of capital [removed: toward] [added: to] the development and redevelopment of new Class [removed: A] [added: A/A+] properties, [removed: as well as] [added: and] property enhancements [added: identified during the underwriting] of certain acquired [removed: properties.][added: properties, located in collaborative life science, agtech, and advanced technology mega campuses in AAA innovation clusters.]
These projects are generally [removed: located in collaborative life science, agtech, and technology campuses in AAA innovation clusters and are] focused on providing high-quality, generic, and reusable spaces that meet the real estate requirements of [removed: our diverse group] [added: a wide range] of tenants.
Development projects generally consist of the ground-up development of generic and reusable [added: laboratory] facilities.
Redevelopment projects consist of the permanent change in use of [added: acquired] office, warehouse, [removed: and] [added: or] shell space into [removed: office/laboratory,] [added: laboratory,] agtech, or [removed: tech office] [added: advanced technology] space.
We generally will not commence new development projects for aboveground construction of new Class [removed: A office/laboratory,] [added: A/A+ laboratory,] agtech, and [removed: tech office] [added: advanced technology] space without first securing significant pre-leasing for such space, except when there is solid market demand for high-quality Class [removed: A] [added: A/A+] properties.
Pre-construction activities include entitlements, permitting, design, site work, and other activities preceding commencement of construction of aboveground building [removed: improvements, which are focused on reducing the time required to deliver projects to prospective tenants.][added: improvements.]
These critical activities add significant value [removed: to our] [added: for] future ground-up [removed: developments] [added: development] and are required for the vertical construction of buildings.
Another key component of our business model is our value-creation redevelopment of [removed: existing] [added: acquired] office, warehouse, or shell [removed: space, or newly acquired properties,] [added: space] into high-quality, generic, and reusable [removed: office/laboratory] [added: laboratory] space that can be leased at higher rental rates.
We seek to maximize balance sheet liquidity and flexibility, cash flows, and cash available for distribution to our stockholders through the ownership, operation, management, and selective acquisition, development, and redevelopment of new Class [removed: A] [added: A/A+] properties located in collaborative life science, agtech, and [added: advanced] technology [added: mega] campuses in AAA innovation clusters, as well as the prudent management of our balance sheet.
- Maintaining access to diverse sources of capital, which [removed: include] [added: include, among others,] net cash flows from operating activities after dividends, incremental leverage-neutral debt supported by growth in EBITDA, strategic value harvesting and asset recycling through real estate dispositions and sales of partial interests, non-real estate investment sales, sales of equity, and [removed: other] [added: joint venture] capital;
- Allocating capital to Class [removed: A] [added: A/A+] properties located in collaborative life science, agtech, and [added: advanced] technology [added: mega] campuses in AAA innovation clusters;
- Maintaining geographic diversity in [removed: urban] intellectual centers of innovation;
- Selectively acquiring high-quality [removed: office/laboratory,] [added: life science,] agtech, and [added: advanced] technology space in our target [removed: urban] innovation cluster submarkets at prices that enable us to realize attractive returns;
- Selectively developing properties in our target [removed: urban] innovation cluster submarkets;
- Selectively redeveloping [removed: existing] [added: acquired] office, warehouse, or shell space, or newly acquired properties, into high-quality, generic, and reusable [removed: office/laboratory] [added: laboratory] space that can be leased at higher rental rates in our target [removed: urban] innovation cluster submarkets;
In general, other [removed: office/laboratory] [added: laboratory] and technology properties are located in close proximity to our properties.
As of December 31, [removed: 2022,] [added: 2023,] we had [removed: 593] [added: 568] employees.
We have [removed: adopted] a Business Integrity Policy that applies to all of our employees, and its receipt and review by each employee is documented and verified annually.
The positive employee experience is evidenced by our low voluntary and total turnover rates averaging [removed: 3.6%] [added: 4.1%] and [removed: 7.7%,] [added: 8.3%,] respectively, over the last five years, from [removed: 2018] [added: 2019] to [removed: 2022,] [added: 2023,] which are substantially lower than the [removed: reported] average voluntary and total turnover rates of [removed: 16.0%] [added: 14.0%] and 19.0%, respectively, [added: as reported for the REIT industry] in the [removed: 2022] [added: 2023] Nareit Compensation & Benefits Survey (data for [removed: 2021).][added: 2022).]
Alexandria devotes extraordinary efforts to hiring, developing, and retaining our talented employees, and we understand firsthand [added: that] the health, happiness, and well-being of our best-in-class team are key factors to the success of our employees and [added: that] of the Company.
Alexandria’s executive and senior management teams, represented by our senior vice presidents and above, consist of 60 individuals, averaging [removed: 24] [added: 23] years of real estate experience, including [removed: 12] [added: 13] years with Alexandria.
Alexandria’s executive and senior management teams have unique experience and expertise in creating, owning, and operating highly dynamic and collaborative [added: mega] campuses in key [removed: urban] life science, agtech, and [added: advanced] technology cluster locations.
These teams [removed: also] include regional market directors with leading reputations and longstanding relationships within the life science, agtech, and technology communities in their respective [removed: urban] innovation clusters.
[removed: Our Corporate Governance Guidelines highlight our] [added: The guidelines explicitly state the] Board of Directors’ [removed: focus on diversity at the board level, which explicitly states the Board’s] commitment to considering qualified women and minority director candidates, as well [added: as] its policy of requesting an initial list of diverse candidates [removed: of] [added: from] any search firm it retains.
We strive to create an open and respectful environment [removed: in which] [added: where] our employees can actively contribute, have access to opportunities and resources, and realize their full potential.
Furthermore, as a federal government contractor, Alexandria maintains affirmative action plans, which [removed: sets] [added: set] forth the policies, practices, and procedures to which the Company is committed in order to ensure that [removed: its] [added: our] policies of nondiscrimination and affirmative action are followed for qualified females, minorities, individuals with disabilities, and protected veterans.
To address issues related to pay discrimination, the Company has [removed: implemented] a ban on any and all inquiries into an applicant’s salary [removed: history] [added: history,] and we incorporate fair pay reviews into every employment compensation decision.
To reinforce our corporate culture of respect, diversity, and inclusion, we provide anti-harassment training [removed: annually for all employees.][added: annually.]
Our company-sponsored suite of benefits covers 100% of the premiums for our employees and their dependents and includes, but is not limited to, a high-coverage, low-deductible [removed: PPO (preferred] [added: preferred] provider [removed: organization)] [added: organization (“PPO”)] medical plan, a 24/7 telehealth and concierge medical care services program, PPO dental and orthodontia coverage, a generous vision plan, comprehensive prescription drug plan, infertility and family planning benefits, [removed: short-] [added: short-term] and long-term disability benefits, and life and accidental death and dismemberment coverage.
Alexandria has a total market capitalization of $33.1 billion and an asset base in North America of 73.5 million SF as of December 31, 2023.
This asset base includes 42.0 million RSF of operating properties, 5.5 million RSF of Class A/A+ properties undergoing construction and one near-term project expected to commence construction in the next two years, 2.1 million RSF of priority anticipated development and redevelopment projects, and 23.9 million SF of future development projects.
Upon completion, each value-creation project is expected to generate increases in rental income, net operating income, and cash flows.
Our development and redevelopment projects are generally in locations that are highly desirable to high-quality entities, which we believe results in higher occupancy levels, longer lease terms, higher rental income, higher returns, and greater long-term asset value.
The advancement of pre-construction efforts is focused on reducing the time required to deliver projects to prospective tenants.
Ultimately, these projects will provide high-quality facilities and are expected to generate significant revenue and cash flows.
Alexandria pioneered the life science real estate niche with our founding in 1994, and today is the preeminent and longest-tenured owner, operator, and developer of life science, agtech, and advanced technology mega campuses in AAA innovation cluster locations.
We continue to maintain and cultivate many of the most important and strategic relationships in the life science, agtech, and technology industries.
Our Corporate Governance Guidelines highlight our Board of Directors’ focus on diversity at the board level.
- Volunteer rewards of up to $10,000 per calendar year donated by Alexandria based on time volunteered ($2,500 donated per 25 hours);
Alexandria champions our people as our greatest asset.
We offer a variety of learning opportunities, including custom, cohort-based development programs that leverage social learning, instructor-led trainings, on-demand trainings and resources, and a highly utilized mentoring program.
The trusted partner to approximately 1,000 tenants, Alexandria has a total market capitalization of $35.0 billion and an asset base in North America of 74.6 million SF as of December 31, 2022, which includes 41.8 million RSF of operating properties and 5.6 million RSF of Class A properties undergoing construction, 9.9 million RSF of near-term and intermediate-term development and redevelopment projects, and 17.3 million SF of future development projects.
We seek to meet growing demand from our stakeholders and continuously improve the efficiency of our buildings.
Additionally, we have committed to significant building goals to promote wellness and productivity for our buildings’ occupants, including targeting a LEED® Gold or Platinum certification on all new ground-up construction projects.
We generally do not commence vertical construction of new projects prior to achieving significant pre-leasing.
As the first, longest-tenured, and pioneering publicly traded life science REIT to focus primarily on the office/laboratory real estate niche, we provide world-class collaborative life science, agtech, and technology campuses in AAA innovation cluster locations and maintain and cultivate many of the most important and strategic relationships in the life science, agtech, and technology industries.
- Volunteer rewards initiated when an employee volunteers more than 25 hours in any quarter at eligible non-profit organizations, for which Alexandria donates a total of $2,500 to the eligible non-profit organizations of their choice, up to $10,000 annually
Therefore, we invest in training and development programs to enhance our employees’ engagement, effectiveness, and well-being.
We also provide on-demand learning resources, such as LinkedIn Learning, as well as internally developed, ARE-specific on-demand content.
An excerpt. Shown here: 40 of 59 rewritten, all 12 added and all 8 removed. The counts are complete. For every sentence, read Item 1. BUSINESS in the FY2023 filing and the FY2022 filing.
Cover and table of contents
27 rewritten, 3 added, 4 removed, 105 unchanged
[added: (Mark One)] ☒ ANNUAL REPORT PURSUANT TO SECTION 13 OR 15(d) OF THE SECURITIES EXCHANGE ACT OF 1934
For the fiscal year ended December 31, [removed: 2022][added: 2023]
[removed: ][added: ]
The aggregate market value of the shares of Common Stock held by non-affiliates of registrant was approximately [removed: $23.5] [added: $19.5] billion based on the closing price for such shares on the New York Stock Exchange on June 30, [removed: 2022.][added: 2023.]
As of January [removed: 13, 2023, 173,087,087] [added: 12, 2024, 174,968,259] shares of common stock were outstanding.
Part III of this annual report on Form 10-K incorporates certain information by reference from the registrant’s definitive proxy statement to be filed within 120 days of the end of the fiscal year covered by this annual report on Form 10-K in connection with the registrant’s annual meeting of stockholders to be held on or about May [removed: 16, 2023.][added: 14, 2024.]
| [ITEM [removed: 1.](#i87a291e67d5f4e61841d9becadb050e6_16)] [added: 1.](#i52f8234930b849d98ad87af06dc4dc6d_16)] | | | [removed: [BUSINESS](#i87a291e67d5f4e61841d9becadb050e6_16)] [added: [BUSINESS](#i52f8234930b849d98ad87af06dc4dc6d_16)] | | | [removed: [1](#i87a291e67d5f4e61841d9becadb050e6_16)] [added: [1](#i52f8234930b849d98ad87af06dc4dc6d_16)] | | |
| [ITEM [removed: 1A.](#i87a291e67d5f4e61841d9becadb050e6_25)] [added: 1A.](#i52f8234930b849d98ad87af06dc4dc6d_25)] | | | [RISK [removed: FACTORS](#i87a291e67d5f4e61841d9becadb050e6_25)] [added: FACTORS](#i52f8234930b849d98ad87af06dc4dc6d_25)] | | | [removed: [9](#i87a291e67d5f4e61841d9becadb050e6_25)] [added: [9](#i52f8234930b849d98ad87af06dc4dc6d_25)] | | |
| [ITEM [removed: 1B.](#i87a291e67d5f4e61841d9becadb050e6_49)] [added: 1B.](#i52f8234930b849d98ad87af06dc4dc6d_49)] | | | [UNRESOLVED STAFF [removed: COMMENTS](#i87a291e67d5f4e61841d9becadb050e6_49)] [added: COMMENTS](#i52f8234930b849d98ad87af06dc4dc6d_49)] | | | [removed: [54](#i87a291e67d5f4e61841d9becadb050e6_49)] [added: [51](#i52f8234930b849d98ad87af06dc4dc6d_49)] | | |
| [ITEM [removed: 2.](#i87a291e67d5f4e61841d9becadb050e6_52)] [added: 2.](#i52f8234930b849d98ad87af06dc4dc6d_52)] | | | [removed: [PROPERTIES](#i87a291e67d5f4e61841d9becadb050e6_52)] [added: [PROPERTIES](#i52f8234930b849d98ad87af06dc4dc6d_52)] | | | [removed: [55](#i87a291e67d5f4e61841d9becadb050e6_52)] [added: [53](#i52f8234930b849d98ad87af06dc4dc6d_52)] | | |
| [ITEM [removed: 3.](#i87a291e67d5f4e61841d9becadb050e6_100)] [added: 3.](#i52f8234930b849d98ad87af06dc4dc6d_100)] | | | [LEGAL [removed: PROCEEDINGS](#i87a291e67d5f4e61841d9becadb050e6_100)] [added: PROCEEDINGS](#i52f8234930b849d98ad87af06dc4dc6d_100)] | | | [removed: [87](#i87a291e67d5f4e61841d9becadb050e6_100)] [added: [84](#i52f8234930b849d98ad87af06dc4dc6d_100)] | | |
| [ITEM [removed: 4.](#i87a291e67d5f4e61841d9becadb050e6_103)] [added: 4.](#i52f8234930b849d98ad87af06dc4dc6d_103)] | | | [MINE SAFETY [removed: DISCLOSURES](#i87a291e67d5f4e61841d9becadb050e6_103)] [added: DISCLOSURES](#i52f8234930b849d98ad87af06dc4dc6d_103)] | | | [removed: [87](#i87a291e67d5f4e61841d9becadb050e6_103)] [added: [84](#i52f8234930b849d98ad87af06dc4dc6d_103)] | | |
| [ITEM [removed: 5.](#i87a291e67d5f4e61841d9becadb050e6_109)] [added: 5.](#i52f8234930b849d98ad87af06dc4dc6d_109)] | | | [MARKET FOR REGISTRANT’S COMMON EQUITY, RELATED STOCKHOLDER MATTERS, AND ISSUER PURCHASES OF EQUITY [removed: SECURITIES](#i87a291e67d5f4e61841d9becadb050e6_109)] [added: SECURITIES](#i52f8234930b849d98ad87af06dc4dc6d_109)] | | | [removed: [87](#i87a291e67d5f4e61841d9becadb050e6_109)] [added: [84](#i52f8234930b849d98ad87af06dc4dc6d_109)] | | |
| ITEM 6. | | | [removed: [\[RESERVED\]](#i87a291e67d5f4e61841d9becadb050e6_112)] [added: [\[RESERVED\]](#i52f8234930b849d98ad87af06dc4dc6d_112)] | | | [removed: [87](#i87a291e67d5f4e61841d9becadb050e6_112)] [added: [84](#i52f8234930b849d98ad87af06dc4dc6d_112)] | | |
| [ITEM [removed: 7.](#i87a291e67d5f4e61841d9becadb050e6_115)] [added: 7.](#i52f8234930b849d98ad87af06dc4dc6d_115)] | | | [MANAGEMENT’S DISCUSSION AND ANALYSIS OF FINANCIAL CONDITION AND RESULTS OF [removed: OPERATIONS](#i87a291e67d5f4e61841d9becadb050e6_115)] [added: OPERATIONS](#i52f8234930b849d98ad87af06dc4dc6d_115)] | | | [removed: [87](#i87a291e67d5f4e61841d9becadb050e6_115)] [added: [85](#i52f8234930b849d98ad87af06dc4dc6d_115)] | | |
| [ITEM [removed: 7A.](#i87a291e67d5f4e61841d9becadb050e6_301)] [added: 7A.](#i52f8234930b849d98ad87af06dc4dc6d_289)] | | | [QUANTITATIVE AND QUALITATIVE DISCLOSURES ABOUT MARKET [removed: RISK](#i87a291e67d5f4e61841d9becadb050e6_301)] [added: RISK](#i52f8234930b849d98ad87af06dc4dc6d_289)] | | | [removed: [159](#i87a291e67d5f4e61841d9becadb050e6_301)] [added: [142](#i52f8234930b849d98ad87af06dc4dc6d_289)] | | |
| [ITEM [removed: 8.](#i87a291e67d5f4e61841d9becadb050e6_304)] [added: 8.](#i52f8234930b849d98ad87af06dc4dc6d_292)] | | | [FINANCIAL STATEMENTS AND SUPPLEMENTARY [removed: DATA](#i87a291e67d5f4e61841d9becadb050e6_304)] [added: DATA](#i52f8234930b849d98ad87af06dc4dc6d_292)] | | | [removed: [161](#i87a291e67d5f4e61841d9becadb050e6_304)] [added: [144](#i52f8234930b849d98ad87af06dc4dc6d_292)] | | |
| [ITEM [removed: 9.](#i87a291e67d5f4e61841d9becadb050e6_307)] [added: 9.](#i52f8234930b849d98ad87af06dc4dc6d_295)] | | | [CHANGES IN AND DISAGREEMENTS WITH ACCOUNTANTS ON ACCOUNTING AND FINANCIAL [removed: DISCLOSURE](#i87a291e67d5f4e61841d9becadb050e6_307)] [added: DISCLOSURE](#i52f8234930b849d98ad87af06dc4dc6d_295)] | | | [removed: [161](#i87a291e67d5f4e61841d9becadb050e6_307)] [added: [144](#i52f8234930b849d98ad87af06dc4dc6d_295)] | | |
| [ITEM [removed: 9A.](#i87a291e67d5f4e61841d9becadb050e6_310)] [added: 9A.](#i52f8234930b849d98ad87af06dc4dc6d_298)] | | | [CONTROLS AND [removed: PROCEDURES](#i87a291e67d5f4e61841d9becadb050e6_310)] [added: PROCEDURES](#i52f8234930b849d98ad87af06dc4dc6d_298)] | | | [removed: [161](#i87a291e67d5f4e61841d9becadb050e6_310)] [added: [144](#i52f8234930b849d98ad87af06dc4dc6d_298)] | | |
| [ITEM [removed: 9B.](#i87a291e67d5f4e61841d9becadb050e6_316)] [added: 9B.](#i52f8234930b849d98ad87af06dc4dc6d_304)] | | | [OTHER [removed: INFORMATION](#i87a291e67d5f4e61841d9becadb050e6_316)] [added: INFORMATION](#i52f8234930b849d98ad87af06dc4dc6d_304)] | | | [removed: [163](#i87a291e67d5f4e61841d9becadb050e6_316)] [added: [146](#i52f8234930b849d98ad87af06dc4dc6d_304)] | | |
| [ITEM [removed: 9C.](#i87a291e67d5f4e61841d9becadb050e6_319)] [added: 9C.](#i52f8234930b849d98ad87af06dc4dc6d_307)] | | | [DISCLOSURE REGARDING FOREIGN JURISDICTIONS THAT PREVENT [removed: INSPECTIONS](#i87a291e67d5f4e61841d9becadb050e6_319)] [added: INSPECTIONS](#i52f8234930b849d98ad87af06dc4dc6d_307)] | | | [removed: [163](#i87a291e67d5f4e61841d9becadb050e6_319)] [added: [146](#i52f8234930b849d98ad87af06dc4dc6d_307)] | | |
| [ITEM [removed: 10.](#i87a291e67d5f4e61841d9becadb050e6_325)] [added: 10.](#i52f8234930b849d98ad87af06dc4dc6d_313)] | | | [DIRECTORS, EXECUTIVE [removed: OFFICERS, AND] [added: OFFICERS](#i52f8234930b849d98ad87af06dc4dc6d_313)[,](#i52f8234930b849d98ad87af06dc4dc6d_313) [AND] CORPORATE [removed: GOVERNANCE](#i87a291e67d5f4e61841d9becadb050e6_325)] [added: GOVERNANCE](#i52f8234930b849d98ad87af06dc4dc6d_313)] | | | [removed: [163](#i87a291e67d5f4e61841d9becadb050e6_325)] [added: [146](#i52f8234930b849d98ad87af06dc4dc6d_313)] | | |
| [ITEM [removed: 11.](#i87a291e67d5f4e61841d9becadb050e6_328)] [added: 11.](#i52f8234930b849d98ad87af06dc4dc6d_316)] | | | [EXECUTIVE [removed: COMPENSATION](#i87a291e67d5f4e61841d9becadb050e6_328)] [added: COMPENSATION](#i52f8234930b849d98ad87af06dc4dc6d_316)] | | | [removed: [163](#i87a291e67d5f4e61841d9becadb050e6_328)] [added: [146](#i52f8234930b849d98ad87af06dc4dc6d_316)] | | |
| [ITEM [removed: 12.](#i87a291e67d5f4e61841d9becadb050e6_331)] [added: 12.](#i52f8234930b849d98ad87af06dc4dc6d_319)] | | | [SECURITY OWNERSHIP OF CERTAIN BENEFICIAL OWNERS AND MANAGEMENT AND RELATED STOCKHOLDER [removed: MATTERS](#i87a291e67d5f4e61841d9becadb050e6_331)] [added: MATTERS](#i52f8234930b849d98ad87af06dc4dc6d_319)] | | | [removed: [163](#i87a291e67d5f4e61841d9becadb050e6_331)] [added: [146](#i52f8234930b849d98ad87af06dc4dc6d_319)] | | |
| [ITEM [removed: 13.](#i87a291e67d5f4e61841d9becadb050e6_334)] [added: 13.](#i52f8234930b849d98ad87af06dc4dc6d_322)] | | | [CERTAIN RELATIONSHIPS AND RELATED TRANSACTIONS, AND DIRECTOR [removed: INDEPENDENCE](#i87a291e67d5f4e61841d9becadb050e6_334)] [added: INDEPENDENCE](#i52f8234930b849d98ad87af06dc4dc6d_322)] | | | [removed: [163](#i87a291e67d5f4e61841d9becadb050e6_334)] [added: [146](#i52f8234930b849d98ad87af06dc4dc6d_322)] | | |
| [ITEM [removed: 14.](#i87a291e67d5f4e61841d9becadb050e6_337)] [added: 14.](#i52f8234930b849d98ad87af06dc4dc6d_325)] | | | [PRINCIPAL ACCOUNTANT FEES AND [removed: SERVICES](#i87a291e67d5f4e61841d9becadb050e6_337)] [added: SERVICES](#i52f8234930b849d98ad87af06dc4dc6d_325)] | | | [removed: [163](#i87a291e67d5f4e61841d9becadb050e6_337)] [added: [146](#i52f8234930b849d98ad87af06dc4dc6d_325)] | | |
| [ITEM [removed: 15.](#i87a291e67d5f4e61841d9becadb050e6_343)] [added: 15.](#i52f8234930b849d98ad87af06dc4dc6d_331)] | | | [EXHIBITS AND FINANCIAL STATEMENT [removed: SCHEDULES](#i87a291e67d5f4e61841d9becadb050e6_343)] [added: SCHEDULES](#i52f8234930b849d98ad87af06dc4dc6d_331)] | | | [removed: [164](#i87a291e67d5f4e61841d9becadb050e6_343)] [added: [147](#i52f8234930b849d98ad87af06dc4dc6d_331)] | | |
If securities are registered pursuant to Section 12(b) of the Act, indicate by check mark whether the financial statements of the registrant included in the filing reflect the correction of an error to previously issued financial statements.
Indicate by check mark whether any of those error corrections are restatements that required a recovery analysis of incentive-based compensation received by any of the registrant’s executive officers during the relevant recovery period pursuant to §240.10D-1(b).
| [ITEM 1](#i52f8234930b849d98ad87af06dc4dc6d_4564)[C](#i52f8234930b849d98ad87af06dc4dc6d_4564)[.](#i52f8234930b849d98ad87af06dc4dc6d_4564) | | | [CYBERSECURITY](#i52f8234930b849d98ad87af06dc4dc6d_4564) | | | [51](#i52f8234930b849d98ad87af06dc4dc6d_4564) | | |
(Mark One)
| ESG | | | Environmental, Social, and Governance | | |
| IASB | | | International Accounting Standards Board | | |
| LIBOR | | | London Interbank Offered Rate | | |
Item 1C. CYBERSECURITY
0 rewritten, 41 added, 0 removed, 0 unchanged
New section this year
Risk management and strategy
Our corporate information technology, communication networks, enterprise applications, accounting and financial reporting platforms, and related systems, and those that we offer to our tenants are necessary for the operation of our business.
We use these systems, among others, to manage our tenant and vendor relationships, for internal communications, for accounting to operate record-keeping function, and for many other key aspects of our business.
Our business operations rely on the secure collection, storage, transmission, and other processing of proprietary, confidential, and sensitive data.
We have implemented and maintain various information security processes designed to identify, assess and manage material risks from cybersecurity threats to our critical computer networks, third-party hosted services, communications systems, hardware and software, and our critical data, including intellectual property, confidential information that is proprietary, strategic or competitive in nature, and tenant data (“Information Systems and Data”).
We rely on a multidisciplinary team, including our information security function, legal department, management, and third-party service providers, as described further below, to identify, assess, and manage cybersecurity threats and risks.
We identify and assess risks from cybersecurity threats by monitoring and evaluating our threat environment and our risk profile using various methods including, for example, using manual and automated tools, subscribing to reports and services that identify cybersecurity threats, analyzing reports of threats and threat actors, conducting scans of the threat environment, evaluating our industry’s risk profile, utilizing internal and external audits, and conducting threat and vulnerability assessments.
Depending on the environment, we implement and maintain various technical, physical, and organizational measures, processes, standards, and/or policies designed to manage and mitigate material risks from cybersecurity threats to our Information Systems and Data, including risk assessments, incident detection and response, vulnerability management, disaster recovery and business continuity plans, internal controls within our accounting and financial reporting functions, encryption of data, network security controls, access controls, physical security, asset management, systems monitoring, vendor risk management program, employee training, and penetration testing.
We work with third parties from time to time that assist us to identify, assess, and manage cybersecurity risks, including professional services firms, consulting firms, threat intelligence service providers, and penetration testing firms.
To operate our business, we utilize certain third-party service providers to perform a variety of functions.
We seek to engage reliable, reputable service providers that maintain cybersecurity programs.
Depending on the nature of the services provided, the sensitivity and quantity of information processed, and the identity of the service provider, our vendor management process may include reviewing the cybersecurity practices of such provider, contractually imposing obligations on the provider, conducting security assessments, and conducting periodic reassessments during their engagement.
We are not aware of any risks from cybersecurity threats, including as a result of any cybersecurity incidents, which have materially affected or are reasonably likely to materially affect our Company, including our business strategy, results of operations, or financial condition.
Refer to “Item 1A.
Risk factors” in this annual report on Form 10-K, including “If our information technology networks or data, or those of third parties upon which we rely, are or were disrupted or otherwise compromised, we could experience costly remediation or other expenses, liability under federal and state laws, and litigation and investigations, any of which could result in substantial reputational damage and materially and adversely affect our business, financial condition, results of operations, cash flows, and the market price of our common stock”, for additional discussion about cybersecurity-related risks.
Governance
Our Board of Directors holds oversight responsibility over the Company’s strategy and risk management, including material risks related to cybersecurity threats.
This oversight is executed directly by the Board of Directors and through its committees.
The Audit Committee of the Board of Directors (the “Audit Committee”) oversees the management of systemic risks, including cybersecurity, in accordance with its charter.
The Audit Committee engages in regular discussions with management regarding the Company’s significant financial risk exposures and the measures implemented to monitor and control these risks, including those that may result from material cybersecurity threats.
These discussions include the Company’s risk assessment and risk management policies.
Our management, represented by our Chief Technology Officer, Greg C.
Thomas, and our Chief Financial Officer and Treasurer, Marc E.
Binda, leads our cybersecurity risk assessment and management processes and oversees their implementation and maintenance.
Greg C.
Thomas is an experienced information technology professional in our information technology department and has served as Chief Technology Officer since 2018.
He works with the Company’s internal information technology department and external partners to monitor and improve our cybersecurity capabilities.
Mr. Thomas possesses a proven real estate industry track record of guiding organizations through strategic technology, organizational, risk mitigation, process improvement initiatives, and digital transformations.
He also possesses extensive experience in technology and cybersecurity, gained over his career spanning more than 30 years, including as Chief Information Officer at two other large real estate firms, as well as in leadership roles within the real estate industry technology practices of Ernst & Young LLP and Deloitte LLP.
He earned Bachelor of Science degrees in Systems Analysis and Finance from Miami University.
Marc E.
Binda, CPA, is an experienced risk management professional in our finance and risk management function and has served as Chief Financial Officer since September 2023 and as Treasurer since April 2018.
Mr. Binda previously served as Executive Vice President – Finance and Treasurer from June 2019 to September 2023, as Senior Vice President – Finance and Treasurer from April 2018 to June 2019, as Senior Vice President – Finance from April 2012 to April 2018, and in other capacities from January 2005 to April 2012.
Mr. Binda currently oversees key functions for the Company’s accounting, finance, and treasury strategies, including risk management.
In addition, Mr. Binda leads the Company’s cybersecurity risk oversight and the development and enhancement of internal controls designed to prevent, detect, address, and mitigate the risk of cyber incidents.
Management, in coordination with our information technology department, is responsible for hiring appropriate personnel, helping to integrate cybersecurity risk considerations into the Company’s overall risk management strategy, and communicating key priorities to relevant personnel.
Management is responsible for approving budgets, approving cybersecurity processes, and reviewing cybersecurity assessments and other cybersecurity-related matters.
Our cybersecurity incident response and vulnerability management processes are designed to escalate certain cybersecurity incidents to members of management depending on the circumstances.
Management, including the Chief Technology Officer and Chief Financial Officer and Treasurer, serves on the Company’s incident response team to help the Company mitigate and remediate cybersecurity incidents of which they are notified.
In addition, the Company’s incident response processes include reporting to the Audit Committee for certain cybersecurity incidents.
An excerpt. Shown here: all 0 rewritten, 40 of 41 added and all 0 removed. The counts are complete. For every sentence, read Item 1C. CYBERSECURITY in the FY2023 filing.
Item 2. PROPERTIES
335 rewritten, 376 added, 304 removed, 292 unchanged
As of December 31, [removed: 2022,] [added: 2023,] we had [removed: 432] [added: 411] properties in North America [removed: containing] [added: consisting of] approximately [removed: 47.4] [added: 47.2] million RSF of operating properties and [added: new Class A/A+] development and redevelopment [removed: of new Class A] properties under construction, including [removed: 64] [added: 68] properties that are held by consolidated real estate joint ventures and four properties that are held by unconsolidated real estate joint ventures.
The occupancy percentage of our operating properties in North America was [removed: 94.8%] [added: 94.6%] as of December 31, [removed: 2022.][added: 2023.]
As of December 31, [removed: 2022,] [added: 2023,] we held a fee simple interest in each of our properties, with the exception of [removed: 40] [added: 36] properties in North America subject to ground leasehold interests, which accounted for approximately 9% of our total number of properties.
Of these [removed: 40] [added: 36] properties, we held [removed: 14] [added: 10] properties in the Greater Boston market, 20 properties in the San Francisco Bay Area market, two properties in the New York City market, one property in the Seattle market, one property in the Maryland market, and two properties in the Research Triangle market.
During the year ended December 31, [removed: 2022, our ground lease rental expense aggregated 1.7%] [added: 2023,] as a percentage of net operating [removed: income.][added: income our ground lease rental expense aggregated 1.5%.]
Refer to [removed: further discussion in] our consolidated financial statements and notes thereto in “Item 15.
Exhibits and financial statement schedules” in this annual report on Form [removed: 10-K.][added: 10-K for further discussion.]
As of December 31, [removed: 2022,] [added: 2023,] we had over 1,000 leases with a total of approximately [removed: 1,000] [added: 800] tenants, and [removed: 199,] [added: 198,] or [removed: 46%,] [added: 48%,] of our [removed: 432] [added: 411] properties were single-tenant properties.
Leases in our multi-tenant buildings typically have initial terms of [removed: 4–11] [added: 4 to 11] years, while leases in our single-tenant buildings typically have initial terms of [removed: 11–21] [added: 11 to 21] years.
- Investment-grade or publicly traded large cap tenants represented [removed: 48%] [added: 52%] of our total annual rental revenue;
- Approximately [removed: 93%] [added: 94%] of our leases (on an annual rental revenue basis) were triple net leases, which require tenants to pay substantially all real estate taxes, insurance, utilities, repairs and maintenance, common area expenses, and other operating expenses (including increases thereto) in addition to base rent; and
The locations of our properties are diversified among a number of [added: Class A/A+ assets strategically clustered in] life science, agtech, and [added: advanced] technology [added: mega campuses in AAA innovation] cluster markets.
The following table sets forth the total RSF, number of properties, and annual rental revenue in effect as of December 31, [removed: 2022] [added: 2023] in each of our markets in North America (dollars in thousands, except per RSF amounts):
| Non-cluster/other markets | | | | | | [removed: 382,960 | | | | | |] — | | | | | | — | | | | | | [removed: 382,960 | | | | | | 1 | | | | | | 11] [added: —] | | | | | | [removed: 14,554] [added: 1,342] | | | | | | [removed: 1] [added: 1,342] | | | | | | [removed: 50.70] [added: 106.21] | | |
| Properties held for sale | | | | | | [removed: 297,284] [added: 1,049,135] | | | | | | — | | | | | | — | | | | | | [removed: 297,284 | | | | | |] — | | | | | | [removed: 10 | | | (1) | | | 2,476] [added: 235,000] | | | | | | [removed: —] [added: 235,000] | | | | | | [removed: N/A] [added: 1,284,135] | | |
| Market | | | | | | [removed: 12/31/22] [added: 12/31/23] | | | | | | [removed: 12/31/21] [added: 12/31/22] | | | | | | [removed: 12/31/20] [added: 12/31/21] | | | | | | [removed: 12/31/22] [added: 12/31/23] | | | | | | [removed: 12/31/21] [added: 12/31/22] | | | | | | [removed: 12/31/20] [added: 12/31/21] | | |
| Greater Boston | | | | | | [removed: 94.5] [added: 94.9] | | % | | | | [removed: 95.2] [added: 94.5] | | % | | | | [removed: 98.1] [added: 95.2] | | % | | | | [removed: 85.5] [added: 84.7] | | % | | | | [removed: 83.2] [added: 85.5] | | % | | | | [removed: 94.8] [added: 83.2] | | % |
| San Francisco Bay Area | | | | | | [removed: 96.7] [added: 94.8] | | | | | | [removed: 93.0] [added: 96.7] | | | | | | [removed: 95.8] [added: 93.0] | | | | | | [removed: 93.3] [added: 91.4] | | | | | | [removed: 92.6] [added: 93.3] | | | | | | [removed: 94.7] [added: 92.6] | | |
| New York City | | | | | | [removed: 92.3] [added: 85.3] | | | [added: (1)] | | | [removed: 98.4] [added: 92.3] | | | | | | [removed: 97.3] [added: 98.4] | | | | | | [removed: 92.3] [added: 85.3] | | | | | | [removed: 91.0] [added: 92.3] | | | | | | [removed: 87.8] [added: 91.0] | | |
| San Diego | | | | | | [removed: 95.4] [added: 94.1] | | | | | | [removed: 93.1] [added: 95.4] | | | | | | [removed: 93.5] [added: 93.1] | | | | | | [removed: 95.4] [added: 94.1] | | | | | | [removed: 91.7] [added: 95.4] | | | | | | [removed: 92.4] [added: 91.7] | | |
| Seattle | | | | | | [removed: 97.0] [added: 95.2] | | | | | | [removed: 95.6] [added: 97.0] | | | | | | [removed: 96.0] [added: 95.6] | | | | | | [removed: 90.1] [added: 90.7] | | | | | | [removed: 88.5] [added: 90.1] | | | | | | [removed: 85.5] [added: 88.5] | | |
| Maryland | | | | | | [removed: 95.8] [added: 95.6] | | | | | | [removed: 99.8] [added: 95.8] | | | | | | [removed: 96.1] [added: 99.8] | | | | | | [removed: 93.3] [added: 95.6] | | | | | | [removed: 96.0] [added: 93.3] | | | | | | [removed: 90.6] [added: 96.0] | | |
| Research Triangle | | | | | | [removed: 94.0] [added: 97.8] | | | | | | [removed: 94.6] [added: 94.0] | | | | | | [removed: 89.6] [added: 94.6] | | | | | | [removed: 85.0] [added: 97.8] | | | | | | [removed: 86.1] [added: 85.0] | | | | | | [removed: 72.7] [added: 86.1] | | |
| Texas | | | | | | [removed: 91.2] [added: 95.1] | | | | | | [removed: N/A] [added: 91.2] | | | | | | N/A | | | | | | [removed: 81.6] [added: 91.5] | | | | | | [removed: N/A] [added: 81.6] | | | | | | N/A | | |
| Subtotal | | | | | | [removed: 95.1] [added: 94.9] | | | | | | [removed: 94.9] [added: 95.1] | | | | | | [removed: 95.5] [added: 94.9] | | | | | | [removed: 89.9] [added: 90.7] | | | | | | [removed: 89.1] [added: 89.9] | | | | | | [removed: 90.7] [added: 89.1] | | |
| Canada | | | | | | [removed: 80.8] [added: 87.1] | | | | | | [removed: 78.6] [added: 80.8] | | | | | | [removed: 81.8] [added: 78.6] | | | | | | [removed: 68.2] [added: 73.0] | | | | | | [removed: 78.6] [added: 68.2] | | | | | | [removed: 81.8] [added: 78.6] | | |
| Non-cluster/other markets | | | | | | [removed: 75.0] [added: 78.5] | | | | | | [removed: 75.1] [added: 75.0] | | | | | | [removed: 52.7] [added: 75.1] | | | | | | [removed: 75.0] [added: 78.5] | | | | | | [removed: 75.1] [added: 75.0] | | | | | | [removed: 52.7] [added: 75.1] | | |
| North America | | | | | | [removed: 94.8] [added: 94.6] | | % | | | | [removed: 94.0] [added: 94.8] | | % | | | | [removed: 94.6] [added: 94.0] | | % | | | | [removed: 89.4] [added: 90.2] | | % | | | | [removed: 88.5] [added: 89.4] | | % | | | | [removed: 90.0] [added: 88.5] | | % |
[removed: 90%] [added: 92%] of Top 20 Tenants Annual Rental Revenue Is From Investment-Grade
Our properties are leased to a high-quality and diverse group of tenants, with no individual tenant accounting for more than [removed: 3.5%] [added: 5.7%] of our annual rental revenue in effect as of December 31, [removed: 2022.][added: 2023.]
The following table sets forth information regarding leases with our 20 largest tenants in North America based upon annual rental revenue in effect as of December 31, [removed: 2022] [added: 2023] (dollars in thousands, except average market cap amounts):
| [removed: 4] [added: 5] | | | | | | Takeda Pharmaceutical Company Limited | | | | | | | | | [removed: 7.0] [added: 6.0] | | | | | | | | | | | | 549,760 | | | | | | | | | | | | 37,399 | | | | | | | | | [removed: 1.9] [added: 1.7] | | | | | | | | | Baa2 | | | | | | BBB+ | | | | | | $ | [removed: 45.0] [added: 49.0] | | | | |
| [removed: 7] [added: 8] | | | | | | 2seventy bio, Inc.(2) | | | | | | | | | [removed: 10.7] [added: 9.7] | | | | | | | | | | | | 312,805 | | | | | | | | | | | | 33,617 | | | | | | | | | [removed: 1.7] [added: 1.6] | | | | | | | | | — | | | | | | — | | | | | | $ | [removed: 0.5] [added: 0.4] | | | | |
| [removed: 9] [added: 11] | | | | | | [removed: TIBCO Software,] [added: Cloud Software Group,] Inc. | | | | | | | | | [removed: 4.2] [added: 3.2] | | | (3) | | | | | | | | | 292,013 | | | | | | | | | | | | 28,537 | | | | | | | | | [removed: 1.4] [added: 1.3] | | | | | | | | | — | | | | | | — | | | | | | $ | — | | | | |
(1)Based on total annual rental revenue in effect as of December 31, [removed: 2022.][added: 2023.]
[removed: As] [added: (2)As] of September 30, [removed: 2022,] [added: 2023,] 2seventy bio, Inc. held [removed: $127.0] [added: $250.6] million of [added: cash,] cash [added: equivalents,] and [removed: cash equivalents.][added: marketable securities.]
(3)Includes [removed: leases] [added: one lease] at [added: a] recently acquired [removed: properties] [added: property] with future development and redevelopment opportunities.
(4)Includes (i) ground leases for land at 1455 and 1515 Third Street (two buildings aggregating 422,980 RSF) and (ii) leases at 1655 and 1725 Third Street (two buildings aggregating 586,208 RSF) [added: in our Mission Bay submarket] owned by our unconsolidated real estate joint venture in which we have an ownership interest of 10%.
Excluding the ground leases, the weighted-average remaining lease term for our top 20 tenants was [removed: 7.1] [added: 7.8] years as of December 31, [removed: 2022.][added: 2023.]
| Long-Duration and Stable Cash Flows From High-Quality [added: and Diverse] Tenants | | | | | | | | |
Additionally, as of December 31, 2023:
| Greater Boston | | | | | | 10,836,743 | | | | | | 975,419 | | | | | | 1,304,051 | | | (1) | | | 13,116,213 | | | | | | 28 | | % | | | | 72 | | | | | | $ | 820,759 | | | | | 38 | | % | | | | $ | 79.82 | |
| San Francisco Bay Area | | | | | | 7,906,198 | | | | | | 498,142 | | | | | | 300,010 | | | | | | 8,704,350 | | | | | | 18 | | | | | | 67 | | | | | | 460,272 | | | | | | 21 | | | | | | 66.04 | | |
| New York City | | | | | | 922,477 | | | | | | — | | | | | | — | | | | | | 922,477 | | | | | | 2 | | | | | | 4 | | | | | | 72,993 | | | | | | 3 | | | | | | 92.75 | | |
| San Diego | | | | | | 7,831,370 | | | | | | 1,187,796 | | | | | | — | | | | | | 9,019,166 | | | | | | 19 | | | | | | 90 | | | | | | 320,460 | | | | | | 14 | | | | | | 43.48 | | |
| Seattle | | | | | | 2,962,995 | | | | | | 33,349 | | | | | | 148,890 | | | | | | 3,145,234 | | | | | | 7 | | | | | | 44 | | | | | | 131,377 | | | | | | 6 | | | | | | 46.57 | | |
| Maryland | | | | | | 3,582,494 | | | | | | 510,601 | | | | | | — | | | | | | 4,093,095 | | | | | | 9 | | | | | | 51 | | | | | | 123,780 | | | | | | 6 | | | | | | 36.57 | | |
| Research Triangle | | | | | | 3,840,876 | | | | | | — | | | | | | — | | | | | | 3,840,876 | | | | | | 8 | | | | | | 39 | | | | | | 120,982 | | | | | | 6 | | | | | | 32.20 | | |
| Texas | | | | | | 1,845,159 | | | | | | — | | | | | | 73,298 | | | | | | 1,918,457 | | | | | | 4 | | | | | | 15 | | | | | | 57,591 | | | | | | 3 | | | | | | 32.80 | | |
| Canada | | | | | | 898,740 | | | | | | — | | | | | | 172,936 | | | | | | 1,071,676 | | | | | | 2 | | | | | | 12 | | | | | | 17,222 | | | | | | 1 | | | | | | 22.01 | | |
| Properties held for sale | | | | | | 1,049,135 | | | | | | — | | | | | | — | | | | | | 1,049,135 | | | | | | 2 | | | | | | 7 | | | | | | 26,907 | | | | | | 1 | | | | | | N/A | | |
| North America | | | | | | 42,023,993 | | | | | | 3,205,307 | | | | | | 1,999,185 | | | | | | 47,228,485 | | | | | | 100 | | % | | | | 411 | | | | | | $ | 2,168,170 | | | | | 100 | | % | | | | $ | 56.08 | |
| | | | | | | | | | | | | 5,204,492 | | | | | | | | | | | | | | | | | | | | | | | | | | | | | | | | | | | | | | | | | | | | |
(1)Primarily relates to our active redevelopment projects at 840 Winter Street and 40, 50, and 60 Sylvan Road, aggregating 716,604 RSF located in our Alexandria Center® for Life Science – Waltham mega campus, which are 43% leased/negotiating on a combined basis.
This mega campus project is expected to capture demand in our Route 128 submarket of Greater Boston.
(1)Occupancy in our New York City market includes vacancy at our Alexandria Center® for Life Science – Long Island City property that is 41.7% occupied as of December 31, 2023.
In addition, our mega campus at Alexandria Center® for Life Science – New York City is 95.8% occupied as of December 31, 2023.
| 1 | | | | | | Moderna, Inc. | | | | | | | | | 13.2 | | | | | | | | | | | | 1,370,536 | | | | | | | | | | | | $ | 122,763 | | | | | | | | 5.7 | | % | | | | | | | — | | | | | | — | | | | | | $ | 47.4 | | | | |
| 2 | | | | | | Eli Lilly and Company | | | | | | | | | 9.1 | | | | | | | | | | | | 1,154,917 | | | | | | | | | | | | 93,815 | | | | | | | | | 4.3 | | | | | | | | | A2 | | | | | | A+ | | | | | | $ | 440.5 | | | | |
| 3 | | | | | | Bristol-Myers Squibb Company | | | | | | | | | 6.7 | | | | | | | | | | | | 852,830 | | | | | | | | | | | | 66,339 | | | | | | | | | 3.1 | | | | | | | | | A2 | | | | | | A+ | | | | | | $ | 131.5 | | | | |
| 4 | | | | | | Roche | | | | | | | | | 6.4 | | | | | | | | | | | | 770,279 | | | | | | | | | | | | 46,192 | | | | | | | | | 2.1 | | | | | | | | | Aa2 | | | | | | AA | | | | | | $ | 242.1 | | | | |
| 6 | | | | | | Alphabet Inc. | | | | | | | | | 2.9 | | | | | | | | | | | | 654,423 | | | | | | | | | | | | 36,809 | | | | | | | | | 1.7 | | | | | | | | | Aa2 | | | | | | AA+ | | | | | | $ | 1,509.5 | | | | |
| 7 | | | | | | Illumina, Inc. | | | | | | | | | 6.6 | | | | | | | | | | | | 890,389 | | | | | | | | | | | | 36,204 | | | | | | | | | 1.7 | | | | | | | | | Baa3 | | | | | | BBB | | | | | | $ | 27.9 | | | | |
| 9 | | | | | | Harvard University | | | | | | | | | 6.0 | | | | | | | | | | | | 389,233 | | | | | | | | | | | | 32,494 | | | | | | | | | 1.5 | | | | | | | | | Aaa | | | | | | AAA | | | | | | $ | — | | | | |
| 10 | | | | | | Novartis AG | | | | | | | | | 4.6 | | | | | | | | | | | | 450,563 | | | | | | | | | | | | 31,196 | | | | | | | | | 1.4 | | | | | | | | | A1 | | | | | | AA- | | | | | | $ | 221.7 | | | | |
| 12 | | | | | | Uber Technologies, Inc. | | | | | | | | | 58.7 | | | (4) | | | | | | | | | 1,009,188 | | | | | | | | | | | | 27,750 | | | | | | | | | 1.3 | | | | | | | | | — | | | | | | — | | | | | | $ | 84.8 | | | | |
| 13 | | | | | | Pfizer Inc. | | | | | | | | | 1.2 | | | (5) | | | | | | | | | 524,159 | | | | | | | | | | | | 25,242 | | | | | | | | | 1.2 | | | | | | | | | A1 | | | | | | A+ | | | | | | $ | 208.5 | | | | |
| 14 | | | | | | AstraZeneca PLC | | | | | | | | | 6.0 | | | | | | | | | | | | 416,761 | | | | | | | | | | | | 24,583 | | | | | | | | | 1.1 | | | | | | | | | A3 | | | | | | A | | | | | | $ | 212.5 | | | | |
| 15 | | | | | | United States Government | | | | | | | | | 6.8 | | | | | | | | | | | | 340,238 | | | | | | | | | | | | 23,023 | | | | | | | | | 1.1 | | | | | | | | | Aaa | | | | | | AA+ | | | | | | $ | — | | | | |
| 16 | | | | | | Sanofi | | | | | | | | | 7.0 | | | | | | | | | | | | 267,278 | | | | | | | | | | | | 21,444 | | | | | | | | | 1.0 | | | | | | | | | A1 | | | | | | AA | | | | | | $ | 129.2 | | | | |
| 17 | | | | | | New York University | | | | | | | | | 8.1 | | | | | | | | | | | | 218,983 | | | | | | | | | | | | 21,056 | | | | | | | | | 1.0 | | | | | | | | | Aa2 | | | | | | AA- | | | | | | $ | — | | | | |
| 18 | | | | | | Massachusetts Institute of Technology | | | | | | | | | 5.4 | | | | | | | | | | | | 246,725 | | | | | | | | | | | | 20,504 | | | | | | | | | 0.9 | | | | | | | | | Aaa | | | | | | AAA | | | | | | $ | — | | | | |
| 19 | | | | | | Boston Children’s Hospital | | | | | | | | | 12.8 | | | | | | | | | | | | 266,857 | | | | | | | | | | | | 20,066 | | | | | | | | | 0.9 | | | | | | | | | Aa2 | | | | | | AA | | | | | | $ | — | | | | |
| 20 | | | | | | Merck & Co., Inc. | | | | | | | | | 9.9 | | | | | | | | | | | | 312,935 | | | | | | | | | | | | 20,033 | | | | | | | | | 0.9 | | | | | | | | | A1 | | | | | | A+ | | | | | | $ | 274.8 | | | | |
| | | | | | | Total/weighted-average | | | | | | | | | 9.6 | | | (4) | | | | | | | | | 11,290,872 | | | | | | | | | | | | $ | 769,066 | | | | | | | | 35.5 | | % | | | | | | | | | | | | | | | | | | | | | | | | |
Additionally, 90.0% of the annual rental revenue generated by 2seventy bio, Inc. is guaranteed by another public biotechnology company (a party related to 2seventy bio, Inc.).
This lease with Cloud Software Group, Inc. (formerly known as TIBCO Software, Inc.) was in place when we acquired the properties.
(5)Primarily relates to one office building in our New York City submarket aggregating 349,947 RSF with a contractual lease expiration in the third quarter of 2024, which was classified as held for sale as of December 31, 2023.
| 92% | | | | | | 52% | | |
| Long-Duration Lease Terms | | | | | | | | |
As of December 31, 2022:
| Greater Boston | | | | | | 11,450,547 | | | | | | 1,546,965 | | | | | | 1,200,173 | | | | | | 14,197,685 | | | | | | 30 | | % | | | | 84 | | | | | | $ | 731,010 | | | | | 36 | | % | | | | $ | 67.58 | |
| San Francisco Bay Area | | | | | | 8,100,245 | | | | | | 443,388 | | | | | | 300,010 | | | | | | 8,843,643 | | | | | | 19 | | | | | | 67 | | | | | | 452,191 | | | | | | 23 | | | | | | 61.88 | | |
| New York City | | | | | | 1,270,019 | | | | | | — | | | | | | — | | | | | | 1,270,019 | | | | | | 3 | | | | | | 5 | | | | | | 97,413 | | | | | | 5 | | | | | | 83.14 | | |
| San Diego | | | | | | 8,099,957 | | | | | | 254,771 | | | | | | — | | | | | | 8,354,728 | | | | | | 18 | | | | | | 94 | | | | | | 330,713 | | | | | | 16 | | | | | | 42.79 | | |
| Seattle | | | | | | 2,814,446 | | | | | | 311,631 | | | | | | 213,976 | | | | | | 3,340,053 | | | | | | 7 | | | | | | 46 | | | | | | 109,029 | | | | | | 5 | | | | | | 39.95 | | |
| Maryland | | | | | | 3,459,475 | | | | | | 282,000 | | | | | | 91,134 | | | | | | 3,832,609 | | | | | | 8 | | | | | | 50 | | | | | | 115,347 | | | | | | 6 | | | | | | 35.12 | | |
| Research Triangle | | | | | | 3,596,979 | | | | | | 268,038 | | | | | | 376,871 | | | | | | 4,241,888 | | | | | | 9 | | | | | | 42 | | | | | | 99,055 | | | | | | 5 | | | | | | 29.31 | | |
| Texas | | | | | | 1,724,585 | | | | | | — | | | | | | 201,499 | | | | | | 1,926,084 | | | | | | 4 | | | | | | 15 | | | | | | 45,785 | | | | | | 2 | | | | | | 29.11 | | |
| Canada | | | | | | 577,225 | | | | | | — | | | | | | 107,081 | | | | | | 684,306 | | | | | | 1 | | | | | | 8 | | | | | | 9,868 | | | | | | 1 | | | | | | 21.15 | | |
| North America | | | | | | 41,773,722 | | | | | | 3,106,793 | | | | | | 2,490,744 | | | | | | 47,371,259 | | | | | | 100 | | % | | | | 432 | | | | | | $ | 2,007,441 | | | | | 100 | | % | | | | $ | 51.75 | |
| | | | | | | | | | | | | 5,597,537 | | | | | | | | | | | | | | | | | | | | | | | | | | | | | | | | | | | | | | | | | | | | |
(1)Represents properties held for sale in three submarkets, including eight contiguous properties aggregating 128,870 RSF in a non-core submarket.
| 1 | | | | | | Bristol-Myers Squibb Company | | | | | | | | | 4.3 | | | | | | | | | | | | 962,439 | | | | | | | | | | | | $ | 69,870 | | | | | | | | 3.5 | | % | | | | | | | A2 | | | | | | A+ | | | | | | $ | 156.1 | | | | |
| 2 | | | | | | Moderna, Inc. | | | | | | | | | 13.8 | | | | | | | | | | | | 908,340 | | | | | | | | | | | | 51,926 | | | | | | | | | 2.6 | | | | | | | | | — | | | | | | — | | | | | | $ | 62.1 | | | | |
| 3 | | | | | | Eli Lilly and Company | | | | | | | | | 6.2 | | | | | | | | | | | | 743,267 | | | | | | | | | | | | 49,890 | | | | | | | | | 2.5 | | | | | | | | | A2 | | | | | | A+ | | | | | | $ | 292.5 | | | | |
| 5 | | | | | | Illumina, Inc. | | | | | | | | | 7.6 | | | | | | | | | | | | 891,495 | | | | | | | | | | | | 36,204 | | | | | | | | | 1.8 | | | | | | | | | Baa3 | | | | | | BBB | | | | | | $ | 40.2 | | | | |
| 6 | | | | | | Sanofi | | | | | | | | | 7.6 | | | | | | | | | | | | 434,648 | | | | | | | | | | | | 34,104 | | | | | | | | | 1.7 | | | | | | | | | A1 | | | | | | AA | | | | | | $ | 122.2 | | | | |
| 8 | | | | | | Novartis AG | | | | | | | | | 5.6 | | | | | | | | | | | | 447,831 | | | | | | | | | | | | 30,749 | | | | | | | | | 1.5 | | | | | | | | | A1 | | | | | | AA- | | | | | | $ | 206.3 | | | | |
| 10 | | | | | | Uber Technologies, Inc. | | | | | | | | | 59.7 | | | (4) | | | | | | | | | 1,009,188 | | | | | | | | | | | | 27,704 | | | | | | | | | 1.4 | | | | | | | | | — | | | | | | — | | | | | | $ | 57.7 | | | | |
| 11 | | | | | | Roche | | | | | | | | | 6.5 | | | | | | | | | | | | 417,011 | | | | | | | | | | | | 27,188 | | | | | | | | | 1.4 | | | | | | | | | Aa2 | | | | | | AA | | | | | | $ | 290.6 | | | | |
| 12 | | | | | | Amgen Inc. | | | | | | | | | 3.5 | | | | | | | | | | | | 503,832 | | | | | | | | | | | | 24,680 | | | | | | | | | 1.2 | | | | | | | | | Baa1 | | | | | | BBB+ | | | | | | $ | 133.2 | | | | |
| 13 | | | | | | Pfizer Inc. | | | | | | | | | 1.7 | | | | | | | | | | | | 416,996 | | | | | | | | | | | | 22,376 | | | | | | | | | 1.1 | | | | | | | | | A1 | | | | | | A+ | | | | | | $ | 280.1 | | | | |
| 14 | | | | | | Massachusetts Institute of Technology | | | | | | | | | 6.1 | | | | | | | | | | | | 257,626 | | | | | | | | | | | | 21,438 | | | | | | | | | 1.1 | | | | | | | | | Aaa | | | | | | AAA | | | | | | $ | — | | | | |
| 15 | | | | | | Harvard University | | | | | | | | | 2.0 | | | (3) | | | | | | | | | 286,580 | | | | | | | | | | | | 20,086 | | | | | | | | | 1.0 | | | | | | | | | Aaa | | | | | | AAA | | | | | | $ | — | | | | |
| 16 | | | | | | Boston Children’s Hospital | | | | | | | | | 13.8 | | | | | | | | | | | | 269,816 | | | | | | | | | | | | 20,066 | | | | | | | | | 1.0 | | | | | | | | | Aa2 | | | | | | AA | | | | | | $ | — | | | | |
| 17 | | | | | | United States Government | | | | | | | | | 7.3 | | | | | | | | | | | | 315,908 | | | | | | | | | | | | 19,660 | | | | | | | | | 1.0 | | | | | | | | | Aaa | | | | | | AA+ | | | | | | $ | — | | | | |
| 18 | | | | | | New York University | | | | | | | | | 8.9 | | | | | | | | | | | | 203,500 | | | | | | | | | | | | 19,241 | | | | | | | | | 1.0 | | | | | | | | | Aa1 | | | | | | AA+ | | | | | | $ | — | | | | |
| 19 | | | | | | Merck & Co., Inc. | | | | | | | | | 11.3 | | | | | | | | | | | | 300,930 | | | | | | | | | | | | 18,913 | | | | | | | | | 0.9 | | | | | | | | | A1 | | | | | | A+ | | | | | | $ | 227.3 | | | | |
| 20 | | | | | | AstraZeneca PLC | | | | | | | | | 3.8 | | | | | | | | | | | | 348,363 | | | | | | | | | | | | 18,641 | | | | | | | | | 0.9 | | | | | | | | | A3 | | | | | | A | | | | | | $ | 195.1 | | | | |
| | | | | | | Total/weighted average | | | | | | | | | 9.4 | | | (4) | | | | | | | | | 9,872,348 | | | | | | | | | | | | $ | 612,289 | | | | | | | | 30.6 | | % | | | | | | | | | | | | | | | | | | | | | | | | |
Represents the percentage of our annual rental revenue generated by our top 20 tenants that are also investment-grade or publicly traded large cap tenants.
(2)Represents two leases in our Greater Boston and Seattle markets with in-place cash rents that are 20%–25% below current market.
The leases with these tenants were in place when we acquired the properties.
| 48% | | | | | | 7.1 Years | | |
| of ARE’s Total | | | | | | Weighted-Average | | |
| 90% | | | | | | | | |
| | | | | | | | | | | | | | | |
| Industry Mix of Approximately 1,000 Tenants | | | | | | | | | | | | AAA Locations | | |
| 96% | | | | | | | | | | | | | | |
An excerpt. Shown here: 40 of 335 rewritten, 40 of 376 added and 40 of 304 removed. The counts are complete. For every sentence, read Item 2. PROPERTIES in the FY2023 filing and the FY2022 filing.
Item 5. MARKET FOR REGISTRANT’S COMMON EQUITY, RELATED STOCKHOLDER MATTERS, AND ISSUER PURCHASES OF EQUITY SECURITIES
2 rewritten, 0 added, 1 removed, 8 unchanged
Our common stock is traded on the NYSE under the symbol “ARE.” On January [removed: 13, 2023,] [added: 12, 2024,] the last reported sales price per share of our common stock was [removed: $155.57,] [added: $126.25,] and there were [removed: 683] [added: 622] holders of record of our common stock (excluding beneficial owners whose shares are held in the name of Cede & Co.).
As of December 31, [removed: 2022,] [added: 2023,] we had no outstanding shares of preferred stock.
From the date of issuance of our preferred stock through December 31, 2022, we have paid full cumulative dividends on our preferred stock.
Item 9A. CONTROLS AND PROCEDURES
10 rewritten, 1 added, 1 removed, 27 unchanged
As of December 31, [removed: 2022,] [added: 2023,] we had performed an evaluation, under the supervision of our principal executive officers and principal financial officer of the effectiveness of the design and operation of our disclosure controls and procedures.
Based on our evaluation, the principal executive officers and principal financial officer concluded that our disclosure controls and procedures were effective as of December 31, [removed: 2022.][added: 2023.]
There has not been any change in our internal control over financial reporting during the three months ended December 31, [removed: 2022,] [added: 2023] that has materially affected, or is reasonably likely to materially affect, our internal control over financial reporting.
Management has assessed the effectiveness of the Company’s internal control over financial reporting as of December 31, [removed: 2022] [added: 2023] and [removed: 2021.][added: 2022.]
Management concluded that based on its assessment, the Company’s internal control over financial reporting was effective as of December 31, [removed: 2022.][added: 2023.]
The effectiveness of our internal control over financial reporting as of December 31, [removed: 2022,] [added: 2023] has been audited by Ernst & Young LLP, an independent registered accounting firm, as stated in its report, which is included herein.
To the Stockholders and [added: the] Board of Directors of Alexandria Real Estate Equities, Inc.
We have audited Alexandria Real Estate Equities, Inc.’s internal control over financial reporting as of December 31, [removed: 2022,] [added: 2023,] based on criteria established in Internal Control-Integrated Framework issued by the Committee of Sponsoring Organizations of the Treadway Commission (2013 framework) (the COSO criteria).
In our opinion, Alexandria Real Estate Equities, Inc. (the Company) maintained, in all material respects, effective internal control over financial reporting as of December 31, [removed: 2022,] [added: 2023,] based on the COSO criteria.
We also have audited, in accordance with the standards of the Public Company Accounting Oversight Board (United States) (PCAOB), the consolidated balance sheets of the Company as of December 31, [removed: 2022 and 2021,] [added: 2023] and [added: 2022,] the related consolidated statements of operations, comprehensive income, changes in stockholders’ equity and noncontrolling [removed: interests,] [added: interests] and cash flows for each of the three years in the period ended December 31, [removed: 2022] [added: 2023] and the related notes and financial statement [removed: schedule,] [added: schedule listed in the Index at Item 15] and our report dated January [removed: 30, 2023,] [added: 29, 2024,] expressed an unqualified opinion thereon.
January 29, 2024
January 30, 2023
Item 9B. OTHER INFORMATION
0 rewritten, 2 added, 1 removed, 0 unchanged
Disclosure of 10b5-1 plans
None of our officers or directors had any contract, instruction, or written plan for the purchase or sale of our securities that was intended to satisfy the affirmative defense conditions of Rule 10b5-1(c) or any “non-Rule 10b5-1 trading arrangement” in effect at any time during the year ended December 31, 2023.
None.
Item 10. DIRECTORS, EXECUTIVE OFFICERS, AND CORPORATE GOVERNANCE
1 rewritten, 0 added, 0 removed, 0 unchanged
The information required by this Item is incorporated herein by reference from our definitive proxy statement for our [removed: 2023] [added: 2024] annual meeting of stockholders to be filed pursuant to Regulation 14A within 120 days after the end of our fiscal year (the [removed: “2023] [added: “2024] Proxy Statement”) under the captions “Directors and Executive Officers” and “Corporate Governance Guidelines and Code of Ethics.”
Item 11. EXECUTIVE COMPENSATION
1 rewritten, 0 added, 0 removed, 0 unchanged
The information required by this Item is incorporated herein by reference from our [removed: 2023] [added: 2024] Proxy Statement under the caption “Executive Compensation.”
Item 12. SECURITY OWNERSHIP OF CERTAIN BENEFICIAL OWNERS AND MANAGEMENT AND RELATED STOCKHOLDER MATTERS
3 rewritten, 0 added, 0 removed, 4 unchanged
The following table sets forth information on the Company’s equity compensation plan as of December 31, [removed: 2022:][added: 2023:]
| Equity Compensation Plan Approved by Stockholders — Amended and Restated 1997 Stock Award and Incentive Plan | | | | | | — | | | | | | — | | | | | | [removed: 3,838,370] [added: 2,708,800] | | |
The other information required by this Item is incorporated herein by reference from our [removed: 2023] [added: 2024] Proxy Statement under the caption “Security Ownership of Certain Beneficial Owners and Management.”
Item 13. CERTAIN RELATIONSHIPS AND RELATED TRANSACTIONS, AND DIRECTOR INDEPENDENCE
1 rewritten, 0 added, 0 removed, 0 unchanged
The information required by this Item is incorporated herein by reference from our [removed: 2023] [added: 2024] Proxy Statement under the captions “Certain Relationships and Related Transactions,” “Policies and Procedures with Respect to Related-Person Transactions,” and “Director Independence.”
Item 14. PRINCIPAL ACCOUNTANT FEES AND SERVICES
1 rewritten, 0 added, 0 removed, 1 unchanged
The information required by this Item is incorporated herein by reference from our [removed: 2023] [added: 2024] Proxy Statement under the caption “Fees Billed by Independent Registered Public Accountants.”
Item 15. EXHIBITS AND FINANCIAL STATEMENT SCHEDULES
598 rewritten, 296 added, 232 removed, 1,129 unchanged
| [Report of Independent Registered Public Accounting [removed: Firm](#i87a291e67d5f4e61841d9becadb050e6_352)] [added: Firm](#i52f8234930b849d98ad87af06dc4dc6d_340)] (PCAOB ID: 00042) | | | [removed: F-[1](#i87a291e67d5f4e61841d9becadb050e6_352)] [added: F-[1](#i52f8234930b849d98ad87af06dc4dc6d_340)] | | |
| [Consolidated Balance Sheets as of December [removed: 31,](#i87a291e67d5f4e61841d9becadb050e6_355) 2022] [added: 31,](#i52f8234930b849d98ad87af06dc4dc6d_343) 2023] and [removed: 2021] [added: 2022] | | | [removed: F-[3](#i87a291e67d5f4e61841d9becadb050e6_355)] [added: F-[3](#i52f8234930b849d98ad87af06dc4dc6d_343)] | | |
| Consolidated Financial Statements for the Years Ended December 31, [added: 2023,] 2022, [removed: 2021,] and [removed: 2020:] [added: 2021:] | | | | | |
| [Consolidated Statements of [removed: Operations](#i87a291e67d5f4e61841d9becadb050e6_358)] [added: Operations](#i52f8234930b849d98ad87af06dc4dc6d_346)] | | | [removed: F-[4](#i87a291e67d5f4e61841d9becadb050e6_358)] [added: F-[4](#i52f8234930b849d98ad87af06dc4dc6d_346)] | | |
| [Consolidated Statements of Comprehensive [removed: Income](#i87a291e67d5f4e61841d9becadb050e6_361)] [added: Income](#i52f8234930b849d98ad87af06dc4dc6d_349)] | | | [removed: F-[5](#i87a291e67d5f4e61841d9becadb050e6_361)] [added: F-[5](#i52f8234930b849d98ad87af06dc4dc6d_349)] | | |
| [Consolidated Statements of Changes in Stockholders’ Equity and Noncontrolling [removed: Interests](#i87a291e67d5f4e61841d9becadb050e6_364)] [added: Interests](#i52f8234930b849d98ad87af06dc4dc6d_352)] | | | [removed: F-[6](#i87a291e67d5f4e61841d9becadb050e6_364)] [added: F-[6](#i52f8234930b849d98ad87af06dc4dc6d_352)] | | |
| [Consolidated Statements of Cash [removed: Flows](#i87a291e67d5f4e61841d9becadb050e6_367)] [added: Flows](#i52f8234930b849d98ad87af06dc4dc6d_355)] | | | [removed: F-[8](#i87a291e67d5f4e61841d9becadb050e6_367)] [added: F-[8](#i52f8234930b849d98ad87af06dc4dc6d_355)] | | |
| [Notes to Consolidated Financial [removed: Statements](#i87a291e67d5f4e61841d9becadb050e6_370)] [added: Statements](#i52f8234930b849d98ad87af06dc4dc6d_358)] | | | [removed: F-[10](#i87a291e67d5f4e61841d9becadb050e6_370)] [added: F-[10](#i52f8234930b849d98ad87af06dc4dc6d_358)] | | |
| [Schedule III – Consolidated Financial Statement Schedule of Real Estate and Accumulated [removed: Depreciation](#i87a291e67d5f4e61841d9becadb050e6_580)] [added: Depreciation](#i52f8234930b849d98ad87af06dc4dc6d_550)] | | | [removed: F-[50](#i87a291e67d5f4e61841d9becadb050e6_580)] [added: F-[51](#i52f8234930b849d98ad87af06dc4dc6d_550)] | | |
| 3.13* | | | | | | [Amended and Restated Bylaws of the Company (Amended [removed: July 27, 2018)](http://www.sec.gov/Archives/edgar/data/1035443/000103544318000159/ex31amendedrestatedbylaws2.htm)] [added: September 21, 2023)](http://www.sec.gov/Archives/edgar/data/1035443/000110465923103189/tm2326383d1_ex3-1.htm)] | | | | | | Form 8-K | | | | | | [removed: August 2, 2018] [added: September 22, 2023] | | |
| 4.4* | | | | | | [Form of 4.500% Senior [removed: Note due] [added: Note](http://www.sec.gov/Archives/edgar/data/1035443/000110465914052240/a14-17345_1ex4d4.htm)[s](http://www.sec.gov/Archives/edgar/data/1035443/000110465914052240/a14-17345_1ex4d4.htm) [due] 2029 (included in Exhibit 4.](http://www.sec.gov/Archives/edgar/data/1035443/000110465914052240/a14-17345_1ex4d4.htm)[3](http://www.sec.gov/Archives/edgar/data/1035443/000110465914052240/a14-17345_1ex4d4.htm) [above)](http://www.sec.gov/Archives/edgar/data/1035443/000110465914052240/a14-17345_1ex4d4.htm) | | | | | | Form 8-K | | | | | | July 18, 2014 | | |
| 4.7* | | | | | | [Form of 4.30% Senior [removed: Note due] [added: Note](http://www.sec.gov/Archives/edgar/data/1035443/000110465915079671/a15-15059_6ex4d2.htm)[s](http://www.sec.gov/Archives/edgar/data/1035443/000110465915079671/a15-15059_6ex4d2.htm) [due] 2026 (included in Exhibit 4.](http://www.sec.gov/Archives/edgar/data/1035443/000110465915079671/a15-15059_6ex4d2.htm)[6](http://www.sec.gov/Archives/edgar/data/1035443/000110465915079671/a15-15059_6ex4d2.htm) [above)](http://www.sec.gov/Archives/edgar/data/1035443/000110465915079671/a15-15059_6ex4d2.htm) | | | | | | Form 8-K | | | | | | November 17, 2015 | | |
| 4.9* | | | | | | [Form of 3.95% Senior [removed: Note due] [added: Note](http://www.sec.gov/Archives/edgar/data/1035443/000110465916126631/a16-12515_4ex4d2.htm)[s](http://www.sec.gov/Archives/edgar/data/1035443/000110465916126631/a16-12515_4ex4d2.htm) [due] 2027 (included in Exhibit 4.](http://www.sec.gov/Archives/edgar/data/1035443/000110465916126631/a16-12515_4ex4d2.htm)[8](http://www.sec.gov/Archives/edgar/data/1035443/000110465916126631/a16-12515_4ex4d2.htm) [above)](http://www.sec.gov/Archives/edgar/data/1035443/000110465916126631/a16-12515_4ex4d2.htm) | | | | | | Form 8-K | | | | | | June 10, 2016 | | |
| 4.12* | | | | | | [Form of 3.95% Senior [removed: Note due] [added: Note](http://www.sec.gov/Archives/edgar/data/1035443/000110465917014067/a17-6800_7ex4d2.htm)[s](http://www.sec.gov/Archives/edgar/data/1035443/000110465917014067/a17-6800_7ex4d2.htm) [due] 2028 (included in Exhibit 4.1](http://www.sec.gov/Archives/edgar/data/1035443/000110465917014067/a17-6800_7ex4d2.htm)[1](http://www.sec.gov/Archives/edgar/data/1035443/000110465917014067/a17-6800_7ex4d2.htm) [above)](http://www.sec.gov/Archives/edgar/data/1035443/000110465917014067/a17-6800_7ex4d2.htm) | | | | | | Form 8-K | | | | | | March 3, 2017 | | |
| 4.14* | | | | | | [Form of 3.45% Senior [removed: Note due] [added: Note](http://www.sec.gov/Archives/edgar/data/1035443/000110465917069638/a17-27363_1ex4d2.htm)[s](http://www.sec.gov/Archives/edgar/data/1035443/000110465917069638/a17-27363_1ex4d2.htm) [due] 2025 (included in Exhibit 4.1](http://www.sec.gov/Archives/edgar/data/1035443/000110465917069638/a17-27363_1ex4d2.htm)[3](http://www.sec.gov/Archives/edgar/data/1035443/000110465917069638/a17-27363_1ex4d2.htm) [above)](http://www.sec.gov/Archives/edgar/data/1035443/000110465917069638/a17-27363_1ex4d2.htm) | | | | | | Form 8-K | | | | | | November 20, 2017 | | |
| 4.17* | | | | | | [Form of 4.700% Senior [removed: Note Due] [added: Note](http://www.sec.gov/Archives/edgar/data/1035443/000110465918041555/a18-15110_6ex4d4.htm)[s](http://www.sec.gov/Archives/edgar/data/1035443/000110465918041555/a18-15110_6ex4d4.htm) [](http://www.sec.gov/Archives/edgar/data/1035443/000110465918041555/a18-15110_6ex4d4.htm)[d](http://www.sec.gov/Archives/edgar/data/1035443/000110465918041555/a18-15110_6ex4d4.htm)[ue] 2030 (included in Exhibit 4.](http://www.sec.gov/Archives/edgar/data/1035443/000110465918041555/a18-15110_6ex4d4.htm)[16](http://www.sec.gov/Archives/edgar/data/1035443/000110465918041555/a18-15110_6ex4d4.htm) [above)](http://www.sec.gov/Archives/edgar/data/1035443/000110465918041555/a18-15110_6ex4d4.htm) | | | | | | Form 8-K | | | | | | June 21, 2018 | | |
| 4.19* | | | | | | [Form of 3.800% Senior [removed: Note Due] [added: Note](http://www.sec.gov/Archives/edgar/data/1035443/000110465919016579/a19-6216_4ex4d5.htm#Exhibit4_5_020007)[s](http://www.sec.gov/Archives/edgar/data/1035443/000110465919016579/a19-6216_4ex4d5.htm#Exhibit4_5_020007) [](http://www.sec.gov/Archives/edgar/data/1035443/000110465919016579/a19-6216_4ex4d5.htm#Exhibit4_5_020007)[d](http://www.sec.gov/Archives/edgar/data/1035443/000110465919016579/a19-6216_4ex4d5.htm#Exhibit4_5_020007)[ue] 2026 (included in Exhibit 4.](http://www.sec.gov/Archives/edgar/data/1035443/000110465919016579/a19-6216_4ex4d5.htm#Exhibit4_5_020007)[18](http://www.sec.gov/Archives/edgar/data/1035443/000110465919016579/a19-6216_4ex4d5.htm#Exhibit4_5_020007) [above)](http://www.sec.gov/Archives/edgar/data/1035443/000110465919016579/a19-6216_4ex4d5.htm#Exhibit4_5_020007) | | | | | | Form 8-K | | | | | | March 21, 2019 | | |
| 4.21* | | | | | | [Form of 4.850% Senior [removed: Note Due] [added: Note](http://www.sec.gov/Archives/edgar/data/1035443/000110465919016579/a19-6216_4ex4d7.htm#Exhibit4_7_015811)[s](http://www.sec.gov/Archives/edgar/data/1035443/000110465919016579/a19-6216_4ex4d7.htm#Exhibit4_7_015811) [](http://www.sec.gov/Archives/edgar/data/1035443/000110465919016579/a19-6216_4ex4d7.htm#Exhibit4_7_015811)[d](http://www.sec.gov/Archives/edgar/data/1035443/000110465919016579/a19-6216_4ex4d7.htm#Exhibit4_7_015811)[ue] 2049 (included in Exhibit 4.2](http://www.sec.gov/Archives/edgar/data/1035443/000110465919016579/a19-6216_4ex4d7.htm#Exhibit4_7_015811)[0](http://www.sec.gov/Archives/edgar/data/1035443/000110465919016579/a19-6216_4ex4d7.htm#Exhibit4_7_015811) [above)](http://www.sec.gov/Archives/edgar/data/1035443/000110465919016579/a19-6216_4ex4d7.htm#Exhibit4_7_015811) | | | | | | Form 8-K | | | | | | March 21, 2019 | | |
| 4.23* | | | | | | [Form of 3.375% Senior [removed: Note Due] [added: Note](http://www.sec.gov/Archives/edgar/data/1035443/000110465919040367/a19-12475_6ex4d2.htm#Exhibit4_2_074540)[s](http://www.sec.gov/Archives/edgar/data/1035443/000110465919040367/a19-12475_6ex4d2.htm#Exhibit4_2_074540) [](http://www.sec.gov/Archives/edgar/data/1035443/000110465919040367/a19-12475_6ex4d2.htm#Exhibit4_2_074540)[d](http://www.sec.gov/Archives/edgar/data/1035443/000110465919040367/a19-12475_6ex4d2.htm#Exhibit4_2_074540)[ue] 2031 (included in Exhibit 4.2](http://www.sec.gov/Archives/edgar/data/1035443/000110465919040367/a19-12475_6ex4d2.htm#Exhibit4_2_074540)[2](http://www.sec.gov/Archives/edgar/data/1035443/000110465919040367/a19-12475_6ex4d2.htm#Exhibit4_2_074540) [above)](http://www.sec.gov/Archives/edgar/data/1035443/000110465919040367/a19-12475_6ex4d2.htm#Exhibit4_2_074540) | | | | | | Form 8-K | | | | | | July 15, 2019 | | |
| 4.26* | | | | | | [Form of 4.000% Senior [removed: Note Due] [added: Note](http://www.sec.gov/Archives/edgar/data/1035443/000110465919040367/a19-12475_6ex4d4.htm#Exhibit4_4_070229)[s](http://www.sec.gov/Archives/edgar/data/1035443/000110465919040367/a19-12475_6ex4d4.htm#Exhibit4_4_070229) [](http://www.sec.gov/Archives/edgar/data/1035443/000110465919040367/a19-12475_6ex4d4.htm#Exhibit4_4_070229)[d](http://www.sec.gov/Archives/edgar/data/1035443/000110465919040367/a19-12475_6ex4d4.htm#Exhibit4_4_070229)[ue] 2050 (included in Exhibit 4.2](http://www.sec.gov/Archives/edgar/data/1035443/000110465919040367/a19-12475_6ex4d4.htm#Exhibit4_4_070229)[5](http://www.sec.gov/Archives/edgar/data/1035443/000110465919040367/a19-12475_6ex4d4.htm#Exhibit4_4_070229) [above)](http://www.sec.gov/Archives/edgar/data/1035443/000110465919040367/a19-12475_6ex4d4.htm#Exhibit4_4_070229) | | | | | | Form 8-K | | | | | | July 15, 2019 | | |
| 4.28* | | | | | | [Form of 2.750% Senior [removed: Note Due] [added: Note](http://www.sec.gov/Archives/edgar/data/1035443/000141057819001213/tv529203_ex4-2.htm)[s](http://www.sec.gov/Archives/edgar/data/1035443/000141057819001213/tv529203_ex4-2.htm) [](http://www.sec.gov/Archives/edgar/data/1035443/000141057819001213/tv529203_ex4-2.htm)[d](http://www.sec.gov/Archives/edgar/data/1035443/000141057819001213/tv529203_ex4-2.htm)[ue] 2029 (included in Exhibit 4.](http://www.sec.gov/Archives/edgar/data/1035443/000141057819001213/tv529203_ex4-2.htm)[27](http://www.sec.gov/Archives/edgar/data/1035443/000141057819001213/tv529203_ex4-2.htm) [above)](http://www.sec.gov/Archives/edgar/data/1035443/000141057819001213/tv529203_ex4-2.htm) | | | | | | Form 8-K | | | | | | September 12, 2019 | | |
| 4.30* | | | | | | [Form of 4.900% Senior [removed: Note due] [added: Note](http://www.sec.gov/Archives/edgar/data/1035443/000110465920038807/tm2012803d4_ex4-2.htm)[s](http://www.sec.gov/Archives/edgar/data/1035443/000110465920038807/tm2012803d4_ex4-2.htm) [due] 2030 (included in Exhibit 4.29 above)](http://www.sec.gov/Archives/edgar/data/1035443/000110465920038807/tm2012803d4_ex4-2.htm) | | | | | | Form 8-K | | | | | | March 26, 2020 | | |
| 4.37* | | | | | | [Supplemental Indenture [removed: No.](http://www.sec.gov/Archives/edgar/data/1035443/000110465922024245/tm224710d6_ex4-2.htm) [](http://www.sec.gov/Archives/edgar/data/1035443/000110465922024245/tm224710d6_ex4-2.htm)[16,] [added: No. 16,] dated February [removed: 1](http://www.sec.gov/Archives/edgar/data/1035443/000110465922024245/tm224710d6_ex4-2.htm)[6](http://www.sec.gov/Archives/edgar/data/1035443/000110465922024245/tm224710d6_ex4-2.htm)[,] [added: 16,] 2022, among the Company, as Issuer, Alexandria Real Estate Equities, L.P. as [removed: Guarantor,](http://www.sec.gov/Archives/edgar/data/1035443/000110465922024245/tm224710d6_ex4-2.htm) [](http://www.sec.gov/Archives/edgar/data/1035443/000110465922024245/tm224710d6_ex4-2.htm)[and Tru](http://www.sec.gov/Archives/edgar/data/1035443/000110465922024245/tm224710d6_ex4-2.htm)[i](http://www.sec.gov/Archives/edgar/data/1035443/000110465922024245/tm224710d6_ex4-2.htm)[st] [added: Guarantor, and Truist] Bank, as Trustee](http://www.sec.gov/Archives/edgar/data/1035443/000110465922024245/tm224710d6_ex4-2.htm) | | | | | | Form 8-K | | | | | | February 16, 2022 | | |
| 4.39* | | | | | | [Supplemental Indenture No. 17, dated February [removed: 1](http://www.sec.gov/Archives/edgar/data/1035443/000110465922024245/tm224710d6_ex4-4.htm)[6](http://www.sec.gov/Archives/edgar/data/1035443/000110465922024245/tm224710d6_ex4-4.htm)[,] [added: 16,] 2022, among the Company, as Issuer, Alexandria Real Estate Equities, L.P., as Guarantor, and [removed: Tru](http://www.sec.gov/Archives/edgar/data/1035443/000110465922024245/tm224710d6_ex4-4.htm)[i](http://www.sec.gov/Archives/edgar/data/1035443/000110465922024245/tm224710d6_ex4-4.htm)[st] [added: Truist] Bank, as Trustee](http://www.sec.gov/Archives/edgar/data/1035443/000110465922024245/tm224710d6_ex4-4.htm) | | | | | | Form 8-K | | | | | | February 16, 2022 | | |
| [removed: 4.41] [added: 4.45] | | | | | | [Description of Registrant’s Securities Registered Pursuant to Section 12 of the Securities Exchange Act of [removed: 1934](https://www.sec.gov/Archives/edgar/data/1035443/000103544323000099/a4q22-ex441.htm)] [added: 1934](https://www.sec.gov/Archives/edgar/data/1035443/000103544324000072/a4q23-ex445.htm)] | | | | | | N/A | | | | | | Filed herewith | | |
| [removed: 10.2*] [added: 10.2*(1)] | | | [removed: (1)] | | | [Amended and Restated 1997 Stock Award and Incentive Plan of the Company](http://www.sec.gov/Archives/edgar/data/1035443/000103544322000166/a20228-kproxyresultsxex101.htm) | | | | | | Form 8-K | | | | | | May 19, 2022 | | |
| [removed: 10.3*] [added: 10.3*(1)] | | | [removed: (1)] | | | [Form of Non-Employee Director Stock Option Agreement for use in connection with options issued pursuant to the Amended and Restated 1997 Stock Award and Incentive Plan](http://www.sec.gov/Archives/edgar/data/1035443/0000898430-97-001864.txt) | | | | | | Form S-11 | | | | | | May 5, 1997 | | |
| [removed: 10.4*] [added: 10.4*(1)] | | | [removed: (1)] | | | [Form of Incentive Stock Option Agreement for use in connection with options issued pursuant to the Amended and Restated 1997 Stock Award and Incentive Plan](http://www.sec.gov/Archives/edgar/data/1035443/0000898430-97-001864.txt) | | | | | | Form S-11 | | | | | | May 5, 1997 | | |
| [removed: 10.5*] [added: 10.5*(1)] | | | [removed: (1)] | | | [Form of Nonqualified Stock Option Agreement for use in connection with options issued pursuant to the Amended and Restated 1997 Stock Award and Incentive Plan](http://www.sec.gov/Archives/edgar/data/1035443/0000898430-97-001864.txt) | | | | | | Form S-11 | | | | | | May 5, 1997 | | |
| [removed: 10.6*] [added: 10.6*(1)] | | | [removed: (1)] | | | [Form of Employee Restricted Stock Agreement for use in connection with shares of restricted stock issued to employees pursuant to the Amended and Restated 1997 Stock Award and Incentive Plan](http://www.sec.gov/Archives/edgar/data/1035443/000103544318000028/a4q17-ex108.htm) | | | | | | Form 10-K | | | | | | January 30, 2018 | | |
| [removed: 10.7*] [added: 10.7*(1)] | | | [removed: (1)] | | | [Form of Employee Restricted Stock Agreement (U.S. Affiliate) for use in connection with shares of restricted stock issued to employees pursuant to the Amended and Restated 1997 Stock Award and Incentive Plan](http://www.sec.gov/Archives/edgar/data/1035443/000103544318000028/a4q17-ex109.htm) | | | | | | Form 10-K | | | | | | January 30, 2018 | | |
| [removed: 10.8*] [added: 10.8*(1)] | | | [removed: (1)] | | | [Form of Independent Director Restricted Stock Agreement for use in connection with shares of restricted stock issued to directors pursuant to the Amended and Restated 1997 Stock Award and Incentive Plan](http://www.sec.gov/Archives/edgar/data/1035443/000103544318000028/a4q17-ex1010.htm) | | | | | | Form 10-K | | | | | | January 30, 2018 | | |
| [removed: 10.9*] [added: 10.9*(1)] | | | [removed: (1)] | | | [Form of Independent Contractor Restricted Stock Agreement for use in connection with shares of restricted stock issued to independent contractors pursuant to the Amended and Restated 1997 Stock Award and Incentive Plan](http://www.sec.gov/Archives/edgar/data/1035443/000103544318000028/a4q17-ex1011.htm) | | | | | | Form 10-K | | | | | | January 30, 2018 | | |
| [removed: 10.10*] [added: 10.10*(1)] | | | [removed: (1)] | | | [The Company’s 2000 Deferred Compensation Plan, amended and restated effective as of January 1, 2010](http://www.sec.gov/Archives/edgar/data/1035443/000110465911011479/a10-23320_1ex10d7.htm) | | | | | | Form 10-K | | | | | | March 1, 2011 | | |
| [removed: 10.11*] [added: 10.11*(1)] | | | [removed: (1)] | | | [The Company’s 2000 Deferred Compensation Plan for Directors, amended and restated effective as of January 1, 2010](http://www.sec.gov/Archives/edgar/data/1035443/000110465911011479/a10-23320_1ex10d8.htm) | | | | | | Form 10-K | | | | | | March 1, 2011 | | |
| [removed: 10.12*] [added: 10.12*(1)] | | | [removed: (1)] | | | [Amended and Restated Executive Employment Agreement, effective as of January 1, 2015, by and between the Company and Joel S. Marcus](http://www.sec.gov/Archives/edgar/data/1035443/000103544315000038/jm2015empagr.htm) | | | | | | Form 8-K | | | | | | April 7, 2015 | | |
| [removed: 10.13*] [added: 10.13*(1)] | | | [removed: (1)] | | | [Letter Amendment to Amended and Restated Executive Employment Agreement, dated July 3, 2017, by and between the Company and Joel S. Marcus](http://www.sec.gov/Archives/edgar/data/1035443/000103544317000115/ex101jmagreement.htm) | | | | | | Form 8-K | | | | | | July 3, 2017 | | |
| [removed: 10.14*] [added: 10.14*(1)] | | | [removed: (1)] | | | [Letter Amendment to Amended and Restated Executive Employment Agreement, entered into on March 20, 2018, by and between the Company and Joel S. Marcus](http://www.sec.gov/Archives/edgar/data/1035443/000103544318000087/a1q18-ex101.htm) | | | | | | Form 10-Q | | | | | | May 1, 2018 | | |
| [removed: 10.15*] [added: 10.15*(1)] | | | [removed: (1)] | | | [Letter Amendment to Amended and Restated Executive Employment Agreement, dated January 15, 2019, by and between the Company and Joel S. Marcus](http://www.sec.gov/Archives/edgar/data/1035443/000103544319000021/ex101jmagreement1-11x19.htm) | | | | | | Form 8-K | | | | | | January 18, 2019 | | |
| [removed: 10.16*] [added: 10.16*(1)] | | | [removed: (1)] | | | [Letter Amendment to Amended and Restated Executive Employment Agreement, dated June 8, 2020, by and between the Company and Joel S. Marcus](http://www.sec.gov/Archives/edgar/data/1035443/000103544320000208/a2q20-ex101.htm) | | | | | | Form 10-Q | | | | | | July 27, 2020 | | |
| 4.41* | | | | | | [Supplemental Indenture No. 18, dated as of February 16, 2023,](http://www.sec.gov/Archives/edgar/data/1035443/000110465923022816/tm236999d1_ex4-2.htm) [among the Company, as Issuer, Alexandria Real Estate Equities, L.P., as Guarantor, and Truist Bank, as Truste](http://www.sec.gov/Archives/edgar/data/1035443/000110465923022816/tm236999d1_ex4-2.htm)e | | | | | | Form 8-K | | | | | | February 16, 2023 | | |
| 4.42* | | | | | | [Form of 4.750% Senior Notes due 2035 (included in Exhibit 4.](http://www.sec.gov/Archives/edgar/data/1035443/000110465923022816/tm236999d1_ex4-2.htm)[41](http://www.sec.gov/Archives/edgar/data/1035443/000110465923022816/tm236999d1_ex4-2.htm) [above)](http://www.sec.gov/Archives/edgar/data/1035443/000110465923022816/tm236999d1_ex4-2.htm) | | | | | | Form 8-K | | | | | | February 16, 2023 | | |
| 4.43* | | | | | | [Supplemental Indenture No. 19, dated as of February 16, 2023,](http://www.sec.gov/Archives/edgar/data/1035443/000110465923022816/tm236999d1_ex4-4.htm) [among the Company, as Issuer, Alexandria Real Estate Equities, L.P., as Guarantor, and Truist Bank, as Truste](http://www.sec.gov/Archives/edgar/data/1035443/000110465923022816/tm236999d1_ex4-4.htm)e | | | | | | Form 8-K | | | | | | February 16, 2023 | | |
| 4.44* | | | | | | [Form of 5.150% Senior Notes due 2053 (included in Exhibit 4.4](http://www.sec.gov/Archives/edgar/data/1035443/000110465923022816/tm236999d1_ex4-4.htm)[3](http://www.sec.gov/Archives/edgar/data/1035443/000110465923022816/tm236999d1_ex4-4.htm) [above)](http://www.sec.gov/Archives/edgar/data/1035443/000110465923022816/tm236999d1_ex4-4.htm) | | | | | | Form 8-K | | | | | | February 16, 2023 | | |
| 10.1* | | | | | | [Second Amended and Restated Credit Agreement, dated June 28, 2023, among the Company, as Borrower, Alexandria Real Estate Equities, L.P., as a Guarantor, Citibank, N.A., as Administrative Agent, and the lenders and other parties thereto](http://www.sec.gov/Archives/edgar/data/1035443/000103544323000244/a2q23-ex101.htm) | | | | | | Form 10-Q | | | | | | July 24, 2023 | | |
| 10.17*(1) | | | | | | [Letter Amendment to Amended and Restated Executive Employment Agreement, dated August 30, 2023, by and between the Company and Joel S. Marcus](http://www.sec.gov/Archives/edgar/data/1035443/000103544323000303/a3q23-ex102.htm) | | | | | | Form 10-Q | | | | | | October 23, 2023 | | |
| 10.18(1) | | | | | | [Letter Amendment to Amended and Restated Executive Employment Agreement, dated January 5, 2024, by and between the Company and Joel S. Marcus](https://www.sec.gov/Archives/edgar/data/1035443/000103544324000072/a4q23-ex1018.htm) | | | | | | N/A | | | | | | Filed herewith | | |
| 10.20(1) | | | | | | [Letter Amendment to Amended and Restated Executive Employment Agreement, dated January 5, 2024, by and between the Company and Peter Moglia](https://www.sec.gov/Archives/edgar/data/1035443/000103544324000072/a4q23-ex1020.htm) | | | | | | N/A | | | | | | Filed herewith | | |
| 97.1(1) | | | | | | [Incentive Compensation Recoupment Policy](https://www.sec.gov/Archives/edgar/data/1035443/000103544324000072/a4q23-ex971.htm) | | | | | | N/A | | | | | | Filed herewith | | |
| Marc E. Binda | | | | | | | | | | | | | | |
| /s/ Sheila K. McGrath | | | | | | Director | | | | | | January 29, 2024 | | |
| Sheila K. McGrath | | | | | | | | | | | | | | |
Valuation of long-lived real estate assets
| *Description of the Matter* | | | | | | As more fully disclosed in Notes 2 and 3 to the consolidated financial statements, the Company monitors its long-lived real estate assets for triggering events or impairment indicators. For long-lived real estate assets classified as held for sale, an impairment charge is recognized if the carrying amount of the asset exceeds its fair value less cost to sell. During the year ended December 31, 2023, the Company recognized impairment charges totaling $461.1 million, of which $183.8 million was related to long-lived assets classified as held for sale as of December 31, 2023. Auditing the Company’s valuation of properties classified as held for sale as of December 31, 2023 is subjective due to the judgment used by management to estimate the fair values of the properties. | | |
| *How we Addressed the Matter in Our Audit* | | | | | | Our audit procedures related to the valuation of long-lived real estate assets classified as held for sale included the following procedures, among others: We tested the design and operating effectiveness of controls over the Company’s process for estimating the fair values of long-lived real estate assets classified as held for sale. We tested the Company’s valuation of long-lived real estate assets classified as held for sale by comparing the estimated values to executed agreements with potential buyers, recent comparable sales transactions, and other external market data. Our internal valuation specialists assisted us in identifying the relevant transactions and market data. | | |
January 29, 2024
| | | | 2023 | | | | | | 2022 | | |
| Balance as of December 31, 2022 | | | | | | 170,748,395 | | | | | | $ | 1,707 | | | | | $ | 18,991,492 | | | | | $ | — | | | | | $ | (20,812) | | | | | $ | 3,701,248 | | | | | $ | 22,673,635 | | | | | $ | 9,612 | |
| Net income | | | | | | — | | | | | | — | | | | | | — | | | | | | 103,639 | | | | | | — | | | | | | 176,431 | | | | | | 280,070 | | | | | | 924 | | |
| Contributions from and sales of noncontrolling interests | | | | | | — | | | | | | — | | | | | | 33,896 | | | | | | — | | | | | | — | | | | | | 508,693 | | | | | | 542,589 | | | | | | 35,250 | | |
| Transfer of noncontrolling interests | | | | | | — | | | | | | — | | | | | | — | | | | | | — | | | | | | — | | | | | | (7,766) | | | | | | (7,766) | | | | | | 7,766 | | |
| Issuance of common stock | | | | | | 699,274 | | | | | | 7 | | | | | | 103,839 | | | | | | — | | | | | | — | | | | | | — | | | | | | 103,846 | | | | | | — | | |
| Issuance pursuant to stock plan | | | | | | 798,729 | | | | | | 8 | | | | | | 156,257 | | | | | | — | | | | | | — | | | | | | — | | | | | | 156,265 | | | | | | — | | |
| Balance as of December 31, 2023 | | | | | | 171,910,599 | | | | | | $ | 1,719 | | | | | $ | 18,485,352 | | | | | $ | — | | | | | $ | (15,896) | | | | | $ | 4,135,338 | | | | | $ | 22,606,513 | | | | | $ | 16,480 | |
| Net income | | | $ | 280,994 | | | | | $ | 670,701 | | | | | $ | 654,282 | |
| Depreciation and amortization | | | 1,093,473 | | | | | | 1,002,146 | | | | | | 821,061 | | |
| Impairment of real estate | | | 461,114 | | | | | | 64,969 | | | | | | 52,675 | | |
| Loss on early extinguishment of debt | | | — | | | | | | 3,317 | | | | | | 67,253 | | |
| Transfer of real estate assets from tenants | | | $ | 31,310 | | | | | $ | — | | | | | $ | — | |
| Payable for purchase of noncontrolling interest | | | $ | (35,250) | | | | | $ | — | | | | | $ | — | |
Refer to Note 4 – “Consolidated and unconsolidated real estate joint ventures” to our consolidated financial statements for information on specific joint ventures that qualify as VIEs.
The local currency of a foreign subsidiary serves as its functional currency.
As of December 31, 2023, we had no forward equity sales agreements outstanding.
2.
SUMMARY OF SIGNIFICANT ACCOUNTING POLICIES (continued)
We adopted this accounting standard on January 1, 2024.
On August 23, 2023, the FASB issued an ASU that will require a joint venture, upon formation, to measure its assets and liabilities at fair value in its standalone financial statements.
A joint venture will recognize the difference between the fair value of its equity and the fair value of its identifiable assets and liabilities as goodwill (or an equity adjustment, if negative) using the business combination accounting guidance regardless of whether the net assets meet the definition of a business.
The new accounting standard is intended to reduce diversity in practice.
This ASU will apply to joint ventures that meet the definition of a corporate joint venture under GAAP, thus limiting its scope to joint ventures not controlled and therefore not consolidated by any joint venture investor.
| | | | | | | | | | | | | | | | | | | | | |
| --- | --- | --- | --- | --- | --- | --- | --- | --- | --- | --- | --- | --- | --- | --- | --- | --- | --- | --- | --- | --- |
| 10.1* | | | | | | [Amended and Restated Credit Agreement, dated as of September 22, 2022, among the Company, as the Borrower, Alexandria Real Estate Equities, L.P., as a Guarantor, Citibank, N.A., as Administrative Agent, and the Other Lenders Party Thereto, Citibank, N.A., BofA Securities, Inc., JPMorgan Chase Bank, N.A., Goldman Sachs Bank USA, RBC Capital Markets, the Bank of Nova Scotia, Mizuho Bank, Ltd., Sumitomo Mitsui Banking Corporation, and U.S. Bank National Association, as Joint Lead Arrangers, Citibank, N.A., BofA Securities, Inc., JPMorgan Chase Bank, N.A., Goldman Sachs Bank USA, and RBC Capital Markets, as Joint Bookrunners, Bank of America, N.A., JPMorgan Chase Bank, N.A., Goldman Sachs Bank USA, and Royal Bank of Canada, as Co-Syndication Agents, and the Bank of Nova Scotia, Mizuho Bank, Ltd., Sumitomo Mitsui Banking Corporation, U.S. Bank National Association, Bank of the West, Barclays Bank PLC, Capital One, N.A., Banco Bilbao Vizcaya Argentaria, S.A. New York Branch, Fifth Third Bank, National Association, PNC Bank, National Association, Regions Bank, TD Bank, N.A., The Huntington National Bank, and Truist Bank, as Co-Documentation Agents, and Citibank, N.A., as Sustainability Structuring Agent](http://www.sec.gov/Archives/edgar/data/1035443/000103544322000308/a3q22-ex101.htm) | | | | | | Form 10-Q | | | | | | October 24, 2022 | | |
| 10.23* | | | (1) | | | [Executive Employment Agreement between the Company and Hunter Kass, entered into on January 1, 2021 and effective as of January 1, 2021](http://www.sec.gov/Archives/edgar/data/1035443/000103544322000040/a4q21-ex1023.htm) | | | | | | Form 10-K | | | | | | January 31, 2022 | | |
| 10.24* | | | (1) | | | [Amended and Restated Consulting Agreement, dated as of September 30, 2011, between the Company and James H. Richardson](http://www.sec.gov/Archives/edgar/data/1035443/000110465911062717/a11-25615_1ex10d1.htm) | | | | | | Form 10-Q | | | | | | November 9, 2011 | | |
| Dean A. Shigenaga | | | | | | | | | | | | | | |
| /s/ Jennifer Friel Goldstein | | | | | | Director | | | | | | January 30, 2023 | | |
| Jennifer Friel Goldstein | | | | | | | | | | | | | | |
Recognition of acquired real estate – Purchase price accounting
| *Description of the Matter* | | | | | | As more fully disclosed in Notes 2 and 3 to the consolidated financial statements, during 2022, the Company completed the acquisition of 42 properties for a total purchase price of $2.8 billion. The transactions were accounted for as asset acquisitions, and the purchase prices were allocated based on the relative fair values of the assets acquired (including land, buildings and improvements, right-of-use assets, and the intangible value of acquired above-market leases, acquired in-place leases, tenant relationships, and other intangible assets) and liabilities assumed (including the intangible value of acquired below-market leases and other intangible liabilities). The fair value of tangible and intangible assets and liabilities is based on available comparable market information, including estimated replacement costs, rental rates, recent market transactions, and estimated cash flow projections that utilize appropriate discount and capitalization rates. Estimates of future cash flows are based on a number of factors, including the historical operating results, known and anticipated trends, and market or economic conditions, that may affect the property. Auditing the Company’s estimate of the fair value of the acquired tangible and intangible assets and liabilities involves significant estimation uncertainty due to the judgment used by management in selecting key assumptions based on recent comparable transactions or market data, which are primarily unobservable inputs, and the sensitivity of the estimates to changes in assumptions. The allocation of purchase price to the components of properties acquired could have an effect on the Company’s net income due to the useful depreciable and amortizable lives applicable to each component, and the recognition and classification of the related depreciation or amortization expense in the Company’s consolidated statements of operations. | | |
| *How we Addressed the Matter in Our Audit* | | | | | | Our audit procedures related to the key assumptions utilized in the Company’s purchase price accounting for acquired real estate included the following procedures, among others: We tested the design and operating effectiveness of controls over the Company’s process for determining and reviewing the key inputs and assumptions used in estimating the fair value of acquired assets and liabilities and allocating purchase price to the various components. We evaluated the incorporation of the key assumptions in the purchase price accounting model and recalculated the model’s results. To test the fair values of acquired tangible and intangible assets and liabilities used in the purchase price allocation, we performed procedures to evaluate the valuation methods and significant assumptions used by management. We evaluated the completeness and accuracy of the underlying data supporting the determination of the various inputs. Our internal valuation specialists assisted us in evaluating the methodology used by the Company and considered the consistency of the land and building values, estimated replacement costs, market rental rates, ground lease rates, and discount rates with external data sources. | | |
January 30, 2023
| Balance as of December 31, 2019 | | | | | | 120,800,315 | | | | | | $ | 1,208 | | | | | $ | 8,874,367 | | | | | $ | — | | | | | $ | (9,749) | | | | | $ | 1,288,352 | | | | | $ | 10,154,178 | | | | | $ | 12,300 | |
| Net income | | | | | | — | | | | | | — | | | | | | — | | | | | | 770,959 | | | | | | — | | | | | | 55,309 | | | | | | 826,268 | | | | | | 903 | | |
| Contributions from and sales of noncontrolling interests | | | | | | — | | | | | | — | | | | | | 267,432 | | | | | | — | | | | | | — | | | | | | 449,726 | | | | | | 717,158 | | | | | | 281 | | |
| Issuance of common stock | | | | | | 15,337,916 | | | | | | 153 | | | | | | 2,315,709 | | | | | | — | | | | | | — | | | | | | — | | | | | | 2,315,862 | | | | | | — | | |
| Issuance pursuant to stock plan | | | | | | 688,599 | | | | | | 7 | | | | | | 83,992 | | | | | | — | | | | | | — | | | | | | — | | | | | | 83,999 | | | | | | — | | |
| Cumulative effect of adjustment upon adoption of credit loss ASU on January 1, 2020 | | | | | | — | | | | | | — | | | | | | — | | | | | | (2,484) | | | | | | — | | | | | | — | | | | | | (2,484) | | | | | | — | | |
The functional currencies for our foreign subsidiaries are the local currencies in each respective country.
During the year ended December 31, 2022, our total revenues also included $51.0 million, or 2.0%, subject to other accounting guidance.
We elected a prospective application of this accounting standard to leases that commence or are modified on or after the date this standard was adopted.
Historically, substantially all our leases in which we are the lessor have been operating leases; therefore, our adoption of this accounting standard has not had and is not expected to have a material effect on our consolidated financial statements.
| Greater Boston | | | | | | 5 | | | | | | 277,997 | | | | | | | | | | | | 664,832 | | | | | | 265,965 | | | | | | $ | 788,292 | | | | |
| San Francisco Bay Area | | | | | | 5 | | | | | | 610,000 | | | | | | | | | | | | 723,953 | | | | | | 70,000 | | | | | | 564,000 | | | | | |
| San Diego | | | | | | 5 | | | | | | 1,287,000 | | | | | | | | | | | | 234,874 | | | | | | — | | | | | | 231,380 | | | | | |
| Seattle | | | | | | — | | | | | | 869,000 | | | | | | | | | | | | — | | | | | | — | | | | | | 87,608 | | | | | |
| Research Triangle | | | | | | 4 | | | | | | 1,925,000 | | | | | | | | | | | | 69,485 | | | | | | — | | | | | | 179,428 | | | | | |
| Texas | | | | | | 11 | | | | | | 51,038 | | | | | | | | | | | | 1,197,071 | | | | | | — | | | | | | 508,400 | | | | | |
| Other | | | | | | 12 | | | | | | 1,644,994 | | | | | | | | | | | | 646,132 | | | | | | 381,760 | | | | | | 459,344 | | | | | |
| Year ended December 31, 2022 | | | | | | 42 | | | | | | 6,665,029 | | | | | | | | | | | | 3,536,347 | | | | | | 717,725 | | | | | | $ | 2,818,452 | | (1) | | |
| | | | | | | $ | 417,656 | | | | | $ | 341,585 | |
| 2023 | | | | | | $ | 77,462 | |
| 2024 | | | | | | 67,889 | | |
| 2025 | | | | | | 45,468 | | |
| 2026 | | | | | | 34,061 | | |
| 2027 | | | | | | 33,711 | | |
| Thereafter | | | | | | 159,065 | | |
| | | | | | | $ | 615,638 | | | | | $ | 609,872 | |
| 2024 | | | | | | 99,034 | | |
| 2025 | | | | | | 76,530 | | |
An excerpt. Shown here: 40 of 598 rewritten, 40 of 296 added and 40 of 232 removed. The counts are complete. For every sentence, read Item 15. EXHIBITS AND FINANCIAL STATEMENT SCHEDULES in the FY2023 filing and the FY2022 filing.