 filings.tools
American Express 10-K 2020-12-31
Filed 2021-02-12. 18 sections, 754K characters. Original on sec.gov · Markdown · JSON
Cover and table of contents
UNITED STATES
SECURITIES AND EXCHANGE COMMISSION
Washington, D.C. 20549
Form 10-K
| ☑ | ANNUAL REPORT PURSUANT TO SECTION 13 OR 15(d) OF THE SECURITIES EXCHANGE ACT OF 1934 | ||||
| For the fiscal year ended December 31, 2020 |
OR
| ☐ | TRANSITION REPORT PURSUANT TO SECTION 13 OR 15(d) OF THE SECURITIES EXCHANGE ACT OF 1934 | ||||
| For the transition period from to |
Commission File No. 1-7657

American Express Company
(Exact name of registrant as specified in its charter)
| New York | 13-4922250 | ||||
| (State or other jurisdiction of incorporation or organization) | (I.R.S. Employer Identification No.) | ||||
| 200 Vesey Street New York, New York | 10285 | ||||
| (Address of principal executive offices) | (Zip Code) |
Registrant’s telephone number, including area code: (212) 640-2000
Securities registered pursuant to Section 12(b) of the Act:
| Title of each class | Trading Symbol(s) | Name of each exchange on which registered | ||||||
| Common Shares (par value $0.20 per Share) | AXP | New York Stock Exchange |
Securities registered pursuant to section 12(g) of the Act: None
Indicate by check mark if the registrant is a well-known seasoned issuer, as defined in Rule 405 of the Securities Act. Yes þ No o
Indicate by check mark if the registrant is not required to file reports pursuant to Section 13 or Section 15(d) of the Act. Yes o No þ
Indicate by check mark whether the registrant (1) has filed all reports required to be filed by Section 13 or 15(d) of the Securities Exchange Act of 1934 during the preceding 12 months (or for such shorter period that the registrant was required to file such reports) and (2) has been subject to such filing requirements for the past 90 days. Yes þ No o
Indicate by check mark whether the registrant has submitted electronically every Interactive Data File required to be submitted pursuant to Rule 405 of Regulation S-T (§ 232.405 of this chapter) during the preceding 12 months (or for such shorter period that the registrant was required to submit such files). Yes þ No o
Indicate by check mark whether the registrant is a large accelerated filer, an accelerated filer, a non-accelerated filer, a smaller reporting company, or an emerging growth company. See the definitions of “large accelerated filer,” “accelerated filer,” “smaller reporting company” and “emerging growth company” in Rule 12b-2 of the Exchange Act.
| Large accelerated filer þ | Accelerated filer o | Non-accelerated filer o | Smaller reporting company ☐ | Emerging growth company ☐ |
If an emerging growth company, indicate by check mark if the registrant has elected not to use the extended transition period for complying with any new or revised financial accounting standards provided pursuant to Section 13(a) of the Exchange Act. o
Indicate by check mark whether the registrant has filed a report on and attestation to its management's assessment of the effectiveness of its internal control over financial reporting under section 404(b) of the Sarbanes-Oxley Act (15 U.S.C. 7262(b)) by the registered public accounting firm that prepared or issued its audit report. ☑
Indicate by check mark whether the registrant is a shell company (as defined in Rule 12b-2 of the Act). Yes ☐ No þ
As of June 30, 2020, the aggregate market value of the registrant’s voting shares held by non-affiliates of the registrant was approximately $76.6 billion based on the closing sale price as reported on the New York Stock Exchange.
As of February 3, 2021, there were 805,588,980 common shares of the registrant outstanding.
DOCUMENTS INCORPORATED BY REFERENCE
Part III: Portions of Registrant’s Proxy Statement to be filed with the Securities and Exchange Commission in connection with the Annual Meeting of Shareholders to be held on May 4, 2021.
TABLE OF CONTENTS
This Annual Report on Form 10-K, including the “Management’s Discussion and Analysis of Financial Condition and Results of Operations,” contains forward-looking statements within the meaning of the Private Securities Litigation Reform Act of 1995 that are subject to risks and uncertainties. You can identify forward-looking statements by words such as “believe,” “expect,” “anticipate,” “intend,” “plan,” “aim,” “will,” “may,” “should,” “could,” “would,” “likely,” “estimate,” “predict,” “potential,” “continue” or other similar expressions. We discuss certain factors that affect our business and operations and that may cause our actual results to differ materially from these forward-looking statements under “Risk Factors” and “Cautionary Note Regarding Forward-Looking Statements.” You are cautioned not to place undue reliance on these forward-looking statements, which speak only as of the date on which they are made. We undertake no obligation to update publicly or revise any forward-looking statements.
This report includes trademarks, such as American Express®, which are protected under applicable intellectual property laws and are the property of American Express Company or its subsidiaries. This report also contains trademarks, service marks, copyrights and trade names of other companies, which are the property of their respective owners. Solely for convenience, our trademarks and trade names referred to in this report may appear without the ® or ™ symbols, but such references are not intended to indicate, in any way, that we will not assert, to the fullest extent under applicable law, our rights or the right of the applicable licensor to these trademarks and trade names.
Throughout this report the terms “American Express,” “we,” “our” or “us,” refer to American Express Company and its subsidiaries on a consolidated basis, unless stated or the context implies otherwise. The use of the term “partner” or “partnering” in this report does not mean or imply a formal legal partnership, and is not meant in any way to alter the terms of American Express’ relationship with any third parties. Refer to the “MD&A ― Glossary of Selected Terminology” for the definitions of other key terms used in this report.
PART I
Item 1. BUSINESS
Overview
American Express is a globally integrated payments company that provides our customers with access to products, insights and experiences that enrich lives and build business success. We are a leader in providing credit and charge cards to consumers, small businesses, mid-sized companies and large corporations around the world. American Express® cards issued by American Express as well as by third-party banks and other institutions on the American Express network permit Card Members to charge purchases of goods and services at the millions of merchants around the world that accept cards bearing our logo.
Our various products and services are sold globally to diverse customer groups through various channels, including mobile and online applications, affiliate marketing, customer referral programs, third-party vendors and business partners, direct mail, telephone, in-house sales teams and direct response advertising. Business travel-related services are offered through our non-consolidated joint venture, American Express Global Business Travel (the GBT JV).
We were founded in 1850 as a joint stock association and were incorporated in 1965 as a New York corporation. American Express Company and its principal operating subsidiary, American Express Travel Related Services Company, Inc. (TRS), are bank holding companies under the Bank Holding Company Act of 1956, as amended (the BHC Act), subject to supervision and examination by the Board of Governors of the Federal Reserve System (the Federal Reserve).
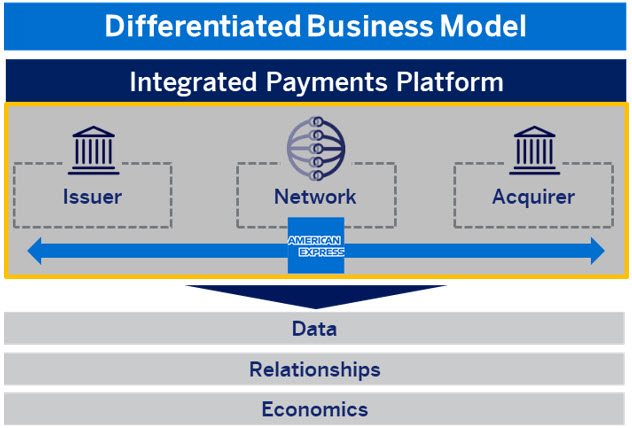
We principally engage in businesses comprising three reportable operating segments: Global Consumer Services Group (GCSG), Global Commercial Services (GCS) and Global Merchant and Network Services (GMNS). Corporate functions and certain other businesses are included in Corporate & Other. Our businesses are global in scope and function together to form our end-to-end integrated payments platform, which we believe is a differentiator that underpins our business model. The COVID-19 pandemic has brought unprecedented challenges to businesses and economies around the world. While our business was significantly impacted by the pandemic in 2020 as further described in this report, we believe our progress in managing through it confirms the resilience of our differentiated business model.
For further information about our reportable operating segments, please see “Business Segment Results of Operations” under “MD&A.”
Our Integrated Payments Platform
Through our general-purpose card-issuing, merchant-acquiring and card network businesses, we are able to connect participants and provide differentiated value across the commerce path. We maintain direct relationships with both our Card Members (as a card issuer) and merchants (as an acquirer), and we handle all key aspects of those relationships. These relationships create a “closed loop” in that we have direct access to information at both ends of the card transaction, which distinguishes our integrated payments platform from the bankcard networks.
Our integrated payments platform allows us to analyze information on Card Member spending and build algorithms and other analytical tools that we use to underwrite risk, reduce fraud and provide targeted marketing and other information services for merchants and special offers and services to Card Members, all while respecting Card Member preferences and protecting Card Member and merchant data in compliance with applicable policies and legal requirements. Through contractual relationships, we also obtain information from third-party card issuers, merchant acquirers, aggregators and processors with whom we do business.
Card Issuing Businesses
Our global proprietary card-issuing businesses are conducted through our GCSG and GCS reportable operating segments. We offer a broad set of card products, rewards and services to a diverse consumer and commercial customer base, in the United States and internationally. We acquire and retain high-spending, engaged and creditworthy Card Members by:
-
Designing innovative products and features that appeal to our target customer base and meet their spending and borrowing needs
-
Using incentives to drive spending on our various card products and engender loyal Card Members, including our Membership Rewards® program, cash-back reward features and participation in loyalty programs sponsored by our cobrand and other partners
-
Providing digital and mobile services and an array of benefits and experiences across card products, such as airport lounge access and other travel and lifestyle benefits, which we believe are difficult for others to replicate and help increase Card Member engagement
-
Creating world-class service experiences by delivering exceptional customer care
-
Developing a wide range of partner relationships, including with other corporations and institutions that sponsor certain of our cards under cobrand arrangements and provide benefits and services to our Card Members
During 2020, we enhanced our value propositions on many of our card products, including adjusting our rewards programs and adding limited time offers and statement credits in categories that are relevant in the current environment, such as wireless, streaming services, business essentials and food delivery. We also created a Customer Pandemic Relief Program to provide short-term support for customers impacted by COVID-19, and we enhanced and expanded our longer-term Financial Relief Program for Card Members who need additional financial assistance during this time. Additionally, we participated in the U.S. Small Business Administration Paycheck Protection Program (PPP), designed to provide small businesses with support to cover payroll and certain other expenses.
For the year ended December 31, 2020, worldwide proprietary billed business (spending on American Express cards issued by us) was $870.7 billion and at December 31, 2020, we had 68.9 million proprietary cards-in-force worldwide.
Merchant Acquiring Business
Our GMNS reportable operating segment builds and manages relationships with millions of merchants around the world that choose to accept American Express cards. This includes signing new merchants to accept our cards, agreeing on the discount rate (a fee charged to the merchant for accepting our cards) and handling servicing for merchants. We also build and maintain relationships with merchant acquirers, aggregators and processors to manage aspects of our merchant services business. For example, through our OptBlue® merchant-acquiring program, third-party acquirers contract directly with small merchants for card acceptance on our network and determine merchant pricing. We continue to grow merchant acceptance of American Express cards around the world and work with merchant partners so that our Card Members are warmly welcomed and encouraged to spend in the millions of places where their American Express cards are accepted.
GMNS also provides fraud-prevention tools, marketing solutions, data analytics and other programs and services to merchants and other partners that leverage the capabilities of our integrated payments platform.
During 2020, we adjusted certain policies to back our merchant partners in the current environment, including raising contactless transaction thresholds and reminding them that we do not require Card Members’ signatures at the point of sale. We also launched our largest-ever Shop Small campaign to support small businesses around the world, which have been significantly impacted by the pandemic.
Card Network Business
We operate a payments network through which we establish and maintain relationships with third-party banks and other institutions in approximately 98 countries and territories, licensing the American Express brand and extending the reach of our global network
Showing the first 8K of 77K characters. Open the full section
Item 1A. RISK FACTORS
This section highlights certain risks that could affect us and our businesses, broadly categorized as “Strategic, Business and Competitive Risks,” “Legal, Regulatory and Compliance Risks” and “Credit, Liquidity and Market Risks.” You should carefully consider each of the following risks and all of the other information set forth in this Annual Report on Form 10-K, including the “Risk Management” section under “MD&A,” which describes our approach to identifying, monitoring and managing the risks we assume in conducting our businesses and provides certain quantitative and qualitative disclosures about market risks. The risks and uncertainties we face are not limited to those described below. Additional risks and uncertainties not presently known to us or that we currently believe to be immaterial may also adversely affect our business.
Strategic, Business and Competitive Risks
The impact of the COVID-19 pandemic and the measures implemented to contain the spread of the virus have had, and are expected to continue to have, a material adverse impact on our business and results of operations.
The COVID-19 pandemic is having widespread, rapidly evolving and unpredictable impacts on global society, economies, financial markets and business practices. The pandemic and containment measures have contributed to, among other things:
-
Widespread changes to, and significant reductions in, household and business activity and consumer and business spending, as well as economic concerns and a rise in unemployment.
-
Adverse impacts on our cobrand and other partners in the travel and airline industries, our GBT JV and on our third-party service providers, merchants, customer acquisition channels, processors, aggregators, network partners and other third parties that we rely on for services that are integral to our operations.
-
Adverse impacts on the creditworthiness of our customers and other counterparties and their ability to pay amounts owed to us and our ability to collect such amounts and required increases in our reserves for credit losses.
-
Adverse impacts on industries representing a significant portion of our billed business (including, but not limited to, travel and entertainment (T&E) spending).
-
Adverse impacts on capital and credit market conditions and our deposit base, which may limit our access to funding, increase our cost of capital, and affect our ability to meet liquidity needs.
-
An increased risk of significantly higher Card Member reimbursements for goods or services purchased from merchants that cease operations or are otherwise unable to ultimately provide those goods or services or, in the case of our business partners, impairments of rewards points we purchased from those partners.
-
An increased strain on our risk management policies generally, including, but not limited to, the effectiveness and accuracy of our models, given the lack of data inputs and comparable precedent.
-
An increased risk of impairment, restructuring or other charges, including as a result of impairment of the value of our investments and other assets.
-
Adverse impacts on our daily business operations and our colleagues’ ability to perform necessary business functions, including as a result of illness, office closures and other limitations, or restrictions on movement.
-
Increased challenges in growing or retaining our Card Member base and in launching new products or businesses or refreshing existing products in line with expectations or the current and changing needs of our customers.
-
Increased spending on our business continuity efforts, such as technology, service centers and our supply chain, and readiness efforts for returning to our offices, which may in turn require that we further cut costs and investments in other areas.
-
An increased risk of an information or cyber security incident, fraud, a failure to maintain the uninterrupted operation of our information systems or a failure in the effectiveness of our AML and other compliance programs due to, among other things, an increase in remote work.
These and other impacts of the COVID-19 pandemic may continue even after the outbreak has subsided and containment measures are lifted, and may exacerbate many of the other risks described in this “Risk Factors” section. The extent to which our business and results of operations will continue to be adversely affected will depend on numerous evolving factors and future developments that we are not able to predict, including the continued spread and severity of the virus and new variants; the imposition of further containment measures and their ability to control the spread of the virus; the availability, distribution and use of effective treatments and vaccines; the extent and duration of the effect on the economy, unemployment, consumer confidence and consumer and business spending; the availability and effectiveness of government stimulus measures; and how quickly and to what extent normal operating conditions and customer behaviors resume, such as with respect to travel, dining and in-person events.
Difficult conditions in the business and economic environment, including as a result of the COVID-19 pandemic, have had and are expected to continue to have a material adverse effect on our business and results of operations.
We offer a broad array of products and services to consumers, small businesses and commercial clients and thus are very dependent upon the level of consumer and business activity and the demand for payment and financing products. Slow
economic growth, economic contraction or shifts in broader consumer and business trends significantly impact customer behaviors, including spending on our cards, the ability and willingness of Card Members to borrow and pay amounts owed to us, and demand for fee-based products and services. Factors such as consumer spending and confidence, unemployment rates, business investment, geopolitical instability, public policy decisions, government spending, international trade relationships, interest rates, taxes, energy costs, the volatility and strength of the capital markets, inflation and deflation all affect the economic environment and, ultimately, our profitability. Such factors may also cause our earnings, billings, loan balances, credit metrics and margins to fluctuate and diverge from expectations of analysts and investors, who may have differing assumptions regarding their impact on our business, adversely affecting, and/or increasing the volatility of, the trading price of our common shares.
Spending at T&E merchants, for example, is sensitive to business and personal discretionary spending levels and circumstances impacting travel. We experienced the effects of this sensitivity in 2020 as a result of the COVID-19 pandemic, with T&E spending decreasing 61 percent compared to 2019, while non-T&E spending decreased 1 percent. Likewise, spending by small businesses and corporate clients, which comprised approximately 40 percent of our worldwide billed business during 2020, depends in part on the economic environment and a favorable climate for continued business investment and new business formation, as well as on related volumes of business travel. During the pandemic, Card Member billed business decreased 19 percent in 2020 compared to 2019.
Increases in delinquencies and write-off rates as a result of increases in bankruptcies, unemployment rates, changes in customer behaviors or otherwise could also have a material adverse effect on our results of operations. We increased our reserves for credit losses significantly in 2020 due to the deterioration of the global macroeconomic outlook.
The consequences of negative circumstances impacting us or the environment generally can be sudden and severe, as we experienced from the end of the first quarter into the second quarter of 2020 due to the pandemic.
**Our business is subject to the effects of geopolitical events, weather
Showing the first 8K of 93K characters. Open the full section
Item 1B. UNRESOLVED STAFF COMMENTS
Not applicable.
Item 2. PROPERTIES
Our principal executive offices are in a 2.2 million square foot building located in lower Manhattan on land leased from the Battery Park City Authority for a term expiring in 2069. We have an approximately 49 percent ownership interest in the building and an affiliate of Brookfield Financial Properties owns the remaining approximately 51 percent interest in the building. We also lease space in the building from Brookfield’s affiliate.
Other owned or leased principal locations include American Express offices in Phoenix, Arizona, Sunrise, Florida, Gurgaon, India, Brighton, England, Manila, Philippines, Tokyo, Japan, Kuala Lumpur, Malaysia and Sydney, Australia; the American Express data centers in Phoenix, Arizona and Greensboro, North Carolina; the headquarters for AENB in Sandy, Utah; the headquarters for American Express Services Europe Limited in London, England; the headquarters for American Express Europe, S.A. in Madrid, Spain; the headquarters for Amex Bank of Canada and Amex Canada Inc. in Toronto, Ontario, Canada; and the headquarters for American Express Bank (Mexico) S.A. Institucion de Banca Multiple and American Express Company (Mexico) S.A. de C.V. in Mexico City, Mexico. We also lease and operate multiple travel lounges as a benefit for our Card Members in major U.S. and global hub airports.
Item 3. LEGAL PROCEEDINGS
Refer to Note 12 to our “Consolidated Financial Statements,” which is incorporated herein by reference.
Item 4. MINE SAFETY DISCLOSURES
Not applicable.
PART II
Item 5. MARKET FOR REGISTRANT’S COMMON EQUITY, RELATED STOCKHOLDER MATTERS AND ISSUER PURCHASES OF EQUITY SECURITIES
(a)Our common stock trades principally on The New York Stock Exchange under the trading symbol AXP. As of December 31, 2020, we had 19,446 common shareholders of record. You can find dividend information concerning our common stock in Note 26 to our "Consolidated Financial Statements." For information on dividend restrictions, see “Dividends and Other Capital Distributions” under “Supervision and Regulation” and Note 22 to our “Consolidated Financial Statements.” You can find information on securities authorized for issuance under our equity compensation plans under the caption “Executive Compensation — Equity Compensation Plans” to be contained in our definitive 2021 proxy statement for our Annual Meeting of Shareholders, which is scheduled to be held on May 4, 2021. The information to be found under such caption is incorporated herein by reference. Our definitive 2021 proxy statement for our Annual Meeting of Shareholders is expected to be filed with the SEC in March 2021 (and, in any event, not later than 120 days after the close of our most recently completed fiscal year).
Stock Performance Graph
The information contained in this Stock Performance Graph section shall not be deemed to be “soliciting material” or “filed” or incorporated by reference in future filings with the SEC, or subject to the liabilities of Section 18 of the Exchange Act, except to the extent that we specifically incorporate it by reference into a document filed under the Securities Act or the Exchange Act.
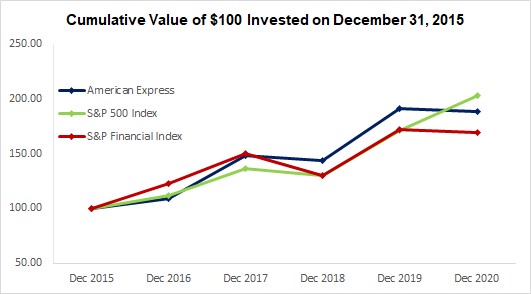
The following graph compares the cumulative total shareholder return on our common shares with the total return on the S&P 500 Index and the S&P Financial Index for the last five years. It shows the growth of a $100 investment on December 31, 2015, including the reinvestment of all dividends.
| Year-end Data | 2015 | 2016 | 2017 | 2018 | 2019 | 2020 | ||||||||||||||||||||||||||||||||
| American Express | $ | 100.00 | $ | 108.57 | $ | 147.88 | $ | 143.99 | $ | 190.82 | $ | 188.62 | ||||||||||||||||||||||||||
| S&P 500 Index | $ | 100.00 | $ | 111.95 | $ | 136.38 | $ | 130.39 | $ | 171.44 | $ | 202.96 | ||||||||||||||||||||||||||
| S&P Financial Index | $ | 100.00 | $ | 122.75 | $ | 149.92 | $ | 130.37 | $ | 172.21 | $ | 169.19 |
(b) Not applicable.
(c) Issuer Purchases of Securities
The table below sets forth the information with respect to purchases of our common stock made by or on behalf of us during the quarter ended December 31, 2020.
| Total Number of Shares Purchased | Average Price Paid Per Share | Total Number of Shares Purchased as Part of Publicly Announced Plans or Programs(c) | Maximum Number of Shares that May Yet Be Purchased Under the Plans or Programs | |||||||||||||||||||||||
| October 1-31, 2020 | ||||||||||||||||||||||||||
| Repurchase program(a) | — | $ | — | — | 102,171,653 | |||||||||||||||||||||
| Employee transactions(b) | — | $ | — | N/A | N/A | |||||||||||||||||||||
| November 1-30, 2020 | ||||||||||||||||||||||||||
| Repurchase program(a) | — | $ | — | — | 102,171,653 | |||||||||||||||||||||
| Employee transactions(b) | 19,140 | $ | 91.24 | N/A | N/A | |||||||||||||||||||||
| December 1-31, 2020 | ||||||||||||||||||||||||||
| Repurchase program(a) | — | $ | — | — | 102,171,653 | |||||||||||||||||||||
| Employee transactions(b) | — | $ | — | N/A | N/A | |||||||||||||||||||||
| Total | ||||||||||||||||||||||||||
| Repurchase program(a) | — | $ | — | — | 102,171,653 | |||||||||||||||||||||
| Employee transactions(b) | 19,140 | $ | 91.24 | N/A | N/A |
(a)On September 23, 2019, the Board of Directors authorized the repurchase of up to 120 million common shares from time to time, subject to market conditions and in accordance with our capital plans. This authorization replaced the prior repurchase authorization and does not have an expiration date. See “MD&A – Consolidated Capital Resources and Liquidity” for additional information regarding share repurchases.
(b)Includes: (i) shares surrendered by holders of employee stock options who exercised options (granted under our incentive compensation plans) in satisfaction of the exercise price and/or tax withholding obligation of such holders and (ii) restricted shares withheld (under the terms of grants under our incentive compensation plans) to offset tax withholding obligations that occur upon vesting and release of restricted shares. Our incentive compensation plans provide that the value of the shares delivered or attested to, or withheld, be based on the price of our common stock on the date the relevant transaction occurs.
(c)Share purchases under publicly announced programs are made pursuant to open market purchases or privately negotiated transactions (including employee benefit plans) as market conditions warrant and at prices we deem appropriate.
Item 6. SELECTED FINANCIAL DATA
| 2020 | 2019 | 2018 | 2017 | 2016 | ||||||||||||||||||||||||||||
| Operating Results ($ in Millions) | ||||||||||||||||||||||||||||||||
| Total revenues net of interest expense | $ | 36,087 | $ | 43,556 | $ | 40,338 | $ | 36,878 | $ | 35,438 | ||||||||||||||||||||||
| Provisions for credit losses(a) | 4,730 | 3,573 | 3,352 | 2,760 | 2,027 | |||||||||||||||||||||||||||
| Expenses | 27,061 | 31,554 | 28,864 | 26,693 | 25,369 | |||||||||||||||||||||||||||
| Pretax income | 4,296 | 8,429 | 8,122 | 7,425 | 8,042 | |||||||||||||||||||||||||||
| Income tax provision | 1,161 | 1,670 | 1,201 | 4,677 | 2,667 | |||||||||||||||||||||||||||
| Net income | 3,135 | $ | 6,759 | $ | 6,921 | $ | 2,748 | $ | 5,375 | |||||||||||||||||||||||
| Return on average equity(b) | 14.2 | % | 29.6 | % | 33.5 | % | 13.2 | % | 25.8 | % | ||||||||||||||||||||||
| Balance Sheet ($ in Millions) | ||||||||||||||||||||||||||||||||
| Cash and cash equivalents(c) | $ | 32,965 | $ | 24,446 | $ | 27,808 | $ | 33,263 | $ | 25,494 | ||||||||||||||||||||||
| Card Member receivables, net | 43,434 | 56,794 | 55,320 | 53,526 | 46,841 | |||||||||||||||||||||||||||
| Loans, net | 70,643 | 89,624 | 83,396 | 74,300 | 65,461 | |||||||||||||||||||||||||||
| Investment securities | 21,631 | 8,406 | 4,647 | 3,159 | 3,157 | |||||||||||||||||||||||||||
| Total assets | 191,367 | 198,321 | 188,602 | 181,196 | 158,917 | |||||||||||||||||||||||||||
| Customer deposits | 86,875 | 73,287 | 69,960 | 64,452 | 53,042 | |||||||||||||||||||||||||||
| Short-term borrowings | 1,878 | 6,442 | 3,100 | 3,278 | 5,581 | |||||||||||||||||||||||||||
| Long-term debt | 42,952 | 57,835 | 58,423 | 55,804 | 46,990 | |||||||||||||||||||||||||||
| Shareholders’ equity | $ | 22,984 | $ | 23,071 | $ | 22,290 | $ | 18,261 | $ | 20,523 | ||||||||||||||||||||||
| Common Share Statistics(d) | ||||||||||||||||||||||||||||||||
| Earnings per share: | ||||||||||||||||||||||||||||||||
| Net income attributable to common shareholders:(e) | ||||||||||||||||||||||||||||||||
| Basic | $ | 3.77 | $ | 8.00 | $ | 7.93 | $ | 3.00 | $ | 5.63 | ||||||||||||||||||||||
| Diluted | 3.77 | 7.99 | 7.91 | 2.99 | 5.61 | |||||||||||||||||||||||||||
| Cash dividends declared per common share | 1.72 | $ | 1.64 | $ | 1.48 | $ | 1.34 | $ | 1.22 | |||||||||||||||||||||||
| Book value per common share | 26.58 | $ | 26.51 | $ | 24.45 | $ | 19.42 | $ | 20.95 | |||||||||||||||||||||||
| Average common shares outstanding (millions): | ||||||||||||||||||||||||||||||||
| Basic | 805 | 828 | 856 | 883 | 933 | |||||||||||||||||||||||||||
| Diluted | 806 | 830 | 859 | 886 | 935 | |||||||||||||||||||||||||||
| Shares outstanding at period end (millions) | 805 | 810 | 847 | 859 | 904 | |||||||||||||||||||||||||||
| Other Statistics | ||||||||||||||||||||||||||||||||
| Number of colleagues at period end (thousands): | ||||||||||||||||||||||||||||||||
| United States | 23 | 23 | 21 | 20 | 21 | |||||||||||||||||||||||||||
| Outside the United States | 41 | 41 | 38 | 35 | 35 | |||||||||||||||||||||||||||
| Total | 64 | 64 | 59 | 55 | 56 | |||||||||||||||||||||||||||
| Number of shareholders of record | 19,446 | 19,974 | 21,078 | 22,262 | 23,572 |
(a)Results for reporting periods beginning after January 1, 2020 are presented using the CECL methodology, while comparative information continues to be reported in accordance with the incurred loss methodology in effect for prior periods. Refer to Note 3 to the "Consolidated Financial Statements" for further information.
(b)Return on average equity is calculated by dividing one-year period of net income by one-year average of total shareholders’ equity.
(c)Effective December 31, 2020, we reclassified restricted cash from Other assets to Cash and cash equivalents on the Consolidated Balance Sheets. Prior period amounts have been revised to conform to the current period presentation.
(d)Our common stock trades principally on The New York Stock Exchange under the trading symbol AXP.
(e)Represents net income, less earnings allocated to participating share awards and dividends on preferred shares.
Item 7. MANAGEMENT’S DISCUSSION AND ANALYSIS OF FINANCIAL CONDITION AND RESULTS OF OPERATIONS (MD&A)
EXECUTIVE OVERVIEW
BUSINESS INTRODUCTION
We are a globally integrated payments company with three reportable operating segments: Global Consumer Services Group (GCSG), Global Commercial Services (GCS) and Global Merchant and Network Services (GMNS). Corporate functions and certain other businesses and operations are included in Corporate & Other.
Our range of products and services includes:
-
Credit card, charge card and other payment and financing products
-
Merchant acquisition and processing, servicing and settlement, and point-of-sale marketing and information products and services for merchants
-
Network services
-
Other fee services, including fraud prevention services and the design and operation of customer loyalty programs
-
Expense management products and services
-
Travel and lifestyle services
Our various products and services are sold globally to diverse customer groups, including consumers, small businesses, mid-sized companies and large corporations. These products and services are sold through various channels, including mobile and online applications, affiliate marketing, customer referral programs, third-party vendors and business partners, direct mail, telephone, in-house sales teams, and direct response advertising. Business travel-related services are offered through our non-consolidated joint venture, American Express Global Business Travel (the GBT JV).
The following types of revenue are generated from our various products and services:
-
Discount revenue, our largest revenue source, primarily represents the amount we earn on transactions occurring at merchants that have entered into a card acceptance agreement with us, or a Global Network Services (GNS) partner or other third-party merchant acquirer, for facilitating transactions between the merchants and Card Members. The amount of fees charged for accepting our cards as payment for goods or services, or merchant discount, varies with, among other factors, the industry in which the merchant does business, the merchant’s overall American Express-related transaction volume, the method of payment, the settlement terms with the merchant, the method of submission of transactions and, in certain instances, the geographic scope for the related card acceptance agreement between the merchant and us (e.g., domestic or global) and the transaction amount. In some instances, an additional flat transaction fee is assessed as part of the merchant discount, and additional fees may be charged such as a variable fee for “non-swiped” card transactions or for transactions using cards issued outside the United States at merchants located in the United States;
-
Interest on loans, principally represents interest income earned on outstanding balances;
-
Net card fees, represent revenue earned from annual card membership fees, which vary based on the type of card and the number of cards for each account;
-
Other fees and commissions, primarily represent Card Member delinquency fees, foreign currency conversion fees charged to Card Members, loyalty coalition-related fees, service fees earned from merchants, travel commissions and fees, and Membership Rewards program fees; and
-
Other revenue, primarily represents revenues arising from contracts with partners of our GNS business (including commissions and signing fees less issuer rate payments), cross-border Card Member spending, ancillary merchant-related fees, earnings (losses) from equity method investments (including the GBT JV), insurance premiums earned from Card Members, and prepaid card and Travelers Cheque-related revenue.
NON-GAAP MEASURES
We prepare our Consolidated Financial Statements in accordance with accounting principles generally accepted in the United States of America (GAAP). However, certain information included within this report constitutes non-GAAP financial measures. Our calculations of non-GAAP financial measures may differ from the calculations of similarly titled measures by other companies.
BUSINESS ENVIRONMENT
The COVID-19 pandemic has brought unprecedented challenges to businesses and economies around the world. Our 2020 financial results were significantly down year-over-year, reflecting the impact of the deterioration in the global economy due to the pandemic and the related containment measures. There remains a high degree of uncertainty relating to the ongoing spread and severity of the virus and new variants, as well as the availability, distribution and use of effective treatments and vaccines. To the extent that the global economy continues to be negatively impacted by the pandemic, our results will be affected, with credit trends and spending volumes being the key drivers of our financial performance. Throughout 2020, we focused and made substantial progress on our four priorities to manage through this period of uncertainty: supporting our colleagues and winning as a team; protecting our customers and our brand; structuring the company for growth in the future; and remaining financially strong.
Since the first quarter of 2020, our colleague base has successfully operated in a mostly remote working environment and we have sought to ensure that our colleagues have the flexibility and resources they needed to stay safe, healthy and productive. To support our customers and merchants, we offered financial and other assistance, added product benefits to reflect today’s environment, and provided the high level of customer service they expect and rely on. We experienced lower voluntary attrition rates on our proprietary products compared to the prior year. In addition, our Card Members continued to recognize our commitment to service excellence, ranking us number one in the J.D. Power U.S. Credit Card Satisfaction Study for the tenth time. We worked with our strategic partners on initiatives to support our communities and launched our largest ever Shop Small campaign to help support small merchants. In addition, we remained committed to strengthening inclusion and diversity, and committed to an action plan to promote racial, ethnic and gender equity for our colleagues, customers and communities.
Reflective of the impacts of the pandemic and the broader macroeconomic environment, our billed business for the year was down 19 percent compared to the prior year, with a low in mid-April followed by a gradual recovery over the remainder of the year. Proprietary billed business, which accounted for 86 percent of our total billings and drives most of our financial results, was also down by 19 percent. Since mid-April, we have seen steady improvement in our overall billed business, with different recovery trends in T&E and non-T&E spend. Non-T&E spend, which has historically accounted for a large portion of our billed business, recovered to pre-pandemic levels in the second half of the year resulting in a full year decline of 1 percent compared to the prior year. T&E spend continued to be significantly impacted throughout the course of the year, although we saw a modest improvement from the lows of mid-April primarily driven by proprietary consumer T&E spend, resulting in a year-over-year decline of 61 percent.
Revenues net of interest expense decreased 17 percent compared to the prior year, consistent with the trend in billings. Discount revenue, our largest revenue line, decreased 22 percent, which was a larger contraction than the decline in billed business for the year due to a decrease in the average discount rate. The average discount rate decrease was driven by a shift in spend mix to non-T&E categories. Other fees and commissions and Other revenues declined year-over-year, primarily driven by a reduction in travel-related revenues. Card fee revenues, which are recognized over a twelve-month period and therefore are slower to react to economic shifts, continued to grow as compared to the prior year. While Card Member retention remained high throughout the year, net card fee growth
Showing the first 8K of 206K characters. Open the full section
Item 7A. QUANTITATIVE AND QUALITATIVE DISCLOSURES ABOUT MARKET RISK
Refer to “Risk Management” under “MD&A” for quantitative and qualitative disclosures about market risk.
Item 8. FINANCIAL STATEMENTS AND SUPPLEMENTARY DATA
MANAGEMENT’S REPORT ON INTERNAL CONTROL OVER FINANCIAL REPORTING
Our management is responsible for establishing and maintaining adequate internal control over financial reporting.
Our internal control over financial reporting is a process designed to provide reasonable assurance regarding the reliability of financial reporting and the preparation of financial statements for external purposes in accordance with accounting principles generally accepted in the United States of America (GAAP), and includes those policies and procedures that:
-
Pertain to the maintenance of records that, in reasonable detail, accurately and fairly reflect our transactions and dispositions of assets;
-
Provide reasonable assurance that transactions are recorded as necessary to permit preparation of financial statements in accordance with GAAP, and that our receipts and expenditures are being made only in accordance with authorizations of our management and directors; and
-
Provide reasonable assurance regarding prevention or timely detection of unauthorized acquisition, use or disposition of our assets that could have a material effect on the financial statements.
Because of its inherent limitations, internal control over financial reporting may not prevent or detect misstatements. Also, projections of any evaluation of effectiveness to future periods are subject to the risk that controls may become inadequate because of changes in conditions, or that the degree of compliance with the policies or procedures may deteriorate.
Our management assessed the effectiveness of our internal control over financial reporting as of December 31, 2020. In making this assessment, our management used the criteria set forth by the Committee of Sponsoring Organizations of the Treadway Commission (COSO) in Internal Control —Integrated Framework (2013).
Based on management’s assessment and those criteria, we conclude that, as of December 31, 2020, our internal control over financial reporting is effective.
PricewaterhouseCoopers LLP, our independent registered public accounting firm, has issued an audit report appearing on the following page on the effectiveness of our internal control over financial reporting as of December 31, 2020.
REPORT OF INDEPENDENT REGISTERED PUBLIC ACCOUNTING FIRM
TO THE BOARD OF DIRECTORS AND SHAREHOLDERS OF AMERICAN EXPRESS COMPANY
Opinions on the Financial Statements and Internal Control over Financial Reporting
We have audited the accompanying consolidated balance sheets of American Express Company and its subsidiaries (the “Company”) as of December 31, 2020 and 2019, and the related consolidated statements of income, of comprehensive income, of shareholders’ equity and of cash flows for each of the three years in the period ended December 31, 2020, including the related notes (collectively referred to as the “consolidated financial statements”). We also have audited the Company’s internal control over financial reporting as of December 31, 2020, based on criteria established in Internal Control - Integrated Framework (2013) issued by the Committee of Sponsoring Organizations of the Treadway Commission (COSO).
In our opinion, the consolidated financial statements referred to above present fairly, in all material respects, the financial position of the Company as of December 31, 2020 and 2019, and the results of its operations and its cash flows for each of the three years in the period ended December 31, 2020 in conformity with accounting principles generally accepted in the United States of America. Also in our opinion, the Company maintained, in all material respects, effective internal control over financial reporting as of December 31, 2020, based on criteria established in Internal Control - Integrated Framework (2013) issued by the COSO.
Change in Accounting Principle
As discussed in Note 1 to the consolidated financial statements, the Company changed the manner in which it accounts for credit losses on certain financial instruments in 2020.
Basis for Opinions
The Company’s management is responsible for these consolidated financial statements, for maintaining effective internal control over financial reporting, and for its assessment of the effectiveness of internal control over financial reporting, included in the accompanying Management’s Report on Internal Control over Financial Reporting. Our responsibility is to express opinions on the Company’s consolidated financial statements and on the Company’s internal control over financial reporting based on our audits. We are a public accounting firm registered with the Public Company Accounting Oversight Board (United States) (PCAOB) and are required to be independent with respect to the Company in accordance with the U.S. federal securities laws and the applicable rules and regulations of the Securities and Exchange Commission and the PCAOB.
We conducted our audits in accordance with the standards of the PCAOB. Those standards require that we plan and perform the audits to obtain reasonable assurance about whether the consolidated financial statements are free of material misstatement, whether due to error or fraud, and whether effective internal control over financial reporting was maintained in all material respects.
Our audits of the consolidated financial statements included performing procedures to assess the risks of material misstatement of the consolidated financial statements, whether due to error or fraud, and performing procedures that respond to those risks. Such procedures included examining, on a test basis, evidence regarding the amounts and disclosures in the consolidated financial statements. Our audits also included evaluating the accounting principles used and significant estimates made by management, as well as evaluating the overall presentation of the consolidated financial statements. Our audit of internal control over financial reporting included obtaining an understanding of internal control over financial reporting, assessing the risk that a material weakness exists, and testing and evaluating the design and operating effectiveness of internal control based on the assessed risk. Our audits also included performing such other procedures as we considered necessary in the circumstances. We believe that our audits provide a reasonable basis for our opinions.
Definition and Limitations of Internal Control over Financial Reporting
A company’s internal control over financial reporting is a process designed to provide reasonable assurance regarding the reliability of financial reporting and the preparation of financial statements for external purposes in accordance with generally accepted accounting principles. A company’s internal control over financial reporting includes those policies and procedures that (i) pertain to the maintenance of records that, in reasonable detail, accurately and fairly reflect the transactions and dispositions of the assets of the company; (ii) provide reasonable assurance that transactions are recorded as necessary to permit preparation of financial statements in accordance with generally accepted accounting principles, and that receipts and expenditures of the company are being made only in accordance with authorizations of management and directors of the company; and (iii) provide reasonable assurance regarding prevention or timely detection of unauthorized acquisition, use, or disposition of the company’s assets that could have a material effect on the financial statements.
Because of its inherent limitations, internal control over financial reporting may not prevent or detect misstatements. Also, projections of any evaluation of effectiveness to future periods are subject to the risk that controls may become inadequate because of changes in conditions, or that the degree of compliance with the policies or procedures may deteriorate.
Critical Audit Matters
The critical audit matters communicated bel
Showing the first 8K of 274K characters. Open the full section
Item 9. CHANGES IN AND DISAGREEMENTS WITH ACCOUNTANTS ON ACCOUNTING AND FINANCIAL DISCLOSURE
Not applicable.
Item 9A. CONTROLS AND PROCEDURES
Our management, with the participation of our Chief Executive Officer and Chief Financial Officer, has evaluated the effectiveness of our disclosure controls and procedures (as such term is defined in Rules 13a-15(e) and 15d-15(e) under the Securities Exchange Act of 1934, as amended (the Exchange Act)) as of the end of the period covered by this report. Based on such evaluation, our Chief Executive Officer and Chief Financial Officer have concluded that, as of the end of such period, our disclosure controls and procedures are effective and designed to ensure that the information required to be disclosed in our reports filed or submitted under the Exchange Act is recorded, processed, summarized and reported within the requisite time periods specified in the applicable rules and forms, and that it is accumulated and communicated to our management, including our Chief Executive Officer and Chief Financial Officer, as appropriate, to allow timely decisions regarding required disclosure.
There have not been any changes in our internal control over financial reporting (as such term is defined in Rules 13a-15(f) and 15d-15(f) under the Exchange Act) during the fourth quarter of 2020 that have materially affected, or are reasonably likely to materially affect, our internal control over financial reporting.
“Management’s Report on Internal Control over Financial Reporting,” which sets forth management’s evaluation of internal control over financial reporting, and the “Report of Independent Registered Public Accounting Firm” on the effectiveness of our internal control over financial reporting as of December 31, 2020 are set forth in “Financial Statements and Supplementary Data.”
Item 9B. OTHER INFORMATION
Not applicable.
PART III
ITEMS 10, 11, 12 and 13. DIRECTORS, EXECUTIVE OFFICERS AND CORPORATE GOVERNANCE; EXECUTIVE COMPENSATION; SECURITY OWNERSHIP OF CERTAIN BENEFICIAL OWNERS AND MANAGEMENT AND RELATED STOCKHOLDER MATTERS; CERTAIN RELATIONSHIPS AND RELATED TRANSACTIONS, AND DIRECTOR INDEPENDENCE
We expect to file with the SEC in March 2021 (and, in any event, not later than 120 days after the close of our last fiscal year), a definitive proxy statement, pursuant to SEC Regulation 14A in connection with our Annual Meeting of Shareholders to be held May 4, 2021, which involves the election of directors. The following information to be included in such proxy statement is incorporated herein by reference:
-
Information included under the caption “Corporate Governance at American Express — Our Corporate Governance Framework — Our Board’s Independence”
-
Information included under the caption “Corporate Governance at American Express — Our Board Committees — Board Committee Responsibilities”
-
Information included under the caption “Corporate Governance at American Express — Our Corporate Governance Framework — Director Attendance”
-
Information included under the caption “Corporate Governance at American Express — Compensation of Directors”
-
Information included under the caption “Stock Ownership Information”
-
Information included under the caption “Corporate Governance at American Express — Item 1 — Election of Directors for a Term of One Year”
-
Information included under the caption “Executive Compensation”
-
Information under the caption “Corporate Governance at American Express — Certain Relationships and Transactions”
In addition, the information regarding executive officers called for by Item 401(b) of Regulation S-K may be found under the caption “Information About Our Executive Officers” in this Report.
We have adopted a set of Corporate Governance Principles, which together with the charters of the four standing committees of the Board of Directors (Audit and Compliance; Compensation and Benefits; Nominating, Governance and Public Responsibility; and Risk), our Code of Conduct (which constitutes our code of ethics) and the Code of Business Conduct for the Members of the Board of Directors, provide the framework for our governance. A complete copy of our Corporate Governance Principles, the charters of each of the Board committees, the Code of Conduct (which applies not only to our Chief Executive Officer, Chief Financial Officer and Controller, but also to all our other colleagues) and the Code of Business Conduct for the Members of the Board of Directors may be found by clicking on the “Corporate Governance” link found on our Investor Relations website at http://ir.americanexpress.com. We also intend to disclose any amendments to our Code of Conduct, or waivers of our Code of Conduct on behalf of our Chief Executive Officer, Chief Financial Officer or Controller, on our website. You may also access our Investor Relations website through our main website at www.americanexpress.com by clicking on the “Investor Relations” link, which is located at the bottom of the Company’s homepage. (Information from such sites is not incorporated by reference into this report.) You may also obtain free copies of these materials by writing to our Corporate Secretary at our headquarters.
Item 14. PRINCIPAL ACCOUNTANT FEES AND SERVICES
The information set forth under the heading “Item 2 — Ratification of Appointment of Independent Registered Public Accounting Firm — PricewaterhouseCoopers LLP Fees and Services,” which will appear in our definitive proxy statement in connection with our Annual Meeting of Shareholders to be held May 4, 2021, is incorporated herein by reference.
PART IV
Item 15. EXHIBIT AND FINANCIAL STATEMENT SCHEDULES
(a)
- Financial Statements:
See the “Index to Consolidated Financial Statements” under “Financial Statements and Supplementary Data.”
- Financial Statement Schedules:
All schedules are omitted since the required information is either not applicable, not deemed material, or shown in the Consolidated Financial Statements.
- Exhibits:
The following exhibits are filed as part of this report. The exhibit numbers preceded by an asterisk (*) indicate exhibits electronically filed herewith. All other exhibit numbers indicate exhibits previously filed and are hereby incorporated herein by reference. Exhibits numbered 10.1 through 10.41 are management contracts or compensatory plans or arrangements.
| *101.LAB | XBRL Taxonomy Extension Label Linkbase Document | ||||
| *101.PRE | XBRL Taxonomy Extension Presentation Linkbase Document | ||||
| *101.DEF | XBRL Taxonomy Extension Definition Linkbase Document | ||||
| *104 | Cover Page Interactive Data File (formatted as inline XBRL and contained in Exhibit 101) |
Item 16. FORM 10-K SUMMARY
Not applicable.
SIGNATURES
Pursuant to the requirements of Section 13 or 15(d) of the Securities Exchange Act of 1934, the Company has duly caused this report to be signed on its behalf by the undersigned, thereunto duly authorized.
| AMERICAN EXPRESS COMPANY | ||||||||
| /s/ JEFFREY C. CAMPBELL | ||||||||
| Jeffrey C. Campbell Chief Financial Officer |
February 12, 2021
Pursuant to the requirements of the Securities Exchange Act of 1934, this report has been signed below by the following persons on behalf of the Company and in the capacities and on the date indicated.
| /s/ STEPHEN J. SQUERI | /s/ MICHAEL O. LEAVITT | |||||||
| Stephen J. Squeri Chairman, Chief Executive Officer and Director | Michael O. Leavitt Director | |||||||
| /s/ JEFFREY C. CAMPBELL | /s/ THEODORE J. LEONSIS | |||||||
| Jeffrey C. Campbell Chief Financial Officer | Theodore J. Leonsis Director | |||||||
| /s/ JESSICA LIEBERMAN QUINN | /s/ KAREN L. PARKHILL | |||||||
| Jessica Lieberman Quinn Executive Vice President and Corporate Controller (Principal Accounting Officer) | Karen L. Parkhill Director | |||||||
| /s/ THOMAS J. BALTIMORE, JR. | /s/ CHARLES E. PHILLIPS, JR. | |||||||
| Thomas J. Baltimore, Jr. Director | Charles E. Phillips, Jr. Director | |||||||
| Director | ||||||||
| /s/ CHARLENE BARSHEFSKY | /s/ LYNN A. PIKE | |||||||
| Charlene Barshefsky Director | Lynn A. Pike Director | |||||||
| /s/ JOHN J. BRENNAN | /s/ DANIEL L. VASELLA | |||||||
| John J. Brennan Director | Daniel L. Vasella Director | |||||||
| /s/ PETER CHERNIN | /s/ RONALD A. WILLIAMS | |||||||
| Peter Chernin Director | Ronald A. Williams Director | |||||||
| /s/ RALPH DE LA VEGA | /s/ CHRISTOPHER D. YOUNG | |||||||
| Ralph de la Vega Director | Christopher D. Young Director | |||||||
| /s/ ANNE LAUVERGEON | ||||||||
| Anne Lauvergeon Director | ||||||||
February 12, 2021
Appendix
STATISTICAL DISCLOSURE BY BANK HOLDING COMPANIES
The accompanying supplemental information should be read in conjunction with the “MD&A”, “Consolidated Financial Statements” and notes thereto.
Certain reclassifications of prior period amounts have been made to conform to the current period presentation. These reclassifications did not have a material impact on our financial position or results of operations.
A-1
Distribution of Assets, Liabilities, and Shareholders’ Equity; Interest Rates and Interest Differential
The following tables provide a summary of our consolidated average balances including major categories of interest-earning assets and interest-bearing liabilities along with an analysis of net interest earnings. Consolidated average balances, interest, and average yields are segregated between U.S. and non-U.S. offices. Assets, liabilities, interest income and interest expense are attributed to the United States and outside the United States based on the location of the office recording such items.
| 2020 | 2019 | 2018 | ||||||||||||||||||||||||||||||||||||||||||||||||||||||
| Years Ended December 31, (Millions, except percentages) | Average Balance (a) | Interest Income | Average Yield | Average Balance (a) | Interest Income | Average Yield | Average Balance (a) | Interest Income | Average Yield | |||||||||||||||||||||||||||||||||||||||||||||||
| Interest-earning assets | ||||||||||||||||||||||||||||||||||||||||||||||||||||||||
| Interest-bearing deposits in other banks | ||||||||||||||||||||||||||||||||||||||||||||||||||||||||
| U.S. | $ | 31,446 | $ | 100 | 0.3 | % | $ | 22,169 | $ | 517 | 2.3 | % | $ | 24,570 | $ | 485 | 2.0 | % | ||||||||||||||||||||||||||||||||||||||
| Non-U.S. | 2,367 | 51 | 2.2 | 2,085 | 48 | 2.3 | 1,830 | 33 | 1.8 | |||||||||||||||||||||||||||||||||||||||||||||||
| Federal funds sold and securities purchased under agreements to resell | ||||||||||||||||||||||||||||||||||||||||||||||||||||||||
| U.S. | — | — | — | 19 | 3 | 15.8 | — | — | — | |||||||||||||||||||||||||||||||||||||||||||||||
| Non-U.S. | 184 | 11 | 6.0 | 56 | 6 | 10.7 | 58 | 7 | 12.1 | |||||||||||||||||||||||||||||||||||||||||||||||
| Short-term investment securities | ||||||||||||||||||||||||||||||||||||||||||||||||||||||||
| U.S. | 658 | 7 | 1.1 | 409 | 11 | 2.7 | 434 | 6 | 1.4 | |||||||||||||||||||||||||||||||||||||||||||||||
| Non-U.S. | 97 | 1 | 1.0 | 93 | 1 | 1.1 | 149 | 1 | 0.7 | |||||||||||||||||||||||||||||||||||||||||||||||
| Card Member loans (b) | ||||||||||||||||||||||||||||||||||||||||||||||||||||||||
| U.S. | 65,559 | 8,196 | 12.5 | 72,422 | 9,452 | 13.1 | 66,620 | 8,387 | 12.6 | |||||||||||||||||||||||||||||||||||||||||||||||
| Non-U.S. | 9,018 | 1,196 | 13.3 | 10,362 | 1,400 | 13.5 | 9,136 | 1,206 | 13.2 | |||||||||||||||||||||||||||||||||||||||||||||||
| Other loans (b) | ||||||||||||||||||||||||||||||||||||||||||||||||||||||||
| U.S. | 4,078 | 342 | 8.4 | 4,101 | 413 | 10.1 | 3,110 | 312 | 10.0 | |||||||||||||||||||||||||||||||||||||||||||||||
| Non-U.S. | 139 | 45 | 32.4 | 170 | 43 | 25.3 | 145 | 36 | 24.8 | |||||||||||||||||||||||||||||||||||||||||||||||
| Taxable investment securities(c) | ||||||||||||||||||||||||||||||||||||||||||||||||||||||||
| U.S. | 14,002 | 100 | 0.7 | 6,335 | 147 | 2.3 | 3,025 | 68 | 2.2 | |||||||||||||||||||||||||||||||||||||||||||||||
| Non-U.S. | 612 | 21 | 3.4 | 589 | 27 | 4.6 | 562 | 23 | 4.1 | |||||||||||||||||||||||||||||||||||||||||||||||
| Non-taxable investment securities (c) | ||||||||||||||||||||||||||||||||||||||||||||||||||||||||
| U.S. | 128 | 5 | 5.1 | 237 | 11 | 5.9 | 855 | 25 | 3.7 | |||||||||||||||||||||||||||||||||||||||||||||||
| Other assets (d) | ||||||||||||||||||||||||||||||||||||||||||||||||||||||||
| Primarily U.S. | 38 | 8 | n.m. | 17 | 5 | n.m. | 1 | 17 | n.m. | |||||||||||||||||||||||||||||||||||||||||||||||
| Total interest-earning assets (e) | $ | 128,326 | $ | 10,083 | 7.9 | % | $ | 119,064 | $ | 12,084 | 10.2 | % | $ | 110,495 | $ | 10,606 | 9.6 | % | ||||||||||||||||||||||||||||||||||||||
| U.S. | 115,909 | 8,758 | 105,709 | 10,559 | 98,615 | 9,300 | ||||||||||||||||||||||||||||||||||||||||||||||||||
| Non-U.S. | 12,417 | 1,325 | 13,355 | 1,525 | 11,880 | 1,306 |
n.m. Denotes rates determined to not be meaningful.
(a)Averages based on month-end balances.
(b)Average non-accrual loans were included in the average Card Member loan balances in amounts of $275 million, $307 million and $230 million in U.S. for 2020, 2019 and 2018, respectively. Average other loan balances for U.S. include average non-accrual loans of $3 million, $7 million and $4 million for 2020, 2019 and 2018, respectively. Average non-accrual loans are considered to determine the average yield on loans.
(c)Average yields for both taxable and non-taxable investment securities have been calculated using amortized cost balances and do not include changes in fair value recorded in other comprehensive loss. Average yield on non-taxable investment securities is calculated on a tax-equivalent basis using the U.S. federal statutory tax rate of 21 percent for 2020, 2019 and 2018.
(d)Amounts include (i) average equity securities balances, which are included in investment securities on the Consolidated Balance Sheets, and (ii) the associated income.
(e)The average yield on total interest-earning assets is adjusted for the impacts of the items mentioned in footnote (c).
A-2
| Years Ended December 31, (Millions, except percentages) | 2020 Average Balance (a) | 2019 Average Balance (a) | 2018 Average Balance (a) | |||||||||||||||||
| Non-interest-earning assets | ||||||||||||||||||||
| Cash and due from banks | ||||||||||||||||||||
| U.S. | $ | 2,205 | $ | 2,842 | $ | 2,793 | ||||||||||||||
| Non-U.S. | 823 | 732 | 527 | |||||||||||||||||
| Card Member receivables, net | ||||||||||||||||||||
| U.S. | 27,414 | 27,724 | 26,435 | |||||||||||||||||
| Non-U.S. | 16,009 | 28,040 | 27,100 | |||||||||||||||||
| Reserves for credit losses on Card Member and other loans | ||||||||||||||||||||
| U.S. | (4,682) | (2,057) | (1,740) | |||||||||||||||||
| Non-U.S. | (526) | (258) | (217) | |||||||||||||||||
| Other assets (b) | ||||||||||||||||||||
| U.S. | 14,680 | 12,689 | 12,351 | |||||||||||||||||
| Non-U.S. | 5,830 | 5,593 | 5,077 | |||||||||||||||||
| Total non-interest-earning assets | 61,753 | 75,305 | 72,326 | |||||||||||||||||
| U.S. | 39,617 | 41,198 | 39,839 | |||||||||||||||||
| Non-U.S. | 22,136 | 34,107 | 32,487 | |||||||||||||||||
| Total assets | $ | 190,079 | $ | 194,369 | $ | 182,821 | ||||||||||||||
| U.S. | 155,526 | 146,908 | 138,454 | |||||||||||||||||
| Non-U.S. | 34,553 | 47,461 | 44,367 | |||||||||||||||||
| Percentage of total average assets attributable to non-U.S. activities | 18.2 | % | 24.4 | % | 24.3 | % |
(a)Averages based on month-end balances.
(b)Includes premises and equipment, net of accumulated depreciation and amortization.
A-3
| 2020 | 2019 | 2018 | ||||||||||||||||||||||||||||||||||||||||||||||||||||||
| Years Ended December 31, (Millions, except percentages) | Average Balance (a) | Interest Expense | Average Rate | Average Balance (a) | Interest Expense | Average Rate | Average Balance (a) | Interest Expense | Average Rate | |||||||||||||||||||||||||||||||||||||||||||||||
| Interest-bearing liabilities | ||||||||||||||||||||||||||||||||||||||||||||||||||||||||
| Customer deposits | ||||||||||||||||||||||||||||||||||||||||||||||||||||||||
| U.S. | ||||||||||||||||||||||||||||||||||||||||||||||||||||||||
| Savings | $ | 69,796 | $ | 697 | 1.0 | % | $ | 59,087 | $ | 1,247 | 2.1 | % | $ | 50,499 | $ | 919 | 1.8 | % | ||||||||||||||||||||||||||||||||||||||
| Time | 9,898 | 237 | 2.4 | 12,179 | 298 | 2.4 | 15,975 | 357 | 2.2 | |||||||||||||||||||||||||||||||||||||||||||||||
| Demand | 752 | 5 | 0.7 | 447 | 9 | 2.0 | 285 | 6 | 2.1 | |||||||||||||||||||||||||||||||||||||||||||||||
| Non-U.S. | ||||||||||||||||||||||||||||||||||||||||||||||||||||||||
| Other time and savings | 11 | 1 | 9.1 | 16 | 1 | 6.3 | 21 | 1 | 4.8 | |||||||||||||||||||||||||||||||||||||||||||||||
| Other demand | 11 | 3 | 27.3 | 10 | 4 | 40.0 | 12 | 4 | 33.3 | |||||||||||||||||||||||||||||||||||||||||||||||
| Short-term borrowings | ||||||||||||||||||||||||||||||||||||||||||||||||||||||||
| U.S. | 769 | 18 | 2.3 | 407 | 22 | 5.4 | 274 | 14 | 5.1 | |||||||||||||||||||||||||||||||||||||||||||||||
| Non-U.S. | 2,017 | 11 | 0.5 | 2,621 | 15 | 0.6 | 2,106 | 19 | 0.9 | |||||||||||||||||||||||||||||||||||||||||||||||
| Long-term debt and other (b) | ||||||||||||||||||||||||||||||||||||||||||||||||||||||||
| U.S. | 48,690 | 1,123 | 2.3 | 57,936 | 1,859 | 3.2 | 54,631 | 1,613 | 3.0 | |||||||||||||||||||||||||||||||||||||||||||||||
| Non-U.S. | 336 | 3 | 0.9 | 325 | 9 | 2.8 | 390 | 10 | 2.6 | |||||||||||||||||||||||||||||||||||||||||||||||
| Total interest-bearing liabilities | $ | 132,280 | $ | 2,098 | 1.6 | % | $ | 133,028 | $ | 3,464 | 2.6 | % | $ | 124,193 | $ | 2,943 | 2.4 | % | ||||||||||||||||||||||||||||||||||||||
| U.S. | 129,905 | 2,080 | 130,056 | 3,435 | 121,664 | 2,909 | ||||||||||||||||||||||||||||||||||||||||||||||||||
| Non-U.S. | 2,375 | 18 | 2,972 | 29 | 2,529 | 34 | ||||||||||||||||||||||||||||||||||||||||||||||||||
| Non-interest-bearing liabilities | ||||||||||||||||||||||||||||||||||||||||||||||||||||||||
| Accounts payable | ||||||||||||||||||||||||||||||||||||||||||||||||||||||||
| U.S. | 4,642 | 7,116 | 7,120 | |||||||||||||||||||||||||||||||||||||||||||||||||||||
| Non-U.S. | 4,737 | 6,202 | 6,064 | |||||||||||||||||||||||||||||||||||||||||||||||||||||
| Customer Deposits(c) | ||||||||||||||||||||||||||||||||||||||||||||||||||||||||
| U.S. | 766 | 385 | 377 | |||||||||||||||||||||||||||||||||||||||||||||||||||||
| Non-U.S. | 682 | 387 | 370 | |||||||||||||||||||||||||||||||||||||||||||||||||||||
| Other liabilities | ||||||||||||||||||||||||||||||||||||||||||||||||||||||||
| U.S. | 18,954 | 18,360 | 18,619 | |||||||||||||||||||||||||||||||||||||||||||||||||||||
| Non-U.S. | 6,016 | 6,079 | 5,428 | |||||||||||||||||||||||||||||||||||||||||||||||||||||
| Total non-interest-bearing liabilities | 35,797 | 38,529 | 37,978 | |||||||||||||||||||||||||||||||||||||||||||||||||||||
| U.S. | 24,362 | 25,861 | 26,116 | |||||||||||||||||||||||||||||||||||||||||||||||||||||
| Non-U.S. | 11,435 | 12,668 | 11,862 | |||||||||||||||||||||||||||||||||||||||||||||||||||||
| Total liabilities | 168,077 | 171,557 | 162,171 | |||||||||||||||||||||||||||||||||||||||||||||||||||||
| U.S. | 154,267 | 155,917 | 147,780 | |||||||||||||||||||||||||||||||||||||||||||||||||||||
| Non-U.S. | 13,810 | 15,640 | 14,391 | |||||||||||||||||||||||||||||||||||||||||||||||||||||
| Total shareholders' equity | 22,002 | 22,812 | 20,650 | |||||||||||||||||||||||||||||||||||||||||||||||||||||
| Total liabilities and shareholders' equity | $ | 190,079 | $ | 194,369 | $ | 182,821 | ||||||||||||||||||||||||||||||||||||||||||||||||||
| Percentage of total average liabilities attributable to non-U.S. activities | 8.2 | % | 9.1 | % | 8.9 | % | ||||||||||||||||||||||||||||||||||||||||||||||||||
| Interest rate spread | 6.3 | % | 7.6 | % | 7.2 | % | ||||||||||||||||||||||||||||||||||||||||||||||||||
| Net interest income and net average yield on interest-earning assets**(d)`** | $ | 7,985 | 6.2 | % | $ | 8,620 | 7.2 | % | $ | 7,663 | 6.9 | % |
(a)Averages based on month-end balances.
(b)Interest expense primarily reflects interest on long-term financing and interest incurred on derivative instruments in qualifying hedging relationships on the hedged debt instruments.
(c)U.S. non-interest-bearing Customer deposits include average Card Member credit balances of $742 million, $353 million and $342 million for 2020, 2019 and 2018, respectively. Non-U.S. non-interest-bearing Customer deposits include average Card Member credit balances of $679 million, $381 million and $359 million for 2020, 2019 and 2018, respectively.
(d)Net average yield on interest-earning assets is defined as net interest income divided by average total interest-earning assets as adjusted for the items mentioned in footnote (c) from the table on A-1.
A-4
Changes in Net Interest Income − Volume and Rate Analysis (a)
The following table presents the amount of changes in interest income and interest expense due to changes in both average volume and average rate. Major categories of interest-earning assets and interest-bearing liabilities have been segregated between U.S. and non-U.S. offices. Average volume/rate changes have been allocated between the average volume and average rate variances on a consistent basis based upon the respective percentage changes in average balances and average rates.
| 2020 Versus 2019 | 2019 Versus 2018 | |||||||||||||||||||||||||||||||||||||
| Increase (Decrease) due to change in: | Increase (Decrease) due to change in: | |||||||||||||||||||||||||||||||||||||
| Years Ended December 31, (Millions) | Average Volume | Average Rate | Net Change | Average Volume | Average Rate | Net Change | ||||||||||||||||||||||||||||||||
| Interest-earning assets | ||||||||||||||||||||||||||||||||||||||
| Interest-bearing deposits in other banks | ||||||||||||||||||||||||||||||||||||||
| U.S. | $ | 216 | $ | (633) | $ | (417) | $ | (47) | $ | 79 | $ | 32 | ||||||||||||||||||||||||||
| Non-U.S. | 6 | (3) | 3 | 5 | 10 | 15 | ||||||||||||||||||||||||||||||||
| Federal funds sold and securities purchased under agreements to resell | ||||||||||||||||||||||||||||||||||||||
| U.S. | (3) | — | (3) | — | 3 | 3 | ||||||||||||||||||||||||||||||||
| Non-U.S. | 14 | (9) | 5 | — | (1) | (1) | ||||||||||||||||||||||||||||||||
| Short-term investment securities | ||||||||||||||||||||||||||||||||||||||
| U.S. | 7 | (11) | (4) | — | 5 | 5 | ||||||||||||||||||||||||||||||||
| Non-U.S. | — | — | — | — | — | — | ||||||||||||||||||||||||||||||||
| Card Member loans | ||||||||||||||||||||||||||||||||||||||
| U.S. | (896) | (360) | (1,256) | 730 | 335 | 1,065 | ||||||||||||||||||||||||||||||||
| Non-U.S. | (182) | (22) | (204) | 162 | 32 | 194 | ||||||||||||||||||||||||||||||||
| Other loans | ||||||||||||||||||||||||||||||||||||||
| U.S. | (2) | (69) | (71) | 99 | 2 | 101 | ||||||||||||||||||||||||||||||||
| Non-U.S. | (8) | 10 | 2 | 6 | 1 | 7 | ||||||||||||||||||||||||||||||||
| Taxable investment securities | ||||||||||||||||||||||||||||||||||||||
| U.S. | 177 | (224) | (47) | 72 | 7 | 79 | ||||||||||||||||||||||||||||||||
| Non-U.S. | 1 | (7) | (6) | 1 | 3 | 4 | ||||||||||||||||||||||||||||||||
| Non-taxable investment securities | ||||||||||||||||||||||||||||||||||||||
| U.S. | (7) | 1 | (6) | (18) | 4 | (14) | ||||||||||||||||||||||||||||||||
| Other assets | ||||||||||||||||||||||||||||||||||||||
| Primarily U.S. | 6 | (3) | 3 | 272 | (284) | (12) | ||||||||||||||||||||||||||||||||
| Change in interest income | (671) | (1,330) | (2,001) | 1,282 | 196 | 1,478 | ||||||||||||||||||||||||||||||||
| Interest-bearing liabilities | ||||||||||||||||||||||||||||||||||||||
| Customer deposits | ||||||||||||||||||||||||||||||||||||||
| U.S. | ||||||||||||||||||||||||||||||||||||||
| Savings | 226 | (776) | (550) | 156 | 172 | 328 | ||||||||||||||||||||||||||||||||
| Time | (56) | (5) | (61) | (85) | 26 | (59) | ||||||||||||||||||||||||||||||||
| Demand | 6 | (10) | (4) | 3 | — | 3 | ||||||||||||||||||||||||||||||||
| Non-U.S. | ||||||||||||||||||||||||||||||||||||||
| Other time and savings | — | — | — | — | — | — | ||||||||||||||||||||||||||||||||
| Other demand | — | (1) | (1) | (1) | 1 | — | ||||||||||||||||||||||||||||||||
| Short-term borrowings | ||||||||||||||||||||||||||||||||||||||
| U.S. | 20 | (24) | (4) | 7 | 1 | 8 | ||||||||||||||||||||||||||||||||
| Non-U.S. | (3) | (1) | (4) | 5 | (9) | (4) | ||||||||||||||||||||||||||||||||
| Long-term debt and other | ||||||||||||||||||||||||||||||||||||||
| U.S. | (297) | (439) | (736) | 98 | 148 | 246 | ||||||||||||||||||||||||||||||||
| Non-U.S. | — | (6) | (6) | (2) | 1 | (1) | ||||||||||||||||||||||||||||||||
| Change in interest expense | (104) | (1,262) | (1,366) | 181 | 340 | 521 | ||||||||||||||||||||||||||||||||
| Change in net interest income | $ | (567) | $ | (68) | $ | (635) | $ | 1,101 | $ | (144) | $ | 957 |
(a)Refer to footnotes from “Distribution of Assets, Liabilities and Shareholders’ Equity” for additional information.
A-5
Maturities and Sensitivities to Changes in Interest Rates
The following table presents contractual maturities of loans and Card Member receivables by customer type, and segregated between U.S. and non-U.S. based on domicile of the borrowers, and distribution between fixed and floating interest rates for loans due after one year based upon the stated terms of the loan agreements.
| December 31, (Millions) | 2020 | |||||||||||||||||||||||||||||||
| Within 1 year (a) | 1-5 years (b) (c) | 5-15 years (c) | After 15 years (c) | Total | ||||||||||||||||||||||||||||
| Loans | ||||||||||||||||||||||||||||||||
| U.S. loans | ||||||||||||||||||||||||||||||||
| Card Member | $ | 63,662 | $ | 482 | $ | — | $ | — | $ | 64,144 | ||||||||||||||||||||||
| Other | 497 | 2,068 | 112 | 57 | 2,734 | |||||||||||||||||||||||||||
| Non-U.S. loans | ||||||||||||||||||||||||||||||||
| Card Member | 9,229 | — | — | — | 9,229 | |||||||||||||||||||||||||||
| Other | 92 | 26 | — | — | 118 | |||||||||||||||||||||||||||
| Total loans | $ | 73,480 | $ | 2,576 | $ | 112 | $ | 57 | $ | 76,225 | ||||||||||||||||||||||
| Loans due after one year at fixed interest rates | ||||||||||||||||||||||||||||||||
| Card Member | $ | 482 | $ | — | $ | — | $ | 482 | ||||||||||||||||||||||||
| Other | 2,070 | — | 57 | 2,127 | ||||||||||||||||||||||||||||
| Loans due after one year at variable interest rates | ||||||||||||||||||||||||||||||||
| Card Member | — | — | — | — | ||||||||||||||||||||||||||||
| Other | 24 | 112 | — | 136 | ||||||||||||||||||||||||||||
| Total loans | $ | 2,576 | $ | 112 | $ | 57 | $ | 2,745 | ||||||||||||||||||||||||
| Card Member receivables | ||||||||||||||||||||||||||||||||
| U.S. | $ | 30,287 | $ | 193 | $ | — | $ | — | $ | 30,480 | ||||||||||||||||||||||
| Non-U.S. | 13,221 | — | — | — | 13,221 | |||||||||||||||||||||||||||
| Total Card Member receivables | $ | 43,508 | $ | 193 | $ | — | $ | — | $ | 43,701 |
(a)Card Member loans have no stated maturity and are therefore included in the due within one year category. However, many of our Card Members will revolve their balances, which may extend their repayment period beyond one year for balances outstanding as of December 31, 2020. Card member receivables are due upon receipt of Card Member statements and have no stated interest rate and are therefore included in the due within one year category.
(b)Card Member loans and receivables due after one year represent Troubled Debt Restructurings (TDRs). Card Members experiencing financial difficulties are offered modification programs wherein a long-term concession (more than 12 months) has been granted to the borrower and are classified as TDRs.
(c)Other loans due after one year primarily represents installment loans.
A-6
Credit Quality Indicators for Loans and Card Member Receivables
As a result of the adoption of CECL on January 1, 2020, there is a lack of comparability in both the reserves and provisions for credit losses for the periods presented. Results for reporting periods beginning after January 1, 2020 are presented using the CECL methodology, while comparative information continues to be reported in accordance with the incurred loss methodology in effect for prior periods. Refer to Note 1 and Note 3 to the “Consolidated Financial Statements” for further information.
The following table summarizes the ratio of all loans and Card Member receivables categories.
| Years Ended December 31, (Millions, except percentages and where indicated) | 2020 | 2019 | ||||||||||||
| Card Member loans | ||||||||||||||
| Net write-offs — principal less recoveries | $ | 1,795 | $ | 1,860 | ||||||||||
| Net write-offs — interest and fees less recoveries | $ | 375 | $ | 375 | ||||||||||
| Average Card Member loans (billions)(a) | $ | 74.6 | $ | 82.8 | ||||||||||
| Principal only net write-offs / average Card Member loans outstanding (b) | 2.4 | % | 2.2 | % | ||||||||||
| Principal, interest and fees net write-offs / average Card Member loans outstanding (b) | 2.9 | % | 2.7 | % | ||||||||||
| Other loans | ||||||||||||||
| Net write-offs | $ | 111 | $ | 97 | ||||||||||
| Average Other loans (billions)(a) | $ | 4.2 | $ | 4.3 | ||||||||||
| Net write-offs/average other loans outstanding (b) | 2.6 | % | 2.3 | % | ||||||||||
| Card Member receivables | ||||||||||||||
| Net write-offs — principal and fees less recoveries | $ | 881 | $ | 900 | ||||||||||
| Average Card Member receivables (billions)(a) | $ | 43.9 | $ | 56.4 | ||||||||||
| Net write-offs / average Card Member receivables outstanding (b) | 2.0 | % | 1.6 | % | ||||||||||
| Reserve for credit losses | $ | 5,849 | $ | 3,154 | ||||||||||
| Non-accrual loans (c) | $ | 176 | $ | 346 | ||||||||||
| Reserve for credit losses to total loans and Card Member receivables (d) | 4.9 | % | 2.1 | % | ||||||||||
| Non-accrual loans to total loans (e) | 0.2 | % | 0.4 | % | ||||||||||
| Reserve for credit losses to non-accrual loans (f) | 3171.4 | % | 732.8 | % |
(a)Averages are based on month-end balances for the periods presented.
(b)The net write-off rate presented is on a worldwide basis and is based on principal losses only (i.e., excluding interest and/or fees) to be consistent with industry convention. In addition, as our practice is to include uncollectible interest and/or fees as part of our total provision for credit losses, a net write-off rate including principal, interest and/or fees is also presented.
(c)Non-accrual loans not in modification programs primarily include certain loans placed with outside collection agencies for which we have ceased accruing interest. Amounts presented exclude loans classified as TDR. Lower non-accrual loans are primarily driven by higher enrollments under In House TDR programs and lower delinquencies.
(d)Represents the reserve for credit losses as a percentage of total loans and Card Member receivables. Refer to “Maturities and Sensitivities to Changes in Interest Rates” for total outstanding balance of loans and Card Member receivables.
(e)Represents percentage of non-accrual loans to total loans.
(f)Represents the total reserve for credit losses on Card Member loans and other loans as a percentage of total non-accrual loans. Refer to “Allocation of reserve for credit losses” for reserve related to Card Member loans and other loans.
A-7
Allocation of Reserve for Credit Losses
The following table shows the reserve for credit losses allocated to each of loans and Card Member receivables by customer type, and between U.S. and non-U.S. borrowers.
| December 31, | 2020 | 2019 | ||||||||||||||||||||||||
| (Millions, except percentages) Reserve for credit losses at end of year applicable to | Amount | Percentage (a) | Amount | Percentage (a) | ||||||||||||||||||||||
| Loans U.S. loans | ||||||||||||||||||||||||||
| Card Member | $ | 4,820 | 86 | % | $ | 2,085 | 82 | % | ||||||||||||||||||
| Other | 228 | 4 | 150 | 6 | ||||||||||||||||||||||
| Non-U.S. loans | ||||||||||||||||||||||||||
| Card Member | 524 | 10 | 298 | 12 | ||||||||||||||||||||||
| Other | 10 | — | 2 | — | ||||||||||||||||||||||
| $ | 5,582 | 100 | % | $ | 2,535 | 100 | % | |||||||||||||||||||
| Card Member receivables | ||||||||||||||||||||||||||
| U.S. | $ | 216 | 81 | % | $ | 406 | 66 | % | ||||||||||||||||||
| Non-U.S. | 51 | 19 | 213 | 34 | ||||||||||||||||||||||
| $ | 267 | 100 | % | $ | 619 | 100 | % |
(a)Percentage of reserve for credit losses on loans and Card Member receivables in each category to the total reserve.
A-8
Uninsured Time Certificates of Deposit
The following table presents the amount of uninsured time certificates of deposit issued by us in our U.S. and Non U.S. offices, further segregated by time remaining until maturity. For any account holder with aggregate deposits in excess of insured limits, the uninsured deposits are calculated proportionately as a percentage of total deposits for each category of deposits held as of the reporting date.
| By remaining maturity as of December 31, 2020 | |||||||||||||||||||||||||||||
| (Millions) | 3 months or less | Over 3 months but within 6 months | Over 6 months but within 12 months | Over 12 months | Total | ||||||||||||||||||||||||
| U.S. (a) | $ | 65 | $ | 53 | $ | 100 | $ | 118 | $ | 336 | |||||||||||||||||||
| Non U.S. (b) | $ | 2 | $ | 1 | $ | 4 | $ | — | $ | 7 |
(a)We offer deposits within our U.S. bank subsidiary, AENB. These funds are currently insured up to $250,000 per account holder through the FDIC.
(b)Includes time deposits in certain of our Non-U.S. offices, that exceed the insurance limit as defined by the regulatory rules in individual markets.
A-9