 filings.tools
Item 2. MANAGEMENT’S DISCUSSION AND ANALYSIS OF FINANCIAL CONDITION AND RESULTS OF OPERATIONS
216K characters. Original on sec.gov · Markdown
Item 2. MANAGEMENT’S DISCUSSION AND ANALYSIS OF FINANCIAL CONDITION AND RESULTS OF OPERATIONS
Citizens Financial Group, Inc. | 6
FORWARD-LOOKING STATEMENTS
This document contains forward-looking statements within the meaning of the Private Securities Litigation Reform Act of 1995. Statements regarding potential future share repurchases and future dividends as well as the potential effects of the COVID-19 pandemic and associated lockdowns on our business, operations, financial performance and prospects, are forward-looking statements. Also, any statement that does not describe historical or current facts is a forward-looking statement. These statements often include the words “believes,” “expects,” “anticipates,” “estimates,” “intends,” “plans,” “goals,” “targets,” “initiatives,” “potentially,” “probably,” “projects,” “outlook,” “guidance” or similar expressions or future conditional verbs such as “may,” “will,” “should,” “would,” and “could.”
Forward-looking statements are based upon the current beliefs and expectations of management, and on information currently available to management. Our statements speak as of the date hereof, and we do not assume any obligation to update these statements or to update the reasons why actual results could differ from those contained in such statements in light of new information or future events. We caution you, therefore, against relying on any of these forward-looking statements. They are neither statements of historical fact nor guarantees or assurances of future performance. While there is no assurance that any list of risks and uncertainties or risk factors is complete, important factors that could cause actual results to differ materially from those in the forward-looking statements include the following, without limitation:
-
Negative economic and political conditions that adversely affect the general economy, housing prices, the job market, consumer confidence and spending habits which may affect, among other things, the level of nonaccrual assets, charge-offs and provision expense;
-
The rate of growth in the economy and employment levels, as well as general business and economic conditions, and changes in the competitive environment;
-
Our ability to implement our business strategy, including the cost savings and efficiency components, and achieve our financial performance goals, including through the integration of Investors and the HSBC branches;
-
The COVID-19 pandemic and associated lockdowns and their effects on the economic and business environments in which we operate;
-
Our ability to meet heightened supervisory requirements and expectations;
-
Liabilities and business restrictions resulting from litigation and regulatory investigations;
-
Our capital and liquidity requirements under regulatory capital standards and our ability to generate capital internally or raise capital on favorable terms;
-
The effect of changes in interest rates on our net interest income, net interest margin and our mortgage originations, mortgage servicing rights and mortgages held for sale;
-
Changes in interest rates and market liquidity, as well as the magnitude of such changes, which may reduce interest margins, impact funding sources and affect the ability to originate and distribute financial products in the primary and secondary markets;
-
The effect of changes in the level of checking or savings account deposits on our funding costs and net interest margin;
-
Financial services reform and other current, pending or future legislation or regulation that could have a negative effect on our revenue and businesses;
-
A failure in or breach of our operational or security systems or infrastructure, or those of our third party vendors or other service providers, including as a result of cyber-attacks;
-
An inability to complete the acquisitions of Investors or the HSBC branches, or changes in the current anticipated timeframe, terms or manner of such acquisitions;
-
Greater than expected costs or other difficulties related to the integration of our business and that of Investors and HSBC branches;
-
The inability to retain existing Investors or HSBC clients and employees following the closings of the Investors and HSBC branch acquisitions;
Citizens Financial Group, Inc. | 7
-
The occurrence of any event change or other circumstance that could give rise to the right of one or both parties to terminate (i) the agreement to acquire Investors or (ii) the agreement to acquire HSBC branches; and
-
Management’s ability to identify and manage these and other risks.
In addition to the above factors, we also caution that the actual amounts and timing of any future common stock dividends or share repurchases will be subject to various factors, including our capital position, financial performance, risk-weighted assets, capital impacts of strategic initiatives, market conditions and regulatory and accounting considerations, as well as any other factors that our Board of Directors deems relevant in making such a determination. Therefore, there can be no assurance that we will repurchase shares from or pay any dividends to holders of our common stock, or as to the amount of any such repurchases or dividends. Further, statements about the effects of the COVID-19 pandemic and associated lockdowns on our business, operations, financial performance and prospects may constitute forward-looking statements and are subject to the risk that the actual impacts may differ, possibly materially, from what is reflected in those forward-looking statements due to factors and future developments that are uncertain, unpredictable and in many cases beyond our control, including the scope and duration of the pandemic, actions taken by governmental authorities in response to the pandemic, and the direct and indirect impact of the pandemic on our customers, third parties and us. In addition, statements about our net charge-off guidance constitute forward-looking statements and are subject to the risk that the actual charge-offs may differ, possibly materially, from what is reflected in those statements due to, among other potential factors, the impact of the COVID-19 pandemic and the effectiveness of stimulus and forbearance programs in response, changes in economic conditions, and idiosyncratic events affecting our commercial loans. Statements about Citizens’ agreement to acquire Investors and CBNA’s agreement to acquire HSBC branches also constitute forward-looking statements and are subject to the risk that actual results could be materially different from those expressed in those statements, including if either of both transactions are not consummated in a timely manner or at all, or if integration is more costly or difficult than expected.
More information about factors that could cause actual results to differ materially from those described in the forward-looking statements can be found in the “Risk Factors” section in Part I, Item 1A of our 2020 Form 10-K as well as Part II, Item 1A of our Form 10-Q for the quarter ended June 30, 2021.
INTRODUCTION
Citizens Financial Group, Inc. is one of the nation’s oldest and largest financial institutions with $187.0 billion in assets as of September 30, 2021. Headquartered in Providence, Rhode Island, we offer a broad range of retail and commercial banking products and services to individuals, small businesses, middle-market companies, large corporations, and institutions. We help our customers reach their potential by listening to them and by understanding their needs to offer tailored advice, ideas, and solutions. In Consumer Banking, we provide an integrated experience that includes mobile and online banking, a 24/7 customer contact center, the convenience of approximately 3,000 ATMs and approximately 1,000 branches in 11 states in the New England, Mid-Atlantic, and Midwest regions. Consumer Banking products and services include a full range of banking, lending, savings, wealth management and small business offerings. In Commercial Banking, we offer a broad complement of financial products and solutions, including lending and leasing, deposit and treasury management services, foreign exchange, interest rate and commodity risk management solutions, as well as loan syndication, corporate finance, merger and acquisition, and debt and equity capital markets capabilities. More information is available at www.citizensbank.com.
On May 26, 2021, CBNA entered into an agreement to acquire 80 East Coast branches and the national online deposit business from HSBC for an approximate 2.0% premium paid on deposits at closing. The HSBC acquisition provides an attractive entry into important metro markets and supports our national expansion strategy. The branch purchase includes 66 locations in the New York City Metro area, 9 locations in the Mid-Atlantic/Washington D.C. area, and 5 locations in Southeast Florida. As of September 30, 2021, there were approximately $8.4 billion in deposits and $1.9 billion in loans. The transaction is expected to close in the first quarter of 2022, subject to customary closing terms and conditions and regulatory approvals.
On July 28, 2021 Citizens entered into a definitive agreement and a plan of merger under which we will acquire all of the outstanding shares of Investors for a combination of stock and cash. Pursuant to the terms of the agreement, Investors shareholders will receive 0.297 of a share of the Company’s common stock and $1.46 in cash for each share of Investors they own. The acquisition of Investors enhances Citizens’ banking franchise, adding an attractive middle market, small business and consumer customer base while building our physical presence in the northeast with the addition of 154 branches located in the greater New York City and Philadelphia metropolitan areas and across New Jersey. As of September 30, 2021, Investors disclosed that it had total assets of $27.3 billion, including $21.6 billion of loans, $24.5 billion of liabilities, including $20.4 billion of
Citizens Financial Group, Inc. | 8
deposits, and $2.8 billion of stockholders’ equity. The merger is expected to close in early second quarter 2022, subject to approval by the shareholders of Investors, regulatory approvals, and other customary closing conditions.
On August 5, 2021, Citizens entered into a definitive agreement to acquire Willamette, a valuation consulting and forensic analysis firm with offices in Chicago, Atlanta, and Portland, Oregon. This transaction further strengthens our growing corporate financial advisory capabilities. The acquisition was completed on September 1, 2021.
On September 8, 2021, Citizens entered into a definitive agreement to acquire JMP in an all-cash transaction. This acquisition further strengthens Citizens’ corporate finance and strategic advisory capabilities. Under the agreement, JMP shareholders will receive $7.50 for each common share of JMP they own, or approximately $149 million in cash. This transaction is targeted to close in mid-fourth quarter 2021, subject to approval by the shareholders of JMP and other customary closing conditions.
The following MD&A is intended to assist readers in their analysis of the accompanying unaudited interim Consolidated Financial Statements and supplemental financial information. It should be read in conjunction with the unaudited interim Consolidated Financial Statements and Notes to the unaudited interim Consolidated Financial Statements in Part I, Item 1, as well as other information contained in this document and our 2020 Form 10-K.
Non-GAAP Financial Measures
This document contains non-GAAP financial measures denoted as “Underlying”, “excluding PPP loans”, as well as other results excluding the impact of certain items. Underlying results for any given reporting period exclude certain items that may occur in that period which management does not consider indicative of our on-going financial performance. We believe these non-GAAP financial measures provide useful information to investors because they are used by management to evaluate our operating performance and make day-to-day operating decisions. In addition, we believe our Underlying results or results excluding the impact of certain items in any given reporting period reflect our on-going financial performance and increase comparability of period-to-period results, and useful to consider in addition to our GAAP financial results.
Other companies may use similarly titled non-GAAP financial measures that are calculated differently from the way we calculate such measures. Accordingly, our non-GAAP financial measures may not be comparable to similar measures used by such companies. We caution investors not to place undue reliance on such non-GAAP financial measures, but to consider them with the most directly comparable GAAP measures. Non-GAAP financial measures have limitations as analytical tools and should not be considered in isolation or as a substitute for our results reported under GAAP.
Non-GAAP measures are denoted throughout our MD&A by the use of the term Underlying or identified as excluding the impact of certain items. Where there is a reference to these metrics in that paragraph, all measures that follow are on the same basis when applicable. For more information on the computation of non-GAAP financial measures, see “—Non-GAAP Financial Measures and Reconciliations.”
Citizens Financial Group, Inc. | 9
FINANCIAL PERFORMANCE
Quarterly Results - Key Highlights
Net income of $530 million increased 69% from $314 million in the third quarter of 2020, with earnings per diluted common share of $1.18, up $0.50 from $0.68 per diluted common share in the third quarter of 2020. ROTCE of 13.7% compared to 8.3% in the third quarter of 2020.
Third quarter 2021 results reflect $16 million of expenses, net of tax benefit, or $0.04 per diluted common share, from notable items compared to $24 million of expenses, net of tax benefit, or $0.05 per diluted common share, from notable items in third quarter of 2020. On an Underlying basis, which excludes notable items, net income available to common stockholders of $520 million compared with $313 million in the third quarter of 2020. Underlying EPS of $1.22 compared to $0.73 in the third quarter of 2020. Underlying ROTCE of 14.2% compared with 9.0% in third quarter of 2020.
| Table 1: Notable Items | |||||||||||||||||||||||||||||||||||||||||||||||||||||||||||
| Three Months Ended September 30, | |||||||||||||||||||||||||||||||||||||||||||||||||||||||||||
| 2021 | 2020 | ||||||||||||||||||||||||||||||||||||||||||||||||||||||||||
| (in millions) | Noninterest expense | Income tax expense | Net Income | Noninterest expense | Income tax expense | Net Income | |||||||||||||||||||||||||||||||||||||||||||||||||||||
| Reported results (GAAP): | $1,011 | $151 | $530 | $988 | $61 | $314 | |||||||||||||||||||||||||||||||||||||||||||||||||||||
| Less notable items: | |||||||||||||||||||||||||||||||||||||||||||||||||||||||||||
| Total integration costs | 4 | (1) | (3) | 2 | — | (2) | |||||||||||||||||||||||||||||||||||||||||||||||||||||
| Other notable items(1) | 19 | (6) | (13) | 29 | (7) | (22) | |||||||||||||||||||||||||||||||||||||||||||||||||||||
| Total notable items | 23 | (7) | (16) | 31 | (7) | (24) | |||||||||||||||||||||||||||||||||||||||||||||||||||||
| Underlying results (non-GAAP) | $988 | $158 | $546 | $957 | $68 | $338 |
(1) Other notable items for the third quarter of 2021 include a pension settlement charge and a compensation-related tax credit as well as TOP 6 transformational and revenue and efficiency initiatives. Third quarter 2020 includes our TOP 6 transformational and revenue and efficiency initiatives.
-
Total revenue of $1.7 billion decreased $132 million, or 7%, from the third quarter of 2020, driven by a decrease of 21% in noninterest income, partially offset by a 1% increase in net interest income.
-
Net interest income of $1.1 billion increased 1% compared to the third quarter of 2020 reflecting 4% growth in interest-earning assets, largely offset by lower net interest margin.
◦Net interest margin of 2.72% decreased 10 basis points compared to 2.82% in the third quarter of 2020, primarily reflecting the impact of elevated cash balances and the lower rate environment, partly offset by improved funding mix and deposit pricing and the benefit of accelerated PPP loan forgiveness.
–Net interest margin on a FTE basis of 2.72% decreased 11 basis points compared to 2.83% in the third quarter of 2020.
–Average loans and leases of $122.6 billion decreased $2.3 billion, or 2%, from $124.9 billion in the third quarter of 2020, driven by a $5.2 billion decrease in commercial reflecting payoffs and a $1.9 billion decrease in PPP loans. The decrease in commercial was partially offset by a $2.9 billion increase in retail driven by growth in education, residential mortgage and automobile, partially offset by planned runoff of personal unsecured installment loans and a decrease in home equity.
*–*Average deposits of $151.9 billion increased $10.5 billion, or 7%, from $141.4 billion in the third quarter of 2020, reflecting an increase in demand deposits, money market accounts, savings and checking with interest, partially offset by a decrease in term deposits.
**◦**Noninterest income of $514 million decreased $140 million, or 21%, from the third quarter of 2020, driven by a decline in mortgage banking fees and other income, partially offset by higher capital markets, service charges, card and trust and investment services fees.
- Noninterest expense of $1.0 billion was stable compared to the third quarter of 2020.
Citizens Financial Group, Inc. | 10
**◦**On an Underlying basis, noninterest expense of $988 million increased $31 million, or 3%, from the third quarter of 2020, given higher salaries and employee benefits, outside services and other operating expense.
- The efficiency ratio of 60.9% compared to 55.2% in the third quarter of 2020.
◦On an Underlying basis, the efficiency ratio of 59.5% compared to 53.4% in the third quarter of 2020.
- Credit provision benefit of $33 million compares with a $428 million credit provision expense in the third quarter of 2020, reflecting strong credit performance across the retail and commercial loan portfolios and improvement in the macroeconomic outlook.
Year to Date and Period End - Key Highlights
Net income of $1.8 billion increased $1.2 billion from the first nine months of 2020, with earnings per diluted common share of $3.99, up $2.76 from $1.23 per diluted common share in the first nine months of 2020. ROTCE of 16.1% increased from 5.1% in the first nine months of 2020. Improved results primarily reflect the impact of the COVID-19 pandemic and associated lockdowns in the first nine months of 2020, resulting in a significant ACL reserve build during this period.
In the first nine months of 2021, results reflect $39 million of expenses, net of tax benefit, or $0.10 per diluted common share, from notable items compared to $59 million of expenses, net of tax benefit, or $0.14 per diluted common share, from notable items in the first nine months of 2020.
| Table 2: Notable Items | |||||||||||||||||||||||||||||||||||||||||||||||||||||||||||
| Nine Months Ended September 30, | |||||||||||||||||||||||||||||||||||||||||||||||||||||||||||
| 2021 | 2020 | ||||||||||||||||||||||||||||||||||||||||||||||||||||||||||
| (in millions) | Noninterest expense | Income tax expense | Net Income | Noninterest expense | Income tax expense | Net Income | |||||||||||||||||||||||||||||||||||||||||||||||||||||
| Reported results (GAAP) | $3,020 | $504 | $1,789 | $2,979 | $126 | $601 | |||||||||||||||||||||||||||||||||||||||||||||||||||||
| Less notable items: | |||||||||||||||||||||||||||||||||||||||||||||||||||||||||||
| Total integration costs | 6 | (2) | (4) | 8 | (2) | (6) | |||||||||||||||||||||||||||||||||||||||||||||||||||||
| Other notable items(1) | 48 | (13) | (35) | 75 | (22) | (53) | |||||||||||||||||||||||||||||||||||||||||||||||||||||
| Total notable items | 54 | (15) | (39) | 83 | (24) | (59) | |||||||||||||||||||||||||||||||||||||||||||||||||||||
| Underlying results (non-GAAP) | $2,966 | $519 | $1,828 | $2,896 | $150 | $660 |
(1) For the nine months ended September 30, 2021, Other notable items include a pension settlement charge and a compensation-related credit as well as our TOP 6 transformational and revenue and efficiency initiatives. Other notable items for the nine months ended September 30, 2020 includes our TOP 6 transformational and revenue and efficiency initiatives as well as an income tax benefit related to legacy tax matters.
- Net income available to common stockholders of $1.7 billion increased $1.2 billion, compared to $526 million in the first nine months of 2020.
◦On an Underlying basis, which excludes notable items, net income available to common stockholders of $1.7 billion compared with $585 million in the first nine months of 2020.
◦On an Underlying basis, EPS of $4.09 compared to $1.37 in the first nine months of 2020.
- Total revenue of $4.9 billion decreased $271 million, or 5%, from the first nine months of 2020, driven by declines of 11% and 2% in noninterest income and net interest income, respectively.
◦Net interest income of $3.4 billion decreased 2% given lower net interest margin, partially offset by 5% growth in interest-earning assets.
◦Net interest margin of 2.73% decreased 20 basis points from 2.93% in the first nine months of 2020, reflecting the impact of a lower rate environment, lower interest-earning asset yields and elevated cash balances, partly offset by improved funding mix and deposit pricing and the benefit of accelerated PPP loan forgiveness.
–Net interest margin on a FTE basis of 2.73% decreased 20 basis points, compared to 2.93% in the first nine months of 2020.
–Average loans and leases of $123.0 billion decreased $1.9 billion, or 2%, from $124.9 billion in the first nine months of 2020, driven by a $3.5 billion decrease in commercial reflecting line of credit repayments and net payoffs, partially offset by an increase in PPP loans. The decrease in commercial was partially offset by a $1.6 billion increase in retail driven by
Citizens Financial Group, Inc. | 11
growth in education, residential mortgage and automobile, partially offset by planned run-off of personal unsecured installment loans and a decrease in home equity.
–Period-end loans increased $228 million from the fourth quarter of 2020, reflecting 5% growth in retail and a 5% decline in commercial.
*–*Average deposits of $149.6 billion increased $13.1 billion, or 10%, from $136.5 billion in the first nine months of 2020, reflecting an increase in demand deposits, money market accounts, savings and checking with interest, partially offset by a decrease in term deposits.
–Period-end deposit growth of $5.1 billion, or 3%, from the fourth quarter of 2020, reflecting elevated liquidity tied to government stimulus associated with the COVID-19 disruption.
◦Noninterest income of $1.5 billion decreased $200 million, or 11%, from the first nine months of 2020, driven by a decline in mortgage banking fees partially offset by improved capital markets, trust and investment services, letter of credit and loan, card and service charges and fees.
- Noninterest expense of $3.0 billion was stable compared to the first nine months of 2020.
◦On an Underlying basis, noninterest expense increased 2% from the first nine months of 2020, reflecting higher outside services, equipment and software expense, and salaries and employee benefits, partially offset by a decrease in other operating expense.
- The efficiency ratio of 61.3% compared to 57.3% for the first nine months of 2020, and ROTCE of 16.1% compared to 5.1%.
◦On an Underlying basis, the efficiency ratio of 60.2% compared to 55.7% for the first nine months of 2020, and ROTCE of 16.5% compared to 5.7%.
-
Credit provision benefit of $386 million compares with a $1.5 billion credit provision expense for the first nine months of 2020, reflecting strong credit performance across the retail and commercial loan portfolios and improvement in the macroeconomic outlook.
-
Tangible book value per common share of $34.44 increased 7% from the first nine months of 2020. Fully diluted average common shares outstanding was stable over the same period.
Citizens Financial Group, Inc. | 12
SELECTED CONSOLIDATED FINANCIAL DATA
The summary of the Consolidated Operating Data for the three and nine months ended September 30, 2021 and 2020 and the summary Consolidated Balance Sheet data as of September 30, 2021 and December 31, 2020 are derived from our unaudited interim Consolidated Financial Statements, included in Part I, Item 1. Our historical results are not necessarily indicative of the results expected for any future period.
| Table 3: Summary of Consolidated Operating Data | |||||||||||||||||||||||
| Three Months Ended September 30, | Nine Months Ended September 30, | ||||||||||||||||||||||
| (dollars in millions, except per share amounts) | 2021 | 2020 | 2021 | 2020 | |||||||||||||||||||
| OPERATING DATA: | |||||||||||||||||||||||
| Net interest income | $1,145 | $1,137 | $3,386 | $3,457 | |||||||||||||||||||
| Noninterest income | 514 | 654 | 1,541 | 1,741 | |||||||||||||||||||
| Total revenue | 1,659 | 1,791 | 4,927 | 5,198 | |||||||||||||||||||
| Provision for credit losses | (33) | 428 | (386) | 1,492 | |||||||||||||||||||
| Noninterest expense | 1,011 | 988 | 3,020 | 2,979 | |||||||||||||||||||
| Income before income tax expense | 681 | 375 | 2,293 | 727 | |||||||||||||||||||
| Income tax expense | 151 | 61 | 504 | 126 | |||||||||||||||||||
| Net income | $530 | $314 | $1,789 | $601 | |||||||||||||||||||
| Net income available to common stockholders | $504 | $289 | $1,708 | $526 | |||||||||||||||||||
| Net income per common share - basic | $1.18 | $0.68 | $4.01 | $1.23 | |||||||||||||||||||
| Net income per common share - diluted | $1.18 | $0.68 | $3.99 | $1.23 | |||||||||||||||||||
| OTHER OPERATING DATA: | |||||||||||||||||||||||
| Return on average common equity | 9.39 | % | 5.60 | % | 10.91 | % | 3.45 | % | |||||||||||||||
| Return on average tangible common equity | 13.71 | 8.33 | 16.08 | 5.15 | |||||||||||||||||||
| Return on average total assets | 1.13 | 0.70 | 1.30 | 0.46 | |||||||||||||||||||
| Return on average total tangible assets | 1.17 | 0.73 | 1.35 | 0.48 | |||||||||||||||||||
| Efficiency ratio | 60.92 | 55.18 | 61.30 | 57.31 | |||||||||||||||||||
| Operating leverage | (9.64) | 7.77 | (6.59) | 2.95 | |||||||||||||||||||
| Net interest margin, FTE(1) | 2.72 | 2.83 | 2.73 | 2.93 | |||||||||||||||||||
| Effective income tax rate | 22.35 | 16.10 | 22.01 | 17.27 |
(1) Net interest margin is presented on a FTE basis using the federal statutory tax rate of 21%.
Citizens Financial Group, Inc. | 13
| Table 4: Summary of Consolidated Balance Sheet data | |||||||||||
| (dollars in millions) | September 30, 2021 | December 31, 2020 | |||||||||
| BALANCE SHEET DATA: | |||||||||||
| Total assets | $187,007 | $183,349 | |||||||||
| Loans held for sale, at fair value | 3,177 | 3,564 | |||||||||
| Other loans held for sale | 93 | 439 | |||||||||
| Loans and leases | 123,318 | 123,090 | |||||||||
| Allowance for loan and lease losses | (1,855) | (2,443) | |||||||||
| Total securities | 28,107 | 26,847 | |||||||||
| Goodwill | 7,065 | 7,050 | |||||||||
| Total liabilities | 163,584 | 160,676 | |||||||||
| Total deposits | 152,221 | 147,164 | |||||||||
| Short-term borrowed funds | 8 | 243 | |||||||||
| Long-term borrowed funds | 6,947 | 8,346 | |||||||||
| Total stockholders’ equity | 23,423 | 22,673 | |||||||||
| OTHER BALANCE SHEET DATA: | |||||||||||
| Asset Quality Ratios: | |||||||||||
| Allowance for loan and lease losses to loans and leases | 1.50 | % | 1.98 | % | |||||||
| Allowance for credit losses to loans and leases | 1.63 | 2.17 | |||||||||
| Allowance for credit losses to loans and leases, excluding the impact of PPP loans(1) | 1.65 | 2.24 | |||||||||
| Allowance for loan and lease losses to nonaccrual loans and leases | 248 | 240 | |||||||||
| Allowance for credit losses to nonaccrual loans and leases | 268 | 262 | |||||||||
| Nonaccrual loans and leases to loans and leases | 0.61 | 0.83 | |||||||||
| Capital Ratios: | |||||||||||
| CET1 capital ratio | 10.3 | % | 10.0 | % | |||||||
| Tier 1 capital ratio | 11.6 | 11.3 | |||||||||
| Total capital ratio | 13.4 | 13.4 | |||||||||
| Tier 1 leverage ratio | 9.7 | 9.4 |
(1) For more information on the computation of non-GAAP financial measures, see “—Introduction — Non-GAAP Financial Measures” and “—Non-GAAP Financial Measures and Reconciliations.”
Citizens Financial Group, Inc. | 14
RESULTS OF OPERATIONS
Net Interest Income
The following table presents a five quarter trend of our Net interest margin, FTE and Net interest income:
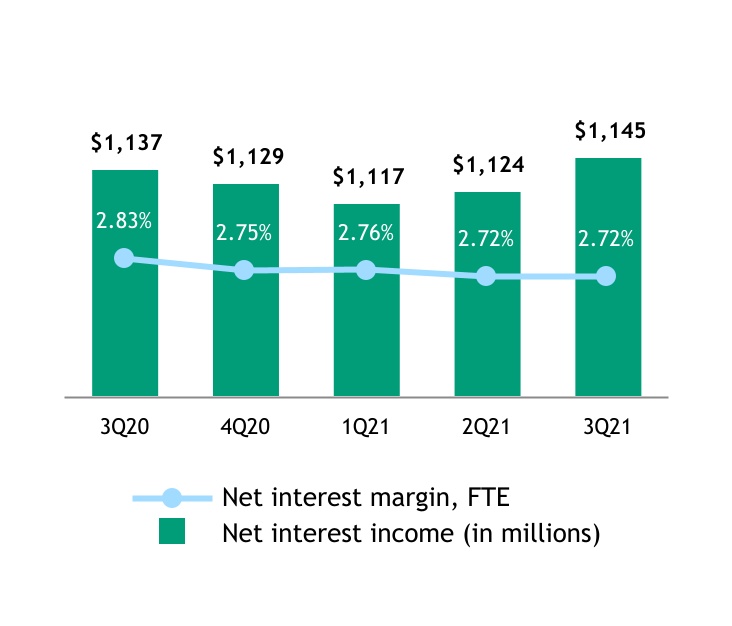
Third quarter 2021 versus second quarter 2021: Net interest income of $1.1 billion was up 2% given higher day count and interest-earning asset growth, with stable net interest margin. Net interest margin on a FTE basis of 2.72% reflects the benefit of accelerated PPP forgiveness, improved funding mix, and deposit pricing, partially offset by higher cash balances and lower earning-asset yields. Interest-bearing deposit costs of 14 basis points decreased 2 basis points.
Citizens Financial Group, Inc. | 15
| Table 5: Major Components of Net Interest Income, Quarter-to-Date | ||||||||||||||||||||||||||||||||
| Three Months Ended September 30, | ||||||||||||||||||||||||||||||||
| 2021 | 2020 | Change | ||||||||||||||||||||||||||||||
| (dollars in millions) | Average Balances | Income/ Expense | Yields/ Rates | Average Balances | Income/ Expense | Yields/ Rates | Average Balances | Yields/ Rates (bps) | ||||||||||||||||||||||||
| Assets | ||||||||||||||||||||||||||||||||
| Interest-bearing cash and due from banks and deposits in banks | $13,749 | $6 | 0.16 | % | $6,250 | $2 | 0.10 | % | $7,499 | 6 bps | ||||||||||||||||||||||
| Taxable investment securities | 27,466 | 116 | 1.69 | 24,654 | 121 | 1.95 | 2,812 | (26) | ||||||||||||||||||||||||
| Non-taxable investment securities | 2 | — | 2.60 | 4 | — | 2.60 | (2) | — | ||||||||||||||||||||||||
| Total investment securities | 27,468 | 116 | 1.69 | 24,658 | 121 | 1.95 | 2,810 | (26) | ||||||||||||||||||||||||
| Commercial and industrial | 42,330 | 362 | 3.36 | 46,844 | 383 | 3.20 | (4,514) | 16 | ||||||||||||||||||||||||
| Commercial real estate | 14,656 | 96 | 2.56 | 14,644 | 96 | 2.57 | 12 | (1) | ||||||||||||||||||||||||
| Leases | 1,695 | 12 | 2.72 | 2,373 | 16 | 2.65 | (678) | 7 | ||||||||||||||||||||||||
| Total commercial loans and leases | 58,681 | 470 | 3.14 | 63,861 | 495 | 3.03 | (5,180) | 11 | ||||||||||||||||||||||||
| Residential mortgages | 20,834 | 157 | 3.01 | 19,427 | 153 | 3.15 | 1,407 | (14) | ||||||||||||||||||||||||
| Home equity | 11,829 | 92 | 3.08 | 12,416 | 100 | 3.21 | (587) | (13) | ||||||||||||||||||||||||
| Automobile | 13,136 | 126 | 3.83 | 12,019 | 128 | 4.23 | 1,117 | (40) | ||||||||||||||||||||||||
| Education | 12,707 | 134 | 4.19 | 10,929 | 130 | 4.74 | 1,778 | (55) | ||||||||||||||||||||||||
| Other retail | 5,454 | 99 | 7.15 | 6,260 | 114 | 7.22 | (806) | (7) | ||||||||||||||||||||||||
| Total retail loans | 63,960 | 608 | 3.78 | 61,051 | 625 | 4.08 | 2,909 | (30) | ||||||||||||||||||||||||
| Total loans and leases | 122,641 | 1,078 | 3.47 | 124,912 | 1,120 | 3.54 | (2,271) | (7) | ||||||||||||||||||||||||
| Loans held for sale, at fair value | 3,299 | 21 | 2.51 | 3,295 | 21 | 2.60 | 4 | (9) | ||||||||||||||||||||||||
| Other loans held for sale | 112 | 1 | 3.98 | 1,061 | 16 | 6.02 | (949) | (204) | ||||||||||||||||||||||||
| Interest-earning assets | 167,269 | 1,222 | 2.89 | 160,176 | 1,280 | 3.15 | 7,093 | (26) | ||||||||||||||||||||||||
| Noninterest-earning assets | 18,839 | 17,499 | 1,340 | |||||||||||||||||||||||||||||
| Total assets | $186,108 | $177,675 | $8,433 | |||||||||||||||||||||||||||||
| Liabilities and Stockholders’ Equity | ||||||||||||||||||||||||||||||||
| Checking with interest | $27,965 | $7 | 0.09 | % | $26,638 | $8 | 0.13 | % | $1,327 | (4) | ||||||||||||||||||||||
| Money market accounts | 49,159 | 18 | 0.14 | 45,187 | 33 | 0.28 | 3,972 | (14) | ||||||||||||||||||||||||
| Regular savings | 20,803 | 5 | 0.09 | 16,902 | 10 | 0.24 | 3,901 | (15) | ||||||||||||||||||||||||
| Term deposits | 6,071 | 5 | 0.43 | 12,032 | 38 | 1.25 | (5,961) | (82) | ||||||||||||||||||||||||
| Total interest-bearing deposits | 103,998 | 35 | 0.14 | 100,759 | 89 | 0.35 | 3,239 | (21) | ||||||||||||||||||||||||
| Short-term borrowed funds | 23 | — | 2.06 | 240 | — | 0.13 | (217) | 193 | ||||||||||||||||||||||||
| Long-term borrowed funds | 6,956 | 42 | 2.38 | 9,196 | 54 | 2.35 | (2,240) | 3 | ||||||||||||||||||||||||
| Total borrowed funds | 6,979 | 42 | 2.38 | 9,436 | 54 | 2.30 | (2,457) | 8 | ||||||||||||||||||||||||
| Total interest-bearing liabilities | 110,977 | 77 | 0.28 | 110,195 | 143 | 0.52 | 782 | (24) | ||||||||||||||||||||||||
| Demand deposits | 47,873 | 40,608 | 7,265 | |||||||||||||||||||||||||||||
| Other liabilities | 3,904 | 4,374 | (470) | |||||||||||||||||||||||||||||
| Total liabilities | 162,754 | 155,177 | 7,577 | |||||||||||||||||||||||||||||
| Stockholders’ equity | 23,354 | 22,498 | 856 | |||||||||||||||||||||||||||||
| Total liabilities and stockholders’ equity | $186,108 | $177,675 | $8,433 | |||||||||||||||||||||||||||||
| Interest rate spread | 2.61 | % | 2.63 | % | (2) | |||||||||||||||||||||||||||
| Net interest income and net interest margin | $1,145 | 2.72 | % | $1,137 | 2.82 | % | (10) | |||||||||||||||||||||||||
| Net interest income and net interest margin, FTE(1) | $1,147 | 2.72 | % | $1,140 | 2.83 | % | (11) | |||||||||||||||||||||||||
| Memo: Total deposits (interest-bearing and demand) | $151,871 | $35 | 0.09 | % | $141,367 | $89 | 0.25 | % | $10,504 | (16) bps |
(1) Net interest income and net interest margin is presented on a FTE basis using the federal statutory tax rate of 21%. The FTE impact is predominantly attributable to commercial and industrial loans for the periods presented.
Third quarter 2021 vs third quarter 2020: Net interest income of $1.1 billion increased 1% from the third quarter of 2020 reflecting 4% growth in interest-earning assets, largely offset by lower net interest margin.
Net interest margin on a FTE basis of 2.72% decreased 11 basis points compared to 2.83% in the third quarter of 2020, primarily reflecting the impact of elevated cash balances and the lower rate environment, partially offset by an improved funding mix, deposit pricing, and the benefit of accelerated PPP loan forgiveness. Interest-bearing deposit costs decreased 21 basis points. Average interest-earning asset yields of 2.89% decreased 26 basis points from 3.15% in the third quarter of 2020, while average interest-bearing liability costs of 0.28% decreased 24 basis points from 0.52% in the third quarter of 2020.
Average interest-earning assets of $167.3 billion increased $7.1 billion, or 4%, from the third quarter of 2020, as elevated liquidity drove a $7.5 billion increase in cash held in interest-bearing deposits, and a $2.8 billion increase in investments. Loans and loans held for sale decreased $3.2 billion, or 2%, with a $5.2 billion decrease in average commercial reflecting line of credit repayments and net payoffs and a 1.9 billion decrease in
Citizens Financial Group, Inc. | 16
PPP loans. Retail loans increased $2.9 billion driven by growth in education, residential mortgage, and automobile, partially offset by planned run-off of personal unsecured installment loans and a decrease in home equity. Loans held for sale decreased $945 million, driven by education.
Average deposits of $151.9 billion increased $10.5 billion, or 7%, from the third quarter of 2020, reflecting an increase in demand deposits, money market accounts, savings and checking with interest, partially offset by a decrease in term deposits. Average total borrowed funds of $7.0 billion decreased $2.5 billion from the third quarter of 2020, as strong customer deposit inflows enabled the pay down of senior debt and short-term borrowings. Total borrowed funds costs of $42 million decreased $12 million from the third quarter of 2020. The total borrowed funds cost of 2.38% increased 8 basis points from 2.30% in the third quarter of 2020.
| Table 6: Major Components of Net Interest Income, Year-to-Date | ||||||||||||||||||||||||||||||||
| Nine Months Ended September 30, | ||||||||||||||||||||||||||||||||
| 2021 | 2020 | Change | ||||||||||||||||||||||||||||||
| (dollars in millions) | Average Balances | Income/ Expense | Yields/ Rates | Average Balances | Income/ Expense | Yields/ Rates | Average Balances | Yields/ Rates (bps) | ||||||||||||||||||||||||
| Assets: | ||||||||||||||||||||||||||||||||
| Interest-bearing cash and due from banks and deposits in banks | $11,967 | $12 | 0.13 | % | $4,453 | $8 | 0.24 | % | $7,514 | (11) bps | ||||||||||||||||||||||
| Taxable investment securities | 27,366 | 368 | 1.79 | 25,056 | 398 | 2.12 | 2,310 | (33) | ||||||||||||||||||||||||
| Non-taxable investment securities | 3 | — | 2.60 | 4 | — | 2.60 | (1) | — | ||||||||||||||||||||||||
| Total investment securities | 27,369 | 368 | 1.79 | 25,060 | 398 | 2.12 | 2,309 | (33) | ||||||||||||||||||||||||
| Commercial and industrial | 43,661 | 1,054 | 3.19 | 46,813 | 1,212 | 3.40 | (3,152) | (21) | ||||||||||||||||||||||||
| Commercial real estate | 14,601 | 285 | 2.57 | 14,354 | 341 | 3.12 | 247 | (55) | ||||||||||||||||||||||||
| Leases | 1,800 | 37 | 2.73 | 2,427 | 50 | 2.74 | (627) | (1) | ||||||||||||||||||||||||
| Total commercial loans and leases | 60,062 | 1,376 | 3.02 | 63,594 | 1,603 | 3.31 | (3,532) | (29) | ||||||||||||||||||||||||
| Residential mortgages | 20,160 | 459 | 3.03 | 19,056 | 467 | 3.27 | 1,104 | (24) | ||||||||||||||||||||||||
| Home equity | 11,884 | 279 | 3.14 | 12,730 | 363 | 3.81 | (846) | (67) | ||||||||||||||||||||||||
| Automobile | 12,634 | 376 | 3.98 | 12,063 | 388 | 4.30 | 571 | (32) | ||||||||||||||||||||||||
| Education | 12,593 | 403 | 4.28 | 10,908 | 424 | 5.19 | 1,685 | (91) | ||||||||||||||||||||||||
| Other retail | 5,659 | 304 | 7.18 | 6,556 | 369 | 7.51 | (897) | (33) | ||||||||||||||||||||||||
| Total retail loans | 62,930 | 1,821 | 3.87 | 61,313 | 2,011 | 4.38 | 1,617 | (51) | ||||||||||||||||||||||||
| Total loans and leases | 122,992 | 3,197 | 3.45 | 124,907 | 3,614 | 3.84 | (1,915) | (39) | ||||||||||||||||||||||||
| Loans held for sale, at fair value | 3,435 | 63 | 2.45 | 2,635 | 56 | 2.85 | 800 | (40) | ||||||||||||||||||||||||
| Other loans held for sale | 242 | 9 | 4.88 | 791 | 32 | 5.32 | (549) | (44) | ||||||||||||||||||||||||
| Interest-earning assets | 166,005 | 3,649 | 2.92 | 157,846 | 4,108 | 3.45 | 8,159 | (53) | ||||||||||||||||||||||||
| Noninterest-earning assets | 18,386 | 17,046 | 1,340 | |||||||||||||||||||||||||||||
| Total assets | $184,391 | $174,892 | $9,499 | |||||||||||||||||||||||||||||
| Liabilities and Stockholders’ Equity: | ||||||||||||||||||||||||||||||||
| Checking with interest | $27,126 | $18 | 0.09 | % | $25,857 | $56 | 0.29 | % | $1,269 | (20) | ||||||||||||||||||||||
| Money market accounts | 49,362 | 61 | 0.16 | 43,411 | 165 | 0.51 | 5,951 | (35) | ||||||||||||||||||||||||
| Regular savings | 19,839 | 15 | 0.10 | 15,667 | 43 | 0.37 | 4,172 | (27) | ||||||||||||||||||||||||
| Term deposits | 7,195 | 33 | 0.64 | 15,692 | 176 | 1.49 | (8,497) | (85) | ||||||||||||||||||||||||
| Total interest-bearing deposits | 103,522 | 127 | 0.16 | 100,627 | 440 | 0.58 | 2,895 | (42) | ||||||||||||||||||||||||
| Short-term borrowed funds | 80 | — | 0.74 | 368 | 1 | 0.53 | (288) | 21 | ||||||||||||||||||||||||
| Long-term borrowed funds | 7,570 | 136 | 2.38 | 11,660 | 210 | 2.39 | (4,090) | (1) | ||||||||||||||||||||||||
| Total borrowed funds | 7,650 | 136 | 2.36 | 12,028 | 211 | 2.33 | (4,378) | 3 | ||||||||||||||||||||||||
| Total interest-bearing liabilities | 111,172 | 263 | 0.32 | 112,655 | 651 | 0.77 | (1,483) | (45) | ||||||||||||||||||||||||
| Demand deposits | 46,120 | 35,922 | 10,198 | |||||||||||||||||||||||||||||
| Other liabilities | 4,166 | 4,172 | (6) | |||||||||||||||||||||||||||||
| Total liabilities | 161,458 | 152,749 | 8,709 | |||||||||||||||||||||||||||||
| Stockholders’ equity | 22,933 | 22,143 | 790 | |||||||||||||||||||||||||||||
| Total liabilities and stockholders’ equity | $184,391 | $174,892 | $9,499 | |||||||||||||||||||||||||||||
| Interest rate spread | 2.61 | % | 2.68 | % | (7) | |||||||||||||||||||||||||||
| Net interest income and net interest margin | $3,386 | 2.73 | % | $3,457 | 2.93 | % | (20) | |||||||||||||||||||||||||
| Net interest income and net interest margin, FTE(1) | $3,393 | 2.73 | % | $3,467 | 2.93 | % | (20) | |||||||||||||||||||||||||
| Memo: Total deposits (interest-bearing and demand) | $149,642 | $127 | 0.11 | % | $136,549 | $440 | 0.43 | % | $13,093 | (32) bps | ||||||||||||||||||||||
(1) Net interest income and net interest margin is presented on a FTE basis using the federal statutory tax rate of 21%. The FTE impact is predominantly attributable to commercial and industrial loans for the periods presented.
First nine months 2021 versus first nine months 2020: Net interest income of $3.4 billion decreased 2% from the first nine months of 2020, reflecting 5% growth in interest-earning assets, largely offset by lower net interest margin.
Citizens Financial Group, Inc. | 17
Net interest margin on a FTE basis of 2.73% decreased 20 basis points compared to 2.93% in the first nine months of 2020, primarily reflecting the impact of a lower rate environment, and elevated cash balances given strong deposit flows, partially offset by the benefit of accelerated PPP loan forgiveness, improved funding mix, and deposit pricing. Average interest-earning asset yields of 2.92% decreased 53 basis points from 3.45% in the first nine months of 2020, while average interest-bearing liability costs of 0.32% decreased 45 basis points from 0.77% in the first nine months of 2020.
Average interest-earning assets of $166.0 billion increased $8.2 billion, or 5%, from the first nine months of 2020, as elevated liquidity drove a $7.5 billion increase in cash held in interest-bearing deposits and a $2.3 billion, or 9%, increase in investments. Results also reflected a $1.7 billion, or 1%, decrease in average loans and leases and LHFS with a $3.5 billion decrease in average commercial loans and leases reflecting payoffs, partially offset by a $1.3 billion increase in PPP loans. Furthermore, average retail loans increased $1.6 billion, driven by growth in education, residential mortgage, and automobile, partially offset by decreases in home equity and other retail given run-off of personal unsecured installment loans. Loans held for sale increased $251 million, reflecting mortgage originations.
Average deposits of $149.6 billion increased $13.1 billion, or 10%, from the first nine months of 2020, reflecting growth in demand deposits, money market accounts, savings, and checking with interest, partially offset by a decline in term deposits. Average total borrowed funds of $7.7 billion decreased $4.4 billion from the first nine months of 2020, given the pay down of senior debt and short-term borrowings. Total borrowed funds costs of $136 million decreased $75 million from the first nine months of 2020. The total borrowed funds cost of 2.36% increased 3 basis points from 2.33% in the first nine months of 2020.
Citizens Financial Group, Inc. | 18
Noninterest Income
The following table presents a five quarter trend of our noninterest income:

Third quarter 2021 versus second quarter 2021: Noninterest income of $514 million increased $29 million, or 6%, from the second quarter of 2021. Results reflect higher mortgage banking fees, service charges and fees, card fees and other income, partially offset by lower capital markets fees.
-
Mortgage banking fees increased driven by strong origination levels, the benefit of lower agency fees and improved MSR hedge results.
-
Services charges and fees and card fees increased reflecting seasonality and the benefit of economic recovery.
-
Other income increased reflecting the benefit of higher community development-related income and a seasonal improvement in tax-advantaged investments.
-
Capital markets fees declined from record levels reflecting seasonally lower activity, primarily in syndication fees, partially offset by higher merger and acquisition advisory fees.
| Table 7: Noninterest Income | |||||||||||||||||||||||||||||||||||||||||||||||
| Three Months Ended September 30, | Nine Months Ended September 30, | ||||||||||||||||||||||||||||||||||||||||||||||
| (in millions) | 2021 | 2020 | Change | Percent | 2021 | 2020 | Change | Percent | |||||||||||||||||||||||||||||||||||||||
| Mortgage banking fees | $108 | $287 | ($179) | (62 | %) | $358 | $722 | ($364) | (50 | %) | |||||||||||||||||||||||||||||||||||||
| Service charges and fees | 110 | 97 | 13 | 13 | 309 | 299 | 10 | 3 | |||||||||||||||||||||||||||||||||||||||
| Capital markets fees | 72 | 58 | 14 | 24 | 244 | 162 | 82 | 51 | |||||||||||||||||||||||||||||||||||||||
| Card fees | 66 | 57 | 9 | 16 | 185 | 161 | 24 | 15 | |||||||||||||||||||||||||||||||||||||||
| Trust and investment services fees | 61 | 53 | 8 | 15 | 179 | 151 | 28 | 19 | |||||||||||||||||||||||||||||||||||||||
| Letter of credit and loan fees | 39 | 37 | 2 | 5 | 115 | 102 | 13 | 13 | |||||||||||||||||||||||||||||||||||||||
| Foreign exchange and interest rate products | 29 | 27 | 2 | 7 | 85 | 85 | — | — | |||||||||||||||||||||||||||||||||||||||
| Securities gains, net | 3 | 1 | 2 | 200 | 9 | 4 | 5 | 125 | |||||||||||||||||||||||||||||||||||||||
| Other income(1) | 26 | 37 | (11) | (30) | 57 | 55 | 2 | 4 | |||||||||||||||||||||||||||||||||||||||
| Noninterest income | $514 | $654 | ($140) | (21 | %) | $1,541 | $1,741 | ($200) | (11 | %) |
(1) Includes bank-owned life insurance income and other miscellaneous income for all periods presented.
Third quarter 2021 versus third quarter 2020: Noninterest income decreased $140 million, or 21%, from the third quarter of 2020. Results reflect lower mortgage banking fees and other income, partially offset by higher capital markets, service charges, card and trust and investment services fees.
-
Mortgage banking fees decreased driven by lower gain-on-sale margins and production volumes.
-
Capital markets fees increased driven by loan syndication and merger and acquisition advisory fees.
-
Service charges and fees increased reflecting recovery from COVID-19 impacts.
-
Card fees increased reflecting higher debit and credit card volumes given economic recovery.
Citizens Financial Group, Inc. | 19
-
Other income decreased largely tied to a gain on the sale of education loans in the third quarter of 2020.
-
Trust and investment services fees increased driven by an increase in assets under management from higher equity market levels and strong inflows.
First nine months 2021 versus first nine months 2020: Noninterest income decreased $200 million, or 11%, from the first nine months of 2020. Results reflect lower mortgage banking fees partially offset by improved capital markets, trust and investment services, letter of credit and loan, card and service charges and fees.
-
Mortgage banking fees decreased reflecting increased industry capacity and heightened competition resulting in lower gain-on-sale margins and production volumes.
-
Capital markets fees increased driven by loan syndication, underwriting, and merger and acquisition advisory fees.
-
Trust and investment services fees increased driven by an increase in assets under management from higher equity market levels and strong inflows.
-
Letter of credit and loan fees increased reflecting higher commitment fees.
-
Card fees and service charges and fees increased largely tied to economic recovery.
Noninterest Expense
The following table presents a five quarter trend of our noninterest expense:
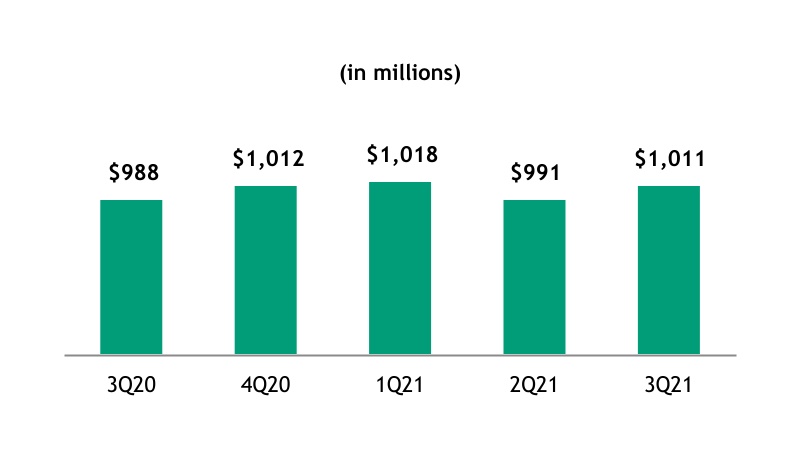
Third quarter 2021 versus second quarter 2021: Noninterest expense of $1.0 billion, or $988 million on an Underlying basis, was up slightly reflecting strong expense discipline and the benefit of efficiency initiatives.
| Table 8: Noninterest Expense | |||||||||||||||||||||||||||||||||||||||||||||||
| Three Months Ended September 30, | Nine Months Ended September 30, | ||||||||||||||||||||||||||||||||||||||||||||||
| (in millions) | 2021 | 2020 | Change | Percent | 2021 | 2020 | Change | Percent | |||||||||||||||||||||||||||||||||||||||
| Salaries and employee benefits | $509 | $524 | ($15) | (3 | %) | $1,581 | $1,586 | ($5) | — | % | |||||||||||||||||||||||||||||||||||||
| Equipment and software | 157 | 149 | 8 | 5 | 464 | 424 | 40 | 9 | |||||||||||||||||||||||||||||||||||||||
| Outside services | 144 | 139 | 5 | 4 | 420 | 405 | 15 | 4 | |||||||||||||||||||||||||||||||||||||||
| Occupancy | 77 | 81 | (4) | (5) | 247 | 247 | — | — | |||||||||||||||||||||||||||||||||||||||
| Other operating expense | 124 | 95 | 29 | 31 | 308 | 317 | (9) | (3) | |||||||||||||||||||||||||||||||||||||||
| Noninterest expense | $1,011 | $988 | $23 | 2 | % | $3,020 | $2,979 | $41 | 1 | % |
Third quarter 2021 versus third quarter 2020: Noninterest expense increased $23 million, or 2%, compared to the third quarter of 2020 and remains well-controlled. Salaries and employee benefits were lower as a result of a compensation-related credit associated with the CARES Act. Other operating expenses increased reflecting a pension settlement charge. On an Underlying basis, noninterest expense of $988 million increased $31 million, or 3%, compared to $957 million given higher salaries and employee benefits, outside services and other operating expense.
- Higher salaries and employee benefits reflect revenue-based compensation and merit increases.
Citizens Financial Group, Inc. | 20
-
Outside services increased largely tied to growth initiatives.
-
Other operating expense increased reflecting higher travel and advertising costs.
First nine months 2021 versus first nine months 2020: Noninterest expense increased $41 million, or 1%, and was stable with the first nine months of 2020. On an Underlying basis, noninterest expense of $3.0 billion increased $70 million, or 2%, given higher salaries and employee benefits and outside services due to the reasons stated above and higher equipment and software expense. These increases were partially offset by a decline in other operating expense.
-
Equipment and software expense increased reflecting higher technology spend.
-
Other operating expense decreased reflecting lower travel and advertising costs.
Provision for Credit Losses
The following table presents a five quarter trend of our provision for credit losses, net charge-offs and net charge-off ratio:
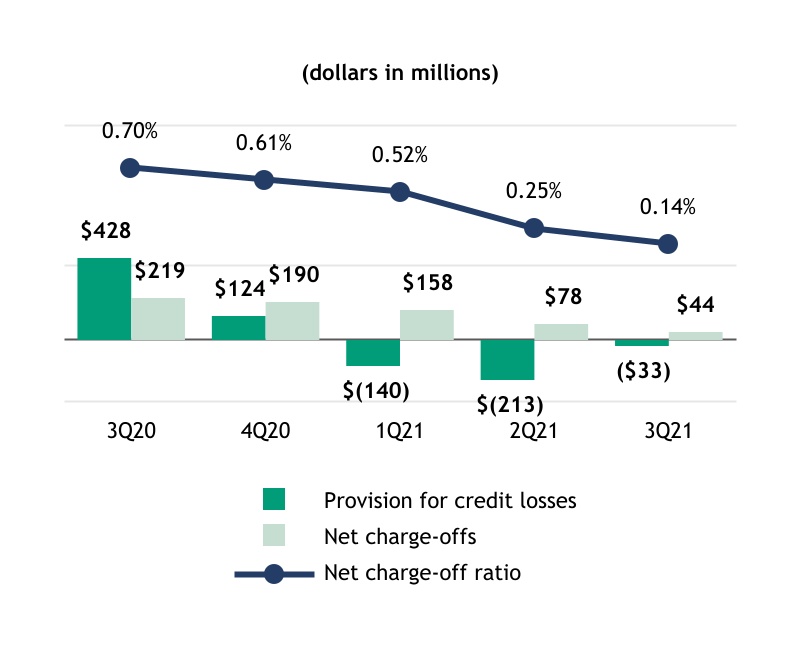
The provision for credit losses is the result of a detailed analysis performed to estimate our ACL. The total provision for credit losses includes the provision for loan and lease losses and the provision for unfunded commitments. Refer to “—Analysis of Financial Condition — Allowance for Credit Losses and Nonaccrual Loans and Leases” for more information.
Third quarter 2021 versus second quarter 2021: In the third quarter of 2021, strong credit performance across the retail and commercial loan portfolios and improvement in the macroeconomic outlook resulted in a credit provision benefit of $33 million. This compared to a credit provision benefit of $213 million in the second quarter of 2021.
Third quarter 2021 versus third quarter 2020: The credit provision benefit was $33 million in the third quarter of 2021, compared with a $428 million credit provision expense in the third quarter of 2020. The credit provision expense in 2020 reflects the adverse impacts from the COVID-19 pandemic and associated lockdowns, while the credit provision benefit in 2021 reflects strong credit performance and improving macroeconomic outlook.
First nine months 2021 versus first nine months 2020: The credit provision benefit was $386 million in the first nine months of 2021. This compared to a credit provision expense of $1.5 billion in the first nine months of 2020, which reflected the adverse impacts from the COVID-19 pandemic and associated lockdowns.
Citizens Financial Group, Inc. | 21
Income Tax Expense
The following table presents a five quarter trend of our income tax expense and effective income tax rate:

Third quarter 2021 versus third quarter 2020: Income tax expense increased $90 million from the third quarter of 2020 due to increased taxable income. The effective income tax rate increased to 22.4% from 16.1% in the third quarter of 2020, driven by the decreased benefit of tax advantaged investments on higher pre-tax income.
First nine months 2021 versus first nine months 2020: Income tax expense for the first nine months of 2021 was $504 million compared to $126 million in the first nine months of 2020. Income tax expense increased $378 million from the first nine months of 2020 due to increased taxable income. The effective income tax rate increased to 22.0% from 17.3% in the first nine months of 2020 driven by the decreased benefit of tax advantaged investment on higher pre-tax income.
Business Operating Segments
We have two business operating segments: Consumer Banking and Commercial Banking. Segment results are derived by specifically attributing managed assets, liabilities, capital and related revenues, provision for credit losses, which, at the segment level, is equal to net charge-offs, and other expenses. Non-segment operations are classified as Other, which includes assets, liabilities, capital, revenues, provision for credit losses, expenses and income tax expense not attributed to our Consumer or Commercial Banking segments as well as treasury and community development. In addition, Other includes goodwill not directly allocated to a business operating segment and any associated goodwill impairment charges. For impairment testing purposes, we allocate all goodwill to our Consumer Banking and/or Commercial Banking reporting units. There have been no significant changes in our methodologies used to allocate items to our business operating segments as described in “—Results of Operations — Business Operating Segments” in our 2020 Form 10-K.
Citizens Financial Group, Inc. | 22
The following table presents certain financial data of our business operating segments. Total business operating segment financial results differ from total consolidated financial results. These differences are reflected in Other non-segment operations. See Note 16 in Item 1 for further information.
| Table 9: Selected Financial Data for Business Operating Segments, Quarter-to-Date | |||||||||||||||||||||||
| Consumer Banking | Commercial Banking | ||||||||||||||||||||||
| Three Months Ended September 30, | Three Months Ended September 30, | ||||||||||||||||||||||
| (dollars in millions) | 2021 | 2020 | 2021 | 2020 | |||||||||||||||||||
| Net interest income | $919 | $845 | $428 | $421 | |||||||||||||||||||
| Noninterest income | 315 | 495 | 168 | 144 | |||||||||||||||||||
| Total revenue | 1,234 | 1,340 | 596 | 565 | |||||||||||||||||||
| Noninterest expense | 749 | 742 | 226 | 210 | |||||||||||||||||||
| Profit before credit losses | 485 | 598 | 370 | 355 | |||||||||||||||||||
| Net charge-offs | 35 | 55 | 15 | 161 | |||||||||||||||||||
| Income before income tax expense | 450 | 543 | 355 | 194 | |||||||||||||||||||
| Income tax expense | 114 | 136 | 81 | 41 | |||||||||||||||||||
| Net income | $336 | $407 | $274 | $153 | |||||||||||||||||||
| Average Balances: | |||||||||||||||||||||||
| Total assets | $75,070 | $73,605 | $56,702 | $60,889 | |||||||||||||||||||
| Total loans and leases(1)(2) | 70,984 | 69,719 | 53,815 | 57,796 | |||||||||||||||||||
| Deposits | 100,968 | 94,212 | 45,465 | 41,393 | |||||||||||||||||||
| Interest-earning assets | 71,879 | 69,925 | 54,177 | 58,177 |
(1) Includes LHFS.
(2) The majority of PPP loans are reflected in Consumer Banking in accordance with how they are managed.
Consumer Banking
Net interest income increased $74 million, or 9%, from the third quarter of 2020, reflecting the benefit of accelerated PPP loan forgiveness and a $1.3 billion increase in average loans led by education, residential mortgage, and automobile, partially offset by a decline in other retail consistent with planned run-off of personal unsecured installment loans. In addition, higher deposit volumes, reflecting improved funding mix and deposit pricing, contributed to higher net interest income. Noninterest income decreased $180 million, or 36%, from the third quarter of 2020, driven by lower mortgage banking fees resulting from lower gain-on-sale margins and production volumes, and a decline in other income largely tied to a gain on the sale of education loans in the third quarter of 2020. These decreases were partially offset by recovery in service charges and fees from deposit products, card, as well as trust and investment services, reflecting an increase in assets under management. Noninterest expense was stable compared to the third quarter of 2020. Net charge-offs of $35 million decreased $20 million, or 36%, driven by the impact of U.S. Government stimulus programs and strong collateral values in automobile and residential real estate.
Commercial Banking
Net interest income of $428 million was stable compared to the third quarter of 2020. Noninterest income of $168 million increased $24 million, or 17%, from $144 million in the third quarter of 2020, driven by strength in capital markets due to higher loan syndication and merger and acquisition advisory fees, reflecting favorable market conditions and a strong pipeline. Noninterest expense of $226 million increased $16 million, or 8%, from $210 million in the third quarter of 2020, largely tied to increased technology spend as well as higher salaries and employee benefits. Net charge-offs of $15 million decreased $146 million from the third quarter of 2020 reflecting the stabilization from effects of the COVID-19 pandemic and associated lockdowns.
Citizens Financial Group, Inc. | 23
| Table 10: Selected Financial Data for Business Operating Segments, Year-to-Date | |||||||||||||||||||||||
| Consumer Banking | Commercial Banking | ||||||||||||||||||||||
| Nine Months Ended September 30, | Nine Months Ended September 30, | ||||||||||||||||||||||
| (dollars in millions) | 2021 | 2020 | 2021 | 2020 | |||||||||||||||||||
| Net interest income | $2,679 | $2,452 | $1,268 | $1,205 | |||||||||||||||||||
| Noninterest income | 949 | 1,280 | 516 | 413 | |||||||||||||||||||
| Total revenue | 3,628 | 3,732 | 1,784 | 1,618 | |||||||||||||||||||
| Noninterest expense | 2,250 | 2,215 | 679 | 644 | |||||||||||||||||||
| Profit before credit losses | 1,378 | 1,517 | 1,105 | 974 | |||||||||||||||||||
| Net charge-offs | 139 | 232 | 150 | 274 | |||||||||||||||||||
| Income before income tax expense | 1,239 | 1,285 | 955 | 700 | |||||||||||||||||||
| Income tax expense | 315 | 322 | 205 | 147 | |||||||||||||||||||
| Net income | $924 | $963 | $750 | $553 | |||||||||||||||||||
| Average Balances: | |||||||||||||||||||||||
| Total assets | $75,317 | $71,227 | $57,318 | $61,722 | |||||||||||||||||||
| Total loans and leases(1)(2) | 70,857 | 67,763 | 54,459 | 58,784 | |||||||||||||||||||
| Deposits | 99,708 | 90,377 | 44,501 | 38,905 | |||||||||||||||||||
| Interest-earning assets | 71,777 | 67,866 | 54,828 | 59,201 |
(1) Includes LHFS.
(2) The majority of PPP loans are reflected in Consumer Banking in accordance with how they are managed.
Consumer Banking
Net interest income of $2.7 billion increased $227 million, or 9%, from the first nine months of 2020, driven by the benefit of accelerated PPP loan forgiveness, loan and deposit growth, as well as improved funding mix, and deposit pricing. Average loans increased $3.1 billion led by education, residential mortgage, and automobile, partially offset by a decline in other retail given planned run-off of personal unsecured installment loans. Deposits increased $9.3 billion, or 10%, as a result of elevated liquidity tied to government stimulus associated with the COVID-19 disruption. Noninterest income decreased $331 million, or 26%, from the first nine months of 2020, driven by lower mortgage banking fees as increased industry capacity and heightened competition resulted in lower gain-on-sale margins and production volumes. This decrease was partially offset by higher trust and investment services fees driven by an increase in assets under management, and higher card fees and service charges and fees, reflecting continued volume recovery from COVID-19 impacts. Noninterest expense increased $35 million, or 2%, from the first nine months of 2020, reflecting higher salaries and employee benefits tied to higher revenue-based compensation, combined with higher equipment and software expense and outside services resulting from increased technology spend and growth initiatives. Net charge-offs of $139 million decreased $93 million, or 40%, driven by the impact of U.S. Government stimulus and forbearance, as well as strong collateral values in automobile and residential real estate.
Commercial Banking
Net interest income of $1.3 billion increased $63 million, or 5%, from $1.2 billion in the first nine months of 2020, driven by higher deposit volumes reflecting improved funding mix and deposit pricing. Noninterest income of $516 million increased $103 million, or 25%, from $413 million in the first nine months of 2020, driven by strength in capital markets from higher loan syndication and merger and acquisition advisory fees, in addition to higher letter of credit and loan fees. Noninterest expense of $679 million increased $35 million, or 5%, from $644 million in the first nine months of 2020, largely tied to growth initiatives, increased technology spends, and higher salaries and employee benefits. Net charge-offs of $150 million decreased $124 million, or 45%, from the first nine months of 2020, reflecting the stabilization from effects of the COVID-19 pandemic and associated lockdowns.
Citizens Financial Group, Inc. | 24
ANALYSIS OF FINANCIAL CONDITION
Securities
| Table 11: Amortized Cost and Fair Value of AFS and HTM Securities | |||||||||||||||||||||||||||||||||||
| September 30, 2021 | December 31, 2020 | ||||||||||||||||||||||||||||||||||
| (in millions) | Amortized Cost | Fair Value | Amortized Cost | Fair Value | |||||||||||||||||||||||||||||||
| U.S. Treasury and other | $11 | $11 | $11 | $11 | |||||||||||||||||||||||||||||||
| State and political subdivisions | 2 | 2 | 3 | 3 | |||||||||||||||||||||||||||||||
| Mortgage-backed securities: | |||||||||||||||||||||||||||||||||||
| Federal agencies and U.S. government sponsored entities | 23,838 | 23,840 | 21,954 | 22,506 | |||||||||||||||||||||||||||||||
| Other/non-agency | 280 | 291 | 396 | 422 | |||||||||||||||||||||||||||||||
| Total mortgage-backed securities | 24,118 | 24,131 | 22,350 | 22,928 | |||||||||||||||||||||||||||||||
| Collateralized loan obligations | 767 | 767 | — | — | |||||||||||||||||||||||||||||||
| Total debt securities available for sale, at fair value | $24,898 | $24,911 | $22,364 | $22,942 | |||||||||||||||||||||||||||||||
| Mortgage-backed securities: | |||||||||||||||||||||||||||||||||||
| Federal agencies and U.S. government sponsored entities | $1,705 | $1,778 | $2,342 | $2,464 | |||||||||||||||||||||||||||||||
| Total mortgage-backed securities | 1,705 | 1,778 | 2,342 | 2,464 | |||||||||||||||||||||||||||||||
| Asset-backed securities | 787 | 789 | 893 | 893 | |||||||||||||||||||||||||||||||
| Total debt securities held to maturity | $2,492 | $2,567 | $3,235 | $3,357 | |||||||||||||||||||||||||||||||
| Total debt securities available for sale and held to maturity | $27,390 | $27,478 | $25,599 | $26,299 | |||||||||||||||||||||||||||||||
| Equity securities, at cost | $616 | $616 | $604 | $604 | |||||||||||||||||||||||||||||||
| Equity securities, at fair value | 88 | 88 | 66 | 66 | |||||||||||||||||||||||||||||||
Our securities portfolio is managed to maintain prudent levels of liquidity, credit quality, and market risk while achieving returns that align with our overall portfolio management strategy. The portfolio primarily includes high quality, highly liquid investments reflecting our ongoing commitment to maintain strong contingent liquidity levels and pledging capacity. U.S. government-guaranteed notes and GSE-issued mortgage-backed securities represent 93% of the fair value of our debt securities portfolio holdings. Holdings backed by mortgages dominate our portfolio and facilitate our ability to pledge those securities to the FHLB for collateral purposes. For further discussion of the liquidity coverage ratios, see “Regulation and Supervision — Liquidity Requirements” in our 2020 Form 10-K.
The fair value of the AFS debt securities portfolio of $24.9 billion at September 30, 2021 increased $2.0 billion from $22.9 billion at December 31, 2020, including $2.5 billion in portfolio growth, offset by a $566 million reduction in unrealized gains driven by a steepening yield curve. The decline in the fair value of the HTM debt securities portfolio of $790 million was primarily attributable to portfolio run-off. For further information, see Note 2.
As of September 30, 2021, the portfolio’s average effective duration was 3.9 years compared with 2.7 years as of December 31, 2020, as higher long-term rates drove a decrease in both actual and projected securities prepayment speeds. We manage our securities portfolio duration and convexity risk through asset selection and securities structure, and maintain duration levels within our risk appetite in the context of the broader interest rate risk framework and limits.
Citizens Financial Group, Inc. | 25
Loans and Leases
| Table 12: Composition of Loans and Leases, Excluding LHFS | |||||||||||||||||||||||
| (in millions) | September 30, 2021 | December 31, 2020 | Change | Percent | |||||||||||||||||||
| Commercial and industrial(1) | $41,854 | $44,173 | ($2,319) | (5) | % | ||||||||||||||||||
| Commercial real estate | 14,508 | 14,652 | (144) | (1) | |||||||||||||||||||
| Leases | 1,593 | 1,968 | (375) | (19) | |||||||||||||||||||
| Total commercial | 57,955 | 60,793 | (2,838) | (5) | |||||||||||||||||||
| Residential mortgages(2) | 21,513 | 19,539 | 1,974 | 10 | |||||||||||||||||||
| Home equity | 11,889 | 12,149 | (260) | (2) | |||||||||||||||||||
| Automobile | 13,492 | 12,153 | 1,339 | 11 | |||||||||||||||||||
| Education | 13,000 | 12,308 | 692 | 6 | |||||||||||||||||||
| Other retail | 5,469 | 6,148 | (679) | (11) | |||||||||||||||||||
| Total retail | 65,363 | 62,297 | 3,066 | 5 | |||||||||||||||||||
| Total loans and leases | $123,318 | $123,090 | $228 | — | % | ||||||||||||||||||
(1) Includes PPP loans fully guaranteed by the SBA of $1.9 billion at September 30, 2021 and $4.2 billion at December 31, 2020.
(2) Includes fully or partially guaranteed FHA, VA and USDA loans of $1.4 billion at September 30, 2021 and $249 million at December 31, 2020, including loans acquired through the exercise of the GNMA early buyout option.
Total loans and leases increased $228 million from $123.1 billion as of December 31, 2020, reflecting a $3.1 billion increase in retail driven by mortgage, automobile, and education, and a $2.8 billion decrease in commercial driven by payoffs and a decrease in PPP loans.
Allowance for Credit Losses and Nonaccrual Loans and Leases
The ACL is created through charges to the provision for credit losses in order to provide appropriate reserves to absorb estimated future credit losses in accordance with GAAP. For additional information regarding the ACL, see Note 4 of this report, and “Critical Accounting Estimates” and Note 5 in the Company’s 2020 Form 10-K.
The ACL of $2.0 billion as of September 30, 2021 compared with the ACL of $2.7 billion as of December 31, 2020, reflecting a reserve release of $666 million. For further information, see Note 4.
Citizens Financial Group, Inc. | 26
| Table 13: ACL and Related Coverage Ratios by Portfolio | |||||||||||||||||||||||
| September 30, 2021 | December 31, 2020 | ||||||||||||||||||||||
| (in millions) | Loans and Leases | Allowance | Coverage | Loans and Leases | Allowance | Coverage | |||||||||||||||||
| Allowance for Loan and Lease Losses | |||||||||||||||||||||||
| Commercial and industrial | $41,854 | $592 | 1.41 | % | $44,173 | $821 | 1.86 | % | |||||||||||||||
| Commercial real estate | 14,508 | 212 | 1.46 | 14,652 | 360 | 2.46 | |||||||||||||||||
| Leases | 1,593 | 63 | 3.92 | 1,968 | 52 | 2.67 | |||||||||||||||||
| Total commercial | 57,955 | 867 | 1.50 | 60,793 | 1,233 | 2.03 | |||||||||||||||||
| Residential mortgages | 21,513 | 141 | 0.65 | 19,539 | 141 | 0.72 | |||||||||||||||||
| Home equity | 11,889 | 92 | 0.78 | 12,149 | 134 | 1.10 | |||||||||||||||||
| Automobile | 13,492 | 165 | 1.22 | 12,153 | 200 | 1.65 | |||||||||||||||||
| Education | 13,000 | 332 | 2.56 | 12,308 | 361 | 2.93 | |||||||||||||||||
| Other retail | 5,469 | 258 | 4.72 | 6,148 | 374 | 6.07 | |||||||||||||||||
| Total retail | 65,363 | 988 | 1.51 | 62,297 | 1,210 | 1.94 | |||||||||||||||||
| Total loans and leases | $123,318 | $1,855 | 1.50 | % | $123,090 | $2,443 | 1.98 | % | |||||||||||||||
| Allowance for Unfunded Lending Commitments | |||||||||||||||||||||||
| Commercial(1) | $130 | 1.72 | % | $186 | 2.33 | % | |||||||||||||||||
| Retail(2) | 19 | 1.54 | 41 | 2.01 | |||||||||||||||||||
| Total allowance for unfunded lending commitments | 149 | 227 | |||||||||||||||||||||
| Allowance for credit losses(3) | $123,318 | $2,004 | 1.63 | % | $123,090 | $2,670 | 2.17 | % |
(1) Coverage ratio includes total commercial allowance for unfunded lending commitments and total commercial allowance for loan and lease losses in the numerator and total commercial loans and leases in the denominator.
(2) Coverage ratio includes total retail allowance for unfunded lending commitments and total retail allowance for loan losses in the numerator and total retail loans in the denominator.
(3) Excluding the impact of PPP loans, the ACL Coverage Ratio would have been 1.65% and 2.24% for September 30, 2021 and December 31, 2020, respectively. For more information on the computation of non-GAAP financial measures, see “—Introduction — Non-GAAP Financial Measures” and “—Non-GAAP Financial Measures and Reconciliations.”
| Table 14: Nonaccrual Loans and Leases | |||||||||||||||||||||||
| (dollars in millions) | September 30, 2021 | December 31, 2020 | Change | Percent | |||||||||||||||||||
| Commercial and industrial | $170 | $280 | ($110) | (39 | %) | ||||||||||||||||||
| Commercial real estate | 98 | 176 | (78) | (44) | |||||||||||||||||||
| Leases | 1 | 2 | (1) | (50) | |||||||||||||||||||
| Total commercial | 269 | 458 | (189) | (41) | |||||||||||||||||||
| Residential mortgages(1) | 164 | 167 | (3) | (2) | |||||||||||||||||||
| Home equity | 216 | 276 | (60) | (22) | |||||||||||||||||||
| Automobile | 55 | 72 | (17) | (24) | |||||||||||||||||||
| Education | 23 | 18 | 5 | 28 | |||||||||||||||||||
| Other retail | 20 | 28 | (8) | (29) | |||||||||||||||||||
| Total retail | 478 | 561 | (83) | (15) | |||||||||||||||||||
| Nonaccrual loans and leases | $747 | $1,019 | ($272) | (27 | %) | ||||||||||||||||||
| Nonaccrual loans and leases to total loans and leases | 0.61 | % | 0.83 | % | (22 | bps) | |||||||||||||||||
| Allowance for loan and lease losses to nonaccrual loans and leases | 248 | 240 | 8 | % | |||||||||||||||||||
| Allowance for credit losses to nonaccrual loans and leases | 268 | 262 | 6 | % |
(1) Loans fully or partially guaranteed by the FHA, VA and USDA are classified as accruing.
NPLs of $747 million as of September 30, 2021 decreased $272 million, or 27%, from December 31, 2020, reflecting a $189 million decrease in commercial and a $83 million decrease in retail. Commercial NPLs decreased through loan sale activity, repayments, and charge-offs.
Citizens Financial Group, Inc. | 27
| Table 15: Net Charge-offs and Charge-Off Ratios, Quarter-to-Date | |||||||||||||||||||||||||||||||||||||||||||||||||||||||||||||||||
| Three Months Ended September 30, | Three Months Ended September 30, | ||||||||||||||||||||||||||||||||||||||||||||||||||||||||||||||||
| (dollars in millions) | 2021 | 2020 | Change | 2021 | 2020 | Change | |||||||||||||||||||||||||||||||||||||||||||||||||||||||||||
| Commercial and industrial | $10 | $80 | ($70) | 0.09 | % | 0.68 | % | (59 | bps) | ||||||||||||||||||||||||||||||||||||||||||||||||||||||||
| Commercial real estate | 5 | 42 | (37) | 0.12 | 1.13 | (101) | |||||||||||||||||||||||||||||||||||||||||||||||||||||||||||
| Leases | (1) | 48 | (49) | (0.22) | 7.99 | (821) | |||||||||||||||||||||||||||||||||||||||||||||||||||||||||||
| Total commercial | 14 | 170 | (156) | 0.09 | 1.06 | (97) | |||||||||||||||||||||||||||||||||||||||||||||||||||||||||||
| Residential mortgages | — | — | — | — | — | — | |||||||||||||||||||||||||||||||||||||||||||||||||||||||||||
| Home equity | (12) | (2) | (10) | (0.42) | (0.10) | (32) | |||||||||||||||||||||||||||||||||||||||||||||||||||||||||||
| Automobile | 2 | 7 | (5) | 0.06 | 0.24 | (18) | |||||||||||||||||||||||||||||||||||||||||||||||||||||||||||
| Education | 13 | 5 | 8 | 0.41 | 0.21 | 20 | |||||||||||||||||||||||||||||||||||||||||||||||||||||||||||
| Other retail | 27 | 39 | (12) | 1.99 | 2.46 | (47) | |||||||||||||||||||||||||||||||||||||||||||||||||||||||||||
| Total retail | 30 | 49 | (19) | 0.19 | 0.32 | (13) | |||||||||||||||||||||||||||||||||||||||||||||||||||||||||||
| Total net charge-offs | $44 | $219 | ($175) | 0.14 | % | 0.70 | % | (56 | bps) |
Third quarter 2021 NCOs of $44 million decreased $175 million, or 80%, from $219 million in the third quarter of 2020, driven by decreases in commercial and retail of $156 million and $19 million, respectively. Third quarter 2021 annualized net charge-offs of 0.14% of average loans and leases were down 56 basis points from the third quarter of 2020. The overall improvement in the macroeconomic environment and post-pandemic reopening drove the significant decline in commercial NCOs. Retail NCOs remained low driven by continued benefit to consumers from government stimulus and strong collateral values in residential real estate and automobile.
| Table 16: Net Charge-offs and Charge-Off Ratios, Year-to-Date | |||||||||||||||||||||||||||||||||||||||||||||||||||||||||||||||||
| Nine Months Ended September 30, | Nine Months Ended September 30, | ||||||||||||||||||||||||||||||||||||||||||||||||||||||||||||||||
| (dollars in millions) | 2021 | 2020 | Change | 2021 | 2020 | Change | |||||||||||||||||||||||||||||||||||||||||||||||||||||||||||
| Commercial and industrial | $115 | $189 | ($74) | 0.35 | % | 0.54 | % | (19 | bps) | ||||||||||||||||||||||||||||||||||||||||||||||||||||||||
| Commercial real estate | 31 | 42 | (11) | 0.28 | 0.39 | (11) | |||||||||||||||||||||||||||||||||||||||||||||||||||||||||||
| Leases | 13 | 54 | (41) | 1.01 | 2.99 | (198) | |||||||||||||||||||||||||||||||||||||||||||||||||||||||||||
| Total commercial | 159 | 285 | (126) | 0.35 | 0.60 | (25) | |||||||||||||||||||||||||||||||||||||||||||||||||||||||||||
| Residential mortgages | (2) | 1 | (3) | (0.01) | 0.01 | (2) | |||||||||||||||||||||||||||||||||||||||||||||||||||||||||||
| Home equity | (29) | (7) | (22) | (0.33) | (0.08) | (25) | |||||||||||||||||||||||||||||||||||||||||||||||||||||||||||
| Automobile | 11 | 54 | (43) | 0.12 | 0.60 | (48) | |||||||||||||||||||||||||||||||||||||||||||||||||||||||||||
| Education | 33 | 29 | 4 | 0.35 | 0.36 | (1) | |||||||||||||||||||||||||||||||||||||||||||||||||||||||||||
| Other retail | 108 | 141 | (33) | 2.55 | 2.88 | (33) | |||||||||||||||||||||||||||||||||||||||||||||||||||||||||||
| Total retail | 121 | 218 | (97) | 0.26 | 0.48 | (22) | |||||||||||||||||||||||||||||||||||||||||||||||||||||||||||
| Total net charge-offs | $280 | $503 | ($223) | 0.30 | % | 0.54 | % | (24 | bps) |
First nine months 2021 NCOs of $280 million decreased $223 million, or 44%, from $503 million in the first nine months of 2020, driven by decreases in commercial and retail of $126 million and $97 million, respectively. First nine months 2021 annualized net charge-offs of 0.30% of average loans and leases were down 24 basis points from first nine months of 2020.
Retail and commercial NCOs were down in the first nine months of 2021 as compared to the first nine months of 2020. The decline in retail NCOs is primarily due to U.S. Government stimulus programs and forbearance, as well as strong collateral values in residential real estate and automobile. The decrease in commercial NCOs reflects the economic recovery following the COVID-19 pandemic and associated lockdowns. We continue to assess risks to the recovery, including potential for continuing impacts from COVID-19 variants, challenges in the global supply chain and recent inflationary trends, as well as potential impacts from ending monetary and fiscal stimulus programs. We have maintained a variety of measures to identify and monitor areas of potential risk, including direct outreach to commercial clients and close monitoring of retail credit metrics.
Commercial Loan Asset Quality
Our commercial loan and lease portfolio consists of traditional commercial and industrial loans, commercial leases and commercial real estate loans. The portfolio is predominantly focused on customers in our footprint and adjacent states in which we have a physical presence where our local delivery model provides for
Citizens Financial Group, Inc. | 28
strong client connectivity. Additionally, we also do business in certain specialized industry sectors on a national basis. As discussed in our 2020 Form 10-K, for commercial loans and leases, we utilize regulatory classification ratings to monitor credit quality.
As of September 30, 2021, commercial NPLs of $269 million decreased $189 million from $458 million as of December 31, 2020, representing 0.5% and 0.8% of the commercial loan and lease portfolio as of September 30, 2021 and December 31, 2020, respectively.
| Table 17: Commercial Loans and Leases by Regulatory Classification | |||||||||||||||||
| September 30, 2021 | |||||||||||||||||
| Criticized | |||||||||||||||||
| (in millions) | Pass | Special Mention | Substandard | Doubtful | Total | ||||||||||||
| Commercial and industrial(1) | $39,218 | $1,115 | $1,386 | $135 | $41,854 | ||||||||||||
| Commercial real estate | 13,146 | 616 | 735 | 11 | 14,508 | ||||||||||||
| Leases | 1,519 | 49 | 24 | 1 | 1,593 | ||||||||||||
| Total commercial | $53,883 | $1,780 | $2,145 | $147 | $57,955 |
| December 31, 2020 | |||||||||||||||||
| Criticized | |||||||||||||||||
| (in millions) | Pass | Special Mention | Substandard | Doubtful | Total | ||||||||||||
| Commercial and industrial(1) | $40,878 | $1,583 | $1,464 | $248 | $44,173 | ||||||||||||
| Commercial real estate | 13,356 | 804 | 416 | 76 | 14,652 | ||||||||||||
| Leases | 1,922 | 33 | 12 | 1 | 1,968 | ||||||||||||
| Total commercial | $56,156 | $2,420 | $1,892 | $325 | $60,793 |
(1) Includes $1.9 billion and $4.2 billion of PPP loans designated as pass that are fully guaranteed by the SBA as of September 30, 2021 and December 31, 2020, respectively.
Total commercial criticized balances of $4.1 billion as of September 30, 2021 decreased $565 million compared with December 31, 2020. Commercial criticized as a percent of total commercial of 7.0% at September 30, 2021 decreased from 7.6% at December 31, 2020.
Commercial and industrial criticized balances of $2.6 billion, or 6.3% of the total commercial and industrial loan portfolio as of September 30, 2021, decreased from $3.3 billion, or 7.5%, as of December 31, 2020. The decrease was primarily driven by net repayments and charge-offs. Commercial and industrial criticized loans represented 65% of total criticized loans as of September 30, 2021 compared to 71% as of December 31, 2020.
Commercial real estate criticized balances of $1.4 billion, or 9.4% of the commercial real estate portfolio, was stable compared to December 31, 2020 at $1.3 billion, or 8.8%. Commercial real estate accounted for 33% of total criticized loans as of September 30, 2021 compared to 28% as of December 31, 2020.
Citizens Financial Group, Inc. | 29
| Table 18: Commercial Loans and Leases by Industry Sector | |||||||||||||||||
| September 30, 2021 | December 31, 2020 | ||||||||||||||||
| (dollars in millions) | Balance | % of Total Loans and Leases | Balance | % of Total Loans and Leases | |||||||||||||
| Finance and insurance | $7,939 | 6 | % | $6,473 | 5 | % | |||||||||||
| Health, pharma, and social assistance | 2,914 | 2 | 3,253 | 3 | |||||||||||||
| Accommodation and food services | 3,083 | 3 | 3,159 | 3 | |||||||||||||
| Professional, scientific, and technical services | 2,542 | 2 | 2,804 | 2 | |||||||||||||
| Other manufacturing | 3,708 | 3 | 3,686 | 3 | |||||||||||||
| Technology | 3,822 | 3 | 3,546 | 3 | |||||||||||||
| Retail trade | 2,258 | 2 | 2,312 | 2 | |||||||||||||
| Energy and related | 1,971 | 2 | 2,237 | 2 | |||||||||||||
| Wholesale trade | 2,261 | 2 | 1,976 | 2 | |||||||||||||
| Arts, entertainment, and recreation | 902 | 1 | 1,383 | 1 | |||||||||||||
| Other services | 1,845 | 1 | 1,360 | 1 | |||||||||||||
| Administrative and waste management services | 1,226 | 1 | 1,327 | 1 | |||||||||||||
| Transportation and warehousing | 1,092 | 1 | 1,169 | 1 | |||||||||||||
| Consumer products manufacturing | 1,160 | 1 | 1,078 | 1 | |||||||||||||
| Automotive | 1,000 | 1 | 1,057 | 1 | |||||||||||||
| Educational services | 597 | — | 844 | — | |||||||||||||
| Chemicals | 717 | — | 736 | — | |||||||||||||
| Real estate and rental and leasing | 886 | 1 | 734 | — | |||||||||||||
| All other(1) | 28 | — | 884 | 1 | |||||||||||||
| Total commercial and industrial | 39,951 | 32 | 40,018 | 32 | |||||||||||||
| Real estate and rental and leasing | 12,984 | 11 | 13,167 | 11 | |||||||||||||
| Accommodation and food services | 819 | 1 | 749 | 1 | |||||||||||||
| Finance and insurance | 560 | — | 498 | — | |||||||||||||
| All other(1) | 145 | — | 238 | — | |||||||||||||
| Total commercial real estate | 14,508 | 12 | 14,652 | 12 | |||||||||||||
| Total leases | 1,593 | 1 | 1,968 | 2 | |||||||||||||
| Total commercial(2) | $56,052 | 45 | % | $56,638 | 46 | % |
(1) Deferred fees and costs are reported in All other.
(2) Excludes PPP loans of $1.9 billion and $4.2 billion as of September 30, 2021 and December 31, 2020, respectively.
Retail Loan Asset Quality
For retail loans, we utilize credit scores provided by FICO, which generally refresh on a quarterly basis, and a loan’s payment and delinquency status to monitor credit quality. Management believes FICO credit scores are the strongest indicator of credit losses over the contractual life of a loan as the scores are based on current and historical national industry-wide consumer level credit performance data. These scores assist management in predicting the borrower’s future payment performance. The largest portion of the retail portfolio is represented by borrowers located in the New England, Mid-Atlantic, and Midwest regions, although we have continued to lend selectively in areas outside the footprint primarily in automobile, education and point-of-sale financing.
Citizens Financial Group, Inc. | 30
| Table 19: Aging of Retail Loans as a Percentage of Loan Class | |||||||||||||||||||||||||||||||||||||||||||||||||||||
| September 30, 2021 | December 31, 2020 | ||||||||||||||||||||||||||||||||||||||||||||||||||||
| Days Past Due | Days Past Due | ||||||||||||||||||||||||||||||||||||||||||||||||||||
| Current-29 | 30-59 | 60-89 | 90+ | Current-29 | 30-59 | 60-89 | 90+ | ||||||||||||||||||||||||||||||||||||||||||||||
| Residential mortgages(1) | 96.97 | % | 0.72 | % | 0.26 | % | 2.05 | % | 98.73 | % | 0.30 | % | 0.11 | % | 0.86 | % | |||||||||||||||||||||||||||||||||||||
| Home equity | 98.03 | 0.29 | 0.13 | 1.55 | 97.53 | 0.50 | 0.23 | 1.74 | |||||||||||||||||||||||||||||||||||||||||||||
| Automobile | 98.71 | 0.87 | 0.31 | 0.11 | 97.93 | 1.40 | 0.53 | 0.14 | |||||||||||||||||||||||||||||||||||||||||||||
| Education | 99.55 | 0.25 | 0.11 | 0.09 | 99.56 | 0.27 | 0.11 | 0.06 | |||||||||||||||||||||||||||||||||||||||||||||
| Other retail | 98.21 | 0.71 | 0.51 | 0.57 | 98.36 | 0.62 | 0.47 | 0.55 | |||||||||||||||||||||||||||||||||||||||||||||
| Total retail | 98.14 | % | 0.58 | % | 0.24 | % | 1.04 | % | 98.47 | % | 0.58 | % | 0.25 | % | 0.70 | % | |||||||||||||||||||||||||||||||||||||
(1) 90+ day past due includes $289 million and $44 million of loans fully or partially guaranteed by the FHA, VA, and USDA at September 30, 2021 and December 31, 2020, respectively.
For more information on the aging of accruing and nonaccrual retail loans, see Note 4.
| Table 20: Retail Asset Quality Metrics | |||||||||||
| September 30, 2021 | December 31, 2020 | ||||||||||
| Average refreshed FICO for total portfolio | 768 | 771 | |||||||||
| CLTV ratio for secured real estate(1) | 57 | % | 60 | % | |||||||
| Nonaccrual retail loans to total retail | 0.73 | 0.90 |
(1) The real estate secured portfolio CLTV is calculated as the mortgage and second lien loan balance divided by the most recently available value of the property.
| Three Months Ended September 30, | Nine Months Ended September 30, | ||||||||||||||||||||||||||||||||||||||||||||||
| (dollars in millions) | 2021 | 2020 | Change | Percent | 2021 | 2020 | Change | Percent | |||||||||||||||||||||||||||||||||||||||
| Net charge-offs | $30 | $49 | ($19) | (39 | %) | $121 | $218 | ($97) | (44 | %) | |||||||||||||||||||||||||||||||||||||
| Annualized net charge-off rate | 0.19 | % | 0.32 | % | (13) | bps | 0.26 | % | 0.48 | % | (22) | bps |
Retail asset quality continues to reflect a stronger economic outlook. The retail annualized net charge-off rate decreased to 0.19% for the third quarter of 2021 from 0.32% in the third quarter of 2020. The net charge-off rate of 0.26% for the nine months ended September 30, 2021 reflected a decrease of 22 basis points from the nine months ended September 30, 2020, driven by the forbearance and stimulus programs stemming from the COVID-19 pandemic and associated lockdowns, as well as strong collateral values in automobile and residential real estate.
Troubled Debt Restructurings
In the first quarter of 2020, we adopted the CARES Act and interagency guidance issued by the bank regulatory agencies which provide that COVID-19-related modifications to retail and commercial loans that met certain eligibility criteria are exempt from classification as a TDR. We generally do not consider payment deferrals and forbearance plans established due to the COVID-19 pandemic to be TDRs.
For additional information regarding TDRs, see Note 5 in our 2020 Form 10-K.
Citizens Financial Group, Inc. | 31
| Table 21: Accruing and Nonaccrual Troubled Debt Restructurings | |||||||||||||||||||||||||||||
| September 30, 2021 | |||||||||||||||||||||||||||||
| As a % of Accruing TDRs | |||||||||||||||||||||||||||||
| (dollars in millions) | Accruing | 30-89 Days Past Due | 90+ Days Past Due | Nonaccrual | Total | ||||||||||||||||||||||||
| Commercial and industrial | $161 | — | % | — | % | $70 | $231 | ||||||||||||||||||||||
| Commercial real estate | — | — | — | 9 | 9 | ||||||||||||||||||||||||
| Total commercial | 161 | — | — | 79 | 240 | ||||||||||||||||||||||||
| Residential mortgages(1) | 339 | 3.9 | 9.8 | 39 | 378 | ||||||||||||||||||||||||
| Home equity | 198 | 0.5 | — | 74 | 272 | ||||||||||||||||||||||||
| Automobile | 8 | 0.1 | — | 28 | 36 | ||||||||||||||||||||||||
| Education | 112 | 0.4 | 0.1 | 12 | 124 | ||||||||||||||||||||||||
| Other retail | 21 | 0.2 | — | 2 | 23 | ||||||||||||||||||||||||
| Total retail | 678 | 5.1 | 9.9 | 155 | 833 | ||||||||||||||||||||||||
| Total | $839 | 5.1 | % | 9.9 | % | $234 | $1,073 |
| December 31, 2020 | |||||||||||||||||||||||||||||
| As a % of Accruing TDRs | |||||||||||||||||||||||||||||
| (dollars in millions) | Accruing | 30-89 Days Past Due | 90+ Days Past Due | Nonaccrual | Total | ||||||||||||||||||||||||
| Commercial and industrial | $134 | 0.1 | % | — | % | $97 | $231 | ||||||||||||||||||||||
| Commercial real estate | 26 | — | — | — | 26 | ||||||||||||||||||||||||
| Total commercial | 160 | 0.1 | — | 97 | 257 | ||||||||||||||||||||||||
| Residential mortgages(1) | 172 | 2.1 | 2.0 | 43 | 215 | ||||||||||||||||||||||||
| Home equity | 221 | 1.0 | — | 83 | 304 | ||||||||||||||||||||||||
| Automobile | 13 | 0.4 | — | 33 | 46 | ||||||||||||||||||||||||
| Education | 116 | 0.5 | 0.3 | 10 | 126 | ||||||||||||||||||||||||
| Other retail | 25 | 0.2 | — | 2 | 27 | ||||||||||||||||||||||||
| Total retail | 547 | 4.2 | 2.3 | 171 | 718 | ||||||||||||||||||||||||
| Total | $707 | 4.3 | % | 2.3 | % | $268 | $975 |
(1) Includes $82 million and $14 million in 90+ days past due and accruing that are fully or partially guaranteed by the FHA, VA, and USDA at September 30, 2021 and December 31, 2020, respectively.
Deposits
| Table 22: Composition of Deposits | |||||||||||||||||||||||
| (in millions) | September 30, 2021 | December 31, 2020 | Change | Percent | |||||||||||||||||||
| Demand | $48,184 | $43,831 | $4,353 | 10 | % | ||||||||||||||||||
| Checking with interest | 27,985 | 27,204 | 781 | 3 | |||||||||||||||||||
| Regular savings | 21,166 | 18,044 | 3,122 | 17 | |||||||||||||||||||
| Money market accounts | 48,935 | 48,569 | 366 | 1 | |||||||||||||||||||
| Term deposits | 5,951 | 9,516 | (3,565) | (37) | |||||||||||||||||||
| Total deposits | $152,221 | $147,164 | $5,057 | 3 | % |
Total deposits as of September 30, 2021 increased $5.1 billion, or 3%, to $152.2 billion, from $147.2 billion as of December 31, 2020, as a result of elevated liquidity tied to government stimulus associated with the COVID-19 disruption. Citizens Access®, our national digital platform, ended the quarter with $4.6 billion of deposits, down from $5.9 billion as of December 31, 2020, primarily due to rate reduction strategies that resulted in a decrease in term deposits.
Citizens Financial Group, Inc. | 32
Borrowed Funds
Total borrowed funds as of September 30, 2021 decreased $1.6 billion from December 31, 2020, driven by a $235 million and $1.4 billion decrease in short-term and long-term borrowed funds, respectively. Strong deposit growth enabled the paydown of senior debt.
Long-term borrowed funds
| Table 23: Summary of Long-Term Borrowed Funds | |||||||||||
| (in millions) | September 30, 2021 | December 31, 2020 | |||||||||
| Parent Company: | |||||||||||
| 2.375% fixed-rate senior unsecured debt, due July 2021(1) | $— | $350 | |||||||||
| 4.150% fixed-rate subordinated debt, due September 2022(2) | 168 | 182 | |||||||||
| 3.750% fixed-rate subordinated debt, due July 2024(2) | 90 | 159 | |||||||||
| 4.023% fixed-rate subordinated debt, due October 2024(2) | 17 | 25 | |||||||||
| 4.350% fixed-rate subordinated debt, due August 2025(2) | 133 | 193 | |||||||||
| 4.300% fixed-rate subordinated debt, due December 2025(2) | 336 | 450 | |||||||||
| 2.850% fixed-rate senior unsecured notes, due July 2026 | 497 | 497 | |||||||||
| 2.500% fixed-rate senior unsecured notes, due February 2030 | 298 | 297 | |||||||||
| 3.250% fixed-rate senior unsecured notes, due April 2030 | 745 | 745 | |||||||||
| 3.750% fixed-rate reset subordinated debt, due February 2031(2) | 69 | — | |||||||||
| 4.300% fixed-rate reset subordinated debt, due February 2031(2) | 135 | — | |||||||||
| 4.350% fixed-rate reset subordinated debt, due February 2031(2) | 61 | — | |||||||||
| 2.638% fixed-rate subordinated debt, due September 2032 | 548 | 543 | |||||||||
| CBNA’s Global Note Program: | |||||||||||
| 2.550% senior unsecured notes, due May 2021 | — | 1,003 | |||||||||
| 3.250% senior unsecured notes, due February 2022 | 704 | 716 | |||||||||
| 0.845% floating-rate senior unsecured notes, due February 2022(3) | 300 | 299 | |||||||||
| 0.932% floating-rate senior unsecured notes, due May 2022(3) | 250 | 250 | |||||||||
| 2.650% senior unsecured notes, due May 2022 | 505 | 510 | |||||||||
| 3.700% senior unsecured notes, due March 2023 | 517 | 527 | |||||||||
| 1.082% floating-rate senior unsecured notes, due March 2023(3) | 250 | 249 | |||||||||
| 2.250% senior unsecured notes, due April 2025 | 746 | 746 | |||||||||
| 3.750% senior unsecured notes, due February 2026 | 533 | 551 | |||||||||
| Additional Borrowings by CBNA and Other Subsidiaries: | |||||||||||
| Federal Home Loan Bank advances, 0.864% weighted average rate, due through 2041 | 19 | 19 | |||||||||
| Other | 26 | 35 | |||||||||
| Total long-term borrowed funds | $6,947 | $8,346 |
(1) Notes were redeemed on June 28, 2021.
(2) The September 30, 2021 balances reflect the results of the February 2021 subordinated debt private exchange offers. See “Capital and Regulatory Matters-Regulatory Capital Ratios and Capital Composition” for additional information.
(3) Rate disclosed reflects the floating rate as of September 30, 2021.
The Parent Company’s long-term borrowed funds as of September 30, 2021 and December 31, 2020 included principal balances of $3.2 billion and $3.5 billion, respectively, and unamortized deferred issuance costs and/or discounts of $82 million and $90 million, respectively. CBNA and other subsidiaries’ long-term borrowed funds as of September 30, 2021 and December 31, 2020 included principal balances of $3.8 billion and $4.8 billion, respectively, with unamortized deferred issuance costs and/or discounts of $8 million and $11 million, respectively, and hedging basis adjustments of $63 million and $112 million, respectively. See Note 8 for further information about our hedging of certain long-term borrowed funds. For information regarding our liquidity and available borrowing capacity, see “—Liquidity” and Note 7.
CAPITAL AND REGULATORY MATTERS
As a bank holding company and a financial holding company, we are subject to regulation and supervision by the FRB. Our banking subsidiary, CBNA, is a national banking association whose primary federal regulator is the OCC. Our regulation and supervision continues to evolve as the legal and regulatory frameworks governing our operations continue to change. For more information, see “Regulation and Supervision” in our 2020 Form 10-K.
Citizens Financial Group, Inc. | 33
Tailoring of Prudential Requirements
Under the FRB’s Tailoring Rules, Category IV firms, such as us, are subject to biennial supervisory stress testing and are exempt from company-run stress testing and related disclosure requirements. The FRB supervises Category IV firms on an ongoing basis, including evaluation of the capital adequacy and capital planning processes during off-cycle years. We are also required to develop, maintain and submit to the FRB an annual capital plan, which must be reviewed and approved by our board of directors or one of its committees. On April 2, 2021, we submitted our 2021 Capital Plan to the FRB under the FRB’s 2021 CCAR process. For more information, see the “Tailoring of Prudential Requirements” section in item 1 of our 2020 Form 10-K.
Under the FRB’s Capital Plan Rule, a firm must update and resubmit its capital plan prior to the next annual submission date under certain circumstances, which includes a material change in the firm’s risk profile, financial condition or corporate structure since its last capital plan submission. On July 28, 2021, we announced an agreement to acquire Investors, which required us to resubmit our capital plan to the FRB, which was submitted on September 15, 2021.
Under the stress capital buffer (“SCB”) framework, the FRB will not object to capital plans on quantitative grounds and each firm is required to maintain capital ratios above the sum of its minimum and SCB requirements to avoid restrictions on capital distributions and discretionary bonus payments. On October 1, 2020, our SCB of 3.4% became effective and applied to our capital actions through September 30, 2021.
On February 3, 2021, the FRB adopted a final rule effective April 5, 2021 to tailor the requirements of its Capital Plan Rule, specifically modifying capital planning, regulatory reporting and stress capital buffer requirements to be consistent with the Tailoring Rules framework. Under the final rule, for Category IV firms, like us, the SCB will be re-calibrated with each biennial supervisory stress test and updated annually to reflect our planned common stock dividends. In addition, Category IV firms have the ability to elect to participate in the supervisory stress test and receive an updated SCB requirement in a year in which they are not subject to the supervisory stress test. We did not elect to participate in the 2021 supervisory stress test. On August 5, 2021, the FRB announced that our SCB will remain unchanged at 3.4% from October 1, 2021 through September 30, 2022.
In light of the heightened uncertainty related to the COVID-19 pandemic and associated lockdowns, the FRB took certain actions to preserve capital at banks. Among those actions, the FRB imposed certain limitations on firms for the third and fourth quarters of 2020, including mandatory suspension of share repurchases and limiting common stock dividends to existing rates and the average quarterly net income over the prior four quarters. The FRB modified its limitations on capital distributions for the first and second quarters of 2021 such that firms that participate in CCAR, like us, may resume share repurchases provided that the aggregate of share repurchases and common stock dividends for the applicable quarter did not exceed average quarterly net income for the trailing four quarters. Beginning July 1, 2021, the FRB lifted the temporary additional restrictions on capital distributions and authorized firms, like us, that are on a two-year cycle and not subject to supervisory stress testing this year to make capital distributions that are consistent with the regulatory capital rules, including normal restrictions under the FRB stress capital buffer framework. In addition, we temporarily suspended share repurchases in connection with entering into the agreement to acquire Investors, and are poised to resume share repurchases after the Investors shareholder vote scheduled for November 19, 2021. In January 2021, our board of directors authorized us to repurchase up to $750 million of our common stock, of which $655 million is available as of September 30, 2021. All future capital distributions are subject to consideration and approval by our board of directors prior to execution. The timing and amount of future dividends and share repurchases will depend on various factors, including our capital position, financial performance, risk-weighted assets, capital impacts of strategic initiatives, market conditions and regulatory considerations.
Regulations relating to capital planning, regulatory reporting and SCB requirements applicable to firms like us are subject to ongoing rule-making and potential further guidance and interpretation by the applicable federal regulators. We will continue to evaluate the impact of these and any other prudential regulatory changes, including their potential resultant changes in our regulatory and compliance costs and expenses.
For more information, see “Regulation and Supervision” and “—Capital and Regulatory Matters” in our 2020 Form 10-K.
Capital Framework
Under the current U.S. Basel III capital framework, we and our banking subsidiary, CBNA, must meet the following specific minimum requirements: CET1 capital ratio of 4.5%, tier 1 capital ratio of 6.0%, total capital ratio of 8.0% and tier 1 leverage ratio of 4.0%. As a bank holding company, our SCB of 3.4% is imposed on top of
Citizens Financial Group, Inc. | 34
the three minimum risk-based capital ratios listed above and a CCB of 2.5% is imposed on top of the three minimum risk-based capital ratios listed above for our banking subsidiary.
Under the U.S. Basel III rules, the CET1 deduction threshold for MSRs, certain deferred tax assets and significant investments in the capital of unconsolidated institutions is 25%. As of September 30, 2021, we did not meet the threshold for these additional capital deductions. MSRs or deferred tax assets not deducted from CET1 capital are assigned a 250% risk weight and significant investments in the capital of unconsolidated financial institutions not deducted from CET1 capital are assigned an exposure category risk weight.
In reaction to the COVID-19 pandemic, the FRB and the other federal banking regulators adopted a final rule relative to regulatory capital treatment of ACL under CECL. This rule allowed electing banking organizations to delay the estimated impact of CECL on regulatory capital for a two-year period ending January 1, 2022, followed by a three-year transition period ending January 1, 2025 to phase-in the aggregate amount of the capital benefit provided during the initial two-year delay. As of September 30, 2021, $401 million of the capital benefit has been accumulated for application to the three-year transition period.
For additional discussion of the U.S. Basel III capital framework and its related application, see “Regulation and Supervision” in our 2020 Form 10-K. The table below presents our actual regulatory capital ratios under the U.S. Basel III Standardized rules:
| Table 24: Regulatory Capital Ratios Under the U.S. Basel III Standardized Rules | ||||||||||||||||||||
| September 30, 2021 | December 31, 2020 | Required Minimum plus Required CCB for Non-Leverage Ratios**(1)** | ||||||||||||||||||
| (in millions, except ratio data) | Amount | Ratio | Amount | Ratio | ||||||||||||||||
| CET1 capital | $15,584 | 10.3 | % | $14,607 | 10.0 | % | 7.9 | % | ||||||||||||
| Tier 1 capital | 17,598 | 11.6 | 16,572 | 11.3 | 9.4 | |||||||||||||||
| Total capital | 20,295 | 13.4 | 19,602 | 13.4 | 11.4 | |||||||||||||||
| Tier 1 leverage | 17,598 | 9.7 | 16,572 | 9.4 | 4.0 | |||||||||||||||
| Risk-weighted assets | 151,796 | 146,781 | ||||||||||||||||||
| Quarterly adjusted average assets | 180,528 | 175,370 |
(1) Required “Minimum Capital ratios” are: CET1 capital of 4.5%; Tier 1 capital of 6.0%; Total capital of 8.0%; and Tier 1 leverage of 4.0%. “Minimum Capital ratios” also include a SCB of 3.4%; N/A to Tier 1 leverage.
At September 30, 2021, our CET1 capital, tier 1 capital and total capital ratios were 10.3%, 11.6% and 13.4%, respectively, as compared with 10.0%, 11.3% and 13.4%, respectively, as of December 31, 2020. The CET1 capital ratio increased as net income for the nine months ended September 30, 2021 was partially offset by dividends and common share repurchases as described in “—Capital Transactions” below, $5.0 billion of risk-weighted asset (“RWA”) growth and a decrease in the modified CECL transitional amount. The tier 1 capital ratio increased due to the changes in the CET1 capital ratio described above and the issuance of Series G Preferred Stock, partially offset by the redemption of Series A Preferred Stock as described in “—Capital Transactions” below. The total capital ratio increased as the changes in the CET1 and tier 1 capital ratios described above combined with the subordinated debt exchange offer in the first quarter of 2021, as described in the “Regulatory Capital Ratios and Capital Composition” section below, were partially offset by the reduction in the net AACL impact and a decrease in qualifying subordinated debt. At September 30, 2021, our CET1 capital, tier 1 capital and total capital ratios were approximately 240 basis points, 220 basis points and 200 basis points, respectively, above their regulatory minimums plus our SCB. All ratios remained well above the U.S. Basel III minimums.
Regulatory Capital Ratios and Capital Composition
CET1 capital under U.S. Basel III Standardized rules totaled $15.6 billion at September 30, 2021, an increase of $977 million from $14.6 billion at December 31, 2020, largely driven by net income for the nine months ended September 30, 2021, partially offset by dividends, a decrease in the modified CECL transitional amount and common share repurchases. Tier 1 capital at September 30, 2021 totaled $17.6 billion, reflecting a $1.0 billion increase from $16.6 billion at December 31, 2020, driven by the changes in CET1 capital and the issuance of Series G Preferred Stock, partially offset by the redemption of Series A Preferred Stock. Total capital of $20.3 billion at September 30, 2021 increased $693 million from December 31, 2020, driven by the changes in CET1 and tier 1 capital and an increase in qualifying subordinated debt, partially offset by the reduction in the net AACL impact.
RWA totaled $151.8 billion at September 30, 2021, based on U.S. Basel III Standardized rules, up $5.0 billion from December 31, 2020, driven by higher automobile loans, commercial commitments, MSRs, agency
Citizens Financial Group, Inc. | 35
securities, education loans, bank-owned life insurance and retail commitments partially offset by lower commercial and other retail loans.
As of September 30, 2021, the tier 1 leverage ratio was 9.7%, up from 9.4% at December 31, 2020, driven by higher tier 1 capital, partially offset by the $5.2 billion increase in quarterly adjusted average assets.
| Table 25: Capital Composition Under the U.S. Basel III Capital Framework | |||||||||||
| (in millions) | September 30, 2021 | December 31, 2020 | |||||||||
| Total common shareholders' equity | $21,409 | $20,708 | |||||||||
| Exclusions: | |||||||||||
| Modified CECL transitional amount | 401 | 568 | |||||||||
| Net unrealized (gains)/losses recorded in accumulated other comprehensive income (loss), net of tax: | |||||||||||
| Debt and equity securities | 33 | (380) | |||||||||
| Derivatives | 74 | 11 | |||||||||
| Unamortized net periodic benefit costs | 401 | 429 | |||||||||
| Deductions: | |||||||||||
| Goodwill | (7,065) | (7,050) | |||||||||
| Deferred tax liability associated with goodwill | 384 | 379 | |||||||||
| Other intangible assets | (53) | (58) | |||||||||
| Total common equity tier 1 | 15,584 | 14,607 | |||||||||
| Qualifying preferred stock | 2,014 | 1,965 | |||||||||
| Total tier 1 capital | 17,598 | 16,572 | |||||||||
| Qualifying subordinated debt(1) | 1,208 | 1,204 | |||||||||
| Allowance for credit losses | 2,004 | 2,670 | |||||||||
| Exclusions from tier 2 capital: | |||||||||||
| Modified AACL transitional amount | (515) | (682) | |||||||||
| Excess allowance for credit losses(2) | — | (162) | |||||||||
| Adjusted allowance for credit losses | 1,489 | 1,826 | |||||||||
| Total capital | $20,295 | $19,602 |
(1) As of September 30, 2021 and December 31, 2020, the amount of non-qualifying subordinated debt excluded from regulatory capital was $349 million and $348 million, respectively.
(2) Excess allowance represents the amount excluded from tier 2 capital that is in excess of 1.25% of risk weighted assets, excluding market risk.
On February 11, 2021, we completed $265 million in private exchange offers for five series of outstanding subordinated notes. Exchange offer participants received newly-issued fixed-rate reset subordinated notes due 2031 which are redeemable by us five years prior to their maturity. These subordinated debt exchange offers will benefit our tier 2 and total capital going forward by increasing the amount of subordinated debt eligible for inclusion in tier 2 capital without increasing the aggregate principal amount of subordinated debt outstanding. See Note 7 for more details on our outstanding subordinated debt.
Capital Adequacy Process
Our assessment of capital adequacy begins with our board-approved risk appetite and risk management framework. This framework provides for the identification, measurement and management of material risks. There have been no significant changes to our capital adequacy risk appetite and risk management framework as described in “—Capital and Regulatory Matters” in our 2020 Form 10-K.
Capital Transactions
We completed the following capital actions during the nine months ended September 30, 2021:
-
Issued 300,000 shares of CFG 4.000% fixed-rate reset non-cumulative perpetual Series G Preferred Stock at an aggregate offering price of $300 million;
-
Redeemed all outstanding shares of CFG Series A Non-Cumulative Perpetual Preferred Stock on July 6, 2021;
-
Completed $265 million of subordinated debt private exchange offers in February 2021;
-
Declared and paid quarterly common stock dividends of $0.39 per share in the first, second and third quarters of 2021, aggregating to $502 million;
Citizens Financial Group, Inc. | 36
-
Declared a quarterly dividend of $10.49 per share in first quarter of 2021 and $10.50 per share in the second quarter of 2021 on the 5.500% fixed-to-floating rate non-cumulative perpetual Series A Preferred Stock, aggregating to $5 million;
-
Declared a semi-annual dividend of $30.00 per share on the 6.000% fixed-to-floating rate non-cumulative perpetual Series B Preferred Stock, aggregating to $9 million;
-
Declared quarterly dividends of $15.94 per share on the 6.375% fixed-to-floating rate non-cumulative perpetual Series C Preferred Stock, aggregating to $15 million;
-
Declared quarterly dividends of $15.88 per share on the 6.350% fixed-to-floating rate non-cumulative perpetual Series D Preferred Stock, aggregating to $14 million;
-
Declared quarterly dividends of $12.50 per share on the 5.000% fixed-rate non-cumulative perpetual Series E Preferred Stock, aggregating to $17 million;
-
Declared quarterly dividends of $14.13 per share on the 5.650% fixed-rate non-cumulative perpetual Series F Preferred Stock, aggregating to $17 million;
-
Declared a quarterly dividend of $12.78 per share in the third quarter of 2021 on the 4.000% fixed-rate reset non-cumulative perpetual Series G Preferred Stock, aggregating to $4 million; and
-
Repurchased $95 million of our outstanding common stock at a weighted-average price per share of $42.32.
Banking Subsidiary’s Capital
| Table 26: CBNA's Capital Ratios Under the U.S. Basel III Standardized Rules | |||||||||||||||||
| September 30, 2021 | December 31, 2020 | ||||||||||||||||
| (dollars in millions, except ratio data) | Amount | Ratio | Amount | Ratio | |||||||||||||
| CET1 capital | $16,791 | 11.1 | % | $16,032 | 10.9 | % | |||||||||||
| Tier 1 capital | 16,791 | 11.1 | 16,032 | 10.9 | |||||||||||||
| Total capital | 19,405 | 12.8 | 18,980 | 13.0 | |||||||||||||
| Tier 1 leverage | 16,791 | 9.3 | 16,032 | 9.2 | |||||||||||||
| Risk-weighted assets | 151,438 | 146,558 | |||||||||||||||
| Quarterly adjusted average assets | 180,034 | 174,954 |
CBNA’s CET1 and tier 1 capital totaled $16.8 billion at September 30, 2021, up $759 million from $16.0 billion at December 31, 2020. This increase was primarily driven by net income for the nine months ended September 30, 2021, partially offset by dividends paid to the Parent Company and a decrease in the modified CECL transitional amount. Total capital was $19.4 billion at September 30, 2021, an increase of $425 million from $19.0 billion at December 31, 2020, driven by the change in CET1 capital partially offset by the reduction in the net AACL impact.
CBNA’s RWA totaled $151.4 billion at September 30, 2021, up $4.9 billion from December 31, 2020, driven by higher automobile loans, commercial commitments, MSRs, agency securities, education loans, bank-owned life insurance and retail commitments partially offset by lower commercial and other retail loans.
As of September 30, 2021, CBNA’s tier 1 leverage ratio of 9.3% increased as the increase in tier 1 capital was mostly offset by the $5.1 billion increase in quarterly adjusted average assets.
LIQUIDITY
Liquidity is defined as our ability to meet our cash-flow and collateral obligations in a timely manner, at a reasonable cost. An institution must maintain operating liquidity to meet its expected daily and forecasted cash-flow requirements, as well as contingent liquidity to meet unexpected (stress scenario) funding requirements. As noted earlier, reflecting the importance of meeting all unexpected and stress-scenario funding requirements, we identify and manage contingent liquidity, consisting of cash balances at the FRB, unencumbered high-quality and liquid securities, and unused FHLB borrowing capacity. Separately, we also identify and manage asset liquidity as a subset of contingent liquidity, consisting of cash balances at the FRB and unencumbered high-quality securities. We consider the effective and prudent management of liquidity fundamental to our health and strength. We manage liquidity at the consolidated enterprise level and at each legal entity, including at the Parent Company and CBNA level.
Citizens Financial Group, Inc. | 37
Parent Company Liquidity
Our Parent Company’s primary sources of cash are dividends and interest received from CBNA as a result of investing in bank equity and subordinated debt as well as externally issued preferred stock, senior and subordinated debt. Uses of cash include the routine cash flow requirements as a bank holding company, including periodic share repurchases and payments of dividends, interest and expenses; the needs of subsidiaries, including CBNA for additional equity and, as required, its need for debt financing; and the support for extraordinary funding requirements when necessary. To the extent the Parent Company has relied on wholesale borrowings, uses also include payments of related principal and interest.
During the nine months ended September 30, 2021, the Parent Company completed the following transactions:
-
Redeemed all outstanding shares of 5.50% fixed-to-floating rate non-cumulative perpetual Series A Preferred Stock;
-
Issued 300,000 shares of 4.00% fixed-rate reset non-cumulative perpetual Series G Preferred Stock at an aggregate offering price of $300 million; and
-
Redeemed $350 million of 2.375% fixed-rate senior unsecured debt due July 2021.
During the three months ended September 30, 2021 and 2020, the Parent Company declared dividends on common stock of $167 million and $168 million, respectively, and declared dividends on preferred stock of $26 million and $25 million, respectively.
During the nine months ended September 30, 2021 and 2020, the Parent Company declared dividends on common stock of $502 million and $504 million, respectively, and declared dividends on preferred stock of $81 million and $75 million, respectively.
Our Parent Company’s cash and cash equivalents represent a source of liquidity that can be used to meet various needs and totaled $2.5 billion and $2.7 billion as of September 30, 2021 and December 31, 2020, respectively. The Parent Company’s double-leverage ratio, the combined equity investment in Parent Company subsidiaries divided by Parent Company equity, is a measure of reliance on equity cash flows from subsidiaries to fund Parent Company obligations. At September 30, 2021, the Parent Company’s double-leverage ratio was 97.2%.
CBNA Liquidity
As CBNA’s primary business involves taking deposits and making loans, a key role of liquidity management is to ensure that customers have timely access to funds from deposits and for loans. Liquidity management also involves maintaining sufficient liquidity to repay wholesale borrowings, pay operating expenses and support extraordinary funding requirements when necessary. In the ordinary course of business, the liquidity of CBNA is managed by matching sources and uses of cash. The primary sources of bank liquidity include deposits from our consumer and commercial customers; payments of principal and interest on loans and debt securities; and wholesale borrowings, as needed, and as described under “—Liquidity Risk Management and Governance.” The primary uses of bank liquidity include withdrawals and maturities of deposits; payment of interest on deposits; funding of loans and related commitments; and funding of securities purchases. To the extent that CBNA has relied on wholesale borrowings, uses also include payments of related principal and interest. For further information on CBNA’s outstanding debt, see Note 7.
Liquidity Risk
We define liquidity risk as the risk that an entity will be unable to meet its payment obligations in a timely manner, at a reasonable cost. Liquidity risk can arise due to contingent liquidity risk and/or funding liquidity risk.
Contingent liquidity risk is the risk that market conditions may reduce an entity’s ability to liquidate, pledge and/or finance certain assets and thereby substantially reduce the liquidity value of such assets. Drivers of contingent liquidity risk include general market disruptions as well as specific issues regarding the credit quality and/or valuation of a security or loan, issuer or borrower and/or asset class.
Funding liquidity risk is the risk that market conditions and/or entity-specific events may reduce an entity’s ability to raise funds from depositors and/or wholesale market counterparties. Drivers of funding liquidity risk may be idiosyncratic or systemic, reflecting impediments to operations and/or damaged market confidence.
Citizens Financial Group, Inc. | 38
Factors Affecting Liquidity
Given the composition of assets and borrowing sources, contingent liquidity risk at CBNA would be materially affected by events such as deterioration of financing markets for high-quality securities (e.g., mortgage-backed securities and other instruments issued by the GNMA, FNMA and the FHLMC), by any inability of the FHLBs to provide collateralized advances and/or by a refusal of the FRB to act as a lender of last resort in systemic stress.
Similarly, given the structure of its balance sheet, the funding liquidity risk of CBNA would be materially affected by an adverse idiosyncratic event (e.g., a major loss, causing a perceived or actual deterioration in its financial condition), an adverse systemic event (e.g., default or bankruptcy of a significant capital markets participant), or a combination of both. Consequently, and despite ongoing exposure to a variety of idiosyncratic and systemic events, we view our contingent liquidity risk and our funding liquidity risk to be relatively modest.
An additional variable affecting our access to unsecured wholesale market funds and to large denomination (i.e., uninsured) customer deposits is the credit ratings assigned by such agencies as Moody’s, Standard and Poor’s, and Fitch.
| Table 27: Credit Ratings | |||||||||||||||||
| September 30, 2021 | |||||||||||||||||
| Moody’s | Standard and Poor’s | Fitch | |||||||||||||||
| Citizens Financial Group, Inc.: | |||||||||||||||||
| Long-term issuer | NR | BBB+ | BBB+ | ||||||||||||||
| Short-term issuer | NR | A-2 | F1 | ||||||||||||||
| Subordinated debt | NR | BBB | BBB | ||||||||||||||
| Preferred Stock | NR | BB+ | BB | ||||||||||||||
| Citizens Bank, National Association: | |||||||||||||||||
| Long-term issuer | Baa1 | A- | BBB+ | ||||||||||||||
| Short-term issuer | NR | A-2 | F1 | ||||||||||||||
| Long-term deposits | A1 | NR | A- | ||||||||||||||
| Short-term deposits | P-1 | NR | F1 | ||||||||||||||
| NR = Not rated |
Changes in our public credit ratings could affect both the cost and availability of our wholesale funding. As a result, and in order to maintain a conservative funding profile, CBNA continues to minimize reliance on unsecured wholesale funding. At September 30, 2021, our wholesale funding consisted primarily of term debt issued by the Parent Company and CBNA.
Existing and evolving regulatory liquidity requirements represent another key driver of systemic liquidity conditions and liquidity management practices. The FRB, the OCC, and the FDIC regularly evaluate our liquidity as part of the overall supervisory process. In addition, we are subject to existing and evolving regulatory liquidity requirements, some of which are subject to further rulemaking, guidance and interpretation by the applicable federal regulators. For further discussion, see “Regulation and Supervision — Tailoring of Prudential Requirements” and “—Liquidity Requirements” in our 2020 Form 10-K.
Liquidity Risk Management and Governance
Liquidity risk is measured and managed by the Funding and Liquidity unit within our Treasury unit in accordance with policy guidelines promulgated by our Board and the Asset Liability Committee. In managing liquidity risk, the Funding and Liquidity unit delivers regular and comprehensive reporting, including current levels versus threshold limits for a broad set of liquidity metrics and early warning indicators, explanatory commentary relating to emerging risk trends and, as appropriate, recommended remedial strategies.
Citizens Financial Group, Inc. | 39
Our Funding and Liquidity unit’s primary goals are to deliver and maintain prudent levels of operating liquidity to support expected and projected funding requirements, contingent liquidity to support unexpected funding requirements resulting from idiosyncratic, systemic, and combination stress events, and regulatory liquidity requirements in a timely manner from stable and cost-efficient funding sources. We seek to accomplish this goal by funding loans with stable deposits; by prudently controlling dependence on wholesale funding, particularly short-term unsecured funding; and by maintaining ample available liquidity, including a contingent liquidity buffer of unencumbered high-quality loans and securities. As of September 30, 2021:
-
Organically generated deposits continue to be our primary source of funding, resulting in a consolidated period end loan-to-deposits ratio, excluding LHFS, of 81.0%;
-
Our cash position, which is defined as cash balance held at the FRB, totaled $12.5 billion;
-
Our total available liquidity, comprised of contingent liquidity and available discount window capacity, was approximately $76.1 billion;
-
Contingent liquidity was $48.7 billion, consisting of unencumbered high-quality liquid securities of $21.1 billion, unused FHLB capacity of $15.1 billion, and our cash position of $12.5 billion. Asset liquidity, a component of contingent liquidity, was $33.6 billion, consisting of our cash position of $12.5 billion and unencumbered high-quality liquid securities of $21.1 billion;
-
Available discount window capacity, defined as available total borrowing capacity from the FRB based on identified collateral, is secured by non-mortgage commercial and retail loans and totaled $27.4 billion. Use of this borrowing capacity would be considered only during exigent circumstances; and
-
For a summary of our sources and uses of cash by type of activity for the nine months ended September 30, 2021 and 2020, see the Consolidated Statements of Cash Flows.
The Funding and Liquidity unit monitors a variety of liquidity and funding metrics and early warning indicators and metrics, including specific risk thresholds limits. These monitoring tools are broadly classified as follows:
-
Current liquidity sources and capacities, including cash at the FRBs, free and liquid securities and secured FHLB borrowing capacity;
-
Liquidity stress sources, including idiosyncratic, systemic and combined stresses, in addition to evolving regulatory requirements; and
-
Current and prospective exposures, including secured and unsecured wholesale funding and spot and cumulative cash-flow gaps across a variety of horizons.
Further, certain of these metrics are monitored individually for CBNA and for our consolidated enterprise on a daily basis, including cash position, unencumbered securities, asset liquidity and available FHLB borrowing capacity. In order to identify emerging trends and risks and inform funding decisions, specific metrics are also forecasted over a one-year horizon.
OFF-BALANCE SHEET ARRANGEMENTS
The following table presents our outstanding off-balance sheet arrangements. For further information, see Note 11.
| Table 28: Outstanding Off-Balance Sheet Arrangements | |||||||||||||||||||||||
| (in millions) | September 30, 2021 | December 31, 2020 | Change | Percent | |||||||||||||||||||
| Commitments to extend credit | $80,629 | $74,160 | $6,469 | 9 | % | ||||||||||||||||||
| Letters of credit | 1,939 | 2,239 | (300) | (13) | |||||||||||||||||||
| Risk participation agreements | 57 | 98 | (41) | (42) | |||||||||||||||||||
| Loans sold with recourse | 70 | 54 | 16 | 30 | |||||||||||||||||||
| Marketing rights | 26 | 29 | (3) | (10) | |||||||||||||||||||
| Total | $82,721 | $76,580 | $6,141 | 8 | % |
Citizens Financial Group, Inc. | 40
CRITICAL ACCOUNTING ESTIMATES
Our unaudited interim Consolidated Financial Statements, included in this Report, are prepared in accordance with GAAP. The preparation of financial statements in conformity with GAAP requires us to establish accounting policies and make estimates that affect amounts reported in our audited Consolidated Financial Statements.
An accounting estimate requires assumptions and judgments about uncertain matters that could have a material effect on our unaudited interim Consolidated Financial Statements. Estimates are made using facts and circumstances known at a point in time. Changes in those facts and circumstances could produce results substantially different from those estimates. Our most significant accounting policies and estimates and their related application are discussed below. For additional information regarding fair value measurements, see “—Critical Accounting Estimates” in our 2020 Form 10-K.
Allowance for Credit Losses
The ACL decreased from $2.7 billion at December 31, 2020 to $2.0 billion at September 30, 2021, reflecting a reserve release of $666 million.
To determine the ACL as of September 30, 2021, we utilized an economic forecast that generally reflects real GDP growth of approximately 5.8% over 2021. The forecast also projects the unemployment rate to be in the range of 5.3% to 6.3% throughout 2021. This forecast reflects an overall improved macroeconomic outlook as compared to December 31, 2020. We continue to utilize our qualitative allowance framework to reassess and adjust ACL reserve levels. Macroeconomic forecast risk, driven by uncertainty and volatility of key macroeconomic variables, is one of the primary factors influencing our qualitative reserve. As the economic recovery following the COVID-19 pandemic has continued, we have assessed risks to the recovery, including potential for continuing impacts from COVID-19 variants, challenges in the global supply chain, and recent inflationary trends, as well as potential impacts from ending monetary and fiscal stimulus programs. In addition to judgment applied to the commercial portfolio as a whole, we continued to apply management judgment to adjust the modeled reserves in the commercial industry sectors most impacted by the COVID-19 pandemic and associated lockdowns, including CRE retail, CRE office and hospitality and casual dining.
Our determination of the ACL is sensitive to changes in forecasted macroeconomic conditions during the reasonable and supportable period. To illustrate the sensitivity, we applied a more pessimistic scenario than that described above which assumes that challenges in acceptance of vaccines cause COVID-19-related infections to abate later than in our base case scenario, with concerns rising about resistant strains. Consumer spending is slower to rebound, with businesses reopening more slowly and vacation spending muted. This pessimistic scenario reflects real GDP growth of approximately 2.5% and unemployment in the range of 5.9% to 8.4% over 2021. Excluding consideration of qualitative adjustments, this scenario would result in a quantitative lifetime loss estimate of approximately 1.2x our modeled period-end ACL, or an increase of approximately $230 million. This analysis relates only to the modeled credit loss estimate and not to the overall period-end ACL, which includes qualitative adjustments.
Because several quantitative and qualitative factors are considered in determining the ACL, this sensitivity analysis does not necessarily reflect the nature and extent of future changes in the ACL or even what the ACL would be under these economic circumstances. The sensitivity is intended to provide insights into the impact of adverse changes in the macroeconomic environment and the corresponding impact to modeled loss estimates. The hypothetical determination does not incorporate the impact of management judgment or other qualitative factors that could be applied in the actual estimation of the ACL and does not imply any expectation of future deterioration in our loss rates.
To provide additional context regarding sensitivity to more pessimistic scenarios, our ACL balance of $2.0 billion represents 23% of the $8.6 billion of nine-quarter losses projected in the Federal Reserve run of the December 2020 Supervisory Severely Adverse scenario, which forecasted more protracted unemployment and GDP declines compared with our ACL calculation. Our ACL calculation also included the impacts of government stimulus.
Comparatively, our ACL represents 39% of the $5.1 billion of projected losses in the Company run results of the Supervisory Severely Adverse scenario. Losses projected under the Company Supervisory Severely Adverse scenario are lower than the Federal Reserve results due to methodology and modeling differences. As an example, the Federal Reserve’s models did not recognize contractual loss sharing arrangements in the merchant loan portfolio. Both the Company and Federal Reserve results include incremental losses associated with loan
Citizens Financial Group, Inc. | 41
originations assumed post-September 30, 2020. In contrast, our September 30, 2021 ACL balance considers only existing loans and lines of credit as of the reporting date.
While the economic recovery from the COVID-19 pandemic continues, significant future uncertainty still exists, including the impacts of COVID-19 variants and challenges from vaccine acceptance rates on consumer sentiment and spending behavior. It remains difficult to estimate how changes in economic forecasts might affect our ACL because such forecasts consider a wide variety of variables and inputs, and changes in the variables and inputs may not occur at the same time or in the same direction, and such changes may have differing impacts by product types. The variables and inputs may be idiosyncratically affected by risks to the recovery, including potential for continuing impacts from COVID-19 variants, challenges in the global supply chain and recent inflationary trends, as well as potential impacts from ending monetary and fiscal stimulus programs. Changes in one or multiple of the key variables may have a material impact to our estimation of expected credit losses.
We continue to monitor the impact of COVID-19 and related fiscal and monetary policy measures on the economy and the resulting potentially material effects on the ACL.
For additional information regarding the ACL, see Note 4 of this report, and “Critical Accounting Estimates” and Note 5 in the Company’s 2020 Form 10-K.
RISK GOVERNANCE
We are committed to maintaining a strong, integrated, and proactive approach to the management of all risks to which we are exposed in pursuit of our business objectives. A key aspect of our Board’s responsibility as the main decision making body is setting our risk appetite to ensure that the levels of risk that we are willing to accept in the attainment of our strategic business and financial objectives are clearly understood.
To enable our Board to carry out its objectives, it has delegated authority for risk management activities, as well as governance and oversight of those activities, to a number of Board and executive management level risk committees. The Executive Risk Committee (“ERC”), chaired by the Chief Risk Officer, is responsible for oversight of risk across the enterprise and actively considers our inherent material risks, analyzes our overall risk profile and seeks confirmation that the risks are being appropriately identified, assessed and mitigated. Reporting to the ERC are the following additional committees covering specific areas of risk: Compliance and Operational Risk Committee, Model Risk Committee, Credit Policy Committee, Asset Liability Committee, Business Initiatives Review Committee, and the Conduct and Ethics Committee.
There have been no significant changes in our risk governance practices, risk framework, risk appetite, or credit risk as described in “—Risk Governance” in our 2020 Form 10-K.
MARKET RISK
Market risk refers to potential losses arising from changes in interest rates, foreign exchange rates, equity prices, commodity prices and/or other relevant market rates or prices. Modest market risk arises from trading activities that serve customer needs, including hedging of interest rate and foreign exchange risk. As described below, more material market risk arises from our non-trading banking activities, such as loan origination and deposit-gathering. We have established enterprise-wide policies and methodologies to identify, measure, monitor and report market risk. We actively manage market risk for both non-trading and trading activities.
Non-Trading Risk
We are exposed to market risk as a result of non-trading banking activities. This market risk is substantially composed of interest rate risk, as we have no commodity risk and de minimis direct currency and equity risk. We also have market risk related to capital markets loan originations, as well as the valuation of our MSRs. There have been no significant changes in our sources of interest rate risk, interest rate risk practices, risk framework, metrics or assumptions as described in “—Market Risk — Non-Trading Risk” in our 2020 Form 10-K.
The table below reports net interest income exposures against a variety of interest rate scenarios. Our policies involve measuring exposures as a percentage change in net interest income over the next year due to either instantaneous or gradual parallel changes in rates relative to the market implied forward yield curve. As the following table illustrates, our balance sheet is asset sensitive; net interest income would benefit from an increase in interest rates, while exposure to a decline in interest rates is within limit. While an instantaneous and severe shift in interest rates is included in this analysis, we believe that any actual shift in interest rates would likely be more gradual and therefore have a more modest impact.
Citizens Financial Group, Inc. | 42
The table below presents the sensitivity of net interest income to various parallel yield curve shifts from the market implied forward yield curve:
| Table 29: Sensitivity of Net Interest Income | |||||||||||
| Estimated % Change in Net Interest Income over 12 Months | |||||||||||
| Basis points | September 30, 2021 | December 31, 2020 | |||||||||
| Instantaneous Change in Interest Rates | |||||||||||
| 200 | 20.8 | % | 21.2 | % | |||||||
| 100 | 10.9 | 11.2 | |||||||||
| -25 | (2.4) | (2.7) | |||||||||
| Gradual Change in Interest Rates | |||||||||||
| 200 | 9.8 | 10.8 | |||||||||
| 100 | 4.9 | 5.5 | |||||||||
| -25 | (1.2) | (1.5) |
We continue to manage asset sensitivity within the scope of our policy and changing market conditions. Asset sensitivity against a 200 basis point gradual increase in rates decreased 1.0% to 9.8% as of September 30, 2021 as compared to 10.8% at December 31, 2020, resulting from loan and deposit mix changes and the addition of $10.5 billion of receive-fixed/pay-variable interest rate swaps. Current levels of asset sensitivity remain elevated relative to our core sensitivity profile due to these cash and deposit balances which are a result of monetary and fiscal stimulus programs. Changes in interest rates can also affect the risk positions, which impacts the repricing sensitivity or beta of the deposit base as well as the cash flows on assets that allow for early payoff without a penalty. The risk position is managed within our risk limits, and long-term view of interest rates through occasional adjustments to securities investments, interest rate swaps and mix of funding.
We use a valuation measure of exposure to structural interest rate risk, Economic Value of Equity (“EVE”), as a supplement to net interest income simulations. EVE complements net interest income simulation analysis as it estimates risk exposure over a long-term horizon. EVE measures the extent to which the economic value of assets, liabilities and off-balance sheet instruments may change in response to fluctuations in interest rates. This analysis is highly dependent upon assumptions applied to assets and liabilities with non-contractual maturities. The change in value is expressed as a percentage of regulatory capital.
We use interest rate swap contracts to manage the interest rate exposure to variability in the interest cash flows on our floating-rate assets and floating-rate wholesale funding, and to hedge market risk on fixed-rate capital markets debt issuances.
| Table 30: Interest Rate Swap Contracts Used to Manage Non-Trading Interest Rate Exposure | |||||||||||||||||||||||||||||||||||
| September 30, 2021 | December 31, 2020 | ||||||||||||||||||||||||||||||||||
| Weighted Average | Weighted Average | ||||||||||||||||||||||||||||||||||
| (dollars in millions) | Notional Amount | Maturity (Years) | Receive Rate | Pay Rate | Notional Amount | Maturity (Years) | Receive Rate | Pay Rate | |||||||||||||||||||||||||||
| Cash flow - receive-fixed/pay-variable - conventional ALM(1) | $16,250 | 3.2 | 1.1 | % | 0.1 | % | $12,350 | 1.0 | 1.5 | % | 0.2 | % | |||||||||||||||||||||||
| Fair value - receive-fixed/pay-variable - conventional debt | 2,200 | 1.5 | 2.5 | 0.1 | 3,200 | 1.7 | 2.1 | 0.2 | |||||||||||||||||||||||||||
| Cash flow - pay-fixed/receive-variable - conventional ALM(1)(2) | 3,000 | 2.7 | 0.1 | 1.7 | 4,750 | 3.9 | 0.2 | 1.4 | |||||||||||||||||||||||||||
| Fair value - pay-fixed/receive-variable - conventional ALM(1) | 2,000 | 3.0 | 0.1 | 1.5 | 2,000 | 3.7 | 0.2 | 1.5 | |||||||||||||||||||||||||||
| Total portfolio swaps | $23,450 | 3.0 | 1.0 | % | 0.4 | % | $22,300 | 2.0 | 1.2 | % | 0.6 | % | |||||||||||||||||||||||
(1) Asset Liability Management (“ALM”) strategies used to manage interest rate exposures include interest rate swap contracts used to manage exposure to the variability in the interest cash flows on our floating-rate commercial loans and floating-rate wholesale funding, as well as the variability in the fair value of AFS securities.
(2) December 31, 2020 includes $1.8 billion of forward-starting, pay-fixed interest rate swaps that were terminated in the first quarter of 2021.
Using the interest rate curve at September 30, 2021, the estimated net contribution to net interest income related to our ALM hedge strategies is approximately $103 million for the full-year 2021 compared to $133 million for the full-year 2020. The estimated net contribution could differ from amounts actually recognized due to changes in interest rates and the addition of other hedges subsequent to September 30, 2021.
Citizens Financial Group, Inc. | 43
The following table presents the pre-tax net gains (losses) recorded in the Consolidated Statements of Operations and in the Consolidated Statements of Comprehensive Income relating to derivative instruments designated as cash flow hedges:
| Table 31: Pre-Tax Gains (Losses) Recorded in the Consolidated Statements of Operations and the Consolidated Statements of Comprehensive Income | ||||||||||||||||||||||||||||||||
| Three Months Ended September 30, | Nine Months Ended September 30, | |||||||||||||||||||||||||||||||
| (in millions) | 2021 | 2020 | 2021 | 2020 | ||||||||||||||||||||||||||||
| Amount of pre-tax net gains (losses) recognized in OCI | ($15) | $— | $19 | $118 | ||||||||||||||||||||||||||||
| Amount of pre-tax net gains (losses) reclassified from OCI into interest income | 46 | 68 | 141 | 128 | ||||||||||||||||||||||||||||
| Amount of pre-tax net gains (losses) reclassified from OCI into interest expense | (13) | (11) | (37) | (22) |
(1) Using the interest rate curve at September 30, 2021, with respect to cash flow hedge strategies, we estimate that approximately $76 million will be reclassified from AOCI to net interest income over the next 12 months.
LIBOR Transition
As previously disclosed, many of our lending products, securities, derivatives, and other financial transactions utilize the LIBOR benchmark rate and will be impacted by its planned discontinuance. In late 2018, we formed a LIBOR Transition Program designed to guide the organization through the planned discontinuation of LIBOR. The Program, with direction and oversight from our Chief Financial Officer, is responsible for developing, maintaining and executing against a coordinated strategy to ensure a timely and orderly transition from LIBOR. The Program is structured to address various initiatives including program governance, transition management, communications, exposure management, new alternative reference rate product delivery, risk management, contract remediation, operations and technology readiness, accounting and reporting, as well as tax and regulation impacts. Risks associated with the LIBOR transition are tracked and reviewed on a quarterly basis with a focus on the identification of mitigation actions.
The ARRC recommended that banks be systemically and operationally capable of supporting transactions in alternative reference rates, such as SOFR, by the end of September 2020. Guided by this milestone, we are systemically and operationally prepared to support alternative reference rate transactions. On March 5, 2021, the Financial Conduct Authority (“FCA”) formally announced the future cessation or loss of representation of the LIBOR benchmark settings currently published by the Intercontinental Exchange (“ICE”) Benchmark Administration. Further, the FCA stated that the 1-week and 2-month U.S. Dollar LIBOR rates will cease as of December 31, 2021 and all other U.S. Dollar LIBOR tenors will cease as of June 30, 2023. With the FRB, OCC, and FDIC (collectively, the agencies) supporting this announcement, the LIBOR Transition Program adjusted LIBOR transition activities and timelines accordingly. The agencies continue to urge market participants to stop entering into new U.S. Dollar LIBOR contracts as soon as practicable, but no later than the end of 2021. We are continuing all efforts to move new originations to alternative reference rates over the course of 2021 in anticipation of this deadline. However, our plans for legacy contract remediation now extend through mid-2023 given the FCA announcement. More broadly, program governance remains robust, and progress has been made in the above-outlined initiatives as management continues to closely monitor industry and regulatory developments pertaining to the transition.
Capital Markets
A key component of our capital markets activities is the underwriting and distribution of corporate credit facilities to partially finance merger and acquisition transactions for our clients. We have a rigorous risk management process around these activities, including a limit structure capping our underwriting risk, our potential loss, and sub limits for specific asset classes. Further, the ability to approve underwriting exposure is delegated only to senior level individuals in the credit risk management and capital markets organizations with each transaction adjudicated in the Loan Underwriting Approval Committee.
Mortgage Servicing Rights
We have market risk associated with the value of residential MSRs, which are impacted by various types of inherent risks, including duration, basis, convexity, volatility and yield curve.
As part of our overall risk management strategy relative to the fair market value of the MSRs, we enter into various free-standing derivatives, such as interest rate swaps, interest rate swaptions, interest rate futures, and forward contracts to purchase mortgage-backed securities to economically hedge the changes in fair value. As of September 30, 2021 and December 31, 2020, the fair value of our MSRs was $978 million and $658 million, respectively, and the total notional amount of related derivative contracts was $15.4 billion and $11.4 billion,
Citizens Financial Group, Inc. | 44
respectively. Gains and losses on MSRs and the related derivatives used for hedging are included in mortgage banking fees in the Consolidated Statements of Operations.
As with our traded market risk-based activities, earnings at-risk excludes the impact of MSRs. MSRs are captured under our single price risk management framework that is used for calculating a management value at risk that is consistent with the definition used by banking regulators.
Trading Risk
We are exposed to market risk primarily through client facilitation activities including derivatives and foreign exchange products as well as underwriting and market making activities. Exposure is created as a result of changes in interest rates and related basis spreads and volatility, foreign exchange rates, and credit spreads on a select range of interest rates, foreign exchange, commodities, corporate bonds and secondary loan instruments. These trading activities are conducted through CBNA and CCMI. There have been no significant changes in our market risk governance, market risk measurement, or market risk practices including VaR, stressed VaR, sensitivity analysis, stress testing, or VaR model review and validation as described in “—Market Risk — Trading Risk” in our 2020 Form 10-K.
Market Risk Regulatory Capital
The U.S. banking regulators’ “Market Risk Rule” covers the calculation of market risk capital. For the purposes of the Market Risk Rule, all of our client facing trades and associated hedges maintain a net low risk and do qualify as “covered positions.” The internal management VaR measure is calculated based on the same population of trades that is utilized for regulatory VaR.
| Table 32: Results of Modeled and Non-Modeled Measures for Regulatory Capital Calculations | ||||||||||||||||||||||||||||||||||||||||||||||||||
| (in millions) | For the Three Months Ended September 30, 2021 | For the Three Months Ended September 30, 2020 | ||||||||||||||||||||||||||||||||||||||||||||||||
| Market Risk Category | Period End | Average | High | Low | Period End | Average | High | Low | ||||||||||||||||||||||||||||||||||||||||||
| Interest Rate | $1 | $1 | $3 | $— | $1 | $1 | $4 | $1 | ||||||||||||||||||||||||||||||||||||||||||
| Foreign Exchange Currency Rate | 1 | 1 | 1 | 1 | — | — | 4 | — | ||||||||||||||||||||||||||||||||||||||||||
| Credit Spread | 6 | 9 | 14 | 4 | 11 | 10 | 12 | 7 | ||||||||||||||||||||||||||||||||||||||||||
| Commodity | — | — | — | — | — | — | — | — | ||||||||||||||||||||||||||||||||||||||||||
| General VaR | 6 | 10 | 14 | 4 | 11 | 8 | 15 | 6 | ||||||||||||||||||||||||||||||||||||||||||
| Specific Risk VaR | — | — | — | — | — | — | — | — | ||||||||||||||||||||||||||||||||||||||||||
| Total VaR | $6 | $10 | $17 | $4 | $11 | $8 | $15 | $6 | ||||||||||||||||||||||||||||||||||||||||||
| Stressed General VaR | $8 | $11 | $16 | $5 | $13 | $10 | $20 | $7 | ||||||||||||||||||||||||||||||||||||||||||
| Stressed Specific Risk VaR | — | — | — | — | — | — | — | — | ||||||||||||||||||||||||||||||||||||||||||
| Total Stressed VaR | $8 | $11 | $16 | $5 | $13 | $10 | $20 | $7 | ||||||||||||||||||||||||||||||||||||||||||
| Market Risk Regulatory Capital | $62 | $55 | ||||||||||||||||||||||||||||||||||||||||||||||||
| Specific Risk Not Modeled Add-on | 16 | 12 | ||||||||||||||||||||||||||||||||||||||||||||||||
| Total Market Risk Regulatory Capital | $78 | $67 | ||||||||||||||||||||||||||||||||||||||||||||||||
| Market Risk-Weighted Assets | $973 | $834 |
VaR Backtesting
Backtesting is one form of validation of the VaR model and is run daily. The Market Risk Rule requires a comparison of our internal VaR measure to the actual net trading revenue (excluding fees, commissions, reserves, intra-day trading and net interest income) for each day over the preceding year (the most recent 250 business days). Any observed loss in excess of the VaR number is taken as an exception. The level of exceptions determines the multiplication factor used to derive the VaR and SVaR-based capital requirement for regulatory reporting purposes, when applicable. We perform sub-portfolio backtesting as required under the Market Risk Rule, using models approved by our banking regulators, for interest rate, credit spread, commodity, and foreign exchange positions.
Citizens Financial Group, Inc. | 45
The following graph shows our daily net trading revenue and total internal, modeled VaR for the twelve months ended September 30, 2021.
Daily VaR Backtesting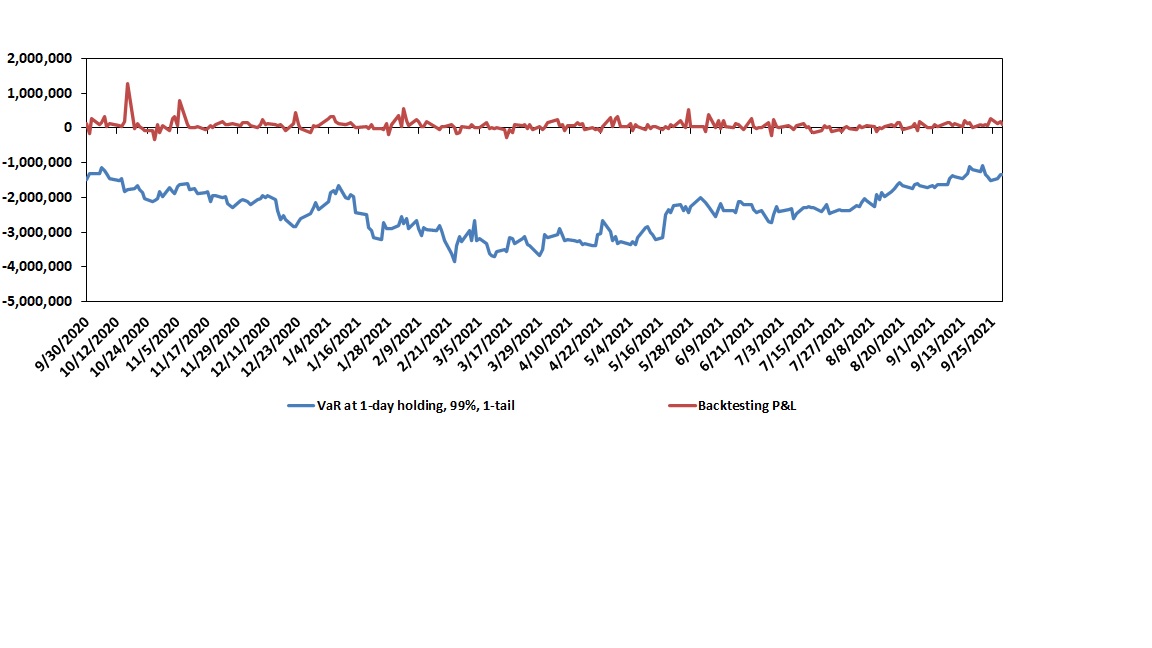
Citizens Financial Group, Inc. | 46
NON-GAAP FINANCIAL MEASURES AND RECONCILIATIONS
For more information on the computation of our non-GAAP financial measures, see “—Introduction — Non-GAAP Financial Measures,” included in this Report. The following tables present computations of non-GAAP financial measures representing our Underlying results used throughout the MD&A:
| Table 33: Reconciliations of Non-GAAP Measures | ||||||||||||||||||||||||||
| As of and for the Three Months Ended September 30, | As of and for the Nine Months Ended September 30, | |||||||||||||||||||||||||
| (in millions, except share, per share and ratio data) | Ref. | 2021 | 2020 | 2021 | 2020 | |||||||||||||||||||||
| Total revenue, Underlying: | ||||||||||||||||||||||||||
| Total revenue (GAAP) | A | $1,659 | $1,791 | $4,927 | $5,198 | |||||||||||||||||||||
| Less: Notable items | — | — | — | — | ||||||||||||||||||||||
| Total revenue, Underlying (non-GAAP) | B | $1,659 | $1,791 | $4,927 | $5,198 | |||||||||||||||||||||
| Noninterest expense, Underlying: | ||||||||||||||||||||||||||
| Noninterest expense (GAAP) | C | $1,011 | $988 | $3,020 | $2,979 | |||||||||||||||||||||
| Less: Notable items | 23 | 31 | 54 | 83 | ||||||||||||||||||||||
| Noninterest expense, Underlying (non-GAAP) | D | $988 | $957 | $2,966 | $2,896 | |||||||||||||||||||||
| Pre-provision profit: | ||||||||||||||||||||||||||
| Total revenue (GAAP) | A | $1,659 | $1,791 | $4,927 | $5,198 | |||||||||||||||||||||
| Less: Noninterest expense (GAAP) | C | 1,011 | 988 | 3,020 | 2,979 | |||||||||||||||||||||
| Pre-provision profit (GAAP) | $648 | $803 | $1,907 | $2,219 | ||||||||||||||||||||||
| Pre-provision profit, Underlying | ||||||||||||||||||||||||||
| Total revenue, Underlying (non-GAAP) | B | $1,659 | $1,791 | $4,927 | $5,198 | |||||||||||||||||||||
| Less: Noninterest expense, Underlying (non-GAAP) | D | 988 | 957 | 2,966 | 2,896 | |||||||||||||||||||||
| Pre-provision profit, Underlying (non-GAAP) | $671 | $834 | $1,961 | $2,302 | ||||||||||||||||||||||
| Income before income tax expense, Underlying: | ||||||||||||||||||||||||||
| Income before income tax expense (GAAP) | E | $681 | $375 | $2,293 | $727 | |||||||||||||||||||||
| Less: Income (loss) before income tax expense (benefit) related to notable items | (23) | (31) | (54) | (83) | ||||||||||||||||||||||
| Income before income tax expense, Underlying (non-GAAP) | F | $704 | $406 | $2,347 | $810 | |||||||||||||||||||||
| Income tax expense and effective income tax rate, Underlying: | ||||||||||||||||||||||||||
| Income tax expense (GAAP) | G | $151 | $61 | $504 | $126 | |||||||||||||||||||||
| Less: Income tax expense (benefit) related to notable items | (7) | (7) | (15) | (24) | ||||||||||||||||||||||
| Income tax expense, Underlying (non-GAAP) | H | $158 | $68 | $519 | $150 | |||||||||||||||||||||
| Effective income tax rate (GAAP) | G/E | 22.35 | % | 16.10 | % | 22.01 | % | 17.27 | % | |||||||||||||||||
| Effective income tax rate, Underlying (non-GAAP) | H/F | 22.45 | 16.79 | 22.09 | 18.57 | |||||||||||||||||||||
| Net income, Underlying: | ||||||||||||||||||||||||||
| Net income (GAAP) | I | $530 | $314 | $1,789 | $601 | |||||||||||||||||||||
| Add: Notable items, net of income tax benefit | 16 | 24 | 39 | 59 | ||||||||||||||||||||||
| Net income, Underlying (non-GAAP) | J | $546 | $338 | $1,828 | $660 | |||||||||||||||||||||
| Net income available to common stockholders, Underlying: | ||||||||||||||||||||||||||
| Net income available to common stockholders (GAAP) | K | 504 | 289 | $1,708 | $526 | |||||||||||||||||||||
| Add: Notable items, net of income tax benefit | 16 | 24 | 39 | 59 | ||||||||||||||||||||||
| Net income available to common stockholders, Underlying (non-GAAP) | L | $520 | $313 | $1,747 | $585 | |||||||||||||||||||||
| Return on average common equity and return on average common equity, Underlying: | ||||||||||||||||||||||||||
| Average common equity (GAAP) | M | $21,326 | $20,534 | $20,926 | $20,401 | |||||||||||||||||||||
| Return on average common equity | K/M | 9.39 | % | 5.60 | % | 10.91 | % | 3.45 | % | |||||||||||||||||
| Return on average common equity, Underlying (non-GAAP) | L/M | 9.70 | 6.05 | 11.17 | 3.83 | |||||||||||||||||||||
Citizens Financial Group, Inc. | 47
| As of and for the Three Months Ended September 30, | As of and for the Nine Months Ended September 30, | |||||||||||||||||||||||||
| (in millions, except share, per share and ratio data) | Ref. | 2021 | 2020 | 2021 | 2020 | |||||||||||||||||||||
| Return on average tangible common equity and return on average tangible common equity, Underlying: | ||||||||||||||||||||||||||
| Average common equity (GAAP) | M | $21,326 | $20,534 | $20,926 | $20,401 | |||||||||||||||||||||
| Less: Average goodwill (GAAP) | 7,055 | 7,050 | 7,052 | 7,049 | ||||||||||||||||||||||
| Less: Average other intangibles (GAAP) | 52 | 62 | 54 | 65 | ||||||||||||||||||||||
| Add: Average deferred tax liabilities related to goodwill (GAAP) | 383 | 375 | 381 | 375 | ||||||||||||||||||||||
| Average tangible common equity | N | $14,602 | $13,797 | $14,201 | $13,662 | |||||||||||||||||||||
| Return on average tangible common equity | K/N | 13.71 | % | 8.33 | % | 16.08 | % | 5.15 | % | |||||||||||||||||
| Return on average tangible common equity, Underlying (non-GAAP) | L/N | 14.17 | 9.00 | 16.46 | 5.71 | |||||||||||||||||||||
| Return on average total assets and return on average total assets, Underlying: | ||||||||||||||||||||||||||
| Average total assets (GAAP) | O | $186,108 | $177,675 | $184,391 | $174,892 | |||||||||||||||||||||
| Return on average total assets | I/O | 1.13 | % | 0.70 | % | 1.30 | % | 0.46 | % | |||||||||||||||||
| Return on average total assets, Underlying (non-GAAP) | J/O | 1.16 | 0.76 | 1.33 | 0.50 | |||||||||||||||||||||
| Return on average total tangible assets and return on average total tangible assets, Underlying: | ||||||||||||||||||||||||||
| Average total assets (GAAP) | O | $186,108 | $177,675 | $184,391 | $174,892 | |||||||||||||||||||||
| Less: Average goodwill (GAAP) | 7,055 | 7,050 | 7,052 | 7,049 | ||||||||||||||||||||||
| Less: Average other intangibles (GAAP) | 52 | 62 | 54 | 65 | ||||||||||||||||||||||
| Add: Average deferred tax liabilities related to goodwill (GAAP) | 383 | 375 | 381 | 375 | ||||||||||||||||||||||
| Average tangible assets | P | $179,384 | $170,938 | $177,666 | $168,153 | |||||||||||||||||||||
| Return on average total tangible assets | I/P | 1.17 | % | 0.73 | % | 1.35 | % | 0.48 | % | |||||||||||||||||
| Return on average total tangible assets, Underlying (non-GAAP) | J/P | 1.21 | 0.79 | 1.38 | 0.52 | |||||||||||||||||||||
| Efficiency ratio and efficiency ratio, Underlying: | ||||||||||||||||||||||||||
| Efficiency ratio | C/A | 60.92 | % | 55.18 | % | 61.30 | % | 57.31 | % | |||||||||||||||||
| Efficiency ratio, Underlying (non-GAAP) | D/B | 59.55 | 53.44 | 60.21 | 55.72 | |||||||||||||||||||||
| Operating leverage and operating leverage, Underlying: | ||||||||||||||||||||||||||
| (Decrease) increase in total revenue | (7.33) | % | 9.29 | % | (5.20) | % | 7.07 | % | ||||||||||||||||||
| Increase in noninterest expense | 2.31 | 1.52 | 1.39 | 4.12 | ||||||||||||||||||||||
| Operating leverage | (9.64) | % | 7.77 | % | (6.59 | %) | 2.95 | % | ||||||||||||||||||
| (Decrease) increase in total revenue, Underlying (non-GAAP) | (7.33) | % | 9.29 | % | (5.20) | % | 7.07 | % | ||||||||||||||||||
| Increase in noninterest expense, Underlying (non-GAAP) | 3.26 | 0.32 | 2.45 | 2.32 | ||||||||||||||||||||||
| Operating leverage, Underlying (non-GAAP) | (10.59) | % | 8.97 | % | (7.65 | %) | 4.75 | % | ||||||||||||||||||
| Tangible book value per common share: | ||||||||||||||||||||||||||
| Common shares - at period end (GAAP) | Q | 426,199,576 | 427,073,084 | 426,199,576 | 427,073,084 | |||||||||||||||||||||
| Common stockholders' equity (GAAP) | $21,409 | $20,504 | $21,409 | $20,504 | ||||||||||||||||||||||
| Less: Goodwill (GAAP) | 7,065 | 7,050 | 7,065 | 7,050 | ||||||||||||||||||||||
| Less: Other intangible assets (GAAP) | 51 | 60 | 51 | 60 | ||||||||||||||||||||||
| Add: Deferred tax liabilities related to goodwill (GAAP) | 384 | 377 | 384 | 377 | ||||||||||||||||||||||
| Tangible common equity | R | $14,677 | $13,771 | $14,677 | $13,771 | |||||||||||||||||||||
| Tangible book value per common share | R/Q | $34.44 | $32.24 | $34.44 | $32.24 | |||||||||||||||||||||
| Net income per average common share - basic and diluted and net income per average common share - basic and diluted, Underlying: | ||||||||||||||||||||||||||
| Average common shares outstanding - basic (GAAP) | S | 426,086,717 | 426,846,096 | 425,996,867 | 427,058,412 | |||||||||||||||||||||
| Average common shares outstanding - diluted (GAAP) | T | 427,840,964 | 427,992,349 | 427,679,885 | 428,142,358 | |||||||||||||||||||||
| Net income per average common share - basic (GAAP) | K/S | $1.18 | $0.68 | $4.01 | $1.23 | |||||||||||||||||||||
| Net income per average common share - diluted (GAAP) | K/T | 1.18 | 0.68 | 3.99 | 1.23 | |||||||||||||||||||||
| Net income per average common share - basic, Underlying (non-GAAP) | L/S | 1.22 | 0.73 | 4.10 | 1.37 | |||||||||||||||||||||
| Net income per average common share - diluted, Underlying (non-GAAP) | L/T | 1.22 | 0.73 | 4.09 | 1.37 | |||||||||||||||||||||
| Dividend payout ratio and dividend payout ratio, Underlying: | ||||||||||||||||||||||||||
| Cash dividends declared and paid per common share | U | $0.39 | $0.39 | $1.17 | $1.17 | |||||||||||||||||||||
| Dividend payout ratio | U/(K/S) | 33 | % | 58 | % | 29 | % | 95 | % | |||||||||||||||||
| Dividend payout ratio, Underlying (non-GAAP) | U/(L/S) | 32 | 53 | 29 | 85 |
Citizens Financial Group, Inc. | 48
The following table presents computations of non-GAAP financial measures representing certain metrics excluding the impact of PPP loans used throughout the MD&A:
| Table 34: Reconciliations of Non-GAAP Measures - Excluding PPP | ||||||||||||||
| (in millions, except share, per share and ratio data) | Ref. | September 30, 2021 | December 31, 2020 | |||||||||||
| Allowance for credit losses to total loans and leases, excluding the impact of PPP loans: | ||||||||||||||
| Total loans and leases (GAAP) | A | $123,318 | $123,090 | |||||||||||
| Less: PPP loans | 1,903 | 4,155 | ||||||||||||
| Total loans and leases, excluding the impact of PPP loans (non-GAAP) | B | $121,415 | $118,935 | |||||||||||
| Allowance for credit losses (GAAP) | C | $2,004 | $2,670 | |||||||||||
| Allowance for credit losses to total loans and leases (GAAP) | C/A | 1.63 | % | 2.17 | % | |||||||||
| Allowance for credit losses to total loans and leases, excluding the impact of PPP loans (non-GAAP) | C/B | 1.65 | % | 2.24 | % | |||||||||
Citizens Financial Group, Inc. | 49
Previous: Cover and table of contents · Next: Item 1. FINANCIAL STATEMENTS