 filings.tools
Expeditors International of Washington (EXPD) 10-K risk factor changes: FY2018 vs FY2017
The 2018-12-31 10-K against the 2017-12-31 one, compared heading by heading and sentence by sentence. One of these filings carries no fiscal year tag, so its year is the calendar year of the period end.
Item 1A4 rewritten0 added0 removed51 unchanged
All filing items552 rewritten206 added231 removed1,570 unchanged
Summary
counted, not written
- Item 1A headings could not be compared: only 0 carried over between the two years, which usually means one filing was read wrongly, so none is reported as new or removed.
- Sentence by sentence, 206 added, 231 removed, 552 rewritten and 1,570 unchanged across 18 items that differ.
Sentences by item
22 items, with every count and a link to each item that changed
Underlined words on a shaded ground are new in FY2018; struck-through words were in FY2017. Sentences that are wholly new or wholly gone are labelled rather than marked.
Item 1A. RISK FACTORS
4 rewritten, 0 added, 0 removed, 51 unchanged
| | | • changes and uncertainties in governmental [removed: policies, such as taxation,] [added: policies and inter-governmental disputes, which could result in increased tariff rates,] quota restrictions, [removed: other forms of] trade barriers [removed: and/or restrictions] and [removed: trade accords;] [added: other types of restrictions;] |
| Service Providers | | As a non-asset based provider of global logistics services, Expeditors depends on a variety of asset-based service providers, including air, ocean and ground freight carriers. The quality and profitability of our services depend upon effective selection, management and discipline of service providers. In recent years, many of our service providers have incurred significant operating losses and are highly leveraged with debt. Additionally, several ocean carriers have consolidated, with the potential for more to occur in the future. Changes in the financial stability, operating capabilities and capacity of asset-based carriers and [removed: space] [added: capacity] allotment made available to Expeditors by asset-based carriers could affect us in unpredictable ways. Any combination of reduced carrier capacity, pricing volatility or more limited carrier transportation schedules could negatively impact our ability to maintain historical profitability. Expeditors' carriers are subject to increasingly stringent laws, which could directly or indirectly have a material adverse effect on our business. Future regulatory developments in the U.S. and abroad could adversely affect operations and increase operating costs in transportation industries, which in turn could increase our purchased transportation costs. If we are unable to pass such costs on to our customers, our business and results of operations could be materially adversely affected. |
| Regulatory Environment | | Expeditors is affected by ever increasing regulations from a number of sources in the United States and in foreign locations in which we operate. Many of these regulations are complex and require varying degrees of interpretation, including those related to trade compliance, data privacy, employment, compensation and competition, and may result in unforeseen costs. In reaction to the continuing global terrorist threat, governments around the world are continuously enacting or updating security regulations. These regulations are multi-layered, increasingly technical in nature and characterized by a lack of harmonization of substantive requirements among various governmental authorities. Furthermore, the implementation of these regulations, including deadlines and substantive requirements, can be driven by regulatory urgencies rather than industry's realistic ability to comply. Failure to consistently and timely comply with these regulations, or the failure, breach or compromise of our policies and procedures or those of our service providers or agents, may result in increased operating costs, damage to our reputation, [added: difficulty in attracting and retaining key personnel,] restrictions on operations or fines and penalties. |
| Predictability of Results | | Expeditors is not aware of any accurate means of forecasting short-term customer requirements. However, long-term customer satisfaction depends upon our ability to meet these unpredictable short-term customer requirements. Personnel costs, our single largest expense, are always less flexible in the very near term as we must staff to meet uncertain demand. As a result, short-term operating results could be disproportionately affected. A significant portion of Expeditors' revenues is derived from customers in retail and technology industries whose shipping patterns are tied closely to consumer demand and from customers in industries whose shipping patterns are dependent upon just-in-time production schedules. Therefore, the timing of our revenues are, to a large degree, impacted by factors out of our control, such as a sudden change in consumer demand for retail goods, [added: changes in trade tariffs,] product launches and/or manufacturing production delays. Additionally, many customers ship a significant portion of their goods at or near the end of a quarter, and therefore, we may not learn of a shortfall in revenues until late in a quarter. To the extent that a shortfall in revenues or earnings was not expected by securities analysts or investors, any such shortfall from levels predicted by securities analysts or investors could have an immediate and adverse effect on the trading price of our stock. Volatile market conditions can create situations where rate increases charged by carriers and other service providers are implemented with little or no advance notice. We often times cannot pass these rate increases on to our customers in the same time frame, if at all. As a result, our yields and margins can be negatively impacted, as recently experienced, particularly with ocean freight. |
Item 7. MANAGEMENT’S DISCUSSION AND ANALYSIS OF FINANCIAL CONDITION AND RESULTS OF OPERATIONS
119 rewritten, 52 added, 44 removed, 243 unchanged
Our services include air and ocean freight consolidation and forwarding, customs [removed: clearance,] [added: brokerage,] warehousing and distribution, purchase order management, vendor consolidation, time-definite transportation services, [added: temperature-controlled transit,] cargo insurance, specialized cargo monitoring and tracking, and other [removed: customized] logistics solutions.
[removed: We derive our revenues from] [added: Our] three principal [removed: sources:] [added: services are the revenue categories presented in our financial statements:] 1) airfreight services, 2) ocean freight and ocean services, and 3) customs brokerage and other services.
We generate the major portion of our air and ocean freight revenues by purchasing transportation services on a wholesale basis from direct (asset-based) carriers and [added: then] reselling those services to our customers on a retail basis.
[removed: Such] [added: When revenue is recorded on a net basis, the] amounts earned are determined using a fixed fee, a per unit of activity fee or a combination thereof.
Customs brokerage and other services [removed: involves] [added: involve] providing services at destination, such as helping customers clear shipments through customs by preparing and filing required documentation, calculating and providing for payment of duties and other taxes on behalf of customers as well as arranging for any required inspections by governmental agencies, and arranging for delivery.
Each area is divided into [removed: sub-regions, which] [added: sub-regions that] are composed of operating units with individual profit and loss responsibility.
Our business involves shipments between operating units and [removed: often] [added: typically] touches more than one geographic area.
The following chart shows net revenues by geographic areas of responsibility for the years ended December 31, [removed: 2017, 2016] [added: 2018, 2017] and [removed: 2015:][added: 2016:]
[removed: 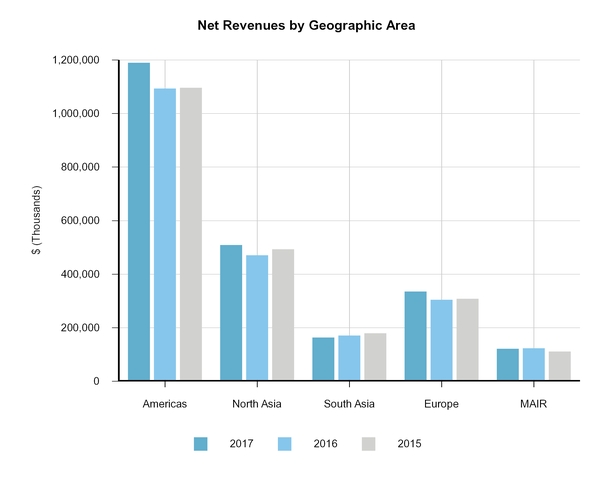][added: 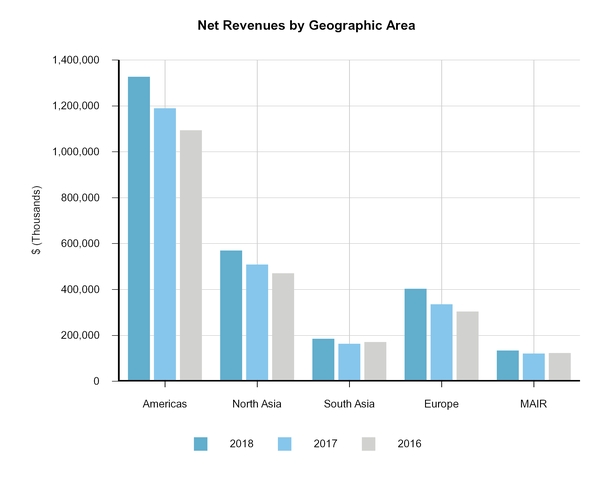]
Our strategy closely links compensation with operating unit [removed: profitability.][added: profitability, which includes shared revenues and allocated costs.]
[removed: Individual] [added: Therefore, individual] success is closely linked to cooperation with other operating units within our network.
[removed: E] [added: In accordance with our revenue recognition policy (see Note 1.E] to the consolidated financial statements [removed: of] [added: in] this report), almost all freight revenues and related expenses are recorded at origin and shipment profits are split between origin and destination offices by recording a commission fee or profit share revenue at [removed: destination and a corresponding commission or profit share expense as a component of origin consolidation costs.][added: the destination.]
North Asia is our largest export oriented region and accounted for [removed: 37%] [added: 35%] of revenues, 22% of net revenues and 35% of operating income for the year ended December 31, [removed: 2017.][added: 2018.]
From the inception of our company, management has believed that the elements required for a successful global [removed: service] [added: services] organization can only be assured through recruiting, training, and ultimately retaining superior personnel.
There is no limit to how much a [removed: key, non-executive] [added: key] manager can be compensated for success.
Many carriers are highly leveraged with debt and certain carriers are facing significant liquidity [removed: challenges, such as those that led to the bankruptcy filing of a major carrier that occurred in August 2016.][added: challenges.]
Further changes in the financial stability, operating capabilities and capacity of asset-based carriers, [removed: space] [added: capacity] allotments available from carriers, governmental regulations, and/or trade accords could adversely affect our business in unpredictable ways.
Periodically, governments consider a variety of changes to [removed: current] tariffs and trade restrictions and accords.
We cannot predict [removed: which, if any,] [added: the outcome] of these proposals [removed: may be adopted,] or [added: negotiations, or] the effects [removed: the adoption of any such proposal] [added: they] will have on our business.
In addition to being influenced by governmental policies [added: and inter-governmental disputes] concerning international trade, our business may also be negatively affected by political developments and changes in government personnel or policies in the United States and other countries, as well as economic turbulence, political unrest and security concerns in the nations in which we conduct business and the future impact that these events may have on international trade and oil prices.
These financial challenges have resulted in [removed: the 2016 bankruptcy of a major carrier, as well as] multiple carrier acquisitions and carrier alliance formations.
The global economic environment and trade growth [removed: have improved but] remain uncertain.
We cannot predict the impact of future changes in global trade on our operating results, freight volumes, pricing, changes in consumer demand, carrier stability and capacity, customers’ abilities [added: to pay or on changes in competitors' behavior.]
As discussed in Note 1.F to the consolidated financial statements, [removed: the] earnings of [removed: our] [added: the Company's] foreign subsidiaries are not considered to be indefinitely reinvested outside of the [removed: U.S. and, accordingly, U.S. Federal and State income taxes have historically been provided for all undistributed earnings net of related foreign tax credits of our foreign subsidiaries.][added: United States.]
Our estimate of any ultimate tax liability contains assumptions based on past experiences, judgments about potential actions by taxing jurisdictions as well as judgments about the likely outcome of issues that have been raised by the [removed: taxing jurisdiction.]
The 2017 Tax Act, which is also commonly referred to as “U.S. tax reform,” significantly [removed: changes] [added: changed] U.S. corporate income tax laws by, among other things, reducing the U.S. corporate income tax rate to 21% starting in 2018 and creating a territorial tax system with a one-time mandatory tax on previously undistributed foreign earnings of non-U.S. subsidiaries.
[removed: The ultimate impact on our] [added: Our] effective tax rate will largely depend on the mix of pretax earnings that we generate in the U.S. as compared to the rest of the [removed: world.][added: world and the impact of any discrete items for events occurring in the period or future changes in tax regulations and related interpretations.]
The following table shows the [added: revenues and directly related expenses for our principal services and] total net revenues (a non-GAAP measure calculated as revenues less directly related operating expenses attributable to our principal services) and our expenses for [added: 2018,] 2017, [removed: 2016,] and [removed: 2015] [added: 2016] expressed as percentages of net revenues.
| | | [removed: 2017] [added: 2018] | | | | | | | [removed: 2016] [added: 2017] | | | | | | | [removed: 2015] [added: 2016] | | | | | | |
| Revenues | | $ | [removed: 2,877,032] [added: 3,271,932] | | | | | | $ | [removed: 2,453,347] [added: 2,877,032] | | | | | | $ | [removed: 2,740,583] [added: 2,453,347] | | | | | |
| Expenses | | [removed: 2,126,761] [added: 2,410,793] | | | | | | | [removed: 1,752,167] [added: 2,126,761] | | | | | | | [removed: 1,987,690] [added: 1,752,167] | | | | | | |
| Net revenues | | [removed: 750,271] [added: 861,139] | | | | [removed: 32] [added: 33] | % | | [removed: 701,180] [added: 750,271] | | | | 32 | % | | [removed: 752,893] [added: 701,180] | | | | [removed: 34] [added: 32] | % | |
| Revenues | | [removed: 2,107,045] [added: 2,251,754] | | | | | | | [removed: 1,917,494] [added: 2,107,045] | | | | | | | [removed: 2,194,004] [added: 1,917,494] | | | | | | |
| Expenses | | [removed: 1,543,740] [added: 1,664,168] | | | | | | | [removed: 1,378,699] [added: 1,543,740] | | | | | | | [removed: 1,648,993] [added: 1,378,699] | | | | | | |
| Net revenues | | [removed: 563,305] [added: 587,586] | | | | [removed: 24] [added: 22] | | | [removed: 538,795] [added: 563,305] | | | | [removed: 25] [added: 24] | | | [removed: 545,011] [added: 538,795] | | | | 25 | | |
| Revenues | | [removed: 1,936,871] [added: 2,614,679] | | | | | | | [removed: 1,727,196] [added: 1,936,871] | | | | | | | [removed: 1,682,045] [added: 1,727,196] | | | | | | |
| Expenses | | [removed: 931,258] [added: 1,443,031] | | | | | | | [removed: 803,135] [added: 931,258] | | | | | | | [removed: 792,172] [added: 803,135] | | | | | | |
| Net revenues | | [removed: 1,005,613] [added: 1,171,648] | | | | [removed: 44] [added: 45] | | | [removed: 924,061] [added: 1,005,613] | | | | [removed: 43] [added: 44] | | | [removed: 889,873] [added: 924,061] | | | | [removed: 41] [added: 43] | | |
| Total net revenues | | [removed: 2,319,189] [added: 2,620,373] | | | | 100 | | | [removed: 2,164,036] [added: 2,319,189] | | | | 100 | | | [removed: 2,187,777] [added: 2,164,036] | | | | 100 | | |
| Salaries and related costs | | [removed: 1,267,120] [added: 1,393,259] | | | | [removed: 55] [added: 53] | | | [removed: 1,157,635] [added: 1,267,120] | | | | [removed: 53] [added: 55] | | | [removed: 1,143,511] [added: 1,157,635] | | | | [removed: 52] [added: 53] | | |
We derive our revenues by entering into agreements that are generally comprised of a single performance obligation, which is that freight is shipped for and received by our customer.
Each performance obligation is comprised of one or more of the Company's services.
We typically satisfy our performance obligations as services are rendered over time.
A typical shipment would include services rendered at origin, such as pick-up and delivery to port, freight services from origin to destination port and destination services, such as customs clearance and final delivery.
Generally, revenue is recorded on a gross basis when we are primarily responsible for fulfilling the promise to provide the services, when we assume risk of loss, when we have discretion in setting the prices for the services to the customers, and we have the ability to direct the use of the services provided by the third party.
Our business growth strategy emphasizes a focus on the right markets and, within each market, on the right customers that lead to profitable business growth.
Expeditors' teams are aligned on the specific markets; on the targeted accounts within those markets; and on ways that we can continue to differentiate ourselves from our competitors.
Currently, the United States and China have significantly increased tariffs on certain imports and are engaged in trade negotiations.
The United Kingdom and the European Union are negotiating the terms of the United Kingdom's exit from the European Union.
As governments implement higher tariffs on imports, manufacturers may accelerate, to the extent possible, shipments to avoid higher tariffs and, over time, may shift manufacturing to other countries.
Carriers also face new regulatory requirements that become effective in 2020 requiring reductions in the use of marine fuel sulfur, which is expected to increase their operating and capital costs.
Currently, there is uncertainty as to how changes in oil prices will continue to impact future buy rates.
Because fuel is an integral part of carriers' costs and impacts both our cargo space buy rates and our sell rates to customers, we would expect our gross revenues and costs to be impacted as carriers adjust rates for the effect of changing fuel prices.
To the extent that we are unable to pass through any increases to our customers, this could adversely affect our net revenues.
Accordingly, prior to the implementation of the requirements of U.S. tax reform under the Tax Cuts and Jobs Act (2017 Tax Act) in December of 2017, U.S. Federal and State income taxes were provided for all undistributed earnings net of related foreign tax credits.
See Note 5 to the consolidated financial statements for impacts associated with U.S. tax reform under the 2017 Tax Act.
taxing jurisdiction.
2018 compared with 2017
Airfreight services revenues increased 14% in 2018, as compared with 2017, primarily due to higher sell rates in response to increased buy rates resulting from higher overall market demand and tonnage growth of 3%.
Airfreight services expenses increased 13% in 2018, as compared with 2017, principally as a result of the increase in tonnage and higher buy rates due to tighter carrier capacity and increased fuel prices.
Average net revenue per kilo increased in most regions primarily due to higher average sell rates that increased commensurate with higher average buy rates.
North Asia net revenues increased by 17% despite a tonnage decrease of 2%, as we adjusted our sell rates, primarily in response to higher carrier buy rates, and achieved a better mix of business.
In 2017, carriers significantly increased pricing in North Asia and South Asia as a result of higher demand relative to available capacity.
Ocean freight and ocean services revenues and expenses increased 7% and 8%, respectively, in 2018, as compared with 2017, primarily due to a 5% increase in container volume and growth in direct ocean forwarding and order management.
North America ocean freight and ocean services net revenues increased 4% in 2018, as compared with 2017, primarily due to higher order management volumes.
Europe net revenues increased 8% in 2018 as compared with 2017, primarily due to growth in direct ocean freight forwarding.
North Asia net revenues increased 3% in 2018, as compared with 2017, as growth in direct ocean forwarding and order management was largely offset by lower net revenue per container.
MAIR net revenues increased 8% in 2018, as compared with 2017, primarily due to higher direct ocean forwarding revenues.
Customs brokerage and other services expenses increased 55% in 2018, as compared with 2017, principally as a result of higher volumes.
In conjunction with the adoption of the new revenue recognition standard, we analyzed contracts with customers in our warehouse and distribution business.
In 2018, we changed our presentation of certain warehouse and distribution revenues from a net to a gross basis, which increased both revenues and operating expenses by approximately $225 million in 2018.
Europe net revenues increased 28%, primarily due to higher customs brokerage, road freight and distributions services net revenues.
The number of employees increased primarily to support increased activity in our business operations.
Bonuses to field and executive management in 2018 were up 12% while operating income increased 14%.
In 2017, we recovered certain legal and related costs totaling $8 million, had a favorable resolution of an indirect tax contingency of $6 million and recognized a $4 million gain on the sale of a property.
Other overhead expenses as a percentage of net revenues for 2018 increased from 15% to 17% as compared with 2017 principally as a result of the events in 2017 discussed above.
Our consolidated effective income tax rate was 24.3% in 2018, as compared with 31.8% in 2017.
In addition to the lower US federal tax rate that resulted from the 2017 Tax Act, our effective tax rate in 2018 benefited from significant share-based compensation deductions, US Federal tax credits totaling $20.3 million, principally as a result of withholding taxes related to our foreign operations, and US income tax deductions for Foreign-derived intangible income (FDII) of $4.8 million.
These amounts were partially offset by the effect of higher foreign tax rates of our international subsidiaries, when compared to the US Federal income tax rate of 21%, as well as certain expenses that are no longer deductible under the 2017 Tax Act, including certain executive compensation in excess of amounts allowed.
Our management compensation programs have always been incentive-based and performance driven.
These are the revenue categories presented in our financial statements.
Generally, revenue is recorded on a gross basis when we are the primary obligor, are obligated to compensate direct carriers for services performed regardless of whether customers accept the service, have latitude in establishing price, have discretion in selecting the direct carrier, have credit risk or have several but not all of these indicators.
Revenue is generally recorded on a net basis where we are not primarily obligated and do not have latitude in establishing prices.
In accordance with our revenue recognition policy (see Note 1.
to pay or on changes in competitors' behavior.
As discussed in further detail in Note 5 to the consolidated financial statements, on December 22, 2017 the U.S. enacted the Tax Cuts and Jobs Act (the 2017 Tax Act).
Prospectively, excluding the impact of any discrete items, the provisions of the 2017 Tax Act are expected to reduce our effective tax rate compared to what the rate would have otherwise been in the absence of U.S. tax reform.
Historically, we have experienced lower airfreight margins in the fourth quarter as seasonal volumes increase and carriers correspondingly increase buy rates.
We will continue to make important investments in people,
For example our effective foreign tax rate increased from 30.9% in 2016 to 33.9% in 2017, principally due to withholding tax payments associated with dividend payments from our non-U.S. subsidiaries.
Prospectively, excluding the impact of discrete items recorded in a future reporting period and any changes recorded in 2018 to provisional 2017 income tax expense amounts as discussed in Note 5 to the consolidated financial statements, the provisions of the 2017 Tax Act are expected to reduce our annual effective tax rate to an estimated rate between 31% and 34%.
The ultimate impact on our effective tax rate will largely depend on the mix of pretax earnings that we generate in the U.S. as compared to the rest of the world and the other factors discussed above.
2016 compared with 2015
Airfreight services revenues decreased 10% in 2016, as compared with 2015, primarily as a result of lowering average sell rates in response to competitive market conditions.
The decrease in average sell rates was partially offset by a 3% growth in airfreight tonnage.
Airfreight services expenses decreased 12% in 2016 as compared with 2015, as a result of favorable buying opportunities throughout most regions due primarily to excess available carrier capacity.
While not possible to quantify, sell rates and tonnage were favorably impacted in 2015 by customers converting a portion of their ocean freight shipments to airfreight due to port disruptions on the U.S. West Coast.
Average net revenue per kilo declined in most regions primarily due to competitive market conditions and rapid changes in carrier pricing caused by sporadic increases in demand.
North America net revenues decreased by 6% due principally to a 3% decrease in tonnage.
Ocean freight and ocean services revenues decreased 13% in 2016, as compared with 2015, as we continued to lower average sell rates to customers in response to competitive market conditions and lower available buy rates from carriers.
Although average sell rates to customers declined, container volumes increased 3%.
Ocean freight and ocean services expenses decreased 16% in 2016 as compared with 2015, due to lower average buy rates, resulting from carrier overcapacity.
During the latter part of the third quarter of 2016, we experienced a spike in average buy rates that began with the bankruptcy of a large ocean carrier on August 31, 2016.
North America ocean freight and ocean services net revenues decreased 3% in 2016, as compared with 2015, primarily due to lower direct ocean forwarding volumes and a decrease in ocean freight consolidation resulting from declining margins on imports.
North Asia net revenues decreased 1% as lower margins were offset by a 1% growth in volume.
Europe net revenues decreased 4%, as lower direct ocean forwarding volumes more than offset growth from order management and ocean freight consolidation.
Customers continued to seek out customs brokers with sophisticated computerized capabilities critical to an overall logistics management program, including rapid responses to changes in the regulatory and security environment.
North Asia net revenues increased 8% due primarily to growth in import and warehouse and distribution services.
Europe net revenues remained constant, as compared with 2015.
Bonuses to field and executive management in 2016 were down 7% as compared with 2015, primarily as a result of a 7% decrease in operating income.
Other overhead expenses increased to 16% of net revenues in 2016, as compared with 15% in 2015.
Our consolidated effective income tax rate declined slightly to 37.0% in 2016, as compared to 37.6% in 2015.
The decrease in the effective tax rate was principally the result of a higher proportion of our total outstanding stock-based compensation expense being for non-qualified stock option grants.
This $40 million decrease is primarily due to increases in accounts receivable, partially offset by higher earnings.
In 2016, we completed a land acquisition, for which the funds had been deposited into escrow in 2014 and initiated building construction for the aforementioned building in Europe.
| Standby letters of credit and guarantees | | $ | 75,311 | | | 66,929 | | | 6,484 | | | 88 | | | 1,810 | |
| Operating leases | | $ | 259,895 | | | 72,148 | | | 103,242 | | | 49,949 | | | 34,556 | |
| Total contractual cash obligations | | $ | 334,486 | | | 138,799 | | | 111,182 | | | 49,949 | | | 34,556 | |
Historically, we have met these obligations in the normal course of business.
Management believes, in line with historical experience, almost all committed purchase obligations outstanding as of December 31, 2017 will be fulfilled during 2018 in the ordinary course of business.
An excerpt. Shown here: 40 of 119 rewritten, 40 of 52 added and 40 of 44 removed. The counts are complete. For every sentence, read Item 7. MANAGEMENT’S DISCUSSION AND ANALYSIS OF FINANCIAL CONDITION AND RESULTS OF OPERATIONS in the FY2018 filing and the FY2017 filing.
Item 7A. QUANTITATIVE AND QUALITATIVE DISCLOSURES ABOUT MARKET RISK
11 rewritten, 1 added, 0 removed, 16 unchanged
All other things being equal, an average 10% weakening of the U.S. dollar, throughout the year ended December 31, [removed: 2017,] [added: 2018,] would have had the effect of raising operating income approximately [removed: $48] [added: $55] million.
An average 10% strengthening of the U.S. dollar, for the same period, would have the effect of reducing operating income approximately [removed: $39] [added: $45] million.
This analysis does not take into account changes in shipping patterns based upon this hypothetical currency [removed: fluctuation.]
Any such hedging activity throughout the year ended December 31, [removed: 2017,] [added: 2018,] was insignificant.
Net foreign currency losses were approximately [added: $2 million and] $13 million in [added: 2018 and] 2017, [added: respectively,] and net currency gains were approximately $8 million in [removed: both 2016 and 2015.][added: 2016.]
We had no foreign currency derivatives outstanding at December 31, [removed: 2017] [added: 2018] and [removed: 2016.][added: 2017.]
As of December 31, [removed: 2017,] [added: 2018,] we had [removed: $17] [added: $42] million of net unsettled intercompany transactions.
At December 31, [removed: 2017,] [added: 2018,] we had cash and cash equivalents of [removed: $1,051] [added: $924] million, of which [removed: $668] [added: $496] million was invested at various short-term market interest rates.
We had no long-term debt at December 31, [removed: 2017.][added: 2018.]
A hypothetical change in the interest rate of 10 basis points at December 31, [removed: 2017] [added: 2018] would not have a significant impact on our earnings.
In management’s opinion, there has been no material change in our interest rate risk exposure between [removed: 2017] [added: 2018] and [removed: 2016.][added: 2017.]
fluctuation.
Item 1. BUSINESS
73 rewritten, 4 added, 12 removed, 268 unchanged
Whether acting as a consolidator or agent, we offer our customers [removed: routing expertise,] [added: expertise for optimum routing,] familiarity with local business practices, knowledge of export and import documentation and procedures, the ability to arrange for ancillary [removed: services] [added: services,] and assistance with [removed: space availability in] [added: securing capacity during] periods of high demand.
Air Freight Consolidation: as an airfreight consolidator, Expeditors purchases cargo [removed: space] [added: capacity] from airlines on a volume basis and resells that space to our customers at lower rates than what those customers could negotiate directly from the airlines on an individual shipment.
Expeditors determines the routing, consolidates shipments bound for a particular airport distribution point, and then selects the airline for transportation to the distribution point, where either we or one of our agents then [removed: arrange] [added: arranges] for the consolidated lot to be broken down into its component shipments and for the transportation of each individual shipment to its final destination.
Ocean Freight and Ocean Services: Within ocean [removed: freight] services, Expeditors offers three basic services: ocean freight consolidation, direct ocean forwarding, and order management:
We handle both full container loads as well as Less-than Container Load (LCL) freight, [removed: charging] [added: offering] lower rates than what is available directly from the shipping lines.
We also generate fees for ancillary services such as shipping and customs documentation, packing, crating, insurance services, negotiation of letters of credit, and the preparation of documentation to comply with local export [added: and import] laws.
[removed: Customs] [added: Our customs] reporting, discrepancy management and other visibility tools help our customers manage their compliance responsibilities globally.
Transcon: [removed: Expeditors] [added: Expeditors'] Transcon consists of intra-continental ground transportation and delivery services and may be bundled together with domestic air.
The following charts show our [removed: 2017] [added: 2018] revenues and net revenues (a non-GAAP measure calculated as revenues less directly related operating expenses*) by service type:
[removed: 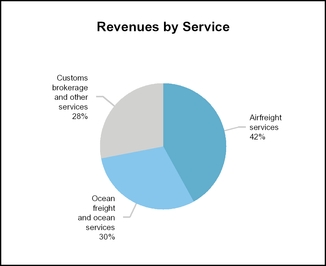 ][added: 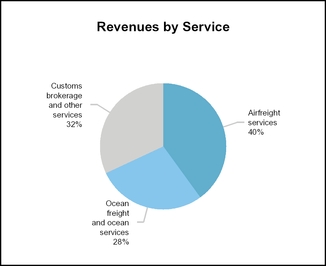 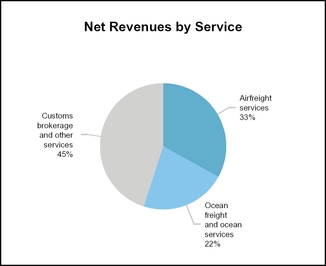]
Today Expeditors has approximately [removed: 16,500] [added: 17,500] employees and provides a complete range of global logistics services to a diversified group of customers, both in terms of industry specialization and geographic location.
At January 31, [removed: 2018,] [added: 2019,] Expeditors, including its majority-owned subsidiaries, is organized functionally in geographic operating segments and operates district offices in the regions identified below.
Expeditors operates [removed: 177] [added: 176] district offices in the following geographic areas of responsibility:
| • | South Asia [removed: (17)] [added: (16)] |
Additionally, we contract with independent agents to provide required services and have established [removed: 39] [added: 38] such relationships worldwide.
In [removed: 2017,] [added: 2018,] Expeditors continued executing key strategic initiatives that are focused and aligned to achieve long-term earnings growth.
[removed: We] [added: As we continue to expand our business in North America, we] remain focused on growth based on [removed: four] [added: three] key strategic initiatives:
| 1. | Ensure that every operating unit's base-line growth strategies for air, ocean and customs services grow at the rate of each unit's (i.e. district or region) relevant market growth [removed: rate, and Expeditors' Transcon and Distribution services are expected to maintain higher growth rates.] [added: rate.] |
[removed: While Mr. Coughlin's team is responsible for] [added: Our Chief Strategy Officer continues to oversee] all [removed: strategy development, the team's] [added: Strategy within Expeditors, with a deep] focus [removed: is] on exploring new avenues for innovation, differentiation and expansion.
Expeditors also believes that having a single, uniform, globally-connected [removed: platform,] [added: platform] driving logistics [removed: operations,] [added: operations] and providing comprehensive visibility and advanced analytics [removed: create] [added: creates] greater efficiency and value, particularly as the value of timely data and insights into that data are increasingly important.
When we have made acquisitions, it has generally been to obtain technology, geographic coverage [removed: and] [added: or] specialized industry expertise that could be leveraged to benefit our entire network.
Tailored Solutions [removed: and Targeted Marketing]
As a non-asset based [added: logistics services] provider, we have considerable flexibility to tailor customer-specific solutions based on a customer’s [added: unique] needs.
By understanding a customer's logistics [removed: processes] and [removed: goals,] [added: supply chain processes, strategies, and objectives,] we [removed: are able to] identify [removed: opportunities] [added: targeted areas of opportunity] for improvement, and [removed: are able to] deploy [removed: relevant] [added: the right] services and solutions for that customer.
[removed: Expeditors' core] [added: These] services [removed: are further supported by] [added: include] our [added: core offerings of transportation, customs clearance, warehousing and distribution, and order management, along with] expertise in [removed: providing industry-specific solutions,] supply chain analysis and optimization, [added: trade compliance consulting,] cargo insurance, cargo security, and solutions for oversized and [removed: heavy lift] [added: heavy-lift] freight.
We offer these services across the globe on a single technology platform, in conjunction with consistent and efficient [removed: operations and] [added: operational] processes that adhere to the highest standards of compliance.
Because Expeditors is in the business of optimizing customer logistics and supply chains, we focus our [removed: marketing strategy] [added: sales strategies] and efforts on professionals in logistics and supply chain management roles.
While we drive our [removed: strategic marketing] [added: sales strategies] at a global level, district management of each office is responsible for its own business development, operations, and service execution.
We [removed: staff] [added: leverage regional and local expertise by staffing] our districts principally with managers and other key personnel who are citizens of the nations in which they operate and who have extensive experience in [removed: global logistics.][added: logistics, coupled with a deep understanding of their local market.]
District [removed: managers and their staff] [added: offices] are responsible for selling [added: and executing] Expeditors' services directly to customers and prospects [removed: who may select or influence] [added: and are involved in] the selection of logistics service [removed: providers and for] [added: providers, in addition to] ensuring that customers receive timely and efficient services.
In order to meet customers' complex and industry specific demands, we utilize industry vertical teams throughout our network to focus on providing [added: tailored] solutions [removed: in] [added: to] different industries.
No single customer accounts for five percent or more of our [added: revenues or] net revenues.
Airfreight services accounted for approximately [removed: 42, 40] [added: 40, 42] and [removed: 41] [added: 40] percent of Expeditors' total revenues and [removed: 32,] [added: 33,] 32 and [removed: 34] [added: 32] percent of total net revenues in [removed: 2017, 2016] [added: 2018, 2017] and [removed: 2015,] [added: 2016,] respectively.
When acting as a freight consolidator, we purchase cargo [removed: space] [added: capacity] from airlines on a volume basis and resell that space to our customers at lower rates than they could obtain directly from airlines on an individual shipment.
Whether acting as a consolidator or agent, we offer our customers [removed: expertise for optimum routing,] [added: routing expertise,] familiarity with local business practices, knowledge of export and import documentation and procedures, the ability to arrange for ancillary [removed: services,] [added: services] and [removed: assistance] [added: to assist] with [removed: space availability in] [added: securing capacity during] periods of high demand.
During periods of high demand, [removed: cargo space] available [added: cargo capacity] from the scheduled air carriers can be limited and backlogs of freight shipments may occur.
Expeditors' management believes that owning aircraft would subject us to undue business risks, including large capital outlays, increased fixed operating expenses, [added: exposure to] volatile fuel prices, problems of fully utilizing aircraft and competition with our service providers - the airlines.
[removed: Many] [added: Most] of Expeditors' customers are focused on improving supply-chain efficiency, reducing overall logistics costs by negotiating lower rates and utilizing ocean freight whenever possible.
Ocean freight services accounted for approximately [removed: 30, 32] [added: 28, 30] and [removed: 33] [added: 32] percent of Expeditors' total revenues and [removed: 24, 25] [added: 22, 24] and 25 percent of total net revenues in [removed: 2017, 2016] [added: 2018, 2017] and [removed: 2015,] [added: 2016,] respectively.
Revenues from fees charged to customers for ancillary services that EIO may provide include the preparation of shipping and customs documentation, packing, crating, insurance services, negotiation of letters of credit, and the preparation of documentation to comply with local export [added: and import] laws.
At Expeditors, we create strategy, process, technology and compliance programs at the corporate level, to drive consistency across all levels of the organization.
Defining our strategy at a global level and executing it at a regional and local level with customized supply chain solutions enables us to drive consistency and efficiency.
We believe that focus on hiring and developing talented individuals with an emphasis on exceptional customer service, along with our incentive-based compensation program, enables us to provide exceptional service and superior financial results.
These reports are also available on the SEC's website at https://www.sec.gov.
| | |
| --- | --- |
| 4. | Expand market share growth and position in North America, traditionally Expeditors’ most strategic market. |
In addition, in early 2017 we announced the appointment of Philip M.
Coughlin to the newly created position of Chief Strategy Officer, reporting directly to President and Chief Executive Officer, Jeff Musser.
Mr. Coughlin's role is to develop and oversee a core Strategy Group within Expeditors, comprised of current employees with a deep understanding of our products, services and technology, and external individuals with expertise in supply chain management, data and market analysis, and technology.
These services include all modes of cargo transportation, customs brokerage, warehousing and distribution, and order management.
Expeditors defines strategy, processes, technology and compliance at the corporate level, with input from our regional and district leadership.
That is further supported and executed at all levels with dedicated account management personnel, coupled with regional and local expertise.
We believe that this regional and local expertise in supply chain solutions, tailored to the needs of our customers, and our emphasis on exceptional customer service, along with our incentive-based compensation program that rewards employees based on the performance of the operations they control, have been important elements of our success.
We believe this balanced approach between corporate, regional, and local expertise enables us to provide solutions customized to the needs of our customers.
space utilization and minimize cost.
An excerpt. Shown here: 40 of 73 rewritten, all 4 added and all 12 removed. The counts are complete. For every sentence, read Item 1. BUSINESS in the FY2018 filing and the FY2017 filing.
Item 3. LEGAL PROCEEDINGS
1 rewritten, 0 added, 0 removed, 3 unchanged
As of December 31, [removed: 2017,] [added: 2018,] the amounts accrued for these claims, lawsuits, government investigations and other legal matters are not significant to our operations, cash flows or financial position.
Cover and table of contents
27 rewritten, 3 added, 2 removed, 74 unchanged
For the fiscal year ended December 31, [removed: 2017][added: 2018]
Indicate by check mark whether the registrant has submitted [removed: electronically and posted on its corporate Web site,] [added: electronically,] if any, every Interactive Data File required to be submitted [removed: and posted] pursuant to Rule 405 of Regulation S-T (§232.405 of this chapter) during the preceding 12 months (or for such shorter period that the registrant was required to submit and post such files).
| Non-accelerated filer | o | [removed: (Do not check if a smaller reporting company)] | | Smaller reporting company | o |
The aggregate market value of the registrant’s Common Stock held by non-affiliates of the registrant, based upon the closing price as of the last business day of the most recently completed second fiscal quarter ended June 30, [removed: 2017,] [added: 2018,] was approximately [removed: $10,086,694,774.][added: $12,614,798,720.]
At February [removed: 20, 2018,] [added: 19, 2019,] the number of shares outstanding of registrant’s Common Stock was [removed: 176,541,563.][added: 171,669,558.]
Portions of the definitive proxy statement for the Registrant’s [removed: 2018] [added: 2019] Annual Meeting of Shareholders to be held on May [removed: 8, 2018] [added: 7, 2019] are incorporated by reference into Part III of this Form 10-K.
| | Item 1 | [removed: [Business](#s2EDEC28A57AB5A15AC85A935A1B064E3)] [added: [Business](#s48E3C41FC22A5DC2BAB3CD2001E6E839)] | [removed: [2](#s2EDEC28A57AB5A15AC85A935A1B064E3)] [added: [2](#s48E3C41FC22A5DC2BAB3CD2001E6E839)] |
| | Item 1A | [Risk [removed: Factors](#sD35CDCCFB5A455669937364AF0AD5E78)] [added: Factors](#sB388A4C6300A5D09B7EAEF9E2C62877E)] | [removed: [11](#sD35CDCCFB5A455669937364AF0AD5E78)] [added: [11](#sB388A4C6300A5D09B7EAEF9E2C62877E)] |
| | Item 1B | [Unresolved Staff [removed: Comments](#s8B456326B1E2564D8C582657DCA598CF)] [added: Comments](#sD22AFB60E3165713A50E6D5CE7ED31BB)] | [removed: [14](#s8B456326B1E2564D8C582657DCA598CF)] [added: [14](#sD22AFB60E3165713A50E6D5CE7ED31BB)] |
| | Item 2 | [removed: [Properties](#s7AB3DE677BD154FD99011CEFC578D6CD)] [added: [Properties](#s964743EF0C155540B23CE849B3AB08F7)] | [removed: [14](#s7AB3DE677BD154FD99011CEFC578D6CD)] [added: [14](#s964743EF0C155540B23CE849B3AB08F7)] |
| | Item 3 | [Legal [removed: Proceedings](#s475CCE793AAF562E95A6B5E60B5A4D4E)] [added: Proceedings](#s1FFC41BE49415C14B837E676B86FF724)] | [removed: [15](#s475CCE793AAF562E95A6B5E60B5A4D4E)] [added: [15](#s1FFC41BE49415C14B837E676B86FF724)] |
| | Item 4 | [Mine Safety [removed: Disclosures](#s5EC67B4EB82E54EF8EA217D101A63357)] [added: Disclosures](#sA06A1CE928E15F2E800D217D58365497)] | [removed: [15](#s5EC67B4EB82E54EF8EA217D101A63357)] [added: [15](#sA06A1CE928E15F2E800D217D58365497)] |
| | Item 5 | [Market for Registrant's Common Equity, Related Stockholder Matters and Issuer Purchases of Equity [removed: Securities](#s97B039D1CCC858FAA3025351C31343D0)] [added: Securities](#sDD5E2002475F5E9292D06B49156D46F0)] | [removed: [15](#s97B039D1CCC858FAA3025351C31343D0)] [added: [15](#sDD5E2002475F5E9292D06B49156D46F0)] |
| | Item 6 | [Selected Financial [removed: Data](#s26C7061C0C195889956A3FB459CF8092)] [added: Data](#sC04CD7C3F9E05370B318601FBC093996)] | [removed: [17](#s26C7061C0C195889956A3FB459CF8092)] [added: [17](#sC04CD7C3F9E05370B318601FBC093996)] |
| | Item 7 | [Management's Discussion and Analysis of Financial Condition and Results of [removed: Operations](#s64F93A51CB4E5B9C9B721B24D6AC43BD)] [added: Operations](#sA7CC619A719152CA91ED59CB3841EE93)] | [removed: [18](#s64F93A51CB4E5B9C9B721B24D6AC43BD)] [added: [18](#sA7CC619A719152CA91ED59CB3841EE93)] |
| | Item 7A | [Quantitative and Qualitative Disclosures about Market [removed: Risk](#sE875FBCEBC495CD680B478662339B6B0)] [added: Risk](#sA3BA05F24AC85DCCB5606093B8B9A7AF)] | [removed: [28](#sE875FBCEBC495CD680B478662339B6B0)] [added: [28](#sA3BA05F24AC85DCCB5606093B8B9A7AF)] |
| | Item 8 | [Financial Statements and Supplementary [removed: Data](#s6C7BAE49EE31537AABF2448CC17CB39F)] [added: Data](#s4B01E9BA09E3579A8497C9AD8D8198C7)] | [removed: [29](#s6C7BAE49EE31537AABF2448CC17CB39F)] [added: [29](#s4B01E9BA09E3579A8497C9AD8D8198C7)] |
| | Item 9 | [Changes in and Disagreements with Accountants on Accounting and Financial [removed: Disclosure](#sCB176DA16F6656EE85225E84D33ABF92)] [added: Disclosure](#s912BB9664F1258F3AAD4983A4D01D9C6)] | [removed: [29](#sCB176DA16F6656EE85225E84D33ABF92)] [added: [29](#s912BB9664F1258F3AAD4983A4D01D9C6)] |
| | Item 9A | [Controls and [removed: Procedures](#s9A6200DA3D2F534F84EA0FAE3340DFA3)] [added: Procedures](#s74CA0E4F63765E0F9F7188DC06334E8D)] | [removed: [29](#s9A6200DA3D2F534F84EA0FAE3340DFA3)] [added: [29](#s74CA0E4F63765E0F9F7188DC06334E8D)] |
| | Item 9B | [Other [removed: Information](#s09044D6E0B0552CF955D636CD6622645)] [added: Information](#s4F956D52F23C55B8B3AFDD69BA3A8B22)] | [removed: [30](#s09044D6E0B0552CF955D636CD6622645)] [added: [30](#s4F956D52F23C55B8B3AFDD69BA3A8B22)] |
| | Item 10 | [Directors, Executive Officers and Corporate [removed: Governance](#s7E1DB83F8AFF5679A8452AC571E5CAA7)] [added: Governance](#s795BD3EA11D7592F959B346017D765C1)] | [removed: [30](#s7E1DB83F8AFF5679A8452AC571E5CAA7)] [added: [30](#s795BD3EA11D7592F959B346017D765C1)] |
| | Item 11 | [Executive [removed: Compensation](#s7E7C87966B00503CB66D32404CBDC960)] [added: Compensation](#sC62CE553BB3956E3BDC5AFA2C0D5BDAF)] | [removed: [30](#s7E7C87966B00503CB66D32404CBDC960)] [added: [31](#sC62CE553BB3956E3BDC5AFA2C0D5BDAF)] |
| | Item 12 | [Security Ownership of Certain Beneficial Owners and Management and Related Stockholder [removed: Matters](#sDAF45D8F82B953F48B4C2F59E6165441)] [added: Matters](#s3346628DDD615C37B508A0C9E96B63DB)] | [removed: [31](#sDAF45D8F82B953F48B4C2F59E6165441)] [added: [31](#s3346628DDD615C37B508A0C9E96B63DB)] |
| | Item 13 | [Certain Relationships and Related Transactions and Director [removed: Independence](#sCA23DD260DD6590D936E8E8DE5957CF6)] [added: Independence](#s9428EC01EB0B5066BC93FE87E8DB512A)] | [removed: [31](#sCA23DD260DD6590D936E8E8DE5957CF6)] [added: [31](#s9428EC01EB0B5066BC93FE87E8DB512A)] |
| | Item 14 | [Principal Accounting Fees and [removed: Services](#sE7A57CDF82B65D7CA578AEABF42F51F5)] [added: Services](#s408B557C27475D37916095CE9FB56E30)] | [removed: [31](#sE7A57CDF82B65D7CA578AEABF42F51F5)] [added: [31](#s408B557C27475D37916095CE9FB56E30)] |
| | Item 15 | [Exhibits, Financial Statement [removed: Schedules](#s24D9710E82A75A25BA12BCEF58969E49)] [added: Schedules](#sC46A82174A45560BAD37D869603E3582)] | [removed: [31](#s24D9710E82A75A25BA12BCEF58969E49)] [added: [32](#sC46A82174A45560BAD37D869603E3582)] |
| | Item 16 | [Form 10-K [removed: Summary](#sFAD90717FAC35490AEFCA334E58635D9)] [added: Summary](#sCE3EBC0CB62352D5897EB3D8F81DEC46)] | [removed: [34](#sFAD90717FAC35490AEFCA334E58635D9)] [added: [34](#sCE3EBC0CB62352D5897EB3D8F81DEC46)] |
10-K 1 a201810-k.htm 10-K
For the Fiscal Year Ended December 31, 2018
| | | [Signatures](#s71A518DEA39C5FDB8AB2B44661FDE3CE) | [35](#s71A518DEA39C5FDB8AB2B44661FDE3CE) |
10-K 1 a201710-k.htm 10-K
| | | [Signatures](#s8F6B6183C5A0573FA1DC9C465D55C1D5) | [35](#s8F6B6183C5A0573FA1DC9C465D55C1D5) |
Item 2. PROPERTIES
2 rewritten, 0 added, 3 removed, 44 unchanged
We lease and maintain approximately [removed: 440] [added: 490] locations worldwide, of which approximately [removed: 90] [added: 100] are in the United States.
Lease terms are either on a month-to-month basis or terminate at various times through [removed: 2028.][added: 2032.]
| | | |
| Latin America: | | |
| Costa Rica, Alajuela | | Office building |
Item 5. MARKET FOR REGISTRANT’S COMMON EQUITY, RELATED STOCKHOLDER MATTERS AND ISSUER PURCHASES OF EQUITY SECURITIES
11 rewritten, 10 added, 23 removed, 29 unchanged
Expeditors' common stock trades on The NASDAQ Global Select [removed: Market.][added: Market under the symbol EXPD.]
There were [removed: 801] [added: 754] shareholders of record as of February [removed: 20, 2018.][added: 19, 2019.]
In the fourth quarter of [removed: 2017,] [added: 2018,] we repurchased [removed: 778,977] [added: 170,726] shares of common stock under the Non-Discretionary Stock Repurchase Plan.
In February and August [removed: 2015 and] [added: 2015,] May [removed: 2016,] [added: 2016 and November 2018] the Board of Directors further authorized repurchases down to 188 million, 180 [added: million, 170] million and [removed: 170] [added: 160] million, respectively.
In the fourth quarter of [removed: 2017,] [added: 2018,] we repurchased [removed: 1,352,602] [added: 1,112,181] shares of common stock under the Discretionary Stock Repurchase Plan.
These discretionary repurchases included [removed: 355,765] [added: 78,382] shares that were made to limit the growth in the number of issued and outstanding shares resulting from stock option exercises and [removed: 996,837] [added: 1,033,799] shares to reduce the number of total shares outstanding.
The graph below compares Expeditors International of Washington, Inc.'s cumulative 5-Year total shareholder return on common stock with the cumulative total returns of the S&P 500 [removed: index, the NASDAQ Transportation index,] [added: index] and the NASDAQ Industrial Transportation index [removed: (NQUSB2770T) as a replacement for the NASDAQ Transportation index.][added: (NQUSB2770T).]
The graph assumes that the value of the investment in our common stock and in each of the indexes (including reinvestment of dividends) was $100 on [removed: 12/31/2012] [added: 12/31/2013] and tracks it through [removed: 12/31/2017.][added: 12/31/2018.]
Among Expeditors International of Washington, Inc., the S&P 500 [removed: Index,][added: Index]
[added: and] the NASDAQ Industrial Transportation [removed: Index and the][added: Index.]
[removed: 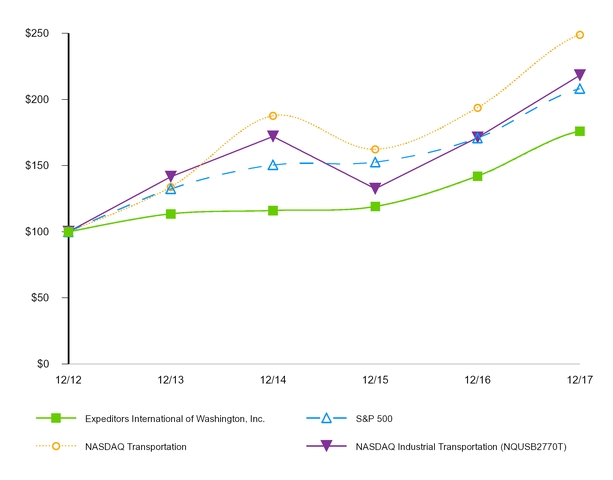][added: 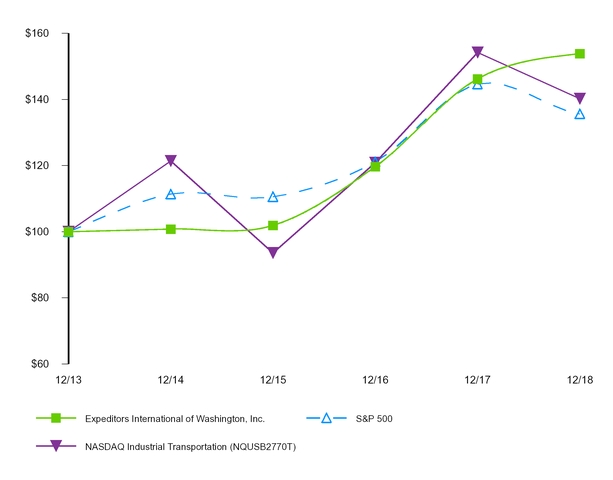]
| June 15, 2018 | $ | 0.45 | |
| December 17, 2018 | $ | 0.45 | |
| October 1-31, 2018 | | — | | | $ | — | | | — | | | 2,843,101 | |
| November 1-30, 2018 | | 176,886 | | | $ | 73.56 | | | 176,886 | | | 12,726,600 | |
| December 1-31, 2018 | | 1,106,021 | | | $ | 71.56 | | | 1,106,021 | | | 11,669,839 | |
| Total | | 1,282,907 | | | $ | 71.82 | | | 1,282,907 | | | 11,669,839 | |
| | | 12/13 | | | 12/14 | | | 12/15 | | | 12/16 | | | 12/17 | | | 12/18 | | |
| Expeditors International of Washington, Inc. | | $ | 100.00 | | $ | 100.81 | | $ | 101.92 | | $ | 119.68 | | $ | 146.19 | | $ | 153.88 | |
| Standard and Poor's 500 Index | | 100.00 | | | 111.39 | | | 110.58 | | | 121.13 | | | 144.65 | | | 135.63 | | |
| NASDAQ Industrial Transportation (NQUSB2770T) | | 100.00 | | | 121.41 | | | 93.55 | | | 120.89 | | | 154.19 | | | 140.25 | | |
The following table sets forth the high and low sale prices for our common stock as reported by The NASDAQ Global Select Market under the symbol EXPD.
| | | | | | | | | | | | | | | | | | | |
| --- | --- | --- | --- | --- | --- | --- | --- | --- | --- | --- | --- | --- | --- | --- | --- | --- | --- | --- |
| | | Common Stock | | | | | | | | | | Common Stock | | | | | | |
| Quarter | | High | | | | Low | | | | Quarter | | High | | | | Low | | |
| 2017 | | | | | | | | | | 2016 | | | | | | | | |
| First | | $ | 57.35 | | | $ | 51.57 | | | First | | $ | 49.56 | | | $ | 40.41 | |
| Second | | $ | 57.75 | | | $ | 51.96 | | | Second | | $ | 50.63 | | | $ | 46.48 | |
| Third | | $ | 60.30 | | | $ | 54.32 | | | Third | | $ | 52.58 | | | $ | 48.41 | |
| Fourth | | $ | 66.01 | | | $ | 56.45 | | | Fourth | | $ | 56.37 | | | $ | 47.23 | |
| June 15, 2016 | $ | 0.40 | |
| December 15, 2016 | $ | 0.40 | |
| October 1-31, 2017 | | — | | | $ | — | | | — | | | 11,121,188 | |
| November 1-30, 2017 | | 574,000 | | | $ | 64.33 | | | 574,000 | | | 11,031,664 | |
| December 1-31, 2017 | | 1,557,579 | | | $ | 64.58 | | | 1,557,579 | | | 9,018,093 | |
| Total | | 2,131,579 | | | $ | 64.52 | | | 2,131,579 | | | 9,018,093 | |
The Company is making the modification to reference a specific transportation index and to source that data directly from NASDAQ.
NASDAQ Transportation Index.
| | | 12/12 | | | 12/13 | | | 12/14 | | | 12/15 | | | 12/16 | | | 12/17 | | |
| Expeditors International of Washington, Inc. | | $ | 100.00 | | $ | 113.52 | | $ | 116.07 | | $ | 119.12 | | $ | 142.10 | | $ | 176.08 | |
| Standard and Poor's 500 Index | | 100.00 | | | 132.39 | | | 150.51 | | | 152.59 | | | 170.84 | | | 208.14 | | |
| NASDAQ Transportation | | 100.00 | | | 133.76 | | | 187.65 | | | 162.30 | | | 193.79 | | | 248.92 | | |
| NASDAQ Industrial Transportation (NQUSB2770T) | | 100.00 | | | 141.60 | | | 171.91 | | | 132.47 | | | 171.17 | | | 218.34 | | |
Item 6. SELECTED FINANCIAL DATA
15 rewritten, 0 added, 0 removed, 23 unchanged
| | | [removed: 2017] [added: 2018] | | | | [removed: 2016] [added: 2017] | | | [removed: 2015] [added: 2016] | | | [removed: 2014] [added: 2015] | | | [removed: 2013] [added: 2014] | |
| Revenues | | $ | [added: 8,138,365 | | |] 6,920,948 | | | 6,098,037 | | | 6,616,632 | | | 6,564,721 | | [removed: | 6,080,257 | |]
| Net revenues1 | | $ | [added: 2,620,373 | | |] 2,319,189 | | | 2,164,036 | | | 2,187,777 | | | 1,981,427 | | [removed: | 1,882,853 | |]
| Net earnings attributable to shareholders | | $ | [added: 618,199 | | |] 489,345 | | | 430,807 | | | 457,223 | | | 376,888 | | [removed: | 348,526 | |]
| Diluted earnings attributable to shareholders per share | | $ | [added: 3.48 | | |] 2.69 | | | 2.36 | | | 2.40 | | | 1.92 | | [removed: | 1.68 | |]
| Basic earnings attributable to shareholders per share | | $ | [added: 3.55 | | |] 2.73 | | | 2.38 | | | 2.42 | | | 1.92 | | [removed: | 1.69 | |]
| Dividends declared and paid per common share | | $ | [added: 0.90 | | |] 0.84 | | | 0.80 | | | 0.72 | | | 0.64 | | [removed: | 0.60 | |]
| Cash used for dividends | | $ | [added: 156,840 | | |] 150,495 | | | 145,123 | | | 135,673 | | | 124,634 | | [removed: | 123,292 | |]
| Cash used for share repurchases | | $ | [added: 647,898 | | |] 478,258 | | | 337,658 | | | 629,991 | | | 550,781 | | [removed: | 261,936 | |]
| Working capital | | $ | [added: 1,407,977 | | |] 1,448,333 | | | 1,288,648 | | | 1,115,136 | | | 1,285,188 | | [removed: | 1,526,673 | |]
| Total assets | | $ | [added: 3,314,559 | | |] 3,117,008 | | | 2,790,871 | | | 2,565,577 | | | 2,870,626 | | [removed: | 2,996,416 | |]
| Shareholders’ equity | | $ | [added: 1,986,838 | | |] 1,991,858 | | | 1,844,638 | | | 1,691,993 | | | 1,868,408 | | [removed: | 2,084,783 | |]
| Weighted average diluted shares outstanding | | [removed: 181,666] [added: 177,833] | | | | [removed: 182,704] [added: 181,666] | | | [removed: 190,223] [added: 182,704] | | | [removed: 196,768] [added: 190,223] | | | [removed: 206,895] [added: 196,768] | |
| Weighted average basic shares outstanding | | [removed: 179,247] [added: 174,133] | | | | [removed: 181,282] [added: 179,247] | | | [removed: 188,941] [added: 181,282] | | | [removed: 196,147] [added: 188,941] | | | [removed: 205,995] [added: 196,147] | |
This Annual Report on Form 10-K for the fiscal year ended December 31, [removed: 2017] [added: 2018] contains “forward-looking statements,” as defined in Section 27A of the Securities Act of 1933, as amended, and Section 21E of the Securities Exchange Act of 1934, as amended.
Item 8. FINANCIAL STATEMENTS AND SUPPLEMENTARY DATA
7 rewritten, 0 added, 0 removed, 16 unchanged
| | | | [Reports of Independent Registered Public Accounting [removed: Firm](#sB05E6A1157D55330B7A5A4BB05725F00)] [added: Firm](#s9A8210E912E057D99EA417AB1A59D0D2)] | | F-1 and F-2 |
| | | | Balance Sheets as of December 31, [removed: 2017] [added: 2018] and [removed: 2016] [added: 2017] | | F-3 |
| | | | [Statements of Earnings for the Years Ended December 31, [removed: 201](#s8CC13619EA1958D79E8268C5767CAEF4)7, 2016,] [added: 201](#s87AC86B956055E2E8C4084FBC7757CC2)8, 2017,] and [removed: 2015] [added: 2016] | | F-4 |
| | | | [Statements of Comprehensive Income for the Years Ended December 31, [removed: 201](#s905842BE5E4C51938544E35A7424F325)7, 2016,] [added: 201](#s12936BC1C1BB5175AC54B323A878E5DD)8, 2017,] and [removed: 2015] [added: 2016] | | F-5 |
| | | | [Statements of Equity for the Years Ended December 31, [removed: 201](#s51852A996F6F572CAA02E9083F5328E8)7, 2016,] [added: 201](#sBDFCEE9E946455FB82D24E4F10525B35)8, 2017,] and [removed: 2015] [added: 2016] | | F-6 and F-7 |
| | | | [Statements of Cash Flows for the Years Ended December 31, [removed: 201](#s42A82A3A9B4D51C18DC96C2E65EB6FB2)7, 2016,] [added: 201](#sBF6B0BC614155E59977E8D487436DC87)8, 2017,] and [removed: 2015] [added: 2016] | | F-8 |
| | | | [Notes to Consolidated Financial [removed: Statements](#sBD46D45658A152B1B20EEE1D8D1CD7B8)] [added: Statements](#sD2D6445BCC2D546BB36A151FE703384C)] | | F-9 through [removed: F-23] [added: F-22] |
Item 9A. CONTROLS AND PROCEDURES
5 rewritten, 0 added, 0 removed, 19 unchanged
In [removed: the next two fiscal years,] [added: 2018] we [removed: will adopt two significant] [added: adopted the] new [removed: accounting standards related to] revenue recognition [added: accounting standard,] and [added: in 2019 we will adopt the new] accounting [added: standard] for leases.
The adoption of these accounting standards [removed: will require] [added: requires further] changes to existing processes and systems that are an integral part of our internal controls and [removed: will] require testing for operating effectiveness.
Management, including the Chief Executive Officer and Chief Financial Officer, conducted an assessment of the effectiveness of the Company's internal control over financial reporting, as of December 31, [removed: 2017,] [added: 2018,] based on the framework in Internal Control — Integrated Framework (2013) issued by the Committee of Sponsoring Organizations of the Treadway Commission (COSO).
Based on this assessment, management has concluded that, as of December 31, [removed: 2017,] [added: 2018,] our internal control over financial reporting was effective.
KPMG LLP, an independent registered public accounting firm, has issued an attestation report on our internal control over financial reporting as of December 31, [removed: 2017,] [added: 2018,] which is included on page F-2.
Item 10. DIRECTORS, EXECUTIVE OFFICERS AND CORPORATE GOVERNANCE
2 rewritten, 3 added, 3 removed, 11 unchanged
The information required by this item is set forth below or incorporated by reference to information under the caption “Proposal No. 1: Election of Directors” and to the information under the captions “Section 16(a) Beneficial Ownership Reporting Compliance” and “Board Operations" in Expeditors' definitive Proxy Statement for its annual meeting of shareholders to be held on May [removed: 8, 2018.][added: 7, 2019.]
The Code of Business Conduct is posted [added: with the governance documents] on Expeditors' website at https://investor.expeditors.com.
McCune, James M.
Dubois, Alain Monié, and Tay Yoshitani.
30.
McCune, Alain Monié, Dan P.
Kourkoumelis and James M.
Dubois.
Item 11. EXECUTIVE COMPENSATION
1 rewritten, 0 added, 1 removed, 0 unchanged
The information required by this item is incorporated by reference to information under the captions “Director Compensation Program” and “Compensation [removed: Committee Report”] [added: Discussion and Analysis”] in Expeditors' definitive Proxy Statement for its annual meeting of shareholders to be held on May [removed: 8, 2018.][added: 7, 2019.]
30.
Item 12. SECURITY OWNERSHIP OF CERTAIN BENEFICIAL OWNERS AND MANAGEMENT AND RELATED STOCKHOLDER MATTERS
4 rewritten, 2 added, 2 removed, 14 unchanged
The information required by this item is incorporated by reference to information under the captions “Shareholder Engagement [removed: and] [added: &] Stock Ownership Information” in Expeditors' definitive Proxy Statement for its annual meeting of shareholders to be held on May [removed: 8, 2018.][added: 7, 2019.]
The following table provides information as of December 31, [removed: 2017,] [added: 2018,] regarding compensation plans under which equity securities of Expeditors are authorized for issuance.
| (2) | The weighted average exercise price does not take into account the shares issuable upon vesting of outstanding restricted stock [added: units and performance stock] units, which have no exercise price. |
| (3) | Includes [removed: 1,409,217] [added: 743,015] available for issuance under the employee stock purchase plans, [removed: 1,884,387] [added: 1,431,417] available for future grants of equity awards under the Omnibus Incentive Plan and [removed: 106,250] [added: 81,320] available for issuance of restricted stock under the Director's Restricted Stock Plan. |
| Equity Compensation Plans Approved by Security Holders | | 10,228,276 | | | $ | 44.60 | | | 2,255,752 | |
| Total | | 10,228,276 | | | $ | 44.60 | | | 2,255,752 | |
| Equity Compensation Plans Approved by Security Holders | | 13,564,211 | | | $ | 44.36 | | | 3,399,854 | |
| Total | | 13,564,211 | | | $ | 44.36 | | | 3,399,854 | |
Item 13. CERTAIN RELATIONSHIPS AND RELATED TRANSACTIONS, AND DIRECTOR INDEPENDENCE
1 rewritten, 0 added, 0 removed, 0 unchanged
The information required by this item is incorporated by reference to information under the captions “Certain Relationships and Related Transactions” in Expeditors' definitive Proxy Statement for its annual meeting of shareholders to be held on May [removed: 8, 2018.][added: 7, 2019.]
Item 14. PRINCIPAL ACCOUNTING FEES AND SERVICES
1 rewritten, 1 added, 0 removed, 1 unchanged
The information required by this item is incorporated by reference to information under the caption “Relationship with Independent Registered Public Accounting Firm” in Expeditors' definitive Proxy Statement for its annual meeting of shareholders to be held on May [removed: 8, 2018.][added: 7, 2019.]
31.
Item 15. EXHIBITS, FINANCIAL STATEMENT SCHEDULES
34 rewritten, 0 added, 9 removed, 158 unchanged
| | | [Reports of Independent Registered Public Accounting [removed: Firm](#sB05E6A1157D55330B7A5A4BB05725F00)] [added: Firm](#s9A8210E912E057D99EA417AB1A59D0D2)] | | F-1 and F-2 |
| | | [Consolidated Balance Sheets as of December 31, [removed: 201](#s4DF75F6095695916BF5589B9CCB2BA02)7] [added: 201](#sF5655DA6FE4E535EBE2FCF1F55D9698A)8] and [removed: 2016] [added: 2017] | | F-3 |
| | | [Consolidated Statements of Earnings for the Years Ended December 31, [removed: 201](#s8CC13619EA1958D79E8268C5767CAEF4)7, 2016] [added: 201](#s87AC86B956055E2E8C4084FBC7757CC2)8, 2017] and [removed: 2015] [added: 2016] | | F-4 |
| | | [Consolidated Statements of Comprehensive Income for the Years Ended December 31, [removed: 201](#s905842BE5E4C51938544E35A7424F325)7, 2016] [added: 201](#s12936BC1C1BB5175AC54B323A878E5DD)8, 2017] and [removed: 2015] [added: 2016] | | F-5 |
| | | [Consolidated Statements of Equity for the Years Ended December 31, [removed: 201](#s51852A996F6F572CAA02E9083F5328E8)7, 2016] [added: 201](#sBDFCEE9E946455FB82D24E4F10525B35)8, 2017] and [removed: 2015] [added: 2016] | | F-6 and F-7 |
| | | [Consolidated Statements of Cash Flows for the Years Ended December 31, [removed: 201](#s42A82A3A9B4D51C18DC96C2E65EB6FB2)7, 2016] [added: 201](#sBF6B0BC614155E59977E8D487436DC87)8, 2017] and [removed: 2015] [added: 2016] | | F-8 |
| | | [Notes to Consolidated Financial [removed: Statements](#sBD46D45658A152B1B20EEE1D8D1CD7B8)] [added: Statements](#sD2D6445BCC2D546BB36A151FE703384C)] | | F-9 through [removed: F-23] [added: F-22] |
| (8) | Expeditors' [removed: 2007] [added: 2008] Stock Option Plan. See Exhibit [removed: 10.49.] [added: 10.51.] |
| (9) | Form of Stock Option Agreement used in connection with [removed: Incentive] options granted under Expeditors' [removed: 2007] [added: 2008] Stock Option Plan. See Exhibit [removed: 10.50.] [added: 10.52.] |
| (10) | Expeditors' [removed: 2008] [added: 2009] Stock Option Plan. See Exhibit [removed: 10.51.] [added: 10.53.] |
| (11) | Form of Stock Option Agreement used in connection with options granted under Expeditors' [removed: 2008] [added: 2009] Stock Option Plan. See Exhibit [removed: 10.52.] [added: 10.54.] |
| (12) | Expeditors' [removed: 2009] [added: 2010] Stock Option Plan. See Exhibit [removed: 10.53.] [added: 10.55.] |
| (13) | Form of Stock Option Agreement used in connection with options granted under [removed: Expeditors' 2009] [added: Expeditors’ 2010] Stock Option Plan. See Exhibit [removed: 10.54.] [added: 10.56.] |
| (14) | Expeditors' [removed: 2010] [added: 2011] Stock Option Plan. See Exhibit [removed: 10.55.] [added: 10.57.] |
| (15) | Form of Stock Option Agreement used in connection with options granted under [removed: Expeditors’ 2010] [added: Expeditors' 2011] Stock Option Plan. See Exhibit [removed: 10.56.] [added: 10.58.] |
| (16) | Expeditors' [removed: 2011] [added: 2012] Stock Option Plan. See Exhibit [removed: 10.57.] [added: 10.59.] |
| (17) | Form of Stock Option Agreement used in connection with options granted under Expeditors' [removed: 2011] [added: 2012] Stock Option Plan. See Exhibit [removed: 10.58.] [added: 10.60.] |
| (18) | Expeditors' [removed: 2012] [added: 2013] Stock Option Plan. See Exhibit [removed: 10.59.] [added: 10.61.] |
| (19) | Form of Stock Option Agreement used in connection with options granted under Expeditors' [removed: 2012] [added: 2013] Stock Option Plan. See Exhibit [removed: 10.60.] [added: 10.62.] |
| (20) | Expeditors' [removed: 2013] [added: 2014] Stock Option Plan. See Exhibit [removed: 10.61.] [added: 10.63.] |
| (21) | Form of Stock Option Agreement used in connection with options granted under [removed: Expeditors' 2013] [added: Expeditors; 2014] Stock Option Plan. See Exhibit [removed: 10.62.] [added: 10.64.] |
| (22) | Expeditors' [removed: 2014] [added: 2015] Stock Option Plan. See Exhibit [removed: 10.63.] [added: 10.65.] |
| (23) | Form of Stock Option Agreement used in connection with options granted under [removed: Expeditors; 2014] [added: Expeditors' 2015] Stock Option Plan. See Exhibit [removed: 10.64.] [added: 10.66.] |
| (24) | Expeditors' [removed: 2015] [added: 2016] Stock Option Plan. See Exhibit [removed: 10.65.] [added: 10.67.] |
| (25) | Form of Stock Option Agreement used in connection with options granted under Expeditors' [removed: 2015] [added: 2016] Stock Option Plan. See Exhibit [removed: 10.66.] [added: 10.68.] |
| [removed: (27)] [added: (28)] | Form of [removed: Stock Option] [added: Performance Share Award] Agreement used in connection with [removed: options] [added: performance share units] granted under Expeditors' [removed: 2016] [added: 2017 Omnibus Incentive] Stock [removed: Option] Plan. See Exhibit [removed: 10.68.] [added: 10.71] |
| [removed: (28)] [added: (26)] | Expeditors' 2017 Omnibus Incentive Plan. See Exhibit 10.69 |
| [removed: (29)] [added: (27)] | Form of Executive Restricted Stock Unit Award Agreement used in connection with executive restricted stock units granted under Expeditors' 2017 Omnibus Incentive Stock Plan. See Exhibit 10.70 |
| [removed: [3.1](https://www.sec.gov/Archives/edgar/data/746515/000074651518000004/a201710-kex31.htm)] [added: [3.1](http://www.sec.gov/Archives/edgar/data/746515/000074651518000004/a201710-kex31.htm)] | | Expeditors' Restated Articles of Incorporation and the Articles of Amendment as [removed: amended] [added: amended. (Incorporated by reference to Exhibit 3.1 to Form 10-K, filed on or about February 23, 2018.)] |
| [removed: [21.1](https://www.sec.gov/Archives/edgar/data/746515/000074651518000004/a201710-kex211.htm)] [added: [21.1](https://www.sec.gov/Archives/edgar/data/746515/000074651519000004/a201810-kex211.htm)] | | Subsidiaries of the registrant. |
| [removed: [23.1](https://www.sec.gov/Archives/edgar/data/746515/000074651518000004/a201710-kex231.htm)] [added: [23.1](https://www.sec.gov/Archives/edgar/data/746515/000074651519000004/a201810-kex231.htm)] | | Consent of Independent Registered Public Accounting Firm. |
| [removed: [31.1](https://www.sec.gov/Archives/edgar/data/746515/000074651518000004/a201710-kex311.htm)] [added: [31.1](https://www.sec.gov/Archives/edgar/data/746515/000074651519000004/a201810-kex311.htm)] | | Certification of Chief Executive Officer pursuant to Section 302 of the Sarbanes-Oxley Act of 2002. |
| [removed: [31.2](https://www.sec.gov/Archives/edgar/data/746515/000074651518000004/a201710-kex312.htm)] [added: [31.2](https://www.sec.gov/Archives/edgar/data/746515/000074651519000004/a201810-kex312.htm)] | | Certification of Chief Financial Officer pursuant to Section 302 of the Sarbanes-Oxley Act of 2002. |
| [removed: [32](https://www.sec.gov/Archives/edgar/data/746515/000074651518000004/a201710-kex32.htm)] [added: [32](https://www.sec.gov/Archives/edgar/data/746515/000074651519000004/a201810-kex32.htm)] | | Certification pursuant to 18 U.S.C. Section 1350, as adopted pursuant to Section 906 of the Sarbanes-Oxley Act of 2002. |
31.
| | |
| --- | --- |
| (26) | Expeditors' 2016 Stock Option Plan. See Exhibit 10.67. |
| (30) | Form of Performance Share Award Agreement used in connection with performance share units granted under Expeditors' 2017 Omnibus Incentive Stock Plan. See Exhibit 10.71 |
| | | |
| --- | --- | --- |
| [10.49](http://www.sec.gov/Archives/edgar/data/746515/000110465907024071/a07-6104_1def14a.htm) | | Expeditors' 2007 Stock Option Plan. (Incorporated by reference to Appendix A of Expeditors' Notice of Annual Meeting of Shareholders and Proxy Statement pursuant to Regulation 14A filed on or about March 30, 2007.) |
| [10.50](http://www.sec.gov/Archives/edgar/data/746515/000110465908013877/a08-2452_1ex10d50.htm) | | Form of Stock Option Agreement used in connection with Incentive options granted under Expeditors' 2007 Stock Option Plan. (Incorporated by reference to Exhibit 10.50 to Form 10-K filed on or about February 29, 2008.) |
Item 16. FORM 10-K SUMMARY
234 rewritten, 130 added, 132 removed, 594 unchanged
Date: February [removed: 23, 2018][added: 22, 2019]
Pursuant to the requirements of the Securities Exchange Act of 1934, this report has been signed below by the following persons on behalf of the registrant and in the capacities indicated on February [removed: 23, 2018.][added: 22, 2019.]
YEARS ENDED DECEMBER 31, [added: 2018,] 2017, [removed: 2016,] AND [removed: 2015][added: 2016]
We have audited the accompanying consolidated balance sheets of Expeditors International of Washington, Inc. and subsidiaries (the Company) as of December 31, [removed: 2017] [added: 2018] and [removed: 2016,] [added: 2017,] the related consolidated statements of earnings, comprehensive income, equity, and cash flows for each of the years in the three‑year period ended December 31, [removed: 2017,] [added: 2018,] and the related notes (collectively, the consolidated financial statements).
In our opinion, the consolidated financial statements present fairly, in all material respects, the financial position of the Company as of December 31, [removed: 2017] [added: 2018] and [removed: 2016,] [added: 2017,] and the results of its operations and its cash flows for each of the years in the three‑year period ended December 31, [removed: 2017,] [added: 2018,] in conformity with U.S. generally accepted accounting principles.
We also have audited, in accordance with the standards of the Public Company Accounting Oversight Board (United States) (PCAOB), the Company’s internal control over financial reporting as of December 31, [removed: 2017,] [added: 2018,] based on criteria established in Internal Control - Integrated Framework (2013) issued by the Committee of Sponsoring Organizations of the Treadway Commission, and our report dated February [removed: 23, 2018] [added: 22, 2019] expressed an unqualified opinion on the effectiveness of the Company’s internal control over financial reporting.
| [removed: February 23,] 2018 | | | [added: | | | | | | | | |]
We have audited Expeditors International of Washington, Inc.’s and subsidiaries' (the Company) internal control over financial reporting as of December 31, [removed: 2017,] [added: 2018,] based on criteria established in Internal Control - Integrated Framework (2013) issued by the Committee of Sponsoring Organizations of the Treadway Commission.
In our opinion, the Company maintained, in all material respects, effective internal control over financial reporting as of December 31, [removed: 2017,] [added: 2018,] based on criteria established in Internal Control - Integrated Framework (2013) issued by the Committee of Sponsoring Organizations of the Treadway Commission.
We also have audited, in accordance with the standards of the Public Company Accounting Oversight Board (United States) (PCAOB), the consolidated balance sheets of the Company as of December 31, [removed: 2017] [added: 2018] and [removed: 2016,] [added: 2017,] the related consolidated statements of earnings, comprehensive income, equity, and cash flows for each of the years in the three-year period ended December 31, [removed: 2017,] [added: 2018,] and the related notes (collectively, the consolidated financial statements), and our report dated February [removed: 23, 2018] [added: 22, 2019] expressed an unqualified opinion on those consolidated financial statements.
| December 31, | [removed: 2017] [added: 2018] | | | | [removed: 2016] [added: 2017] | |
| Cash and cash equivalents [added: at beginning of year] | [removed: $] | 1,051,099 | | | [added: |] 974,435 | | [added: | 807,796 | |]
| Accounts receivable, less allowance for doubtful accounts of [removed: $12,858] [added: $15,345] in [removed: 2017] [added: 2018] and [removed: $9,247] [added: $12,858] in [removed: 2016] [added: 2017] | [removed: 1,414,741] [added: 1,581,530] | | | | [removed: 1,190,130] [added: 1,414,741] | |
| Other | [removed: 75,612] [added: 70,041] | | | | [removed: 54,014] [added: 75,612] | |
| Total current assets | [removed: 2,541,452] [added: 2,734,816] | | | | [removed: 2,218,579] [added: 2,541,452] | |
| Property and equipment, net | [removed: 525,203] [added: 504,105] | | | | [removed: 536,572] [added: 525,203] | |
| Deferred Federal and state income taxes, net | [removed: 13,207] [added: 40,465] | | | | [removed: —] [added: 13,207] | |
| Other assets, net | [removed: 29,219] [added: 27,246] | | | | [removed: 27,793] [added: 29,219] | |
| Total assets | $ | [removed: 3,117,008] [added: 3,314,559] | | | [removed: 2,790,871] [added: 3,117,008] | |
| Accounts payable | $ | [removed: 866,305] [added: 902,259] | | | [removed: 726,571] [added: 866,305] | |
| Accrued expenses, primarily salaries and related costs | [removed: 206,320] [added: 215,813] | | | | [removed: 185,502] [added: 206,320] | |
| Federal, state and foreign income taxes | [removed: 20,494] [added: 18,424] | | | | [removed: 17,858] [added: 20,494] | |
| Total current liabilities | [removed: 1,093,119] [added: 1,326,839] | | | | [removed: 929,931] [added: 1,093,119] | |
| Noncurrent Federal income tax payable | [removed: 29,516] [added: —] | | | | [removed: —] [added: 29,516] | |
| [removed: issued] and [removed: outstanding] 176,374 shares at December 31, 2017 | [added: 1,716] | | | | [added: 1,764] | |
| Additional paid-in capital | [removed: 546] [added: 1,896] | | | | [removed: 2,642] [added: 546] | |
| Retained earnings | [removed: 2,063,512] [added: 2,088,707] | | | | [removed: 1,944,789] [added: 2,063,512] | |
| Accumulated other comprehensive loss | [removed: (73,964] [added: (105,481] | | ) | | [removed: (104,592] [added: (73,964] | ) |
| Total shareholders’ equity | [removed: 1,991,858] [added: 1,986,838] | | | | [removed: 1,844,638] [added: 1,991,858] | |
| Noncontrolling interest | [removed: 2,515] [added: 882] | | | | [removed: 2,575] [added: 2,515] | |
| Total equity | [removed: 1,994,373] [added: 1,987,720] | | | | [removed: 1,847,213] [added: 1,994,373] | |
| Total liabilities and equity | $ | [removed: 3,117,008] [added: 3,314,559] | | | [removed: 2,790,871] [added: 3,117,008] | |
| Years ended December 31, | | [removed: 2017] [added: 2018] | | | | [removed: 2016] [added: 2017] | | | [removed: 2015] [added: 2016] | |
| Airfreight services | | $ | [removed: 2,877,032] [added: 3,271,932] | | | [removed: 2,453,347] [added: 2,877,032] | | | [removed: 2,740,583] [added: 2,453,347] | |
| Ocean freight and ocean services | | [removed: 2,107,045] [added: 2,251,754] | | | | [removed: 1,917,494] [added: 2,107,045] | | | [removed: 2,194,004] [added: 1,917,494] | |
| Customs brokerage and other services | | [removed: 1,936,871] [added: 2,614,679] | | | | [removed: 1,727,196] [added: 1,936,871] | | | [removed: 1,682,045] [added: 1,727,196] | |
| Total revenues | | [removed: 6,920,948] [added: 8,138,365] | | | | [removed: 6,098,037] [added: 6,920,948] | | | [removed: 6,616,632] [added: 6,098,037] | |
| Airfreight services | | [removed: 2,126,761] [added: 2,410,793] | | | | [removed: 1,752,167] [added: 2,126,761] | | | [removed: 1,987,690] [added: 1,752,167] | |
| Ocean freight and ocean services | | [removed: 1,543,740] [added: 1,664,168] | | | | [removed: 1,378,699] [added: 1,543,740] | | | [removed: 1,648,993] [added: 1,378,699] | |
| Customs brokerage and other services | | [removed: 931,258] [added: 1,443,031] | | | | [removed: 803,135] [added: 931,258] | | | [removed: 792,172] [added: 803,135] | |
| February 22, 2019 | | |
| February 22, 2019 | | |
| Cash and cash equivalents | $ | 923,735 | | | 1,051,099 | |
| Deferred contract costs | 159,510 | | | | — | |
| Contract liabilities | 190,343 | | | | — | |
| issued and outstanding 171,582 shares at December 31, 2018 | | | | | | |
| Cumulative effect of accounting change | — | | | — | | |
| Purchase of noncontrolling interest | — | | | — | | |
| Balance at December 31, 2018 | 171,582 | | | $ | 1,716 | |
| Cumulative effect of accounting change | — | | | | (22,357 | ) | | — | | | (22,357 | ) | | (105 | ) | | (22,462 | ) |
| Shares repurchased under provisions of stock repurchase plans | (234,160 | | ) | | (413,648 | ) | | — | | | (647,898 | ) | | — | | | (647,898 | ) |
| Net earnings | — | | | | 618,199 | | | — | | | 618,199 | | | 1,591 | | | 619,790 | |
| Other comprehensive loss | — | | | | — | | | (31,517 | ) | | (31,517 | ) | | (873 | ) | | (32,390 | ) |
| Dividends paid ($0.90 per share) | 159 | | | | (156,999 | ) | | — | | | (156,840 | ) | | — | | | (156,840 | ) |
| Purchase of noncontrolling interest | (238 | | ) | | — | | | — | | | (238 | ) | | (450 | ) | | (688 | ) |
| Balance at December 31, 2018 | $ | 1,896 | | | 2,088,707 | | | (105,481 | ) | | 1,986,838 | | | 882 | | | 1,987,720 | |
| Net earnings | | $ | 619,790 | | | 490,383 | | | 432,533 | |
| Depreciation and amortization | | 54,019 | | | | 49,310 | | | 46,796 | |
| Increase in deferred contract costs | | (42,097 | | ) | | — | | | — | |
| Increase in contract liabilities | | 43,928 | | | | — | | | — | |
| Payments for taxes related to net share settlement of equity awards | | (3,248 | | ) | | — | | | — | |
| Purchase of noncontrolling interest | | (688 | | ) | | — | | | — | |
The Company provides global logistics services, including air and ocean freight consolidation and forwarding, customs brokerage, warehousing and distribution, purchase order management, vendor consolidation, time-definite transportation services, temperature-controlled transit, cargo insurance, specialized cargo monitoring and tracking and other logistics solutions.
The Company derives its revenues by entering into agreements that are generally comprised of a single performance obligation, which is that freight is shipped for and received by the customer.
The most significant drivers of changes in gross revenues and related transportation expenses are volume, sell rates and buy rates.
Volume has a similar effect on the change in both gross revenues and related transportation expenses in each of the Company's three primary sources of revenue.
Effective January 1, 2018, revenue is recognized upon transfer of control of promised services to customers, which occurs over time.
The Company has determined that in general each shipment transaction or service order constitutes a separate contract with the customer.
However, when the Company provides multiple services to a customer, different contracts may be present for different services.
The Company combines the contracts, which form a single performance obligation, and accounts for the contracts as a single contract when certain criteria are met.
The Company typically satisfies its performance obligations as services are rendered over time.
A typical shipment would include services rendered at origin, such as pick-up and delivery to port, freight services from origin to destination port and destination services, such as customs clearance and final delivery.
The Company measures the performance of its obligations as services are completed over the life of a shipment, including services at origin, freight and destination.
This method of measurement of progress depicts the pattern of the Company's actual performance under the contracts with the customer.
There are no significant judgments involved in measuring the progress of the performance obligations.
Amounts allocated to the services for each performance obligation are typically based on standalone selling prices.
The Company does not have significant variable consideration in its contracts.
Taxes assessed concurrently with a specific revenue-producing transaction that are collected by the Company from a customer are excluded from revenue.
In these instances, the transaction price is allocated to each service on a relative selling price basis.
The Company fulfills nearly all of its performance obligations within a one to two month-period and contracts with customers have an original expected duration of less than one year.
| | | |
| | | | |
| /s/ Dan P. Kourkoumelis | | Director | |
| (Dan P. Kourkoumelis) | | | |
| Deferred Federal and state income taxes, net | — | | | | 13,727 | |
| and 179,857 shares at December 31, 2016 | 1,764 | | | | 1,799 | |
| | | | | | | | | | | |
| --- | --- | --- | --- | --- | --- | --- | --- | --- | --- | --- |
| Balance at December 31, 2014 | 191,656 | | | $ | 1,916 | |
| Tax benefits from stock plans, net | — | | | — | | |
| Balance at December 31, 2014 | $ | 1,113 | | | 1,903,196 | | | (37,817 | ) | | 1,868,408 | | | 3,200 | | | 1,871,608 | |
| Shares repurchased under provisions of stock repurchase plans | (176,493 | | ) | | (453,367 | ) | | — | | | (629,991 | ) | | — | | | (629,991 | ) |
| Tax benefits from stock plans, net | 1,068 | | | | — | | | — | | | 1,068 | | | — | | | 1,068 | |
| Net earnings | — | | | | 457,223 | | | — | | | 457,223 | | | 2,274 | | | 459,497 | |
| Other comprehensive loss | — | | | | — | | | (43,421 | ) | | (43,421 | ) | | (669 | ) | | (44,090 | ) |
| Dividends paid ($0.72 per share) | — | | | | (135,673 | ) | | — | | | (135,673 | ) | | — | | | (135,673 | ) |
| Cash and cash equivalents at beginning of year | | 974,435 | | | | 807,796 | | | 927,107 | |
Certain prior year amounts have been reclassified to conform to the 2017 presentation.
See Note 1.F below for further information.
These are the revenue categories presented in the financial statements.
Airfreight services revenues include the charges to the Company for carrying the shipments when the Company acts as a freight consolidator.
Ocean freight services revenues include the charges to the Company for carrying the shipments when the Company acts as a Non-Vessel Operating Common Carrier (NVOCC).
In each case the Company is acting as an indirect carrier.
When acting as an indirect carrier, the Company will issue a House Airway Bill (HAWB), a House Ocean Bill of Lading (HOBL) or a House Seaway Bill to customers as the contract of carriage.
In turn, when the freight is physically tendered to a direct carrier, the Company receives a contract of carriage known as a Master Airway Bill for airfreight shipments and a Master Ocean Bill of Lading for ocean shipments.
At this point, the risk of loss passes to the carrier, however, in order to claim for any such loss, the customer is first obligated to pay the freight charges.
Generally, when the Company is the primary obligor, it is obligated to compensate direct carriers for services performed regardless of whether customers accept the service, has latitude in establishing price, has discretion in selecting the direct carrier, has credit risk or has several but not all of these indicators, revenue is recorded on a gross basis.
Revenue is generally recorded on a net basis where the Company is not primarily obligated and does not have latitude in establishing prices.
Such amounts earned are determined using a fixed fee, a per unit of activity fee or a combination thereof.
Based upon the terms in the contract of carriage, revenues related to shipments where the Company issues a HAWB, a HOBL or a House Seaway Bill are recognized at the time the freight is tendered to the direct carrier at origin.
Costs related to the shipments are also recognized at this same time.
Revenues earned in other capacities, for instance, when the Company acts as an agent for the shipper, and does not issue a HAWB, a HOBL or a House Seaway Bill, include only the commissions and fees earned for the services performed.
In these transactions, the Company is not a principal and reports only commissions and fees earned in revenue.
These revenues are recognized upon completion of the services.
Customs brokerage and other services involves providing services at destination, such as helping customers clear shipments through customs by preparing required documentation, calculating and providing for payment of duties and other taxes on behalf of the customers as well as arranging for any required inspections by governmental agencies, and arranging for delivery.
This is a complicated function requiring technical knowledge of customs rules and regulations in the multitude of countries in which the Company has offices.
Revenues related to customs brokerage and other services are recognized upon completion of the services.
Arranging international shipments is a complex task.
Each actual movement can require multiple services.
In some instances, the Company is asked to perform only one of these services.
An excerpt. Shown here: 40 of 234 rewritten, 40 of 130 added and 40 of 132 removed. The counts are complete. For every sentence, read Item 16. FORM 10-K SUMMARY in the FY2018 filing and the FY2017 filing.