 filings.tools
W.W. Grainger (GWW) 10-K risk factor changes: FY2017 vs FY2016
The 2017-12-31 10-K against the 2016-12-31 one, compared heading by heading and sentence by sentence. One of these filings carries no fiscal year tag, so its year is the calendar year of the period end.
Item 1A12 rewritten4 added4 removed84 unchanged
All filing items793 rewritten550 added526 removed1,202 unchanged
Summary
counted, not written
- Item 1A headings could not be compared: only 0 carried over between the two years, which usually means one filing was read wrongly, so none is reported as new or removed.
- Sentence by sentence, 550 added, 526 removed, 793 rewritten and 1,202 unchanged across 19 items that differ.
- New this year: Item 4A. Executive Officers of the Registrant.
Sentences by item
22 items, with every count and a link to each item that changed
Underlined words on a shaded ground are new in FY2017; struck-through words were in FY2016. Sentences that are wholly new or wholly gone are labelled rather than marked.
Item 1A. Risk Factors
12 rewritten, 4 added, 4 removed, 84 unchanged
Accordingly, a significant or prolonged slowdown in activity in the [removed: United States (U.S.),] [added: U.S.,] Canada or any other major world economy, or a segment of any such economy, could negatively impact Grainger’s sales growth and results of operations.
The facilities maintenance industry is highly [removed: fragmented,] [added: competitive,] and changes in competition could result in decreased demand for Grainger’s products and services.
Grainger faces competition in all markets it serves, from manufacturers (including some of its own suppliers) that sell directly to certain segments of the market, wholesale distributors, catalog houses, retail enterprises and [removed: Internet-based] [added: online] businesses that compete with price transparency.
This consolidation could cause the industry to become more competitive as greater economies of scale are achieved by competitors, or as competitors with [added: a] new lower cost business models are able to operate with lower [removed: prices and gross profit on products.][added: prices.]
Products are purchased from [removed: more than 5,100] [added: approximately 5,200] suppliers located in various countries around the world, [removed: no] [added: not] one of which accounted for more than 5% of total purchases.
Historically, no significant difficulty has been encountered with respect to sources of supply; however, disruptions could occur due to factors beyond Grainger’s control, including economic downturns, [removed: political] [added: geopolitical] unrest, port slowdowns, trade issues and other factors, any of which could adversely affect a supplier’s ability to manufacture or [added: deliver products.]
If rapid growth with [added: larger,] lower margin customers continues, Grainger will face pressure to maintain current gross margins, as these customers receive more discounted pricing due to their higher sales volume.
[removed: Because techniques used to obtain unauthorized access or to] sabotage systems change frequently and generally are not recognized until they are launched against a target, Grainger may be unable to anticipate these techniques or implement adequate preventative measures.
If successful, those attempting to penetrate Grainger’s or its vendors’ information systems may misappropriate [added: personally identifiable, credit card, confidential, proprietary or other sensitive customer, supplier, employee or business information.]
In addition, any change in ratings could make it more difficult for [removed: the] Grainger to raise capital on acceptable terms, impact the ability to obtain adequate financing and result in higher interest costs for Grainger’s existing credit facilities or on future financings.
[added: Grainger’s results of operations] could be adversely affected by increased costs due to increased competition for employees, higher employee turnover or increased employee benefit costs.
Grainger’s business is subject to a wide array of laws, regulations and standards in every domestic and foreign jurisdiction where it operates, including advertising and marketing regulations, anti-bribery and corruption laws, anti-competition regulations, data protection (including payment card industry data security standards), data privacy (including in the U.S. and the European Union, which has traditionally imposed strict obligations under data privacy laws and regulations that vary from country to country) and cybersecurity requirements (including [removed: as to] protection of information and incident responses), environmental protection laws, foreign exchange controls and cash repatriation restrictions, government business regulations applicable to Grainger as a government contractor selling to federal, state and local government entities, health and safety laws, import and export requirements, intellectual property laws, labor laws, product compliance laws, supplier regulations regarding the sources of supplies or products, tax laws (including as to U.S. taxes on foreign subsidiaries), unclaimed property laws and laws, regulations and standards applicable to other commercial matters.
To remain competitive, the Company must be willing and able to respond to market pressures, including pricing, whether widely available or negotiated under a contract, delivery and services.
These pressures, and the implementation, timing and results of our strategic pricing and other responses, could have a material effect on Grainger's sales and profitability.
If the Company is unable to grow sales or reduce costs, among other actions, to wholly or partially offset the effect on profitability of our pricing actions, the Company's results of operations and financial condition may be adversely affected.
Because techniques used to obtain unauthorized access or to
These competitive pressures could adversely affect Grainger’s sales and profitability.
deliver products.
personally identifiable, credit card, confidential, proprietary or other sensitive customer, supplier, employee or business information.
Grainger’s results of operations
Item 7. Management’s Discussion and Analysis of Financial Condition and Results of Operations
150 rewritten, 180 added, 185 removed, 231 unchanged
[removed: Grainger] [added: W.W. Grainger, Inc. (Grainger)] is a broad [removed: line] [added: line, business-to-business] distributor of maintenance, repair and operating (MRO) supplies and other related products and services [removed: used by businesses] [added: with operations primarily in the U.S.] and [removed: institutions.][added: Canada, with a presence in Europe, Asia and Latin America.]
The U.S. operating segment reflects the results of Grainger’s U.S. [removed: business.][added: businesses.]
The Canada operating segment reflects the results for Acklands – Grainger [removed: Inc., Grainger’s Canadian business.][added: Inc. and its subsidiaries.]
Other [removed: Businesses] [added: businesses] include [added: the] single channel online businesses [removed: such as MonotaRO] [added: (Zoro] in [removed: Japan] [added: the U.S.] and [removed: Zoro] [added: MonotaRO] in [removed: the U.S.,] [added: Japan)] and [removed: business units] [added: operations] in Europe, Asia and Latin America.
The table below provides these estimated indicators for [removed: 2016] [added: 2017] and [removed: 2017:][added: 2018:]
| | Estimated [removed: 2016] [added: 2017] | | | Forecasted [removed: 2017] [added: 2018] | | | Estimated [removed: 2016] [added: 2017] | | | Forecasted [removed: 2017] [added: 2018] | |
| Oil Prices | — | | | — | | | [removed: $43/barrel] [added: $51/barrel] | | | [removed: $57/barrel] [added: $54/barrel] | |
| Source: Global Insight [removed: (February 2017)] [added: (January 2018)] | | | | | | | | | | | |
[removed: Through the execution of continuous improvement initiatives, the U.S. business will] [added: Grainger intends to continue to] reduce its cost base while ensuring that it [removed: continues to deliver] [added: delivers] an effortless customer experience.
Matters Affecting [removed: Comparability.][added: Comparability]
There were [removed: 255] [added: 254] sales days in the full year [added: 2017 and 255 sales days in the full years] 2016 and 2015.
Grainger completed one [removed: acquisition] [added: divestiture] in [removed: 2015] [added: 2017] and one [added: acquisition] in [removed: 2014, both of] [added: 2015,] which were immaterial individually and in the aggregate.
| | For the Years Ended December 31, | | | | | | | | | | | | | | | | | [removed: | | | | | | | | |]
| | | | | | | | | | [removed: | | | |] Percent Increase/(Decrease) from Prior Year | | | [removed: | | |] As a Percent of Net Sales | | | | | | [removed: | |]
| | 2016 (A) | | | | 2015 (A) | | | | [removed: 2014 (A) | | | |] 2016 | | | [removed: 2015] | [removed: | |] 2016 | | | 2015 | | [removed: | 2014 | |]
| Net sales | $ | 10,137 | | | $ | 9,973 | | | [removed: $ | 9,965 | | |] 2 | % | | [removed: —] | [removed: % | |] 100.0 | % | | 100.0 | % | [removed: | 100.0 | % |]
| Cost of merchandise sold | 6,023 | | | | 5,742 | | | | [removed: 5,651 | | | |] 5 | % | | [removed: 2] | [removed: % | |] 59.4 | | | 57.6 | | [removed: | 56.7 | |]
| Gross profit | 4,115 | | | | 4,231 | | | | [removed: 4,314 | | | |] (3 | )% | | [removed: (2] | [removed: )% | |] 40.6 | | | 42.4 | | [removed: | 43.3 | |]
| [removed: Operating] [added: Warehousing, marketing and administrative] expenses | 2,995 | | | | 2,931 | | | | [removed: 2,967 | | | |] 2 | % | | [removed: (1] | [removed: )% | |] 29.6 | | | 29.4 | | [removed: | 29.8 | |]
| Operating earnings | 1,119 | | | | 1,300 | | | | [removed: 1,347 | | | |] (14 | )% | | [removed: (4] | [removed: )% | |] 11.0 | | | 13.0 | | [removed: | 13.5 | |]
| Other [removed: expense] [added: expense, net] | 100 | | | | 50 | | | | [removed: 13 | | | |] 102 | % | | [removed: 290] | [removed: % | |] 1.0 | | | 0.5 | | [removed: | 0.1 | |]
| Income taxes | 386 | | | | 466 | | | | [removed: 522 | | | |] (17 | )% | | [removed: (11] | [removed: )% | |] 3.8 | | | 4.7 | | [removed: | 5.2 | |]
| Noncontrolling interest | 27 | | | | 16 | | | | [removed: 11 | | | |] 66 | % | | [removed: 53] | [removed: % | |] 0.3 | | | 0.2 | | [removed: | 0.1 | |]
| Net earnings attributable to W.W. Grainger, Inc. | $ | 606 | | | $ | 769 | | | [removed: $ | 801 | | |] (21 | )% | | [removed: (4] | [removed: )% | |] 6.0 | % | | 7.7 | % | [removed: | 8.1 | % |]
Grainger's net sales [removed: of] [added: were] $10,137 million for [removed: 2016 were] [added: 2016,] an increase of 2% when compared with net sales of $9,973 million for the comparable 2015 period.
| | Percent [removed: Increase/ (Decrease)] [added: Increase/(Decrease)] |
[removed: Sales] [added: In the U.S. business, sales] growth to government, retail and light manufacturing customers were offset by a decline in sales to natural resource customers, resellers, contractors and heavy manufacturing customers.
If the [removed: Company] [added: U.S. business] included KeepStock®, the electronic inventory management offering, total eCommerce and KeepStock® sales would represent [removed: 56%] [added: 53%] of total sales.
The [added: net sales] increase was primarily due to [removed: the following:][added: incremental sales at Zoro and MonotaRO.]
Excluding the charges from both [removed: years,] [added: years mentioned above,] operating expenses [removed: were down 1%.][added: decreased 1% primarily due to lower employee benefit costs.]
Net earnings attributable to [removed: Grainger] [added: W.W. Grainger, Inc.] for 2016 decreased by 21% to $606 million from $769 million in 2015.
Excluding the charges mentioned [removed: above] [added: above,] diluted earnings per share would have been [removed: $11.58] [added: $11.58,] compared to $11.94 in 2015, a decrease of 3%.
The table below reconciles reported [removed: diluted] [added: net] earnings [removed: per share] determined in accordance with [added: U.S.] generally accepted accounting principles (GAAP) [removed: in the U.S.] to adjusted [removed: diluted earnings per share,] [added: net earnings,] a non-GAAP measure.
Management believes adjusted [removed: diluted] [added: net] earnings [removed: per share] is an important indicator of operations because it excludes items that may not be indicative of core operating results.
[removed: Because] non-GAAP financial measures are not standardized, it may not be possible to compare this financial measure with other companies' non-GAAP financial measures having the same or similar names.
| | Twelve Months Ended [removed: December 31,] | | | | | | | | |
| Discrete tax items | [removed: (0.15] [added: (12,123] | | ) | | [removed: (0.09] [added: (9,378] | | ) | | |
Segment Analysis [added: - 2017 Compared to 2016]
See Note [removed: 16] [added: 6] to the Consolidated Financial Statements.
The 1% decrease [removed: for the year] consisted of the [removed: following contributors:][added: following:]
General
More than 3 million customers worldwide rely on Grainger for products such as safety, gloves, ladders, motors and janitorial supplies, along with services like inventory management and technical support.
These customers represent a broad collection of industries including commercial, government, healthcare and manufacturing.
They place orders online, on mobile devices, through sales representatives, over the phone and at local branches.
Approximately 5,200 suppliers provide Grainger with approximately 1.7 million products stocked in Grainger's distribution centers (DCs) and branches worldwide.
Business Environment
| Business Investment | 5.1 | % | | 7.9 | % | | 2.3 | % | | 3.5 | % |
| Business Inventory | 0.8 | % | | 2.1 | % | | — | | | — | |
| Exports | 3.4 | % | | 5.3 | % | | 1.1 | % | | 1.8 | % |
| Industrial Production | 1.9 | % | | 3.3 | % | | 5.2 | % | | 0.1 | % |
| GDP | 2.2 | % | | 2.7 | % | | 3.0 | % | | 2.4 | % |
Per the Global Insight January 2018 forecast, Business Investment is likely to remain on a strong growth path during 2018, supported by expanding global markets, lower capital costs and an improving regulatory climate.
Additionally on December 22, 2017, the Tax Cuts and Jobs Act was signed into law, which significantly lowered U.S. corporate income tax rates and introduced accelerated expensing of qualified capital investments, among other changes.
These changes to U.S. tax laws may increase capital spending in the U.S. and attract incremental foreign capital to the U.S., which is expected to support export growth.
Per the Global Insight January 2018 forecast, Canada's GDP and industrial production are forecast slow in 2018, while exports and business nonresidental investment (a component of Business Investment) are expected to improve.
Outlook
Grainger’s portfolio consists of its U.S. business, its Canada business and other businesses.
Grainger’s imperative to create unique value is focused on: (i) continuing to grow its share of business with large and mid-size customers in the U.S. by executing its high-value sales and service model, building an advantaged digital capability and completing its pricing strategy; (ii) executing a complete business model reset in Canada; (iii) driving profitable growth in its international portfolio and (iv) continuing the strong growth of its single channel businesses by expanding its assortment and innovation around customer acquisition.
Grainger is also focused on improving the end-to-end customer experience by making investments in its eCommerce and digital capabilities and executing continuous improvement initiatives within its supply chain, such that customers have a positive experience with Grainger from order to delivery.
On January 24, 2018, Grainger updated its 2018 earnings per share guidance to reflect the 2017 actual results, lower corporate tax rate, lower tax benefit from clean energy, incremental investment in digital and higher share repurchases.
The prior earnings per share guidance issued on November 10, 2017 for 2018 was $10.60 to $11.80.
The Company still expects 3 to 7 percent sales growth and now expects earnings per share of $12.95 to $14.15 for 2018.
| | | | | | | | | | | | | | | | | | |
| --- | --- | --- | --- | --- | --- | --- | --- | --- | --- | --- | --- | --- | --- | --- | --- | --- | --- |
| | | | | | | | | | | | | | | | | | |
| | 2017 (A) | | | | 2016 (A) | | | | 2017 | | | 2017 | | | 2016 | | |
| Net sales | $ | 10,425 | | | $ | 10,137 | | | 3 | % | | 100.0 | % | | 100.0 | % | |
| Cost of merchandise sold | 6,327 | | | | 6,023 | | | | 5 | % | | 60.7 | | | 59.4 | | |
| Gross profit | 4,098 | | | | 4,115 | | | | — | % | | 39.3 | | | 40.6 | | |
| Warehousing, marketing and administrative expenses | 3,049 | | | | 2,995 | | | | 2 | % | | 29.3 | | | 29.6 | | |
| Operating earnings | 1,049 | | | | 1,119 | | | | (6 | )% | | 10.1 | | | 11.0 | | |
| Other expense, net | 113 | | | | 100 | | | | 13 | % | | 1.1 | | | 1.0 | | |
| Income taxes | 313 | | | | 386 | | | | (19 | )% | | 3.0 | | | 3.8 | | |
| Net earnings | 622 | | | | 633 | | | | (2 | )% | | 6.0 | | | 6.2 | | |
| Noncontrolling interest | 37 | | | | 27 | | | | 36 | % | | 0.4 | | | 0.3 | | |
| Net earnings attributable to W.W. Grainger, Inc. | $ | 586 | | | $ | 606 | | | (3 | )% | | 5.6 | % | | 6.0 | % | |
2017 Compared to 2016
Grainger's net sales were $10,425 million for 2017, an increase of 3%, when compared with net sales of $10,137 million for the comparable 2016 period.
| Divestiture | (1) |
The increase in net sales was primarily driven by the single channel online businesses in the U.S. and Japan, as well as volume increases in the U.S. business as a result of the pricing actions.
Overview
General.
Grainger’s operations are primarily in the United States (U.S.) and Canada, with a presence in Europe, Asia and Latin America.
Grainger uses a combination of multichannel and single channel business models to provide customers with a range of options for finding and purchasing products utilizing sales representatives, catalogs, direct marketing materials and eCommerce.
Grainger serves approximately 3 million customers worldwide through a network of highly integrated branches, distribution centers and websites.
Grainger’s two reportable segments are the U.S. and Canada.
Business Environment.
| Business Investment | (2.8 | )% | | 3.4 | % | | (2.8 | )% | | 0.7 | % |
| Business Inventory | 1.0 | % | | 0.6 | % | | — | | | — | |
| Exports | 0.4 | % | | 1.9 | % | | 1.0 | % | | 1.9 | % |
| Industrial Production | (1.0 | )% | | 1.4 | % | | (0.5 | )% | | 1.9 | % |
| GDP | 1.6 | % | | 2.3 | % | | 1.3 | % | | 2.1 | % |
Per the Global Insight February 2017 forecast, Business Investment is forecast to improve in 2017 through equipment related spendings as the influence from slow growth abroad and in the United States fades.
Export growth is expected to improve in 2017 as the global economy stabilizes and attracts more capital to the United States.
Per the Global Insight February 2017 forecast, Canada economic growth in 2016 is forecast to continue to remain low but improve in 2017.
For the year, the Canadian economy, as measured by GDP, is forecast to grow to 2.1% in 2017 compared to the 2016 estimate of 1.3%.
The 2017 forecast assumes that oil prices will continue a slow but steady rise and that business nonresidental investment (a component of Business Investment) will begin to increase.
The latest forecast for the Canadian dollar includes further downward adjustments and weakness over the next two years compared to the U.S. dollar.
Outlook.
Grainger plans to continue to make investments in its supply chain, eCommerce capabilities, information systems, sales force productivity tools and inventory management services.
These investments will support the Company’s revenue growth objectives of (i) continuing to grow its share of business with large, complex customers; (ii) creating a unique value proposition to further penetrate the medium customer segment and (iii) further leveraging its eCommerce capabilities to serve smaller customers.
In Canada, the Company took aggressive actions in 2016 that will position the business for long-term sustainable growth and profitability.
These actions, which included business and personnel reorganization, branch closures, ERP and eCommerce investments, should position the Canadian business for growth in 2017 and restore the business to break even by the end of 2017.
On January 25, 2017, Grainger reiterated its 2017 sales and earnings per share guidance issued on November 11, 2016, and continues to expect 2 to 6 percent sales growth and earnings per share of $11.30 to $12.40 for 2017.
| | | | | | | | | | | | | | | | | | | | | | | | | | | |
| --- | --- | --- | --- | --- | --- | --- | --- | --- | --- | --- | --- | --- | --- | --- | --- | --- | --- | --- | --- | --- | --- | --- | --- | --- | --- | --- |
| | |
| --- | --- |
| • | $35 million of restructuring charges primarily in the U.S. and Canadian businesses. |
| • | $52 million of impairment charges for goodwill and intangible assets in Other Businesses. |
| • | $36 million adjustment for unclaimed property in the U.S. business, primarily for the five years 2008 through 2012. |
| • | $9 million increase in the U.S. business reserve related to certain tax, freight and miscellaneous billing issues in connection with the audit of government contracts with the General Services Administration first entered in 1999. |
In 2015, operating expenses included $42 million related to restructuring and other charges primarily in the U.S. and Canadian business.
Operating earnings included the charges noted above.
| Diluted earnings per share reported | $ | 9.87 | | | $ | 11.58 | | (15 | )% |
| Adjustments, pretax (1) | 2.41 | | | | 0.69 | | | | |
| Tax effect (1)(2) | (0.55 | | ) | | (0.24 | | ) | | |
| Subtotal | 1.71 | | | | 0.36 | | | | |
| Diluted earnings per share adjusted | $ | 11.58 | | | $ | 11.94 | | (3 | )% |
(1) Adjustments discussed in detail in Item 6.
An excerpt. Shown here: 40 of 150 rewritten, 40 of 180 added and 40 of 185 removed. The counts are complete. For every sentence, read Item 7. Management’s Discussion and Analysis of Financial Condition and Results of Operations in the FY2017 filing and the FY2016 filing.
Item 7A. Quantitative and Qualitative Disclosures About Market Risk
3 rewritten, 0 added, 6 removed, 8 unchanged
Grainger’s financial results, including the value of assets and liabilities, are exposed to foreign currency exchange rate risk when the financial statements of the [removed: international subsidiaries,] [added: business units,] as stated in their local currencies, are translated into U.S. dollars.
While it is difficult to quantify any particular impact of changes in exchange rates, a uniform 10% strengthening in the U.S. dollar (whereby all other variables are held constant and unusual expense items described in "Item 7: Management's Discussion and Analysis of Financial Condition and Results of Operations" are excluded) would have resulted in an increase in net earnings of [removed: $2] [added: $1] million for the year ended December 31, [removed: 2016,] [added: 2017,] and [removed: a decrease] [added: an increase in net earnings] of [removed: $1] [added: $2] million for the year ended December 31, [removed: 2015.][added: 2016.]
Comparatively, a 10% weakening of the U.S. dollar would have resulted in a decrease in net earnings of $2 million for the year ended December 31, [removed: 2016,] [added: 2017,] and [removed: an increase] [added: a decrease in net earnings] of [removed: $1] [added: $2] million for the year ended December 31, [removed: 2015 .][added: 2016.]
Interest Rates
Grainger is subject to interest rate risk related to its variable rate debt portfolio.
Grainger may enter into interest rate swap agreements to manage those risks.
Based on Grainger's variable rate debt and derivative instruments outstanding, a 1 percentage point increase in interest rates paid by Grainger would have resulted in a decrease to net earnings of approximately $5 million for 2016 and $3 million for 2015.
A 1 percentage point decrease in interest rates would have resulted in an increase to net earnings of approximately $5 million for 2016 and $3 million for 2015.
This sensitivity analysis of the effects of changes in interest rates on long-term debt does not factor in future potential changes in long-term debt levels.
Item 1. Business
66 rewritten, 16 added, 20 removed, 32 unchanged
W.W. Grainger, Inc., incorporated in the State of Illinois in 1928, is a broad [removed: line] [added: line, business-to-business] distributor of maintenance, repair and operating (MRO) supplies and other related products and [removed: services used by businesses and institutions primarily in the United States (U.S.) and Canada, with a presence also in Europe, Asia and Latin America.][added: services.]
Grainger uses a combination of multichannel and single channel online business models to provide [removed: customers] [added: customers, primarily businesses,] with a range of options for finding and purchasing MRO products, utilizing sales representatives, contact centers, [removed: direct marketing materials, catalogs] [added: catalogs, inventory management solutions] and eCommerce technology.
Grainger serves [removed: approximately] [added: more than] 3 million customers worldwide through a network of highly integrated distribution centers, [removed: websites] [added: websites, branches] and [removed: branches.][added: inventory management solutions.]
Products are regularly added to and [removed: deleted] [added: removed] from Grainger's product lines on the basis of customer demand, market research, [removed: recommendations of suppliers,] [added: suppliers' recommendations,] sales volumes and other factors.
Grainger's centralized business support functions provide coordination and guidance in the areas of [added: supply chain, product management,] accounting and finance, [removed: strategy and business development,] [added: strategy,] communications and investor relations, [added: human resources,] compensation and benefits, information systems, health and safety, [removed: global supply chain functions, human resources,] [added: procurement,] risk management, internal audit, legal, real estate, security, tax and treasury.
Other businesses include [removed: Zoro Tools, Inc. (Zoro),] the single channel online [removed: business] [added: businesses Zoro Tools, Inc. (Zoro)] in the [removed: U.S.,] [added: U.S. and] MonotaRO [removed: Co.] [added: Co., Ltd.] (MonotaRO) in Japan and operations in Europe, Asia and Latin America.
These businesses generate revenue through the distribution of MRO supplies and products and [removed: provide] related services.
Products offered include material handling equipment, safety and security supplies, lighting and electrical products, power and hand tools, pumps and plumbing supplies, cleaning and maintenance [removed: supplies, building and home inspection supplies, vehicle and fleet components] [added: supplies] and [removed: many other items primarily focused on the facilities maintenance market.][added: metalworking tools.]
In addition, 22% of [removed: 2016] [added: 2017] sales were private label [added: MRO] items bearing Grainger’s registered trademarks, [removed: such as DAYTON® motors, power transmission, HVAC and material handling equipment, SPEEDAIRE® air compressors,] [added: including DAYTON®, SPEEDAIRE®,] AIR [removed: HANDLER® air filtration equipment,] [added: HANDLER®,] TOUGH [removed: GUY® cleaning products, WESTWARD® tools,] [added: GUY®, WESTWARD®,] CONDOR® [removed: safety products] and [removed: LUMAPRO® lighting products.][added: LUMAPRO®.]
No single supplier comprised more than 5% of total purchases and no significant [removed: difficulty has been encountered] [added: barriers thus far exist] with respect to sources of supply.
The U.S. business operates and fulfills orders in all 50 states [added: and exports to a select number of countries] through a network of distribution centers (DCs), branches and contact centers.
Customers range from small and [removed: medium-sized] [added: mid-sized] businesses to large corporations, government entities and other institutions.
They are primarily represented by purchasing managers or [removed: workers] [added: employees] in facilities maintenance departments and service shops across a wide range of industries such as manufacturing, hospitality, transportation, government, retail, healthcare and [removed: education.][added: natural resources.]
Sales in [removed: 2016] [added: 2017] were made to approximately [removed: 1.1] [added: 1] million customers averaging [removed: 111,000] [added: 113,000] daily transactions.
[removed: Approximately 79% of sales are concentrated with large customers and no] [added: No] single customer accounted for more than [removed: 3%] [added: 4%] of total sales.
These changes in behaviors are reflected in how customers do business with [removed: Grainger] [added: the U.S. business] as demonstrated in the following chart:
[removed: ][added: 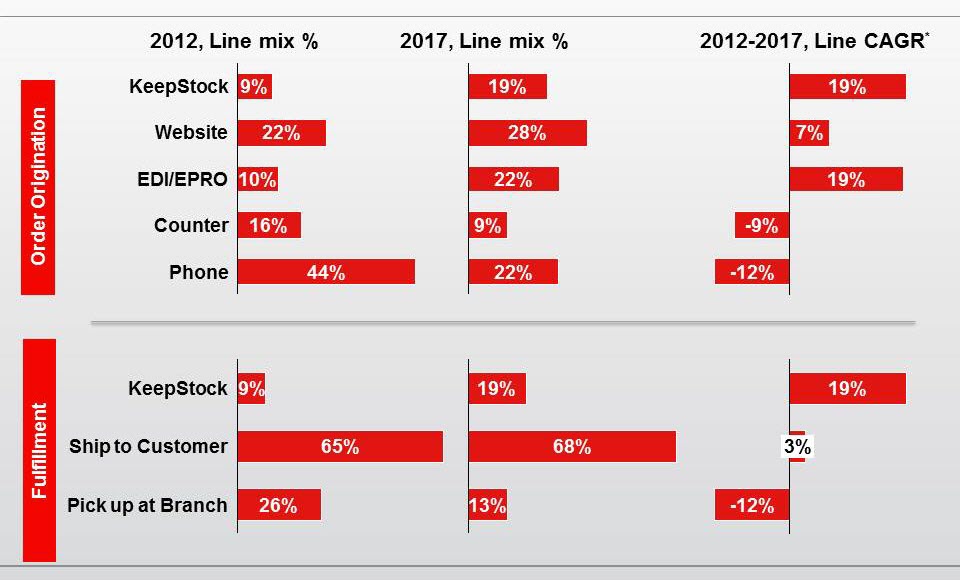]
Customers continue to migrate to [removed: online] [added: web platforms] and electronic purchasing platforms such as [removed: EDI] [added: EDI, eProcurement] and [removed: eProcurement.][added: KeepStock®, the electronic inventory management offering.]
Through Grainger.com and other branded websites, which serve as prominent channels in the U.S. business, customers have access to approximately [removed: 1.9] [added: 2.4] million products.
Grainger.com provides real-time price and product availability and detailed product information and offers [removed: advanced] features such as product search and compare capabilities.
KeepStock® inventory solutions is a comprehensive program that includes vendor-managed inventory, customer-managed inventory and [removed: on-site] [added: onsite] vending machines.
[removed: Grainger's KeepStock] [added: The U.S. business KeepStock®] program currently provides services to [removed: almost 23,000] [added: nearly 20,000] customers [removed: and completed approximately 11,000 installations] [added: and,] in [removed: 2016.][added: 2017, facilitated approximately 9,000 installations.]
As of December 31, [removed: 2016,] [added: 2017,] there were approximately [removed: 59,500] [added: 65,000] total installations.
As of December 31, [removed: 2016,] [added: 2017,] the U.S. business had 284 branches [removed: (254] [added: (251] stand alone, [removed: 28 on-site] [added: 31 onsite] and 2 will-call express locations), [removed: 18] [added: 16] DCs, 3 national contact centers and [removed: 39] [added: 37] regional contact centers, which are located within branches.
DCs [added: in the U.S. business] range in size from [added: approximately] 45,000 square feet to 1.3 million square feet, the largest of which can [removed: stock up to] [added: accommodate more than] 500,000 [added: in-stock] products.
Automated equipment and processes allow [removed: larger] DCs to handle the majority of the customer shipping for next-day product availability and replenish [removed: the] branches that provide [removed: same-day availability.]
The DC network [removed: increasingly] fulfills a [removed: larger] [added: large] portion of customer orders, especially as customers migrate to [removed: online] [added: website] and electronic purchasing.
Branches [added: in the U.S. business] serve the immediate needs of customers in their local markets by allowing them to [added: directly] pick up [removed: items directly.][added: items.]
The branch network has approximately [removed: 1,800] [added: 1,700] employees who primarily fulfill counter and will-call product purchases and provide customer service.
Grainger's contact center network [added: in the U.S. business] consists of approximately [removed: 2,000] [added: 1,900] employees who handle about [removed: 74,000 orders] [added: 70,000 customer interactions] per day [added: including approximately 20,000 orders] via phone, e-mail and fax.
[removed: The] [added: To enable improved customer service, team member engagement and efficiencies, the 37 regional] contact centers [removed: will be consolidating] [added: are currently being consolidated] to 3 national contact centers with expanded work-from-home [removed: arrangements over the next 18 months, which will enable improved customer service, better team member engagement and efficiencies.][added: arrangements.]
The U.S. business has a sales force of approximately [removed: 3,600] [added: 3,500] professionals who help [removed: businesses and institutions] [added: customers] select the right products to find immediate solutions to [removed: maintenance problems] [added: their needs] and reduce [removed: operating expenses] [added: costs] by utilizing Grainger as a consistent source of [removed: supply across multiple locations.][added: supply.]
In [removed: 2016, Grainger] [added: 2017, the U.S. business] continued to focus its outside sales force on facilitating growth with large customers who typically have more complex purchasing requirements than small and [removed: medium-sized] [added: mid-sized] customers.
The Grainger catalog, most recently issued in February [removed: 2017,] [added: 2018,] offers approximately [removed: 383,000] [added: 365,000] MRO products and is used by customers to assist in product selection.
The [removed: 2017] [added: 2018] catalog includes almost [removed: 21,000] [added: 24,000] new items and approximately [removed: 1.1] [added: 1] million copies of the catalog were produced.
Grainger estimates the U.S. market for MRO products to be approximately [removed: $125] [added: $127] billion in [removed: 2016,] [added: 2017,] of which [removed: Grainger’s] [added: the U.S. business] share is approximately 6%.
Acklands – Grainger Inc. [removed: (Acklands – Grainger)] [added: and its subsidiaries (the Canada business)] is Canada’s leading broad line [removed: distributor of industrial and safety supplies.][added: MRO distributor.]
The [removed: Canadian] [added: Canada] business serves customers through branches, sales and service representatives and DCs across Canada.
Approximately [removed: 12,000] [added: 13,000] sales transactions are completed daily.
Customers have access to more than [removed: 152,000] [added: 131,000] stocked products through a comprehensive catalog.
W.W. Grainger, Inc.'s operations are primarily in the United States (U.S.) and Canada, with a presence in Europe, Asia and Latin America.
*CAGR is defined as compound annual growth rate.
same-day availability.
Branch network sales volume has continued to grow throughout 2017.
The U.S. business primarily utilizes a network of inside sellers and digital channels to meet the needs of small and mid-sized customers.
As of December 31, 2017, the Canada business had 91 branches and 6 DCs.
Zoro offers a broad selection of more than 1 million products.
MonotaRO provides customers with MRO products primarily through its catalogs and websites.
MonotaRO fulfills the majority of orders from three DCs.
In November 2017, Cromwell launched a new brand and website Zoro.co.uk and its customer orders are primarily fulfilled through the Cromwell business supply chain.
As of December 31, 2017, Fabory had 44 branches in 13 countries and two DCs.
Customers have access to approximately 330,000 products through a Spanish-language catalog and through Grainger.com.mx.
Grainger has several large competitors and continues to be highly competitive against the predominant number of small local and regional competitors.
In addition, the public may read and copy any materials the Company files with the SEC at the SEC's Public Reference Room at 100 F Street, NE, Washington D.C. 20549.
The public may obtain information on the operation of the Public Reference Room by calling the SEC at (800) SEC-0330.
The SEC maintains a website that contains reports, proxy and information statements and other information regarding issuers that file electronically with the SEC and the address of that site is http://www.sec.gov.
In 2016, service fee revenue represented less than 1% of sales.
Grainger sells these items primarily under the private label brands listed above.
eCommerce revenues in the U.S. were $3.7 billion in 2016, an increase of 12% versus 2015, and represented 46% of total revenues.
If the Company included KeepStock®, the electronic inventory management offering, total eCommerce and KeepStock® revenue for the U.S. business would represent 57% of total sales.
Due to the customer migration to online and electronic purchasing, Grainger initiated a restructuring that resulted in the closing of 49 branches in 2015 and 55 branches in 2016.
Grainger completed the construction of a new 1.3 million square-foot DC in New Jersey and began operations in 2016.
To meet the needs of the medium-sized customers, Grainger added approximately 260 inside sellers during 2016 with a plan to add 115 in the second half of 2017.
The business initiated a restructuring in 2015 in response to the decline in oil prices and the resultant weak economy and low MRO market growth.
The restructuring resulted in the closure of 16 branches in 2015 and an additional 14 branches in 2016.
As of December 31, 2016, Acklands – Grainger had 151 branches and 5 DCs.
The most recent catalog, printed in both English and French, was issued in February 2017.
Zoro serves Canadian customers through ZoroCanada.com via export from the U.S. Zoro offers a broad selection of more than one million products at single, competitive prices.
MonotaRO provides small and mid-sized Japanese businesses with products that help them operate and maintain their facilities.
MonotaRO predominantly fulfills all orders from three DCs, the largest of which is a 425,000 square-foot DC in the Osaka area.
MonotaRO is currently building a 590,000 square-foot DC in the Tokyo area, which it plans to put into operation in April
2017.
As of December 31, 2016, Fabory has 70 branches in 13 countries.
Grainger believes that it can effectively compete with manufacturers on small orders, but manufacturers may have an advantage in filling large orders.
There are several large competitors, although the majority of the market is served by small local and regional competitors.
This material may be accessed by visiting www.grainger.com/investor.
An excerpt. Shown here: 40 of 66 rewritten, all 16 added and all 20 removed. The counts are complete. For every sentence, read Item 1. Business in the FY2017 filing and the FY2016 filing.
Item 3. Legal Proceedings
1 rewritten, 0 added, 5 removed, 0 unchanged
For a description of [removed: other] legal proceedings, see [added: the disclosure contained in] Note 17 to the Consolidated Financial Statements included [removed: under] [added: in "Part II,] Item [removed: 8.][added: 8: Financial Statements and Supplementary Data" of this report, which is incorporated herein by reference.]
Environmental Matters
As previously disclosed, on August 5, 2015, Environment Canada initiated a proceeding against the Company’s Canadian subsidiary, Acklands-Grainger, in the Provincial Court of Alberta seeking monetary sanctions based on allegations that Acklands-Grainger sold certain products containing an ozone-depleting substance in violation of the Canadian Environmental Protection Act, 1999 and prohibited by the Ozone-Depleting Substances Regulations, 1998.
On December 12, 2016, as part of a negotiated plea agreement, Acklands-Grainger pleaded guilty in the Provincial Court of Alberta to two counts of violating the Ozone-Depleting Substances Regulations and agreed to pay a fine of C$500,000.
Acklands-Grainger intends to seek indemnification from the suppliers that sold Acklands-Grainger the products in question.
Other Matters
Cover and table of contents
24 rewritten, 3 added, 2 removed, 60 unchanged
For the fiscal year ended December 31, [removed: 2016][added: 2017]
The aggregate market value of the voting common equity held by nonaffiliates of the registrant was [removed: $12,999,003,606] [added: $9,747,864,843] as of the close of trading as reported on the New York Stock Exchange on June 30, [removed: 2016.][added: 2017.]
The registrant had [removed: 58,837,353] [added: 56,105,411] shares of the Company’s Common Stock outstanding as of January 31, [removed: 2017.][added: 2018.]
Portions of the [added: registrant's definitive] proxy statement [removed: relating] to [added: be filed in connection with] the annual meeting of shareholders [removed: of the registrant] to be held on April [removed: 26, 2017,] [added: 25, 2018,] are incorporated by reference into Part III [removed: hereof.][added: hereof of this Form 10-K where indicated the definitive 2018 proxy statement will be filed on or about March 15, 2018.]
| Item 1: | BUSINESS | | | | | [removed: [3](#s4D029798FA845EAA8A0B7A8A1C6869E9)] [added: [3](#s88A9D75667CA5A2082941043B1A3B423)] |
| Item 1A: | RISK FACTORS | | | | | [removed: [7](#s35BE5104F7C251E88B43585FEB4C8001)] [added: [7](#sAE29AB392A3C53EDA10FFB4277AE4D1F)] |
| Item 1B: | UNRESOLVED STAFF COMMENTS | | | | | [removed: [10](#sE9C1734F020F5113A25D8B4D6796EFDF)] [added: [11](#sDB91599EC5DE593DA37DD4460AEE660C)] |
| Item 2: | PROPERTIES | | | | | [removed: [11](#s7E842C672805508C924BDCD1EFDFE56E)] [added: [11](#sD6D54F80BC1D5832B99F77DB4E242F1B)] |
| Item 3: | LEGAL PROCEEDINGS | | | | | [removed: [11](#sFB6DE94C680B59A1A43CEFC8665D2A7A)] [added: [11](#s8EBEA5B9BEE952EE81C39CF51D091058)] |
| Item 4: | MINE SAFETY DISCLOSURES | | | | | [removed: [11](#sC632F38751865BBE8822176D7ABDDAEB)] [added: [11](#s7A883BC45AB95823A523886EF0B517C6)] |
| Item 5: | MARKET FOR REGISTRANT'S COMMON EQUITY, RELATED SHAREHOLDER | | | | | [removed: [12](#s20872F22344559F9AB78F8D83D69B3F5)] [added: [13](#sBD586AB76A5E55C4A73C461FAD896524)] |
| Item 6: | SELECTED FINANCIAL DATA | | | | | [removed: [14](#s188EFE057546504CB6FDB2B213DC3991)] [added: [15](#s1A930BBABBB85BD3AB49E55098BD69F1)] |
| Item 7: | MANAGEMENT'S DISCUSSION AND ANALYSIS OF FINANCIAL | | | | | [removed: [16](#s3E58F26AF451569AB12C59498328D8CB)] [added: [16](#s76D611EA938F5ED6841837D5A84C972D)] |
| Item 7A: | QUANTITATIVE AND QUALITATIVE DISCLOSURES ABOUT MARKET RISK | | | | | [removed: [33](#sCFB7EF6F0D9C5519A47751A17DD68F22)] [added: [31](#s41E6EEED1E1C580EB8C6236C209DEC57)] |
| Item 8: | FINANCIAL STATEMENTS AND SUPPLEMENTARY DATA | | | | | [removed: [34](#sC68ECDB8E4AC5A96896D25FA79CD5D77)] [added: [31](#s940E60B3FA4F5A03A92EEB2BD6B147D9)] |
| Item 9: | CHANGES IN AND DISAGREEMENTS WITH ACCOUNTANTS | | | | | [removed: [34](#sC237465C3DFC5358BFA93109CF87CA2A)] [added: [31](#sA4F1976673E05DE6BB760350932CB98C)] |
| Item 9A: | CONTROLS AND PROCEDURES | | | | | [removed: [34](#sC81404A29FAF548BA6195F921AB0CB06)] [added: [32](#sF907CE4DCD5E572C8C9C5AAAA87848D0)] |
| Item 9B: | INFORMATION REQUIRED TO BE DISCLOSED IN A FORM 8-K | | | | | [removed: [34](#s1F74D77EF4445A2388FC7B0F5CA2D604)] [added: [32](#s14EDDD9E0DF25F98B09581A232626FAB)] |
| Item 10: | DIRECTORS, EXECUTIVE OFFICERS AND CORPORATE GOVERNANCE | | | | | [removed: [35](#s407EF683E8645DE790E57792FCB22761)] [added: [33](#s4A25A80C77135CDBAD05FD054B1ABE14)] |
| Item 11: | EXECUTIVE COMPENSATION | | | | | [removed: [36](#s42E63D9D7FF551BFACCABB5A74C1828E)] [added: [33](#sDD12B9721BF1508A9D28FF23925488EF)] |
| Item 12: | DIRECTORS AND EXECUTIVE OFFICERS | | | | | [removed: [36](#sE9E1AC5920635C2792BEBA93F4F8542C)] [added: [33](#s5ACA7191030A59E99CFA7976C622A570)] |
| Item 13: | CERTAIN RELATIONSHIPS AND RELATED TRANSACTIONS | | | | | [removed: [36](#s672660FF64F454DC8409AC60D48B700B)] [added: [33](#s3D787EF3763A50D4AB2D84A30BBC509B)] |
| Item 14: | PRINCIPAL ACCOUNTANT FEES AND SERVICES | | | | | [removed: [36](#sAE53856DF25A5D7D963D1BC767260C45)] [added: [33](#s30A59F12890B5A5FA64D56E755D445F3)] |
| Item 15: | EXHIBITS AND FINANCIAL STATEMENT SCHEDULES | | | | | [removed: [36](#sF0787EC8A7515765BD6E814F73132E7E)] [added: [34](#s611257D2705E5ACB9B2932E716E6DFFC)] |
10-K 1 gww20171231-10k.htm 10-K
| Item 4A: | EXECUTIVE OFFICERS OF THE REGISTRANT | | | | | [12](#sd780a5b8f4b240cb96f3c91043783e36) |
| Signatures | | | | | | [76](#sA2B46655D64B56FAA73336CDCC6050D7) |
10-K 1 gww20161231-10k.htm 10-K
| Signatures | | | | | | [79](#sE0B11EC179575507A962EA4794DDBF11) |
Item 2. Properties
12 rewritten, 2 added, 1 removed, 11 unchanged
As of December 31, [removed: 2016,] [added: 2017,] Grainger’s owned and leased facilities totaled approximately [removed: 29.3] [added: 28.2] million square feet.
| Location | | Facility and Use (6) | | Size in Square Feet (in [removed: 000's)] [added: 000s)] | |
| U.S. (1) | | 284 U.S. branch locations | | [removed: 6,477] [added: 6,367] | |
| U.S. (2) | | [removed: 18 Distribution Centers] [added: 16 distribution centers] | | [removed: 8,721] [added: 8,169] | |
| U.S. (3) | | Other facilities | | [removed: 4,846] [added: 3,685] | |
| Other [removed: Businesses] [added: businesses] (5) | | Other facilities | | [removed: 4,771] [added: 5,624] | |
| Chicago [removed: Area] [added: area] (2) | | Headquarters and [removed: General Offices] [added: general offices] | | [removed: 1,226] [added: 1,188] | |
| | | Total Square Feet | | [removed: 29,325] [added: 28,180] | |
| (1) | Consists of [removed: 211] [added: 204] owned and [removed: 73] [added: 80] leased properties located throughout the U.S. ranging in size from approximately [removed: 1,000] [added: 500] to 109,000 square feet. |
| (2) | These facilities are primarily owned and [removed: they] range in size from approximately 45,000 square feet to 1.3 million square feet. |
| (3) | These facilities include both owned and leased locations, [added: primarily] consisting of storage facilities, office space, call centers and [removed: idle] [added: other] properties. |
| (4) | Consists of general offices, distribution centers and branches located throughout Canada, of which [removed: 66] [added: 58] are owned and [removed: 93] [added: 81] leased. |
| Canada (4) | | 139 facilities | | 3,147 | |
Grainger continues to evaluate its physical footprint and announced throughout 2017 the intention to close 113 branches in the Canada business.
| Canada (4) | | 159 Acklands – Grainger facilities | | 3,284 | |
Item 4. Mine Safety Disclosures
0 rewritten, 0 added, 1 removed, 1 unchanged
PART II
Item 4A. Executive Officers of the Registrant
0 rewritten, 14 added, 0 removed, 0 unchanged
New section this year
Following is information about the Executive Officers of Grainger including age as of February 26, 2018.
Executive Officers of Grainger generally serve until the next annual election of officers, or until earlier resignation or removal.
| | |
| --- | --- |
| | |
| Name and Age | Positions and Offices Held and Principal Occupation and Employment During the Past Five Years |
| Laura D. Brown (54) | Senior Vice President, Communications and Investor Relations, a position assumed in 2010 after serving as Vice President, Global Business Communications, a position assumed in 2009 and Vice President, Investor Relations, a position assumed in 2008. |
| Joseph C. High (63) | Senior Vice President and Chief People Officer, a position assumed in June 2011. Prior to joining Grainger, Mr. High was the Senior Vice President of Human Resources at Owens Corning in Toledo, Ohio, a position assumed in 2004. |
| John L. Howard (60) | Senior Vice President and General Counsel, a position assumed in 2000. |
| Ronald L. Jadin (57) | Senior Vice President and Chief Financial Officer, a position assumed in 2008. Previously, Mr. Jadin served as Vice President and Controller, a position assumed in 2006 after serving as Vice President, Finance. On July 19, 2017, Mr. Jadin announced that he planned to retire from the Company at the end of 2017. Mr. Jadin has agreed to continue serving the Company in his current position as Senior Vice President and Chief Financial Officer until the transition to his successor is completed later in 2018. |
| D.G. Macpherson (50) | Chairman of the Board, a position assumed in October 2017, and Chief Executive Officer, a position assumed in October 2016 at which time he was also appointed to the Board of Directors. Previously, Mr. Macpherson served as Chief Operating Officer, a position assumed in 2015; Senior Vice President and Group President, Global Supply Chain and International, a position assumed in 2013; Senior Vice President and President, Global Supply Chain and Corporate Strategy, a position assumed in 2012, and Senior Vice President, Global Supply Chain, a position assumed in 2008. |
| Paige K. Robbins (49) | Senior Vice President, Grainger Chief Digital Officer, a position assumed in September 2017. Previously, Ms. Robbins served as Senior Vice President, Global Supply Chain, Branch Network, Contact Centers and Corporate Strategy, a position assumed in 2016. Since joining Grainger in September 2010, Ms. Robbins has held various positions as a Vice President, including in the areas of Global Supply Chain and Logistics. |
| Eric R. Tapia (41) | Vice President and Controller, a position assumed in 2016. Previously, Mr. Tapia served as Vice President, Internal Audit from 2010 to 2016. Mr. Tapia is a Certified Public Accountant (CPA) and before joining Grainger in 2010 was an audit partner with KPMG. |
PART II
Item 5. Market for Registrant’s Common Equity, Related Shareholder Matters and Issuer Purchases of Equity Securities
10 rewritten, 12 added, 13 removed, 30 unchanged
Grainger's common stock is listed [added: and traded] on the New York Stock Exchange, [removed: with] [added: under] the [removed: ticker] symbol GWW.
The high and low sales prices for the common stock and the dividends declared and paid per share for each calendar quarter during [removed: 2016] [added: 2017] and [removed: 2015] [added: 2016] are shown below.
The approximate number of shareholders of record of Grainger’s common stock as of [removed: January 31, 2017,] [added: February 7, 2018,] was [removed: 720] [added: 688] with approximately [removed: 218,500] [added: 150,934] additional shareholders holding stock through nominees.
| (A) | [removed: There were no] [added: 85] shares [added: were] withheld to satisfy tax withholding obligations in connection with the vesting of employee restricted stock awards. |
| (C) | Purchases were made pursuant to a share repurchase program approved by Grainger's Board of Directors. [added: This plan was announced on April 16, 2015, for 15 million shares with no expiration date.] Activity is reported on a trade date basis. |
It covers the period commencing December 31, [removed: 2011,] [added: 2012,] and ending December 31, [removed: 2016.][added: 2017.]
The graph assumes that the value for the investment in Grainger common stock and in each index was $100 on December 31, [removed: 2011,] [added: 2012,] and that all dividends were reinvested.
[removed: ][added: 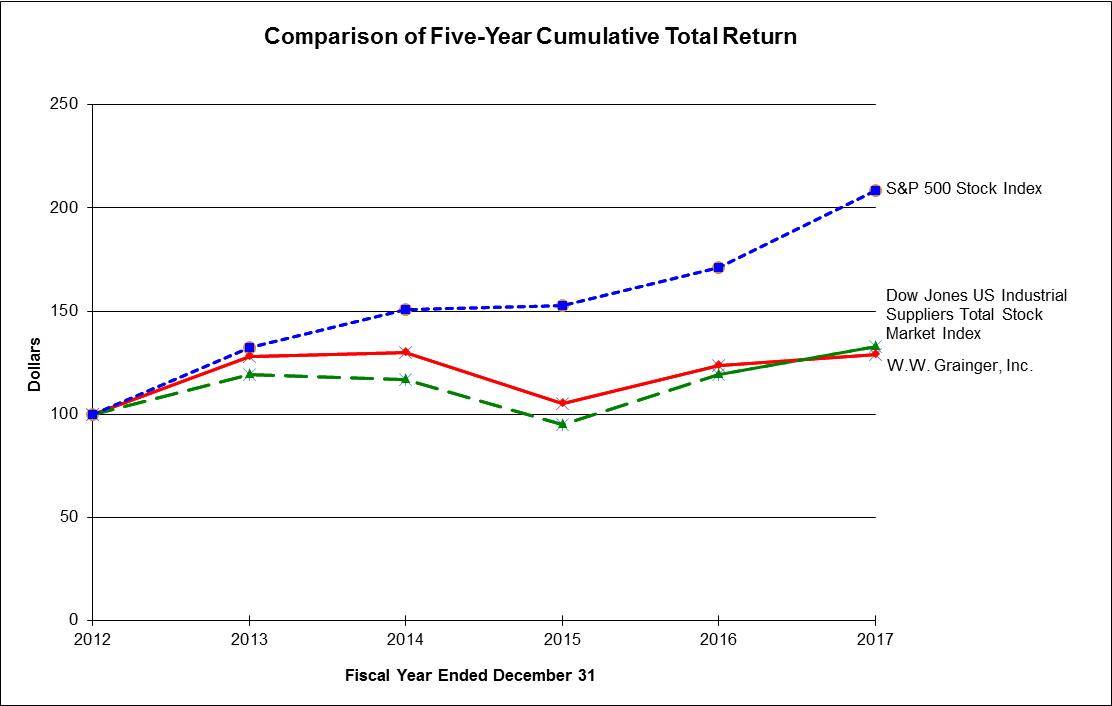]
| | [removed: 2011 | | |] 2012 | | | 2013 | | | 2014 | | | 2015 | | | 2016 | | | [added: 2017 | | |]
| Dow Jones US Industrial Suppliers Total Stock Market Index | 100 | | | [removed: 113] [added: 119] | | | [removed: 135] [added: 117] | | | [removed: 132] [added: 95] | | | [removed: 107] [added: 119] | | | [removed: 134] [added: 133] | | |
| | | Market Price Per Share | | | | | | | | | | |
| 2017 | First | $ | 262.72 | | | $ | 229.05 | | | $ | 1.22 | |
| | Second | 234.66 | | | | 168.58 | | | | 1.28 | | |
| | Third | 185.82 | | | | 155.00 | | | | 1.28 | | |
| | Fourth | 240.49 | | | | 166.46 | | | | 1.28 | | |
| | Year | $ | 262.72 | | | $ | 155.00 | | | $ | 5.06 | |
| Oct. 1 – Oct. 31 | 206,586 | $185.37 | 206,586 | 3,506,481 | | shares |
| Nov. 1 – Nov. 30 | 237,397 | $199.91 | 237,397 | 3,269,084 | | shares |
| Dec. 1 – Dec. 31 | 410,679 | $227.94 | 410,679 | 2,858,405 | | shares |
| Total | 854,662 | $209.86 | 854,662 | | | |
| W.W. Grainger, Inc. | $ | 100 | | $ | 128 | | $ | 130 | | $ | 105 | | $ | 124 | | $ | 129 | |
| S&P 500 Stock Index | 100 | | | 132 | | | 151 | | | 153 | | | 171 | | | 208 | | |
Effective January 1, 2015, Grainger voluntarily delisted its common stock from the Chicago Stock Exchange to eliminate duplicative administrative requirements.
| | | Prices | | | | | | | | | | |
| 2015 | First | $ | 256.97 | | | $ | 228.15 | | | $ | 1.08 | |
| | Second | 252.87 | | | | 228.05 | | | | 1.17 | | |
| | Third | 240.00 | | | | 194.42 | | | | 1.17 | | |
| | Fourth | 233.00 | | | | 189.60 | | | | 1.17 | | |
| | Year | $ | 256.97 | | | $ | 189.60 | | | $ | 4.59 | |
| Oct. 1 – Oct. 31 | 306,313 | $212.89 | 306,313 | 6,367,978 | | shares |
| Nov. 1 – Nov. 30 | 239,007 | $216.57 | 239,007 | 6,128,971 | | shares |
| Dec. 1 – Dec. 31 | 270,264 | $236.75 | 270,264 | 5,858,707 | | shares |
| Total | 815,584 | $221.87 | 815,584 | | | |
| W.W. Grainger, Inc. | $ | 100 | | $ | 110 | | $ | 141 | | $ | 143 | | $ | 116 | | $ | 136 | |
| S&P 500 Stock Index | 100 | | | 116 | | | 154 | | | 175 | | | 177 | | | 198 | | |
Item 6. Selected Financial Data
19 rewritten, 5 added, 10 removed, 17 unchanged
| | [removed: 2016] [added: 2017] | | | | [removed: 2015] [added: 2016] | | | | [removed: 2014] [added: 2015] | | | | [removed: 2013] [added: 2014] | | | | [removed: 2012] [added: 2013] | | |
| Net sales | $ | [removed: 10,137,204] [added: 10,424,858] | | | $ | [removed: 9,973,384] [added: 10,137,204] | | | $ | [removed: 9,964,953] [added: 9,973,384] | | | $ | [removed: 9,437,758] [added: 9,964,953] | | | $ | [removed: 8,950,045] [added: 9,437,758] | |
| Net earnings attributable to W.W. Grainger, Inc. [added: (herein referred to as Net earnings)] | [removed: 605,928] [added: 585,730] | | | | [removed: 768,996] [added: 605,928] | | | | [removed: 801,729] [added: 768,996] | | | | [removed: 797,036] [added: 801,729] | | | | [removed: 689,881] [added: 797,036] | | |
| Net earnings per basic share | [removed: 9.94] [added: 10.07] | | | | [removed: 11.69] [added: 9.94] | | | | [removed: 11.59] [added: 11.69] | | | | [removed: 11.31] [added: 11.59] | | | | [removed: 9.71] [added: 11.31] | | |
| Net earnings per diluted share | [removed: 9.87] [added: 10.02] | | | | [removed: 11.58] [added: 9.87] | | | | [removed: 11.45] [added: 11.58] | | | | [removed: 11.13] [added: 11.45] | | | | [removed: 9.52] [added: 11.13] | | |
| Total assets | [removed: 5,694,307] [added: 5,804,254] | | | | [removed: 5,857,755] [added: 5,694,307] | | | | [removed: 5,283,049] [added: 5,857,755] | | | | [removed: 5,266,328] [added: 5,283,049] | | | | [removed: 5,014,598] [added: 5,266,328] | | |
| Long-term debt (less current maturities) and other long-term liabilities | [removed: 2,159,602] [added: 2,469,860] | | | | [removed: 1,716,507] [added: 2,159,602] | | | | [removed: 737,232] [added: 1,716,507] | | | | [removed: 743,702] [added: 737,232] | | | | [removed: 817,229] [added: 743,702] | | |
| Cash dividends paid per share | $ | [removed: 4.83] [added: 5.06] | | | $ | [removed: 4.59] [added: 4.83] | | | $ | [removed: 4.17] [added: 4.59] | | | $ | [removed: 3.59] [added: 4.17] | | | $ | [removed: 3.06] [added: 3.59] | |
Net earnings for 2016 included a net expense of $105 [removed: million, or $1.71 per share,] [added: million primarily] consisting of the following:
| • | Restructuring: A net charge of $26 [removed: million, or $0.43 after-tax earnings per share expense] [added: million] related to restructuring actions. These actions primarily included branch closures, net of gains on sale of branch real estate in the [removed: United States (U.S.)] [added: U.S.] and [removed: Canadian] [added: Canada] businesses. |
| • | Goodwill and intangible impairments: [removed: A non-cash] [added: An] impairment charge of $52 [removed: million, or $0.85 after-tax earning per share,] [added: million] related to goodwill and intangible impairments in [removed: Other Businesses.] [added: other businesses.] |
| • | Unclaimed property contingency: A charge of $23 [removed: million, or $0.37 after-tax earnings per share,] [added: million] related to an adjustment for unclaimed property in the U.S. business primarily related to activity from 2008 through 2012. |
| • | [removed: General Services Administration (GSA)] [added: GSA] contingency: [removed: An expense] [added: A charge] of $6 [removed: million, or $0.09 after-tax earnings per share,] [added: million] to increase the U.S. business reserve for certain tax, freight and miscellaneous billing issues in connection with the audit of government contracts with the GSA first entered in 1999. |
| • | Inventory adjustment: A charge of $7 [removed: million, or $0.12 after-tax earnings per share,] [added: million] related to an inventory adjustment in the [removed: Canadian] [added: Canada] business to reflect [removed: on] [added: an] updated reserve methodology and better visibility to inventory performance provided by the conversion to the U.S. ERP system. |
| • | Discrete tax items: A [added: net] benefit of $9 [removed: million, or $0.15 earnings per share,] [added: million] related to the conclusion of the federal income tax audit for the years 2009 through 2012 in the U.S. business and other discrete tax items. |
Net earnings for 2015 included a [removed: $0.33 per share expense] [added: net charge of $30 million primarily composed of a $25 million net charge] related to [added: the] reorganization in the U.S. [removed: business] and [removed: at the corporate office, a $0.05 per share expense related to reorganization in the Canadian business] [added: Canada businesses] and a [removed: $0.07 per share expense] [added: $5 million charge] for restructuring in [removed: Other Businesses.][added: other businesses.]
Net earnings for 2014 included a [removed: $0.40 per share expense] [added: net charge of $56 million primarily composed of a $28 million charge] related to closing of the business in Brazil, a [removed: $0.15 per share non-cash] [added: $10 million] charge due to the retirement plan transition in [removed: Europe and] [added: Europe,] a [removed: $0.15 per share expense] [added: $10 million charge] related to restructuring [added: of] the business in [removed: Europe.][added: Europe and a $8 million charge related to a goodwill impairment charge in other businesses.]
Grainger completed several acquisitions [removed: for] [added: in] the years [removed: presented above,] [added: 2013 through 2015,] all of which were immaterial individually and in the aggregate.
For further information see [removed: “Item] [added: “Part II, Item] 7: Management's Discussion and Analysis of Financial Condition and Results of [removed: Operations.”][added: Operations” of this report, which is incorporated herein by reference.]
| Total shareholders' equity | $ | 1,827,733 | | | $ | 1,905,768 | | | $ | 2,352,714 | | | $ | 3,284,101 | | | $ | 3,326,836 | |
The items discussed below are considered to materially affect the comparability of the information reflected in the selected financial data.
Net earnings for 2017 included a net expense of $84 million primarily consisting of a net charge of $102 million related to restructuring and other charges primarily consisting of branch closures in the U.S. and Canada businesses, net of gains on sale of branch real estate in the U.S., the consolidation of the contact center network in the U.S. and the wind-down of operations in Colombia, which is part of other businesses.
This was partially offset by the net benefit of $15 million related to U.S. tax legislation and other discrete tax items and a net benefit of $3 million related to General Services Administrative (GSA) and unclaimed property reserves.
Net earnings for 2013 included a net charge of $28 million primarily composed of $21 million in impairment charges in other businesses primarily for goodwill and a $7 million charge related to restructuring the businesses in Europe and China.
Results also included a $0.09 per share benefit primarily related to revaluation of deferred tax liabilities resulting from tax law changes in the United Kingdom.
When combined, these items had a net expense effect of $0.36 per share.
Results also included a $0.11 per share expense related to a non-cash goodwill impairment charge in Other Businesses.
When combined, these items had a net expense effect of $0.81 per share.
Net earnings for 2013 included a $0.29 per share expense related to non-cash impairment charges in Other Businesses, primarily for goodwill.
Results also included a $0.10 per share expense related to restructuring the businesses in Europe and China.
When combined, these items had a net expense effect of $0.39 per share.
Net earnings for 2012 included a $0.66 per share expense related to the settlement of disputes involving the GSA and United States Postal Service (USPS) contracts in the U.S. business.
Results also included a $0.18 per share expense related to restructuring the businesses in Europe, India and China; a $0.04 per share expense due to a non-cash impairment charge in the U.S. business and a $0.03 per share expense related to U.S. branch closures.
When combined, these items had a net expense effect of $0.91 per share.
Item 8. Financial Statements and Supplementary Data
2 rewritten, 0 added, 0 removed, 0 unchanged
The financial statements and supplementary data are included on pages [removed: 39] [added: 37] to [removed: 80.][added: 77.]
See the Index to Financial Statements and Supplementary Data on page [removed: 38.][added: 36.]
Item 9A. Controls and Procedures
2 rewritten, 0 added, 0 removed, 14 unchanged
Management's report on Grainger's internal control over financial reporting is included on page [removed: 39] [added: 37] of this Report under the heading Management's Annual Report on Internal Control Over Financial Reporting.
The report from Ernst & Young LLP on its audit of the effectiveness of Grainger's internal control over financial reporting as of December 31, [removed: 2016,] [added: 2017,] is included on page [removed: 40] [added: 38] of this Report under the heading Report of Independent Registered Public Accounting Firm.
Item 10. Directors, Executive Officers and Corporate Governance
1 rewritten, 0 added, 14 removed, 5 unchanged
The information required by this item is incorporated by reference to Grainger's proxy statement relating to the annual meeting of shareholders to be held April [removed: 26, 2017,] [added: 25, 2018,] under the captions “Directors,” “Board of Directors and Board Committees” and “Section 16(a) Beneficial Ownership Reporting Compliance.” Information required by this item regarding executive officers of Grainger is set forth below under the caption “Executive Officers.”
Executive Officers
Following is information about the Executive Officers of Grainger including age as of March 1, 2017.
Executive Officers of Grainger generally serve until the next annual election of officers, or until earlier resignation or removal.
| | |
| --- | --- |
| Name and Age | Positions and Offices Held and Principal Occupation and Employment During the Past Five Years |
| Laura D. Brown (53) | Senior Vice President, Communications and Investor Relations, a position assumed in 2010 after serving as Vice President, Global Business Communications, a position assumed in 2009 and Vice President, Investor Relations, a position assumed in 2008. |
| Joseph C. High (62) | Senior Vice President and Chief People Officer, a position assumed in June 2011. Prior to joining Grainger, Mr. High was the Senior Vice President of Human Resources at Owens Corning in Toledo, Ohio, a position assumed in 2004. |
| John L. Howard (59) | Senior Vice President and General Counsel, a position assumed in 2000. |
| Ronald L. Jadin (56) | Senior Vice President and Chief Financial Officer, a position assumed in 2008. Previously, Mr. Jadin served as Vice President and Controller, a position assumed in 2006 after serving as Vice President, Finance. |
| D.G. Macpherson (49) | Chief Executive Officer, a position assumed in October 2016. Previously, Mr. Macpherson served as Chief Operating Officer, a position assumed in 2015; Senior Vice President and Group President, Global Supply Chain and International, a position assumed in 2013; Senior Vice President and President, Global Supply Chain and Corporate Strategy, a position assumed in 2012, and Senior Vice President, Global Supply Chain, a position assumed in 2008. |
| Paige K. Robbins (48) | Senior Vice President, Global Supply Chain, Branch Network, Contact Centers and Corporate Strategy, a position assumed in 2016. Since joining Grainger in September 2010, Ms. Robbins has held various positions as a Vice President, including in the areas of Global Supply Chain and Logistics. |
| James T. Ryan (58) | Chairman of the Board, a role held since April 2009. Mr. Ryan also served as President and Chief Executive Officer of Grainger from June 2008 through September 2016. |
| Eric R. Tapia (40) | Vice President and Controller, a position assumed in 2016. Previously, Mr. Tapia served as Vice President, Internal Audit from 2010 to 2016. Mr. Tapia is a Certified Public Accountant (CPA) and before joining Grainger in 2010 was an audit partner with KPMG. |
Item 11. Executive Compensation
1 rewritten, 0 added, 0 removed, 0 unchanged
The information required by this item is incorporated by reference to Grainger's proxy statement relating to the annual meeting of shareholders to be held April [removed: 26, 2017,] [added: 25, 2018,] under the captions “Board of Directors and Board Committees,” “Director Compensation,” “Report of the Compensation Committee of the Board” and “Compensation Discussion and Analysis.”
Item 12. Directors and Executive Officers
1 rewritten, 0 added, 0 removed, 0 unchanged
The information required by this item is incorporated by reference to Grainger's proxy statement relating to the annual meeting of shareholders to be held April [removed: 26, 2017,] [added: 25, 2018,] under the captions “Ownership of Grainger Stock” and “Equity Compensation Plans.”
Item 13. Certain Relationships and Related Transactions
1 rewritten, 0 added, 0 removed, 0 unchanged
The information required by this item is incorporated by reference to Grainger's proxy statement relating to the annual meeting of shareholders to be held April [removed: 26, 2017,] [added: 25, 2018,] under the captions "Election of Directors" and "Transactions with Related Persons."
Item 14. Principal Accountant Fees and Services
1 rewritten, 0 added, 0 removed, 1 unchanged
The information required by this item is incorporated by reference to Grainger's proxy statement relating to the annual meeting of shareholders to be held April [removed: 26, 2017,] [added: 25, 2018,] under the caption “Audit Fees and Audit Committee Pre-Approval Policies and Procedures.”
Item 15. Exhibits and Financial Statements Schedules
487 rewritten, 314 added, 265 removed, 704 unchanged
| (1) | Financial Statements: see [removed: Item 8, “Financial] [added: "Item 8: Financial] Statements and Supplementary [removed: Data,”] [added: Data,"] on page [removed: 38] [added: 36] hereof, for a list of financial statements. Management's Annual Report on Internal Control Over Financial Reporting. |
| (3) | Exhibits Required by Item 601 of Regulation S-K: the information required by this Item 15(a)(3) of Form 10-K is set forth on the Exhibit Index that follows the Signatures page [added: 77] of the Form 10-K. |
December 31, [removed: 2016, 2015] [added: 2017, 2016] and [removed: 2014][added: 2015]
| MANAGEMENT'S ANNUAL REPORT ON INTERNAL CONTROL OVER FINANCIAL REPORTING | [removed: [38](#s23C60AAF92C15FD6999C5F8EB4A7FF2E)] [added: [36](#sBE8FAB2373325EF1B981858AD55E7B2F)] |
| REPORTS OF INDEPENDENT REGISTERED PUBLIC ACCOUNTING FIRM | [removed: [39](#s088E1EBADBE853D29036500398EC01DC)] [added: [37](#s7CED99EC69C15A1D8BDF0B9F5155FC8D)] |
| CONSOLIDATED STATEMENTS OF EARNINGS | [removed: [41](#s55E5A9E2933F56E5AB00C918E6E7E7E5)] [added: [39](#s80BEF605DE445BE7899DF8D03584F78E)] |
| CONSOLIDATED STATEMENTS OF COMPREHENSIVE EARNINGS | [removed: [42](#s8EA46EE6141F54E0AE776387D40D63AB)] [added: [40](#s4EB976A8755350DD894B8FC924EF1999)] |
| CONSOLIDATED BALANCE SHEETS | [removed: [43](#s68D87B2C8E3C591C855D87C447836A71)] [added: [41](#s997DB84BF9845DFABF7262A99BF7AD16)] |
| CONSOLIDATED STATEMENTS OF CASH FLOWS | [removed: [45](#sB835420C4C0A5ED183C1C4D764F1F685)] [added: [42](#s62F02945E38A536C9F8F4CD22ABF1975)] |
| CONSOLIDATED STATEMENTS OF SHAREHOLDERS' EQUITY | [removed: [46](#s3692DF16BE19547BB76C14E14BCC48D6)] [added: [43](#s8BE49EE0235D5C68BE57647FEEE34259)] |
| NOTES TO CONSOLIDATED FINANCIAL STATEMENTS | [removed: [48](#s87907154DBE354DDAE81308317D55DC6)] [added: [44](#sE1D11362EBCF5B1E93C18E802C485404)] |
Grainger's management assessed the effectiveness of Grainger's internal control over financial reporting as of December 31, [removed: 2016,] [added: 2017,] based on criteria established in Internal Control - Integrated Framework issued by the Committee of Sponsoring Organizations of the Treadway Commission (2013 framework) (the COSO criteria).
Based on its assessment under that framework and the criteria established therein, Grainger's management concluded that Grainger's internal control over financial reporting was effective as of December 31, [removed: 2016.][added: 2017.]
Ernst & Young LLP, an independent registered public accounting firm, has audited Grainger's internal control over financial reporting as of December 31, [removed: 2016,] [added: 2017,] as stated in their report, which is included herein.
[removed: The] [added: To the Shareholders and the] Board of Directors [removed: and Shareholders] of
We have audited W.W. Grainger, Inc. and [removed: subsidiaries' (the “Company”)] [added: subsidiaries’] internal control over financial reporting as of December 31, [removed: 2016,] [added: 2017,] based on criteria established in Internal [removed: Control - Integrated] [added: Control-Integrated] Framework issued by the Committee of Sponsoring Organizations of the Treadway Commission (2013 [removed: framework)] [added: Framework)] (the COSO [removed: criteria).][added: Criteria).]
[removed: W.W. Grainger, Inc.'s] [added: The Company’s] management is responsible for maintaining effective internal control over financial reporting and for its assessment of [removed: the] effectiveness of [added: the] internal control over financial reporting included in the accompanying [removed: Management's] [added: Management’s] Annual Report on Internal [removed: Control] [added: Controls] over Financial Reporting.
We conducted our audit in accordance with the standards of the [removed: Public Company Accounting Oversight Board (United States).][added: PCAOB.]
In our opinion, [removed: W.W.] [added: W.W] Grainger, Inc. and subsidiaries [added: (the Company)] maintained, in all material respects, effective internal control over financial reporting as of December 31, [removed: 2016,] [added: 2017,] based on the COSO criteria.
We also have audited, in accordance with the standards of the Public Company Accounting Oversight Board (United [removed: States),] [added: States) (PCAOB),] the consolidated balance sheets of [removed: W.W. Grainger, Inc. and subsidiaries] [added: the Company] as of December 31, [removed: 2016] [added: 2017] and [removed: 2015,] [added: 2016,] and the related consolidated statements of earnings, comprehensive earnings, [removed: shareholders' equity,] and [added: shareholders’ equity and] cash flows for each of the three years in the period ended December 31, [removed: 2016 of W.W. Grainger, Inc.] [added: 2017] and [removed: subsidiaries] [added: the related notes] and our report dated February [removed: 28, 2017] [added: 26, 2018] expressed an unqualified opinion thereon.
We have audited the accompanying consolidated balance sheets of W.W. Grainger, Inc. and subsidiaries [added: (the Company)] as of December 31, [removed: 2016 and 2015,] [added: 2017] and [added: 2016,] the related consolidated statements of earnings, comprehensive earnings, [removed: shareholders' equity,] and [added: shareholders’ equity and] cash flows for each of the three years in the period ended December 31, [removed: 2016.][added: 2017, and the related notes (collectively referred to as the “consolidated financial statements”).]
Our responsibility is to express an opinion on [removed: these] [added: the Company’s] financial statements based on our audits.
We conducted our audits in accordance with the standards of the [removed: Public Company Accounting Oversight Board (United States).][added: PCAOB.]
Those standards require that we plan and perform the audit to obtain reasonable assurance about whether the financial statements are free of material [removed: misstatement.][added: misstatement, whether due to error or fraud.]
[removed: An audit includes] [added: Such procedures included] examining, on a test basis, evidence [removed: supporting] [added: regarding] the amounts and disclosures in the financial statements.
[removed: An audit] [added: Our audits] also [removed: includes assessing] [added: included evaluating] the accounting principles used and significant estimates made by management, as well as evaluating the overall [added: presentation of the] financial [removed: statement presentation.][added: statements.]
In our opinion, the [added: consolidated] financial statements [removed: referred to above] present fairly, in all material respects, the [removed: consolidated] financial position of [removed: W.W. Grainger, Inc. and subsidiaries] [added: the Company] at December 31, [removed: 2016] [added: 2017] and [removed: 2015,] [added: 2016,] and the consolidated results of [removed: their] [added: its] operations and [removed: their] [added: its] cash flows for each of the three years in the period ended December 31, [removed: 2016,] [added: 2017,] in conformity with U.S. generally accepted accounting principles.
We also have audited, in accordance with the standards of the Public Company Accounting Oversight Board (United [removed: States), W.W. Grainger Inc. and subsidiaries'] [added: States) (PCAOB), the Company’s] internal control over financial reporting as of December 31, [removed: 2016,] [added: 2017,] based on criteria established in Internal [removed: Control - Integrated] [added: Control-Integrated] Framework issued by the Committee of Sponsoring Organizations of the Treadway Commission (2013 framework) and our report dated February [removed: 28, 2017] [added: 26, 2018] expressed an unqualified opinion thereon.
[removed: (In] [added: A summary of selected quarterly information for 2017 and 2016 is as follows (in] thousands of dollars, except for [removed: share and] per share [removed: amounts)][added: amounts):]
| | [removed: 2016] [added: 2017] | | | | [removed: 2015] [added: 2016] | | | | [removed: 2014] [added: 2015] | | |
| Net sales | $ | [removed: 10,137,204] [added: 10,424,858] | | | $ | [removed: 9,973,384] [added: 10,137,204] | | | $ | [removed: 9,964,953] [added: 9,973,384] | |
| Cost of merchandise sold | [removed: 6,022,647] [added: 6,327,301] | | | | [removed: 5,741,956] [added: 6,022,647] | | | | [removed: 5,650,711] [added: 5,741,956] | | |
| Gross profit | [removed: 4,114,557] [added: 4,097,557] | | | | [removed: 4,231,428] [added: 4,114,557] | | | | [removed: 4,314,242] [added: 4,231,428] | | |
| Warehousing, marketing and administrative expenses | [removed: 2,995,060] [added: 3,048,895] | | | | [removed: 2,931,108] [added: 2,995,060] | | | | [removed: 2,967,125] [added: 2,931,108] | | |
| Operating earnings | [removed: 1,119,497] [added: 1,048,662] | | | | [removed: 1,300,320] [added: 1,119,497] | | | | [removed: 1,347,117] [added: 1,300,320] | | |
| Interest income | [removed: 717] [added: 2,570] | | | | [removed: 1,166] [added: 717] | | | | [removed: 2,068] [added: 1,166] | | |
| Interest expense | [removed: (66,332] [added: (80,458] | | ) | | [removed: (33,571] [added: (66,332] | | ) | | [removed: (10,093] [added: (33,571] | | ) |
| Loss from equity method investment | [removed: (31,193] [added: (37,771] | | ) | | [removed: (11,740] [added: (31,193] | | ) | | [removed: —] [added: (11,740] | | [added: )] |
| Total other expense | [removed: (100,439] [added: (113,338] | | ) | | [removed: (49,615] [added: (100,439] | | ) | | [removed: (12,731] [added: (49,615] | | ) |
| Earnings before income taxes | [removed: 1,019,058] [added: 935,324] | | | | [removed: 1,250,705] [added: 1,019,058] | | | | [removed: 1,334,386] [added: 1,250,705] | | |
Opinion on the Financial Statements
Basis for Opinion
We are a public accounting firm registered with the PCAOB and are required to be independent with respect to the Company in accordance with the U.S. federal securities laws and the applicable rules and regulations of the Securities and Exchange Commission and the PCAOB.
Our audits included performing procedures to assess the risks of material misstatement of the financial statements, whether due to error or fraud, and performing procedures that respond to those risks.
We have served as the Company’s auditor since 2005.
February 26, 2018
To the Shareholders and the Board of Directors of
Opinion on Internal Control over Financial Reporting
Basis for Opinion
We are a public accounting firm registered with the PCAOB and are required to be independent with respect to the Company in accordance with the U.S. federal securities laws and the applicable rules and regulations of the Securities and Exchange Commission and the PCAOB.
Definition and Limitations of Internal Control Over Financial Reporting
February 26, 2018
| Other, net | 2,321 | | | | (3,631 | | ) | | (5,470 | | ) |
| Postretirement benefit plan remeasurement, net of tax expense $29,172 (see Note 9 and Note 13) | 46,543 | | | | — | | | | — | | |
| Postretirement benefit plan reclassification, net of tax (expense) benefit of $(1,017), $6,991 and $(17,013) | 2,043 | | | | (12,453 | | ) | | 27,846 | | |
| Cash and cash equivalents | $ | 326,876 | | | $ | 274,146 | |
| TOTAL ASSETS | $ | 5,804,254 | | | $ | 5,694,307 | |
| Net earnings | $ | 622,443 | | | $ | 632,838 | | | $ | 785,174 | |
| Other current liabilities | 112,445 | | | | (3,937 | | ) | | (24,101 | | ) |
| Net cash provided by operating activities | 1,056,557 | | | | 1,024,083 | | | | 1,036,109 | | |
| Payments for employee taxes withheld from stock awards | (27,884 | | ) | | (21,107 | | ) | | (46,205 | | ) |
| Net cash used in financing activities | (867,148 | | ) | | (775,639 | | ) | | (108,756 | | ) |
| Stock based compensation expense | — | | | 42,643 | | | — | | | — | | | — | | | | 163 | | |
| Stock based compensation expense | — | | | 34,915 | | | — | | | — | | | — | | | | 441 | | |
| Stock based compensation expense | — | | | 32,514 | | | — | | | — | | | — | | | | 137 | | |
| Purchase of treasury stock | — | | | — | | | — | | | — | | | (607,566 | | ) | | (114 | | ) |
| Net earnings | — | | | — | | | 585,730 | | | — | | | — | | | | 36,713 | | |
| Other comprehensive (losses) earnings | — | | | — | | | — | | | 137,620 | | | — | | | | 3,831 | | |
| Cash dividends paid ($5.06 per share) | — | | | 629 | | | (294,097 | | ) | — | | | — | | | | (11,005 | | ) |
| Balance at December 31, 2017 | $ | 54,830 | | $ | 1,040,493 | | $ | 7,405,192 | | $ | (134,674 | ) | $ | (6,675,709 | ) | | $ | 137,601 | |
COMPANY BACKGROUND
W.W. Grainger, Inc.'s operations are primarily in the United States (U.S.) and Canada, with a presence in Europe, Asia and Latin America.
As a result, the Company reclassified $21 million in 2016 and $46 million in 2015 of employee taxes paid from cash flows from operating activities to cash flows from financing activities in the Consolidated Statements of Cash Flows.
Grainger offers sales incentives to customers primarily consisting of volume rebates.
Volume rebates are generally based on annual targets and accruals are established throughout the year based on contract terms, Grainger’s historical payout experience and estimations of customer participation and performance levels.
Sales incentives are primarily accounted for as a reduction of revenue.
Contract terms for most of Grainger’s incentive arrangements do not exceed a year.
Total accrued sales incentives were $45 million and $36 million as of December 31, 2017 and 2016, respectively, and are reflected in Accrued expenses in the Consolidated Balance Sheet.
On December 22, 2017, The Tax Cuts and Jobs Act of 2017 was enacted.
Grainger uses LIFO method to better match inventory cost and revenue.
W.W. Grainger, Inc. and Subsidiaries
February 28, 2017
| | | | | | | | | | | | |
| Other non-operating income | 1,300 | | | | 1,102 | | | | 483 | | |
| Other non-operating expense | (4,931 | | ) | | (6,572 | | ) | | (5,189 | | ) |
| Reclassification of cumulative currency translation | — | | | | — | | | | 9,042 | | |
| Other, net of tax expense of $0, $0 and $(2,360), respectively | — | | | | — | | | | 3,782 | | |
| Net foreign currency translation loss | (38,729 | | ) | | (154,096 | | ) | | (115,023 | | ) |
| Defined postretirement benefit plan: | | | | | | | | | | | |
| Defined postretirement benefit plan (loss) gain, net of tax benefit (expense) of $3,749, $(19,056) and $14,140, respectively | (6,022 | | ) | | 30,451 | | | | (22,667 | | ) |
| Reclassification related to amortization, net of tax expense | (4,034 | | ) | | (3,246 | | ) | | (4,072 | | ) |
| Net defined postretirement benefit plans | (10,056 | | ) | | 27,205 | | | | (26,739 | | ) |
| Other employment-related benefit plans: | | | | | | | | | | | |
| (Loss) gain on other employment-related benefit plans, net of tax benefit of $718, $0 and $440, respectively | (2,397 | | ) | | 641 | | | | (1,462 | | ) |
| Reclassification related to plan amendment and settlement, net of tax benefit | — | | | | — | | | | 6,971 | | |
| Net other employment-related benefit plans | (2,397 | | ) | | 641 | | | | 5,509 | | |
| Total other comprehensive losses | (50,297 | | ) | | (124,950 | | ) | | (135,467 | | ) |
| Foreign currency translation adjustments | 906 | | | | (532 | | ) | | (9,880 | | ) |
| | | | | | | | |
| Land | 355,976 | | | | 323,765 | | |
| Buildings, structures and improvements | 1,313,233 | | | | 1,352,498 | | |
| Furniture, fixtures, machinery and equipment | 1,742,293 | | | | 1,694,050 | | |
| | 3,411,502 | | | | 3,370,313 | | |
CONSOLIDATED BALANCE SHEETS - CONTINUED
| Other current liabilities | (25,044 | | ) | | (70,306 | | ) | | 8,693 | | |
| Net cash provided by operating activities | 1,002,976 | | | | 989,904 | | | | 959,814 | | |
| Net cash used in financing activities | (754,532 | | ) | | (62,551 | | ) | | (758,123 | | ) |
| Cash and cash equivalents at end of year | $ | 274,146 | | | $ | 290,136 | | | $ | 226,644 | |
| | | | | | | | | | | | | | | | | | | | |
| --- | --- | --- | --- | --- | --- | --- | --- | --- | --- | --- | --- | --- | --- | --- | --- | --- | --- | --- | --- |
| Balance at January 1, 2014 | $ | 54,830 | | $ | 893,055 | | $ | 5,822,612 | | $ | 28,914 | | $ | (3,548,973 | ) | | $ | 76,398 | |
| Exercise of stock options | — | | | 4,709 | | | — | | | — | | | 42,920 | | | | 872 | | |
| Tax benefits on stock-based compensation awards | — | | | 36,618 | | | — | | | — | | | — | | | | — | | |
| Stock option expense | — | | | 14,547 | | | — | | | — | | | — | | | | 152 | | |
| Amortization of other stock-based compensation awards | — | | | 31,480 | | | — | | | — | | | — | | | | — | | |
| Purchase of treasury stock | | | | — | | | — | | | | | | (524,926 | | ) | | (194 | | ) |
| Net earnings | — | | | — | | | 801,729 | | | — | | | — | | | | 10,567 | | |
| Other comprehensive losses | — | | | — | | | — | | | (125,587 | | ) | — | | | | (9,880 | | ) |
| Cash dividends paid ($4.17 per share) | — | | | 642 | | | (288,351 | | ) | — | | | — | | | | (3,686 | | ) |
| Exercise of stock options | — | | | 1,454 | | | — | | | — | | | 58,713 | | | | 460 | | |
An excerpt. Shown here: 40 of 487 rewritten, 40 of 314 added and 40 of 265 removed. The counts are complete. For every sentence, read Item 15. Exhibits and Financial Statements Schedules in the FY2017 filing and the FY2016 filing.