 filings.tools
W.W. Grainger (GWW) 10-K risk factor changes: FY2018 vs FY2017
The 2018-12-31 10-K against the 2017-12-31 one, compared heading by heading and sentence by sentence. One of these filings carries no fiscal year tag, so its year is the calendar year of the period end.
Item 1A29 rewritten29 added16 removed55 unchanged
All filing items276 rewritten1,670 added1,586 removed402 unchanged
Summary
counted, not written
- Item 1A headings could not be compared: only 0 carried over between the two years, which usually means one filing was read wrongly, so none is reported as new or removed.
- Sentence by sentence, 1,670 added, 1,586 removed, 276 rewritten and 402 unchanged across 19 items that differ.
- New this year: Item 16. Form 10-K Summary.
Sentences by item
23 items, with every count and a link to each item that changed
Underlined words on a shaded ground are new in FY2018; struck-through words were in FY2017. Sentences that are wholly new or wholly gone are labelled rather than marked.
Item 1A. Risk Factors
29 rewritten, 29 added, 16 removed, 55 unchanged
[removed: Economic] [added: Economic, political,] and industry trends affect Grainger’s business environments.
Grainger serves several industries [added: and markets] in which the demand for its products and services is sensitive to the production activity, capital spending and demand for products and services of Grainger’s customers.
Many of these customers operate in markets that are subject to cyclical fluctuations resulting from market uncertainty, [added: trade and tariff policies,] costs of goods sold, currency exchange rates, [added: central bank interest rate changes,] foreign competition, offshoring of production, oil and natural gas prices, geopolitical [removed: developments] [added: developments, labor shortages, inflation, deflation,] and a variety of other factors beyond Grainger’s control.
Any of these factors could cause customers to idle or close facilities, delay purchases, reduce production [removed: levels] [added: levels,] or experience reductions in the demand for their own products or services.
Any of these events could [removed: impair the ability of Grainger’s customers to make full and timely payments or] [added: also] reduce the volume of products and services these customers purchase from Grainger [added: or impair the ability of Grainger’s customers to make full] and [added: timely payments, and] could cause increased pressure on Grainger’s selling prices and terms of sale.
To remain competitive, the Company must be willing and able to respond to market [removed: pressures, including pricing, whether widely available or negotiated under a contract, delivery and services.][added: pressures.]
These pressures, and the implementation, timing and results of [removed: our] [added: Grainger’s] strategic pricing and other responses, could have a material effect on [removed: Grainger's] [added: Grainger’s] sales and profitability.
If the Company is unable to grow sales or reduce costs, among other actions, to wholly or partially offset the effect on profitability of [removed: our] [added: its] pricing actions, the [removed: Company's] [added: Company’s] results of operations and financial condition may be adversely affected.
Some of Grainger’s products contain significant amounts of commodity-priced materials, such as steel, copper, petroleum [removed: derivatives] [added: derivatives,] or rare earth minerals, and are subject to price changes based upon fluctuations in the commodities market.
Unexpected product [removed: shortages] [added: shortages, tariffs, and risks associated with Grainger’s suppliers] could negatively impact customer [removed: relationships, resulting] [added: relationships or result] in an adverse impact on results of operations.
Products are purchased from approximately [removed: 5,200] [added: 5,000] suppliers located in various countries around the world, not one of which accounted for more than 5% of total purchases.
Historically, no significant difficulty has been encountered with respect to sources of supply; however, disruptions could occur due to factors beyond Grainger’s control, including economic downturns, geopolitical unrest, [removed: port slowdowns,] [added: new tariffs or tariff increases,] trade issues and [added: policies, labor problems experienced by Grainger’s suppliers, transportation availability and cost, inflation and] other factors, any of which could adversely affect a supplier’s ability to manufacture or deliver [removed: products.][added: products or could result in an increase in Grainger’s product costs.]
Changes in customer [added: base] or product mix could cause [removed: the] [added: changes in Grainger’s] gross margin [removed: percentage to decline.][added: or affect Grainger’s competitive position.]
From time to time, Grainger experiences changes in customer [added: base] and product mix that affect gross margin.
Changes in customer [added: base] and product mix result primarily from business acquisitions, changes in customer demand, customer acquisitions, selling and marketing activities and competition.
[removed: A] [added: Any such] disruption [removed: within Grainger’s logistics or supply chain network, including damage, destruction, extreme weather and other events, which] could cause one or more of Grainger’s distribution centers [added: or branches] to become non-operational, [removed: could] adversely affect Grainger’s ability to obtain or deliver inventory in a timely manner, impair Grainger’s ability to meet customer demand for [removed: products and] [added: products,] result in lost [removed: sales] [added: sales, additional costs,] or [added: penalties, or] damage [removed: to] Grainger’s reputation.
Grainger’s ability to provide same-day shipping and next-day delivery is an integral component of Grainger’s business strategy and any such disruption could adversely impact results of [removed: operations.][added: operations and financial performance.]
Although Grainger’s information systems are protected with robust backup and security systems, including physical and software safeguards and remote processing capabilities, information systems are still vulnerable to [added: damage or interruption from] natural disasters, power losses, [removed: computer viruses,] telecommunication [removed: failures] [added: failures, user error, third party actions such as malicious computer programs, denial-of-service attacks] and [added: cybersecurity breaches, and] other problems.
If critical information systems fail or otherwise become unavailable, among other things, Grainger’s ability to process orders, [removed: maintain proper levels of inventories, collect accounts receivable and disburse funds could be adversely affected.]
[removed: Breaches] [added: Cybersecurity incidents, including breaches] of information systems [removed: security] [added: security,] could damage Grainger’s reputation, disrupt operations, increase costs and/or decrease revenues.
[added: While Grainger has instituted safeguards for the protection of such information, because techniques used to obtain unauthorized access or to] sabotage systems change frequently and generally are not recognized until they are launched against a target, Grainger may be unable to anticipate these techniques or implement adequate preventative measures.
If successful, those attempting to penetrate Grainger’s or its vendors’ information systems may misappropriate personally identifiable, credit card, confidential, proprietary or other sensitive customer, supplier, employee or business [removed: information.][added: information, or cause systems disruption.]
Fluctuations in foreign currency [added: could] have an effect on reported results of operations.
In addition, Grainger is exposed to foreign currency exchange rate risk with respect to the U.S. dollar relative to the local currencies of Grainger’s international subsidiaries, primarily the Canadian dollar, euro, pound sterling, Mexican peso, renminbi and yen, arising from transactions in the normal course of business, such as sales and loans to wholly owned subsidiaries, sales to [removed: third-party] customers, purchases from [removed: suppliers] [added: suppliers,] and bank loans and lines of credit denominated in foreign currencies.
Additionally, problems could arise from the integration of acquired businesses, including unanticipated changes in the business or industry or general economic [added: or political] conditions that affect the assumptions underlying the acquisition.
Accordingly, goodwill and intangible assets recorded as a result of acquisitions [removed: could] [added: could, and have in the past,] become impaired.
[removed: Grainger’s business is subject to a wide array of laws, regulations and standards in every domestic and foreign jurisdiction where it operates, including advertising and marketing regulations, anti-bribery and corruption laws, anti-competition regulations, data protection (including payment card industry data security standards), data privacy (including in the U.S. and the European Union, which has traditionally imposed strict obligations] under data privacy laws and regulations that vary from country to country) and cybersecurity requirements (including protection of information and incident responses), environmental protection laws, foreign exchange controls and cash repatriation restrictions, government business regulations applicable to Grainger as a government contractor selling to federal, state and local government entities, health and safety laws, import and export requirements, intellectual property laws, labor [removed: laws,] [added: laws (including federal and state wage and hour laws),] product compliance laws, supplier regulations regarding the sources of supplies or products, tax laws (including as to U.S. taxes on foreign subsidiaries), unclaimed property laws and laws, regulations and standards applicable to other commercial matters.
Failure to comply with any of these laws, regulations and standards could result in civil, criminal, monetary and non-monetary penalties [added: and/or loss of authorization to participate in, or exclusion from, government contracting,] as well as potential damage to the Company’s reputation.
Furthermore, while Grainger has implemented policies and procedures designed to facilitate compliance with these laws, regulations and standards, there can be no assurance that employees, [removed: contractors] [added: contractors, suppliers, vendors,] or [removed: agents] [added: other third parties] will not violate such laws, regulations and standards or Grainger’s policies.
Grainger competes in a variety of ways, including product assortment and availability, services offered to customers, pricing, purchasing convenience, and the overall experience Grainger offers.
This includes the ease of use of Grainger’s high-touch high-service operations (branches and digital platforms) and delivery of products.
Moreover, Grainger expects technological advancements and the increased use of eCommerce solutions within the industry to continue to evolve at a rapid pace.
As a result, Grainger’s ability to effectively compete requires Grainger to respond and adapt to new industry trends and developments, and implement new technology and innovations that may result in unexpected costs or may take longer than expected.
Further, Grainger sources products from Asia and other areas of the world.
This increases the risk of supply disruption due to the additional lead time required and distances involved.
Additionally, as customer base and product mix change over time, Grainger must identify new products, product lines and services that respond to industry trends and customer needs.
The inability to introduce new products and effectively integrate them into Grainger’s existing product mix could have a negative impact on future sales growth and Grainger’s competitive position.
The occurrence of one or more natural disasters such as earthquakes, storms, hurricanes, floods, fires, droughts, tornados and other extreme weather; geopolitical events, such as war, civil unrest or terrorist attacks in a country in which Grainger operates or in which its suppliers are located; and the imposition of measures that create barriers to or increase the costs associated with international trade could result in disruption of Grainger’s logistics or supply chain network.
If Grainger’s systems are damaged, breached or cease to function properly Grainger may have to make a significant investment to repair or replace them and may suffer interruptions in its business operations in the interim.
maintain proper levels of inventories, collect accounts receivable, and disburse funds could be adversely affected.
Any such interruption of Grainger’s information systems could have a material adverse effect on its business or results of operations.
Cyber threats are rapidly evolving and those threats and the means for obtaining access to information in digital and other storage media are becoming increasingly sophisticated.
Each year, cyber-attackers make numerous attempts to access the information stored in our information systems.
Any breach of Grainger’s security measures or any breach, error or malfeasance of those of its third party service providers could cause Grainger to incur significant costs to protect any customers, suppliers, employees, and other parties whose personal data is compromised and to make changes to its information systems and administrative processes to address security issues.
In the past, Grainger has experienced certain cybersecurity incidents.
In each instance, Grainger provided notifications and adopted remedial measures.
While these incidents have not been deemed to be material to Grainger, there can be no assurance that a future breach or incident would not be material to Grainger's operations and financial condition.
Grainger’s ability to adequately protect its intellectual property or successfully defend against infringement claims by others may have an adverse impact on operations.
Grainger’s business relies on the use, validity and continued protection of certain proprietary information and intellectual property, which includes current and future patents, trade secrets, trademarks, service marks, copyrights and confidentiality agreements as well as license and sublicense agreements to use intellectual property owned by affiliated entities or third parties.
Unauthorized use of Grainger’s intellectual property by others could result in harm to various aspects of the business and may result in costly and protracted litigation in order to protect its rights.
In addition, Grainger may be subject to claims that it has infringed on the intellectual property rights of others, which could subject Grainger to liability, require Grainger to obtain licenses to use those rights at significant cost or otherwise cause Grainger to modify its operations.
Grainger’s business is subject to legislative, legal, and regulatory risks and conditions specific to the countries in which it operates.
In addition to Grainger’s U.S. operations, which in 2018 generated approximately 72% of its consolidated net sales, Grainger operates its business principally through wholly-owned subsidiaries in Canada, China, Germany, Mexico, the Netherlands, and the United Kingdom, and its majority-owned subsidiary in Japan.
The wide array of laws, regulations and standards in each domestic and foreign jurisdiction where Grainger operates, include, but are not limited to: advertising and marketing regulations, anti-bribery and corruption laws, anti-competition regulations, data protection (including, because Grainger accepts credit cards, the Payment Card Industry Data Security Standard), data privacy (including in the U.S. and the European Union, which has traditionally imposed strict obligations
In addition, Grainger’s business and results of operations in the UK may be negatively affected by changes in trade policies, or changes in labor, immigration, tax or other laws, resulting from the UK’s anticipated exit from the European Union.
Grainger’s common stock may be subject to volatility or price declines.
The trading price of Grainger’s common stock is subject to broad and unpredictable fluctuation due to changes in economic, political and market conditions, the operating results of Grainger and its competitors, changes in expectations as to Grainger’s future financial or operating performance, including estimates by securities analysts and investors, changes in capital structure, stock repurchase programs or dividend policies, and a number of other factors, including those discussed in this Item 1A.
These factors, many which are outside of Grainger’s control, could cause stock price volatility or Grainger’s stock price to decline.
The industry is also consolidating as customers are increasingly aware of the total costs of fulfillment and of the need to have consistent sources of supply at multiple locations.
This consolidation could cause the industry to become more competitive as greater economies of scale are achieved by competitors, or as competitors with a new lower cost business models are able to operate with lower prices.
Changes in inflation may adversely affect gross margins.
Inflation impacts the costs at which Grainger can procure product and the ability to increase prices to customers over time.
Prolonged periods of deflation could adversely affect the degree to which Grainger is able to increase sales through price increases.
As Grainger continues to source lower cost products from Asia and other areas of the world, the risk for disruptions has increased due to the additional lead time required and distances involved.
If rapid growth with larger, lower margin customers continues, Grainger will face pressure to maintain current gross margins, as these customers receive more discounted pricing due to their higher sales volume.
Any such interruption of Grainger’s information systems could also subject Grainger to additional costs.
While Grainger has instituted safeguards for the protection of such information, during the normal course of business, Grainger has experienced and expects to continue to experience attempts to breach the Company’s information systems, and Grainger may be unable to protect sensitive data and/or the integrity of the Company’s information systems.
A cybersecurity incident could be caused by malicious outsiders using sophisticated methods to circumvent firewalls, encryption and other security defenses.
Because techniques used to obtain unauthorized access or to
Changes in Grainger’s credit ratings and outlook may reduce access to capital and increase borrowing costs.
Grainger’s credit ratings are based on a number of factors, including Grainger’s financial strength and factors outside of Grainger’s control, such as conditions affecting Grainger’s industry generally or the introduction of new rating practices and methodologies.
Grainger cannot provide assurances that Grainger’s current credit ratings will remain in effect or that the ratings will not be lowered, suspended or withdrawn entirely by the rating agencies.
If rating agencies lower, suspend or withdraw the ratings, the market price or marketability of Grainger’s securities may be adversely affected.
In addition, any change in ratings could make it more difficult for Grainger to raise capital on acceptable terms, impact the ability to obtain adequate financing and result in higher interest costs for Grainger’s existing credit facilities or on future financings.
Item 7. Management’s Discussion and Analysis of Financial Condition and Results of Operations
143 rewritten, 151 added, 218 removed, 177 unchanged
W.W. Grainger, Inc. (Grainger) is a broad line, business-to-business distributor of maintenance, repair and operating (MRO) [removed: supplies and other related] products and services with operations primarily in [removed: the U.S. and Canada, with a presence in Europe, Asia] [added: North America, Europe] and [removed: Latin America.][added: Japan.]
More than [removed: 3] [added: 3.5] million customers worldwide rely on Grainger for products such as safety, gloves, ladders, motors and janitorial supplies, along with services like inventory management and technical support.
Approximately [removed: 5,200] [added: 5,000] suppliers provide Grainger with [removed: approximately] [added: about] 1.7 million products stocked in Grainger's distribution centers (DCs) and branches worldwide.
Grainger’s two reportable segments are the U.S. and [removed: Canada.][added: Canada (Acklands - Grainger, Inc. and its subsidiaries).]
Other businesses include the [removed: single channel online businesses] [added: endless assortment businesses,] (Zoro in the U.S. and MonotaRO in [removed: Japan)] [added: Japan),] and [removed: operations] [added: smaller high-touch, high-service businesses] in Europe, Asia and [removed: Latin America.][added: Mexico.]
Given Grainger's large number of customers and the diverse industries it serves, several economic factors and industry trends tend to shape Grainger’s business [removed: environment.][added: environment and provide general insight into projecting Grainger's growth.]
Grainger’s sales in the U.S. and Canada tend to positively correlate with Business Investment, Business Inventory, [removed: Exports and] [added: Exports,] Industrial [removed: Production.][added: Production and Gross Domestic Product (GDP).]
[removed: In Canada, sales] [added: Sales in Canada also] tend to positively correlate with oil prices.
The table below provides these estimated indicators for [removed: 2017] [added: 2018] and [removed: 2018:][added: 2019:]
| | Estimated [removed: 2017] [added: 2018] | | | Forecasted [removed: 2018] [added: 2019] | | | Estimated [removed: 2017] [added: 2018] | | | Forecasted [removed: 2018] [added: 2019] | |
| Oil Prices | — | | | — | | | [removed: $51/barrel] [added: $65/barrel] | | | [removed: $54/barrel] [added: $55/barrel] | |
| Source: Global Insight [added: U.S.] (January [removed: 2018)] [added: 2019), Global Insight Canada (January 2019)] | | | | | | | | | | | |
[removed: Additionally on] [added: On] December 22, 2017, the Tax [removed: Cuts and Jobs] Act was signed into law, which significantly [removed: lowered] [added: revised the] U.S. corporate income tax [added: system by lowering corporate income tax] rates [removed: and introduced] [added: from 35% to 21% effective January 1, 2018, allowing] accelerated expensing of qualified capital [removed: investments,] [added: investments for a specific period, limiting net interest expense deductions and transitioning U.S. international taxation from a worldwide to a territorial tax system,] among other changes.
Per the Global Insight January [removed: 2018] [added: 2019] forecast, Canada's [removed: GDP] [added: Business Investment, Exports] and [removed: industrial production] [added: Industrial Production] are [removed: forecast] [added: expected to] slow [added: due to a reduction] in [removed: 2018, while exports] [added: spending] and [removed: business nonresidental investment (a component of Business Investment) are expected to improve.][added: oil production quotas and increasing interest rates.]
There were [removed: 254] [added: 255] sales days in the full [removed: year 2017] [added: years 2018] and [removed: 255] [added: 2016 versus 254] sales days in the full [removed: years 2016 and 2015.][added: year 2017.]
| | For the Years Ended December 31, | | | | | | | | | | | | | | | | [removed: |]
| | | | | | | | | | Percent Increase/(Decrease) from Prior Year | | | As a Percent of Net Sales | | | | | [removed: |]
| | 2017 [removed: (A)] | | | | 2016 [removed: (A)] | | | | 2017 | | | 2017 | | | 2016 | | [removed: |]
| Net sales | $ | 10,425 | | | $ | 10,137 | | | 3 | % | | 100.0 | % | | 100.0 | % | [removed: |]
| Cost of [removed: merchandise] [added: goods] sold | 6,327 | | | | [removed: 6,023] [added: 6,022] | | | | 5 | % | | 60.7 | | | 59.4 | | [removed: |]
| Gross profit | 4,098 | | | | 4,115 | | | | — | % | | 39.3 | | | 40.6 | | [removed: |]
| Income taxes | 313 | | | | 386 | | | | (19 | )% | | 3.0 | | | 3.8 | | [removed: |]
| Net earnings | [removed: 622] [added: 623] | | | | 633 | | | | (2 | )% | | 6.0 | | | 6.2 | | [removed: |]
| Noncontrolling interest | 37 | | | | 27 | | | | [removed: 36] [added: 37] | % | | 0.4 | | | 0.3 | | [removed: |]
| Net earnings attributable to W.W. Grainger, Inc. | $ | 586 | | | $ | 606 | | | (3 | )% | | 5.6 | % | | 6.0 | % | [removed: |]
Grainger's net sales were $10,425 million for 2017, an increase of [removed: 3%,] [added: 3%] when compared with net sales of $10,137 million for the comparable 2016 period.
| | Percent [removed: Increase/] [added: Increase] (Decrease) |
The increase in net sales was primarily driven by the [removed: single channel online] [added: endless assortment] businesses in the U.S. and Japan, as well as volume increases in the U.S. business as a result of the pricing actions.
Refer to the Segment Analysis below for further [removed: details.][added: details]
Gross profit of $4,098 million for 2017 [removed: was down] [added: decreased by] $17 million compared with $4,115 million for 2016.
The gross profit margin for 2017 was 39.3%, [removed: down] [added: a decrease of] 1.3 percentage points [removed: versus] [added: compared with] 2016, driven primarily by the pricing actions in the U.S. business.
[removed: Operating expenses] [added: SG&A] of [removed: $3,049] [added: $3,063] million for 2017 increased 2% from [removed: $2,995] [added: $3,002] million for 2016.
Excluding restructuring [removed: costs, gains on the sale] [added: and impairment charges net] of [removed: assets] [added: branch gains] and other charges in both periods as noted [removed: below,] [added: in the table above,] operating expenses increased 3%, driven primarily by higher [removed: employee related] [added: employee-related] costs.
Operating earnings of [removed: $1,049] [added: $1,035] million for 2017 decreased [removed: 6%] [added: 7%] from [removed: $1,119] [added: $1,113] million for 2016.
Excluding restructuring [removed: costs, gains on the sale] [added: and impairment charges net] of [removed: assets] [added: branch gains] and other charges in both periods as noted [removed: below,] [added: in the table above,] operating earnings decreased [removed: 8%] [added: 9%] or [removed: $107] [added: $113] million, driven primarily by lower gross profit and higher operating expenses.
Other expense, net was [removed: $113] [added: $99] million in 2017 compared to [removed: $100] [added: $94] million of expense in 2016.
The increase in expense was primarily due to incremental interest expense on $400 million in long-term debt issued in May 2016 and $400 million in long-term debt issued in May 2017, as well as higher operating losses from the Company's clean energy [removed: investments.][added: investments partially offset by higher benefits related to the Company's postretirement plan.]
The lower rate versus the prior year is [added: primarily] due to discrete tax items and U.S. tax legislation.
See Note [removed: 14] [added: 10] to the [removed: Consolidated] Financial Statements for additional information.
The [removed: table] [added: tables] below [removed: reconciles] [added: reconcile] reported [added: SG&A, operating earnings and] net earnings [added: attributable to W.W. Grainger, Inc.,] determined in accordance with [removed: U.S. generally accepted accounting principles] [added: Generally Accepted Accounting Principles] (GAAP) [added: in the United States of America] to adjusted [added: SG&A, operating earnings and] net [removed: earnings, a] [added: earnings attributable to W.W. Grainger, Inc., which are all considered] non-GAAP [removed: measure.][added: measures.]
These customers represent a broad collection of industries (see Note 2 to the Consolidated Financial Statements (Financial Statements)).
These reportable segments reflect the results of the Company's high-touch, high-service businesses in those geographies.
| Business Investment | 7.3 | % | | 3.4 | % | | 2.8 | % | | 1.2 | % |
| Business Inventory | 1.6 | % | | 2.7 | % | | — | | | — | |
| Exports | 4.0 | % | | 4.1 | % | | 3.2 | % | | 2.2 | % |
| Industrial Production | 3.9 | % | | 2.4 | % | | 2.6 | % | | 1.0 | % |
| GDP | 2.9 | % | | 2.5 | % | | 2.1 | % | | 2.0 | % |
Per the Global Insight January 2019 forecast, Business Inventory and Exports are forecast to improve while Business Investment, Industrial Production and GDP are forecast to slow, yet still remain stable during 2019 despite slowing global growth, financial market volatility and fading fiscal stimulus.
Each business in Grainger’s portfolio has a specific set of strategic imperatives focused on creating unique value for customers.
In the U.S. business, Grainger is focused on growing market share through the three pillars of its strategy: (i) building advantaged MRO solutions, which means being able to get customers the exact product they need to solve a problem quickly; (ii) offering differentiated sales and services; Grainger has an advantage in serving complex businesses at their place of business through its direct customer relationships and onsite services and (iii) enabling flawless order to cash; Grainger is committed to providing the absolute best customer experience in the industry through its effort to deliver flawlessly on every customer transaction.
The Canada business is focused on stabilizing volume performance in 2019 after completing the majority of its cost structure reset.
In other businesses, the Company is focused on growing the endless assortment businesses profitably, investing in product assortment and innovating around customer acquisition by building marketing and analytics capabilities.
The high-touch, high-service international businesses are focused on the same initiatives as the U.S. business, as mentioned above.
Grainger completed one divestiture in 2017, which was immaterial.
| | | | | | | | | | | | | | | | | |
| --- | --- | --- | --- | --- | --- | --- | --- | --- | --- | --- | --- | --- | --- | --- | --- | --- |
| | | | | | | | | | | | | | | | | |
| | 2018 | | | | 2017 | | | | 2018 | | | 2018 | | | 2017 | |
| Cost of goods sold | 6,873 | | | | 6,327 | | | | 9 | % | | 61.3 | | | 60.7 | |
| Gross profit | 4,348 | | | | 4,098 | | | | 6 | % | | 38.7 | | | 39.3 | |
| Selling, general and administrative expenses | 3,190 | | | | 3,063 | | | | 4 | % | | 28.4 | | | 29.4 | |
| Operating earnings | 1,158 | | | | 1,035 | | | | 12 | % | | 10.3 | | | 9.9 | |
| Other expense, net | 77 | | | | 99 | | | | (22 | )% | | 0.7 | | | 0.9 | |
| Income taxes | 258 | | | | 313 | | | | (18 | )% | | 2.3 | | | 3.0 | |
| Net earnings | 823 | | | | 623 | | | | 32 | % | | 7.3 | | | 6.0 | |
| Net earnings attributable to W.W. Grainger, Inc. | $ | 782 | | | $ | 586 | | | 33 | % | | 7.0 | % | | 5.6 | % |
2018 Compared to 2017
Grainger's net sales of $11,221 million for 2018 increased $796 million, or 8%, compared to the same period in 2017.
On a daily basis, net sales increased 7%.
The increase in net sales was primarily driven by volume increases in the U.S. business due to market share gain and an improved demand environment and continued double digit growth in the endless assortment businesses, offset by lower sales in the Canada business.
See Note 17 to the Financial Statements and refer to the Segment Analysis below for further details.
Gross profit of $4,348 million for 2018 increased $250 million, or 6% compared with the same period in 2017.
The gross profit margin of 38.7% decreased 0.6 percentage points when compared to the same period in 2017.
The lower gross profit margin reflects a 0.5 percentage point decline from the implementation of the Financial Accounting Standards Board (FASB) new revenue recognition standard that primarily reclassified certain costs related to KeepStock® services from Selling, general and administrative expenses (SG&A) to Cost of goods sold (COGS).
Excluding this impact, gross profit margin would have decreased 0.1 percentage point compared to the prior year.
The Company believes that these non-GAAP measures provide meaningful information to assist shareholders in understanding financial results and assessing prospects for future performance as they provide a better baseline for analyzing the ongoing performance of its businesses by excluding items that may not be indicative of core operating results.
Because non-GAAP financial measures are not standardized, it may not be possible to
All tables below are in millions of dollars:
| | 2018 | | | | 2017 | | | % | |
| SG&A reported | $ | 3,190 | | | $ | 3,063 | | 4 | % |
These customers represent a broad collection of industries including commercial, government, healthcare and manufacturing.
The U.S. operating segment reflects the results of Grainger’s U.S. businesses.
The Canada operating segment reflects the results for Acklands – Grainger Inc. and its subsidiaries.
The overall economy and leading economic indicators provide general insight into projecting Grainger's growth.
In the U.S., sales tend to positively correlate with Gross Domestic Product (GDP).
| Business Investment | 5.1 | % | | 7.9 | % | | 2.3 | % | | 3.5 | % |
| Business Inventory | 0.8 | % | | 2.1 | % | | — | | | — | |
| Exports | 3.4 | % | | 5.3 | % | | 1.1 | % | | 1.8 | % |
| Industrial Production | 1.9 | % | | 3.3 | % | | 5.2 | % | | 0.1 | % |
| GDP | 2.2 | % | | 2.7 | % | | 3.0 | % | | 2.4 | % |
Per the Global Insight January 2018 forecast, Business Investment is likely to remain on a strong growth path during 2018, supported by expanding global markets, lower capital costs and an improving regulatory climate.
These changes to U.S. tax laws may increase capital spending in the U.S. and attract incremental foreign capital to the U.S., which is expected to support export growth.
Grainger’s portfolio consists of its U.S. business, its Canada business and other businesses.
Grainger’s imperative to create unique value is focused on: (i) continuing to grow its share of business with large and mid-size customers in the U.S. by executing its high-value sales and service model, building an advantaged digital capability and completing its pricing strategy; (ii) executing a complete business model reset in Canada; (iii) driving profitable growth in its international portfolio and (iv) continuing the strong growth of its single channel businesses by expanding its assortment and innovation around customer acquisition.
Grainger is also focused on improving the end-to-end customer experience by making investments in its eCommerce and digital capabilities and executing continuous improvement initiatives within its supply chain, such that customers have a positive experience with Grainger from order to delivery.
Grainger intends to continue to reduce its cost base while ensuring that it delivers an effortless customer experience.
On January 24, 2018, Grainger updated its 2018 earnings per share guidance to reflect the 2017 actual results, lower corporate tax rate, lower tax benefit from clean energy, incremental investment in digital and higher share repurchases.
The prior earnings per share guidance issued on November 10, 2017 for 2018 was $10.60 to $11.80.
The Company still expects 3 to 7 percent sales growth and now expects earnings per share of $12.95 to $14.15 for 2018.
Grainger completed one divestiture in 2017 and one acquisition in 2015, which were immaterial individually and in the aggregate.
Grainger’s operating results have included the results of each business acquired since the respective acquisition dates.
| | | | | | | | | | | | | | | | | | |
| --- | --- | --- | --- | --- | --- | --- | --- | --- | --- | --- | --- | --- | --- | --- | --- | --- | --- |
| Warehousing, marketing and administrative expenses | 3,049 | | | | 2,995 | | | | 2 | % | | 29.3 | | | 29.6 | | |
| Operating earnings | 1,049 | | | | 1,119 | | | | (6 | )% | | 10.1 | | | 11.0 | | |
| Other expense, net | 113 | | | | 100 | | | | 13 | % | | 1.1 | | | 1.0 | | |
(A) May not sum due to rounding
| | |
| --- | --- |
In 2017, eCommerce sales for Grainger were $5,283 million, an increase of 11% over the prior year.
Total eCommerce sales represented 51% and 47% of total sales for 2017 and 2016, respectively.
The increase was primarily driven by Grainger.com and other electronic purchasing platforms in the U.S. and across all single channel online businesses.
If the Company included KeepStock®, total eCommerce and KeepStock® sales would represent 56% and 53% of total sales for 2017 and 2016, respectively.
On December 22, 2017, the Tax Cuts and Jobs Act (the Tax Act) was signed into law, which significantly revised the U.S. corporate income tax system by lowering corporate income tax rates from 35% to 21% effective January 1, 2018, allowing accelerated expensing of qualified capital investments for a specific period, limiting net interest expense deductions and transitioning U.S. international taxation from a worldwide to a territorial tax system, among other changes.
Grainger projects a tax rate of 23% to 26% for 2018, which includes the impact of the Tax Act.
Management believes adjusted net earnings is an important indicator of operations because it excludes items that may not be indicative of core operating results.
(In thousands of dollars):
| Net earnings reported | $ | 585,730 | | | $ | 605,928 | | (3 | )% |
| Inventory reserve adjustment (Canada) | — | | | | 7,278 | | | | |
| Subtotal | 83,890 | | | | 105,250 | | | | |
An excerpt. Shown here: 40 of 143 rewritten, 40 of 151 added and 40 of 218 removed. The counts are complete. For every sentence, read Item 7. Management’s Discussion and Analysis of Financial Condition and Results of Operations in the FY2018 filing and the FY2017 filing.
Item 7A. Quantitative and Qualitative Disclosures About Market Risk
2 rewritten, 0 added, 0 removed, 9 unchanged
While it is difficult to quantify any particular impact of changes in exchange rates, a uniform 10% strengthening in the U.S. dollar (whereby all other variables are held constant and unusual expense items described in "Item 7: Management's Discussion and Analysis of Financial Condition and Results of Operations" are excluded) would have resulted in [removed: an increase] [added: a decrease] in net earnings of [removed: $1] [added: $3] million for the year ended December 31, [removed: 2017,] [added: 2018,] and an increase in net earnings of [removed: $2] [added: $1] million for the year ended December 31, [removed: 2016.][added: 2017.]
Comparatively, a 10% weakening of the U.S. dollar would have resulted in [removed: a decrease] [added: an increase] in net earnings of [removed: $2] [added: $3] million for the year ended December 31, [removed: 2017,] [added: 2018,] and a decrease in net earnings of $2 million for the year ended December 31, [removed: 2016.][added: 2017.]
Item 1. Business
33 rewritten, 47 added, 53 removed, 28 unchanged
W.W. Grainger, Inc., incorporated in the State of Illinois in 1928, is a broad line, business-to-business distributor of maintenance, repair and operating (MRO) [removed: supplies and other related] products and services.
In this report, the words “Grainger” or “Company” mean W.W. Grainger, Inc. and its [added: subsidiaries, except where the context makes it clear that the reference is only to W.W. Grainger, Inc. itself and not its] subsidiaries.
Products are regularly added [removed: to] and [removed: removed] [added: deleted] from Grainger's product lines on the basis of customer demand, market research, suppliers' recommendations, sales volumes and other factors.
Other businesses include the [removed: single channel online businesses] [added: endless assortment businesses,] Zoro [removed: Tools, Inc. (Zoro)] in the U.S. and MonotaRO [removed: Co., Ltd. (MonotaRO)] in [removed: Japan] [added: Japan,] and [removed: operations] [added: smaller businesses] in Europe, Asia and [removed: Latin America.][added: Mexico.]
For [added: further] segment and [removed: geographical information and consolidated net sales and operating earnings,] [added: financial information,] see “Item 7: Management’s Discussion and Analysis of Financial Condition and Results of Operations” and Note [removed: 16] [added: 17] to the Consolidated Financial [removed: Statements.][added: Statements (Financial Statements).]
The U.S. business offers a broad selection of MRO [removed: supplies and other related] products and services through [removed: sales representatives, catalogs,] [added: its] eCommerce [added: platform, catalogs, branches] and [removed: local branches.][added: sales and service representatives.]
[removed: Products offered include material handling] [added: Grainger offers a broad selection of products to its customers including material-handling] equipment, safety and security supplies, lighting and electrical products, power and hand tools, pumps and plumbing supplies, cleaning and maintenance supplies and metalworking tools.
In addition, [removed: 22%] [added: approximately 21%] of [removed: 2017] [added: 2018] sales were private label MRO items bearing Grainger’s registered trademarks, including DAYTON®, SPEEDAIRE®, AIR HANDLER®, TOUGH GUY®, WESTWARD®, CONDOR® and LUMAPRO®.
The U.S. business purchases products for sale from [removed: more than 2,600] [added: approximately 3,000] suppliers, most of which are manufacturers.
The U.S. business operates and fulfills orders [removed: in all 50 states and exports to a select number of countries] [added: nationally] through a network of [removed: distribution centers (DCs),] [added: DCs,] branches and contact centers.
Customers range from small and mid-sized businesses to large corporations, government entities and other [removed: institutions.][added: institutions within many industries (see Note 2 to the Financial Statements).]
[removed: No] [added: Sales in 2018 were made to more than 1 million customers and no] single [added: end] customer accounted for more than [removed: 4%] [added: 1%] of total sales.
Macro trends [removed: are changing] [added: and technology drive] the way Grainger's [added: U.S.] customers behave.
These changes [removed: in behaviors] are reflected in how customers do business [removed: with] [added: in] the U.S. [removed: business] as demonstrated in the following [removed: chart:][added: tables for the 2018 line mix:]
[removed: 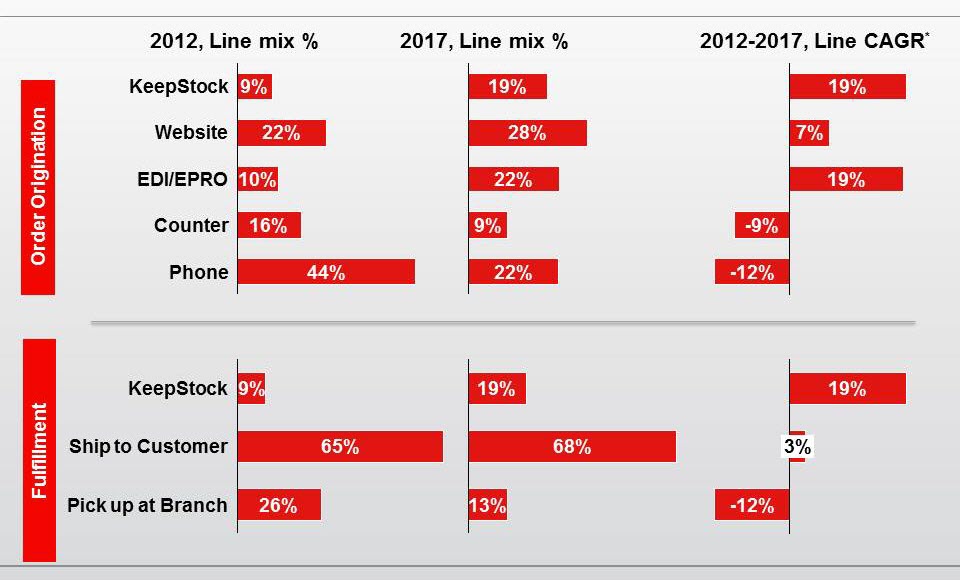][added: 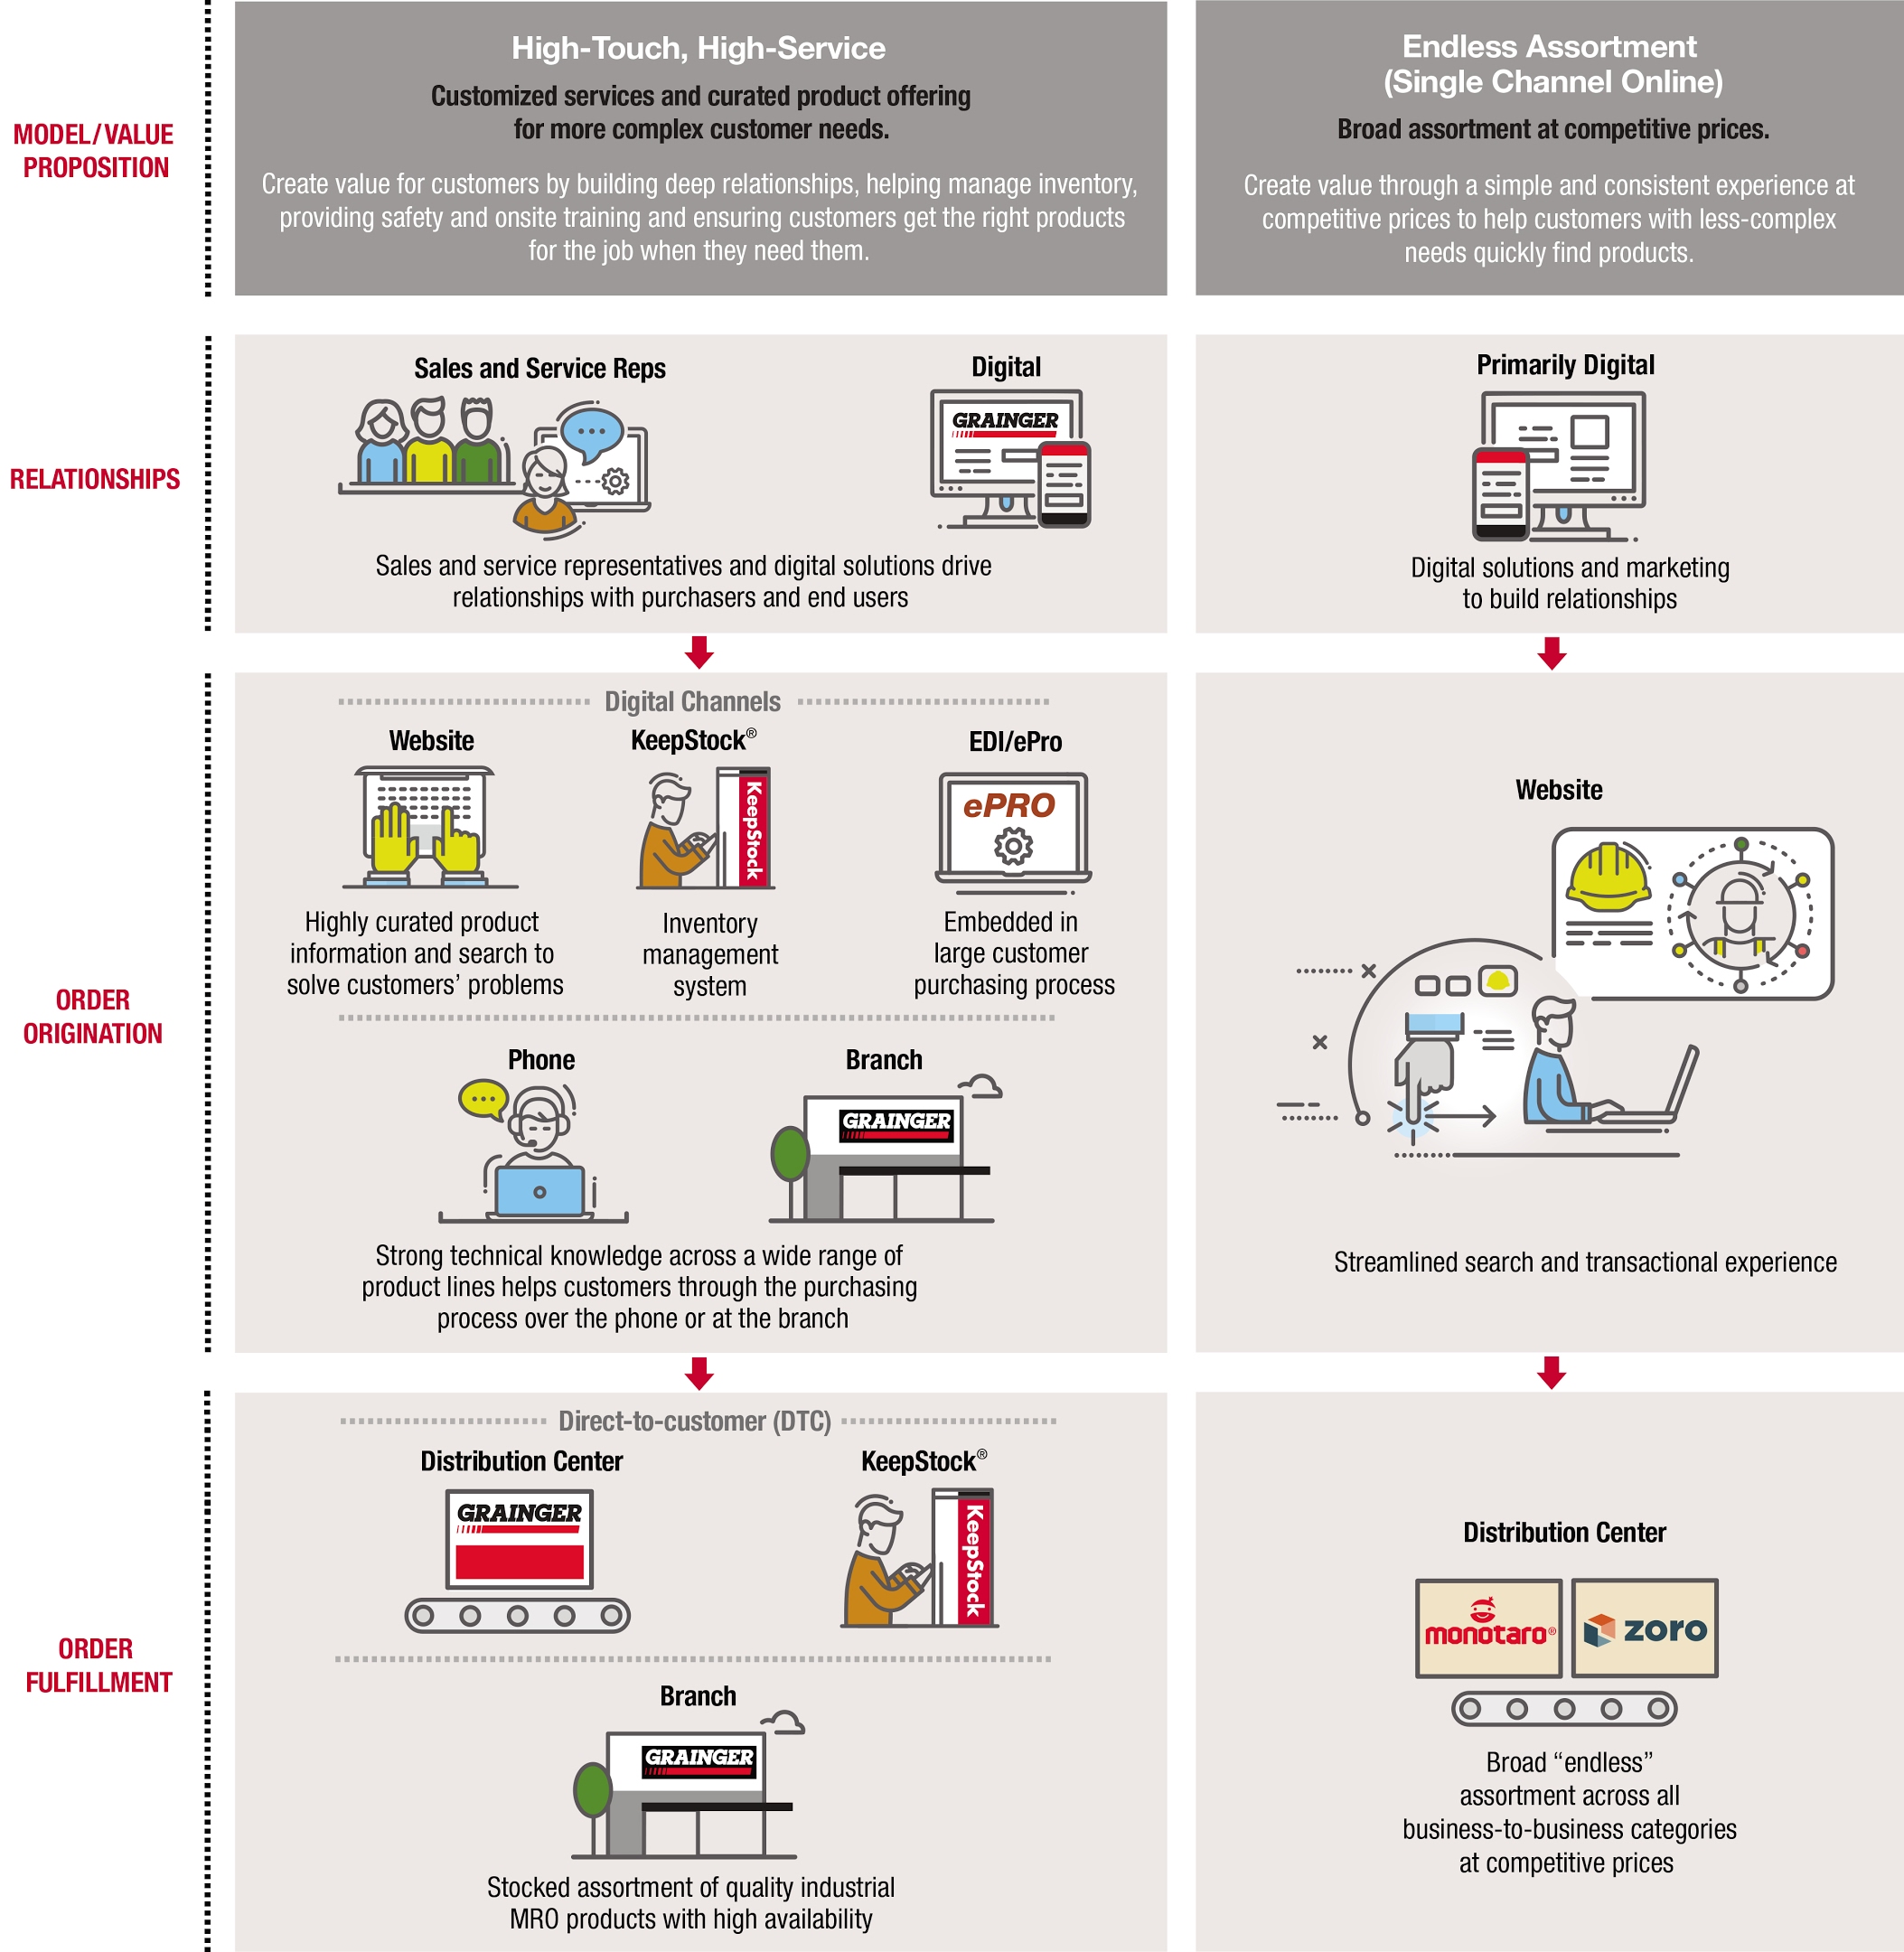]
[removed: Customers] [added: U.S. customers] continue to migrate to web [removed: platforms] and electronic [removed: purchasing] platforms such as EDI, eProcurement and [removed: KeepStock®, the electronic inventory management offering.][added: KeepStock®.]
Through Grainger.com and other branded websites, [removed: which serve as prominent channels in the U.S. business,] customers have access to [removed: approximately 2.4] [added: more than 2.9] million products.
Grainger.com provides real-time price and product [removed: availability and] [added: availability,] detailed product information and [removed: offers] features such as product search and compare capabilities.
Inventory management [removed: services] is another area where the U.S. business helps customers be more productive.
KeepStock® [removed: inventory solutions] is a comprehensive program that includes vendor-managed inventory, customer-managed inventory and onsite vending machines.
Grainger's contact center network in the U.S. business [removed: consists of approximately 1,900 employees who handle] [added: on average handles] about [removed: 70,000] [added: 73,000] customer interactions per day including approximately 20,000 orders via phone, e-mail and [removed: fax.][added: chat.]
The U.S. business has [removed: a] [added: an outside and inside] sales force [removed: of approximately 3,500 professionals who] [added: to] help customers select the right products [removed: to find immediate solutions to] [added: for] their needs and reduce costs by utilizing Grainger as a consistent source of supply.
[removed: This business provides] [added: Acklands – Grainger Inc. and its subsidiaries (the Canada business) provide] a combination of product breadth, local availability, speed of delivery, detailed product information and competitively priced products and services.
The Canada business serves customers through branches, [added: DCs and] sales and service [removed: representatives and DCs across Canada.][added: representatives.]
Customers have access to more than [removed: 131,000] [added: 194,000] stocked products through a comprehensive [removed: catalog.][added: catalog and website.]
Other businesses [removed: include] [added: is comprised of the endless assortment businesses,] Zoro in the [removed: U.S.,] [added: U.S. and] MonotaRO in [removed: Japan] [added: Japan,] and [removed: operations] [added: smaller high-touch, high-service businesses] in Europe, Asia and [removed: Latin America.][added: Mexico.]
Zoro is an online MRO [removed: distributor] [added: distributor,] primarily serving U.S. customers through its website, Zoro.com.
[removed: Zoro] [added: Zoro, with sales of more than $500 million in 2018,] offers a broad selection of more than [removed: 1] [added: 2] million [removed: products.][added: products to its customers.]
Zoro has no branches or sales force, and customer orders are [removed: primarily] fulfilled through the U.S. business supply [removed: chain.][added: chain and third parties.]
MonotaRO [added: had nearly $1 billion in revenue in 2018 and] provides customers with [added: access to approximately 20 million] MRO products primarily through its [removed: catalogs] [added: websites] and [removed: websites.][added: catalogs.]
Grainger differentiates itself by providing local product availability, a broad product line, sales [added: and service] representatives, competitive pricing, catalogs (which include product descriptions and, in certain cases, extensive technical and application data) and electronic and eCommerce technology.
As of December 31, [removed: 2017,] [added: 2018,] Grainger had approximately [removed: 25,700] [added: 24,600] employees, of whom approximately [removed: 24,400] [added: 23,100] were full-time and [removed: 1,300] [added: 1,500] were part-time or temporary.
Grainger makes available free of charge, through its website, [removed: www.Grainger.com/investor,] [added: www.grainger.com/investor,] its Annual Report on Form 10-K, quarterly reports on Form 10-Q, current reports on Form 8-K, proxy statements and amendments to those reports if any, as soon as reasonably practicable after these materials are electronically filed [removed: with] [added: with,] or furnished [removed: to] [added: to,] the U.S. Securities and Exchange Commission (SEC).
W.W. Grainger, Inc.'s operations are primarily in North America, Europe and Japan.
Strategy
In the large and fragmented MRO industry, Grainger holds an advantaged position with its supply chain infrastructure, broad in-stock product offering and deep customer relationships.
Grainger's purpose is to help businesses keep their operations running and their people safe.
The Company competes with two models: the high-touch, high-service model and the endless assortment (single-channel) model.
Competing with these two models allows Grainger to leverage its scale and advantaged supply chain to meet the changing needs of its customers.
Grainger’s high-touch, high-service model serves customers with complex needs in North America and Europe.
The endless assortment model is focused on customers with less-complex needs and includes the Zoro Tools, Inc. (Zoro) brand in the U.S. and MonotaRO Co., Ltd. (MonotaRO) in Japan.
MRO Industry
The global MRO market is approximately $608 billion, and the estimated market size where Grainger has operations is $284 billion.
The most attractive geographies for Grainger are those with high GDP per capita and a developed infrastructure.
Grainger’s strategy is concentrated in North America, Europe and Japan.
Each of these core markets is large and the competition is highly fragmented.
In total, Grainger has about 4 percent share within its addressable market with ample opportunity for growth.
The table below shows Grainger's estimated share of the MRO market and the summary of its operations by reporting segments and other businesses as of December 31, 2018:
| | | | | | | | | | |
| --- | --- | --- | --- | --- | --- | --- | --- | --- | --- |
| | | | | | | | | | |
| | Approximate MRO Market Size (billions)1 | | Approximate Market Share | | Branches2 | | Distribution Centers (DCs)2 | | Approximate Number of Customers Served (thousands)4 |
| United States | $93 | | 7% | | 283 | | 16 | | 1,100 |
| Canada | 12 | | 5% | | 54 | | 5 | | 50 |
| Other businesses | | | | | | | | | |
| Endless assortment businesses | 82 | | 2% | | — | | 4 | | 2,200 |
| High-touch, high-service businesses3 | 97 | | 1% | | 120 | | 6 | | 320 |
| TOTAL | $284 | | 4% | | 457 | | 31 | | 3,700 |
1 Estimated MRO market size where Grainger has operations.
2 See Item 2, "Properties" for more information.
3 Includes businesses in Europe, Asia and Mexico.
4 Customers served in the United States may include overlap with Zoro in Endless assortment business.
Customers and Products
Grainger serves more than 3.5 million customers worldwide through its DCs, eCommerce platform, contact centers, branches and sales and service representatives.
These customers represent a broad collection of industries including government, manufacturing, transportation, commercial and contractors (see Note 2 to the Financial Statements).
No one product category comprises more than 18% of global sales.
The U.S. business also exports to various countries.
| | | | | | | |
| --- | --- | --- | --- | --- | --- | --- |
| | | | | | | |
| Order Origination | | | | Order Fulfillment | | |
| Website | 31 | % | | Ship to Customer | 70 | % |
| EDI/ePro | 23 | % | | Pick up at Branch | 13 | % |
W.W. Grainger, Inc.'s operations are primarily in the United States (U.S.) and Canada, with a presence in Europe, Asia and Latin America.
Grainger uses a combination of multichannel and single channel online business models to provide customers, primarily businesses, with a range of options for finding and purchasing MRO products, utilizing sales representatives, contact centers, catalogs, inventory management solutions and eCommerce technology.
Grainger serves more than 3 million customers worldwide through a network of highly integrated distribution centers, websites, branches and inventory management solutions.
Grainger's centralized business support functions provide coordination and guidance in the areas of supply chain, product management, accounting and finance, strategy, communications and investor relations, human resources, compensation and benefits, information systems, health and safety, procurement, risk management, internal audit, legal, real estate, security, tax and treasury.
These services are provided in varying degrees to all business units.
These businesses generate revenue through the distribution of MRO supplies and products and related services.
Services offered primarily relate to inventory management solutions.
Through a global sourcing operation, the business procures competitively priced, high-quality products produced outside the U.S. from approximately 400 suppliers.
They are primarily represented by purchasing managers or employees in facilities maintenance departments and service shops across a wide range of industries such as manufacturing, hospitality, transportation, government, retail, healthcare and natural resources.
Sales in 2017 were made to approximately 1 million customers averaging 113,000 daily transactions.
*CAGR is defined as compound annual growth rate.
The U.S. business KeepStock® program currently provides services to nearly 20,000 customers and, in 2017, facilitated approximately 9,000 installations.
As of December 31, 2017, there were approximately 65,000 total installations.
As of December 31, 2017, the U.S. business had 284 branches (251 stand alone, 31 onsite and 2 will-call express locations), 16 DCs, 3 national contact centers and 37 regional contact centers, which are located within branches.
Automated equipment and processes allow DCs to handle the majority of the customer shipping for next-day product availability and replenish branches that provide
same-day availability.
The DC network fulfills a large portion of customer orders, especially as customers migrate to website and electronic purchasing.
In addition, branches support local KeepStock® operations.
The branch network has approximately 1,700 employees who primarily fulfill counter and will-call product purchases and provide customer service.
Branch network sales volume has continued to grow throughout 2017.
To enable improved customer service, team member engagement and efficiencies, the 37 regional contact centers are currently being consolidated to 3 national contact centers with expanded work-from-home arrangements.
In 2017, the U.S. business continued to focus its outside sales force on facilitating growth with large customers who typically have more complex purchasing requirements than small and mid-sized customers.
The U.S. business primarily utilizes a network of inside sellers and digital channels to meet the needs of small and mid-sized customers.
The Grainger catalog, most recently issued in February 2018, offers approximately 365,000 MRO products and is used by customers to assist in product selection.
The 2018 catalog includes almost 24,000 new items and approximately 1 million copies of the catalog were produced.
Grainger estimates the U.S. market for MRO products to be approximately $127 billion in 2017, of which the U.S. business share is approximately 6%.
Acklands – Grainger Inc. and its subsidiaries (the Canada business) is Canada’s leading broad line MRO distributor.
As of December 31, 2017, the Canada business had 91 branches and 6 DCs.
Approximately 13,000 sales transactions are completed daily.
In addition, customers can purchase products through various fully bilingual websites.
Grainger estimates the 2017 Canada market for MRO products was approximately $11 billion, of which the Canada business share is approximately 7%.
The businesses in this group with revenues of more than $100 million in 2017 are described below.
A majority of orders are conducted through Monotaro.com, through which customers have access to approximately 13 million products.
MonotaRO fulfills the majority of orders from three DCs.
Grainger estimates the Japanese market for MRO products was approximately $42 billion in 2017, of which MonotaRO’s share is approximately 2%.
Cromwell
Cromwell is a broad line MRO distributor in the United Kingdom (U.K.) serving approximately 130,000 customers.
Headquartered in Leicester, England, as of December 31, 2017, Cromwell had 45 U.K. branches, 10 international branches in 10 countries and one DC.
Customers have access to approximately 170,000 MRO products through a catalog and through Cromwell.co.uk.
Grainger estimates the U.K. market for MRO products was approximately $15 billion in 2017, of which Cromwell's share is approximately 2%.
An excerpt. Shown here: all 33 rewritten, 40 of 47 added and 40 of 53 removed. The counts are complete. For every sentence, read Item 1. Business in the FY2018 filing and the FY2017 filing.
Item 3. Legal Proceedings
1 rewritten, 0 added, 0 removed, 0 unchanged
For a description of legal proceedings, see the disclosure contained in Note [removed: 17] [added: 18] to the [removed: Consolidated] Financial Statements included in "Part II, Item 8: Financial Statements and Supplementary Data" of this report, which is incorporated herein by reference.
Cover and table of contents
28 rewritten, 9 added, 7 removed, 51 unchanged
For the fiscal year ended December 31, [removed: 2017][added: 2018]
Indicate by check mark whether the registrant has submitted electronically [removed: and posted on its corporate website, if any,] every Interactive Data File required to be submitted and posted pursuant to Rule 405 of Regulation S-T (§232.405 of this chapter) during the preceding 12 months (or for such shorter period that the registrant was required to submit [removed: and post] such files).
Indicate by check mark whether the registrant is a large accelerated filer, an accelerated filer, a non-accelerated filer, [removed: or] a smaller reporting [added: company or an emerging growth] company.
See the definitions of “large accelerated filer,” “accelerated [removed: filer” and] [added: filer,”] “smaller reporting [removed: company”] [added: company,” and "emerging growth company"] in Rule 12b-2 of the Exchange Act.
| Large accelerated filer \[X\] | Accelerated filer \[ \] | Non-accelerated filer \[ \] | Smaller reporting company \[ \] | [added: Emerging growth company \[ \] |]
The aggregate market value of the voting common equity held by nonaffiliates of the registrant was [removed: $9,747,864,843] [added: $16,101,319,439] as of the close of trading as reported on the New York Stock Exchange on June 30, [removed: 2017.][added: 2018.]
The registrant had [removed: 56,105,411] [added: 55,679,223] shares of the Company’s Common Stock outstanding as of January 31, [removed: 2018.][added: 2019.]
Portions of the registrant's definitive proxy statement to be filed in connection with the annual meeting of shareholders to be held on April [removed: 25, 2018,] [added: 24, 2019,] are incorporated by reference into Part III hereof of this Form 10-K where indicated the definitive 2018 proxy statement will be filed on or about March 15, [removed: 2018.][added: 2019.]
| | TABLE OF CONTENTS | | | | | [removed: Page(s)] [added: Page] |
| Item 1: | BUSINESS | | | | | [removed: [3](#s88A9D75667CA5A2082941043B1A3B423)] [added: [3](#s6D4F3E1BEA4059B088E4EB952FFAD4D3)] |
| Item 1A: | RISK FACTORS | | | | | [removed: [7](#sAE29AB392A3C53EDA10FFB4277AE4D1F)] [added: [8](#s4DFEA9F82E5C534491A614ADAE4883FF)] |
| Item 1B: | UNRESOLVED STAFF COMMENTS | | | | | [removed: [11](#sDB91599EC5DE593DA37DD4460AEE660C)] [added: [12](#s3AE26548915E5796816E7C1EBFA4C5D4)] |
| Item 2: | PROPERTIES | | | | | [removed: [11](#sD6D54F80BC1D5832B99F77DB4E242F1B)] [added: [13](#s991485F18DD059E69983FA5685C96A1A)] |
| Item 3: | LEGAL PROCEEDINGS | | | | | [removed: [11](#s8EBEA5B9BEE952EE81C39CF51D091058)] [added: [13](#sE85273CD24F75FAE9E255799ED93578E)] |
| Item 4: | MINE SAFETY DISCLOSURES | | | | | [removed: [11](#s7A883BC45AB95823A523886EF0B517C6)] [added: [13](#s540B658320F3568283D6679AEE50E1BF)] |
| Item 4A: | EXECUTIVE OFFICERS OF THE REGISTRANT | | | | | [removed: [12](#sd780a5b8f4b240cb96f3c91043783e36)] [added: [14](#sFEE7EB794E9954E3987E252D1EDBF138)] |
| Item 5: | MARKET FOR REGISTRANT'S COMMON EQUITY, RELATED SHAREHOLDER | | | | | [removed: [13](#sBD586AB76A5E55C4A73C461FAD896524)] [added: [15](#sD8FFCB84A3115794807821EE9BD7CE9D)] |
| Item 6: | SELECTED FINANCIAL DATA | | | | | [removed: [15](#s1A930BBABBB85BD3AB49E55098BD69F1)] [added: [17](#s4C6435A52EC0540683EC01BFB5AC1697)] |
| Item 7: | MANAGEMENT'S DISCUSSION AND ANALYSIS OF FINANCIAL | | | | | [removed: [16](#s76D611EA938F5ED6841837D5A84C972D)] [added: [18](#sAC5CEA07603953C69610A1964F8B99E7)] |
| Item 7A: | QUANTITATIVE AND QUALITATIVE DISCLOSURES ABOUT MARKET RISK | | | | | [removed: [31](#s41E6EEED1E1C580EB8C6236C209DEC57)] [added: [32](#s7D26A216F4885FB784DDCCCBE60383F6)] |
| Item 8: | FINANCIAL STATEMENTS AND SUPPLEMENTARY DATA | | | | | [removed: [31](#s940E60B3FA4F5A03A92EEB2BD6B147D9)] [added: [32](#s2EA84C8E1ED8570EB4AE620B5422D3B1)] |
| Item 9: | CHANGES IN AND DISAGREEMENTS WITH ACCOUNTANTS | | | | | [removed: [31](#sA4F1976673E05DE6BB760350932CB98C)] [added: [32](#s958A9BD7EB985321A258EA4FCA21C6FB)] |
| Item 9A: | CONTROLS AND PROCEDURES | | | | | [removed: [32](#sF907CE4DCD5E572C8C9C5AAAA87848D0)] [added: [33](#sF78F86F32D40558DB8504E2E7F0FFD18)] |
| Item 10: | DIRECTORS, EXECUTIVE OFFICERS AND CORPORATE GOVERNANCE | | | | | [removed: [33](#s4A25A80C77135CDBAD05FD054B1ABE14)] [added: [34](#s565EC308801C5ACD9804DC337B9BD8E2)] |
| Item 11: | EXECUTIVE COMPENSATION | | | | | [removed: [33](#sDD12B9721BF1508A9D28FF23925488EF)] [added: [34](#s89ED7066DBEE5CCC8211B9DCF75EE749)] |
| Item 13: | CERTAIN RELATIONSHIPS AND RELATED [removed: TRANSACTIONS] [added: TRANSACTIONS, AND DIRECTOR INDEPENDENCE] | | | | | [removed: [33](#s3D787EF3763A50D4AB2D84A30BBC509B)] [added: [34](#s6222C7BC99965187B10D7B4366EC19BD)] |
| Item 14: | PRINCIPAL ACCOUNTANT FEES AND SERVICES | | | | | [removed: [33](#s30A59F12890B5A5FA64D56E755D445F3)] [added: [34](#sB69745408075541882CD297F372BC1A0)] |
| Item 15: | EXHIBITS AND FINANCIAL STATEMENT SCHEDULES | | | | | [removed: [34](#s611257D2705E5ACB9B2932E716E6DFFC)] [added: [35](#s2D739BA7F12C54719BE887DFFB261802)] |
10-K 1 gww20181231-10k.htm 10-K
\[X\]
| | | | | |
| --- | --- | --- | --- | --- |
| | | | | |
| Item 9B: | OTHER INFORMATION | | | | | [33](#sFE7C72BA741F5E26B70FE8701C312C46) |
| Item 12: | SECURITY OWNERSHIP OF CERTAIN BENEFICIAL OWNERS AND MANAGEMENT AND RELATED STOCKHOLDER MATTERS | | | | | [34](#sDF8490F38E2955CA82B5E1116FD61B7E) |
| Item 16: | FORM 10-K SUMMARY | | | | | [35](#s2D739BA7F12C54719BE887DFFB261802) |
| Signatures | | | | | | [75](#sA31A0087E84B51ABA60C25F9CCEF74F4) |
10-K 1 gww20171231-10k.htm 10-K
\[ \]
| | | | |
| --- | --- | --- | --- |
| Item 9B: | INFORMATION REQUIRED TO BE DISCLOSED IN A FORM 8-K | | | | | [32](#s14EDDD9E0DF25F98B09581A232626FAB) |
| Item 12: | DIRECTORS AND EXECUTIVE OFFICERS | | | | | [33](#s5ACA7191030A59E99CFA7976C622A570) |
| Signatures | | | | | | [76](#sA2B46655D64B56FAA73336CDCC6050D7) |
Item 2. Properties
11 rewritten, 7 added, 5 removed, 9 unchanged
As of December 31, [removed: 2017,] [added: 2018,] Grainger’s owned and leased facilities totaled approximately [removed: 28.2] [added: 27] million square feet.
| Location | | Facility and Use [removed: (6)] [added: (7)] | | Size in Square Feet (in [removed: 000s)] [added: thousands)] | |
| U.S. (1) | | [removed: 284 U.S.] [added: 283] branch locations | | [removed: 6,367] [added: 6,349] | |
| U.S. (3) | | Other facilities | | [removed: 3,685] [added: 3,674] | |
| Other businesses [removed: (5)] [added: (6)] | | Other facilities | | [removed: 5,624] [added: 5,118] | |
| Chicago area (2) | | Headquarters and general offices | | [removed: 1,188] [added: 1,103] | |
| | | Total Square Feet | | [removed: 28,180] [added: 27,026] | |
| (2) | These facilities are primarily owned and range in size from approximately 45,000 [removed: square feet] to 1.3 million square feet. |
| (3) | These facilities include both owned and leased [removed: locations,] [added: locations and] primarily [removed: consisting] [added: consist] of storage facilities, office [removed: space, call centers] [added: space] and [removed: other properties.] [added: call centers.] |
| [removed: (5)] [added: (6)] | These facilities include owned and leased locations in Europe, [removed: Asia, Latin America] [added: Asia] and [added: Mexico and] other U.S. operations. |
| [removed: (6)] [added: (7)] | Owned facilities are not subject to any mortgages. |
| U.S. (2) | | 16 DCs | | 8,148 | |
| Canada (4) | | 92 branch locations | | 1,125 | |
| Canada (5) | | 5 DCs | | 968 | |
| Canada | | Other facilities | | 541 | |
| (1) | Consists of 249 stand-alone, 32 onsite and 2 will-call express locations, of which 202 are owned and 81 are leased. These branches range in size from approximately 500 to 109,000 square feet. |
| (4) | Consists of 72 stand-alone and 20 onsite locations, of which 33 are owned and 59 are leased. These branches range in size from approximately 500 to 110,000 square feet. Of these 92 branch locations, 54 are operational. |
| (5) | These facilities are primarily owned and range in size from approximately 40,000 to 540,000 square feet. |
| U.S. (2) | | 16 distribution centers | | 8,169 | |
| Canada (4) | | 139 facilities | | 3,147 | |
| (1) | Consists of 204 owned and 80 leased properties located throughout the U.S. ranging in size from approximately 500 to 109,000 square feet. |
| (4) | Consists of general offices, distribution centers and branches located throughout Canada, of which 58 are owned and 81 leased. |
Grainger continues to evaluate its physical footprint and announced throughout 2017 the intention to close 113 branches in the Canada business.
Item 4A. Executive Officers of the Registrant
4 rewritten, 4 added, 4 removed, 6 unchanged
Following is information about the Executive Officers of Grainger including age as of [removed: February 26, 2018.][added: January 31, 2019.]
| D.G. Macpherson [removed: (50)] [added: (51)] | Chairman of the Board, a position assumed in October 2017, and Chief Executive Officer, a position assumed in October 2016 at which time he was also appointed to the Board of Directors. Previously, Mr. Macpherson served as Chief Operating Officer, a position assumed in 2015; Senior Vice President and Group President, Global Supply Chain and International, a position assumed in 2013; Senior Vice President and President, Global Supply Chain and Corporate Strategy, a position assumed in 2012, and Senior Vice President, Global Supply Chain, a position assumed in 2008. [added: From 2002 to 2008, Mr. Macpherson was a partner and managing director at The Boston Consulting Group, a global management consulting firm.] |
| Paige K. Robbins [removed: (49)] [added: (50)] | Senior Vice [removed: President, Grainger] [added: President and] Chief Digital Officer, a position assumed in September 2017. Previously, Ms. Robbins served as Senior Vice President, Global Supply Chain, Branch Network, Contact Centers and Corporate Strategy, a position assumed in 2016. Since joining Grainger in September 2010, Ms. Robbins has held various positions as a Vice President, including in the areas of Global Supply Chain and Logistics. |
| Eric R. Tapia [removed: (41)] [added: (42)] | Vice President and Controller, a position assumed in 2016. [removed: Previously,] Mr. Tapia served as Vice President, Internal [removed: Audit] [added: Audit,] from 2010 to 2016. Mr. Tapia is a Certified Public Accountant (CPA) and before joining Grainger in 2010 was an audit partner with [removed: KPMG.] [added: KPMG, a global professional services firm.] |
| Kathleen S. Carroll (50) | Senior Vice President and Chief Human Resources Officer, a position assumed in December 2018. Previously, Ms. Carroll served as Executive Vice President, Chief Human Resources Officer of First Midwest Bancorp, Inc., a diversified financial services company, from 2017 to 2018. Prior to that role, Ms. Carroll was employed at Aon Corporation, a global insurance brokerage and consulting company, between 2006 and 2017, in various Human Resources roles, culminating in her position as Vice President, Global Head of Talent Acquisition. |
| John L. Howard (61) | Senior Vice President and General Counsel, a position assumed in 2000. Previously, Mr. Howard served in several roles of increasing responsibility at Tenneco, Inc., a global conglomerate. Prior to that role, Mr. Howard held a variety of legal positions in the federal government, including Associate Deputy Attorney General in the U.S. Department of Justice and in The White House as Counsel to the Vice President. |
| Deidra C. Merriwether (50) | Senior Vice President, U.S. Direct Sales and Strategic Initiatives, a position assumed in September 2017. Previously, Ms. Merriwether served as Vice President, Pricing and Indirect Procurement, a position assumed in 2016, and as a Vice President in Finance from 2013 to 2016. Prior to joining Grainger in September 2013, Ms. Merriwether has held various positions as a Vice President, including positions of increasing responsibility at Sears Holdings Corporation, a broadline retailer, PriceWaterhouseCoopers, a global professional services firm, and Eli Lilly & Company, a global pharmaceutical company, across Finance, Procurement and Operations, lastly serving as Chief Operating Officer, Retail Formats, at Sears Holdings Corporation. |
| Thomas B. Okray (56) | Senior Vice President and Chief Financial Officer, a position assumed in May 2018. Prior to joining Grainger, Mr. Okray served as Executive Vice President, Chief Financial Officer of Advance Auto Parts, Inc., a leading automotive aftermarket parts provider in North America, a position assumed in 2016. Previously, Mr. Okray served as Vice President, Finance, Global Customer Fulfillment, of Amazon.com, Inc., an online retailer, from January 2016 to October 2016; as Vice President, Finance, North American Operations of Amazon, from June 2015 to January 2016; and was employed by General Motors Company, a global automotive company, from July 1989 to June 2015, in a variety of finance and supply chain related roles, culminating in his position as CFO, Global Product Development, Purchasing & Supply Chain, from January 2010 to June 2015. |
| Laura D. Brown (54) | Senior Vice President, Communications and Investor Relations, a position assumed in 2010 after serving as Vice President, Global Business Communications, a position assumed in 2009 and Vice President, Investor Relations, a position assumed in 2008. |
| Joseph C. High (63) | Senior Vice President and Chief People Officer, a position assumed in June 2011. Prior to joining Grainger, Mr. High was the Senior Vice President of Human Resources at Owens Corning in Toledo, Ohio, a position assumed in 2004. |
| John L. Howard (60) | Senior Vice President and General Counsel, a position assumed in 2000. |
| Ronald L. Jadin (57) | Senior Vice President and Chief Financial Officer, a position assumed in 2008. Previously, Mr. Jadin served as Vice President and Controller, a position assumed in 2006 after serving as Vice President, Finance. On July 19, 2017, Mr. Jadin announced that he planned to retire from the Company at the end of 2017. Mr. Jadin has agreed to continue serving the Company in his current position as Senior Vice President and Chief Financial Officer until the transition to his successor is completed later in 2018. |
Item 5. Market for Registrant’s Common Equity, Related Shareholder Matters and Issuer Purchases of Equity Securities
7 rewritten, 6 added, 21 removed, 23 unchanged
The approximate number of shareholders of record of Grainger’s common stock as of [removed: February 7, 2018,] [added: January 31, 2019,] was [removed: 688] [added: 650] with approximately [removed: 150,934] [added: 191,921] additional shareholders holding stock through nominees.
| (A) | [removed: 85] [added: No] shares were withheld to satisfy tax withholding obligations in connection with the vesting of employee restricted stock awards. |
It covers the period commencing December 31, [removed: 2012,] [added: 2013,] and ending December 31, [removed: 2017.][added: 2018.]
The graph assumes that the value for the investment in Grainger common stock and in each index was $100 on December 31, [removed: 2012,] [added: 2013,] and that all dividends were reinvested.
[removed: 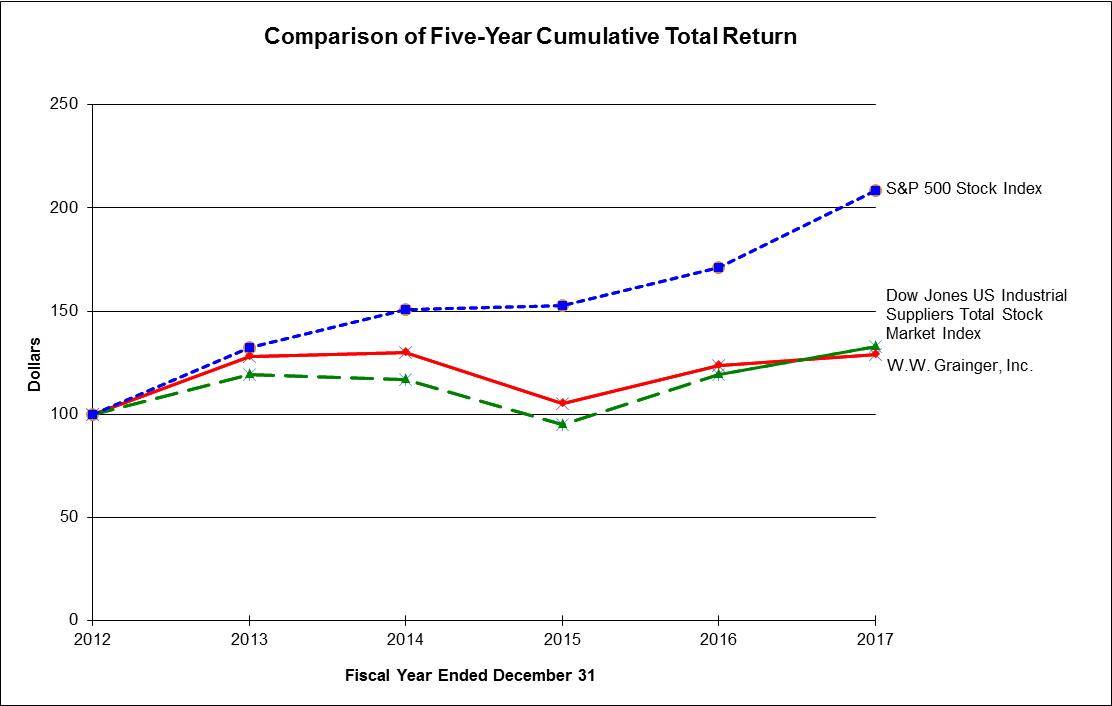][added: 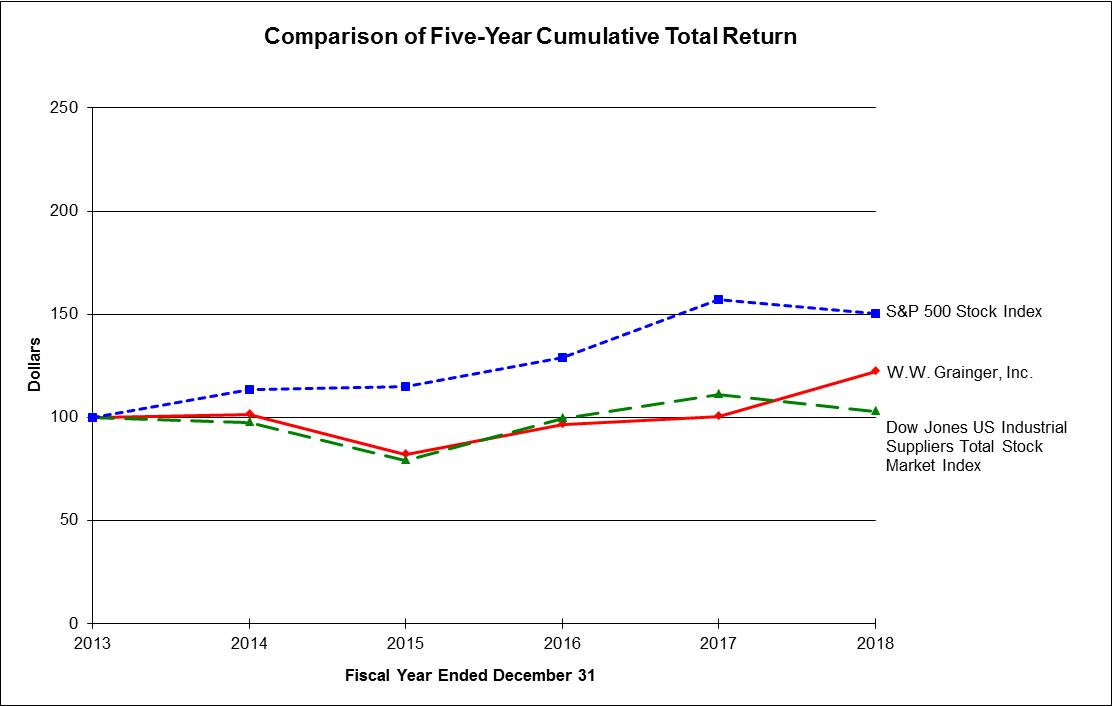]
| | [removed: 2012 | | |] 2013 | | | 2014 | | | 2015 | | | 2016 | | | 2017 | | | [added: 2018 | | |]
| Dow Jones US Industrial Suppliers Total Stock Market Index | 100 | | | [removed: 119] [added: 98] | | | [removed: 117] [added: 79] | | | [removed: 95] [added: 100] | | | [removed: 119] [added: 111] | | | [removed: 133] [added: 103] | | |
| Oct. 1 – Oct. 31 | 230,018 | $295.99 | 230,018 | 1,619,794 | | shares |
| Nov. 1 – Nov. 30 | 122,422 | $295.33 | 122,422 | 1,497,372 | | shares |
| Dec. 1 – Dec. 31 | 118,627 | $289.72 | 118,627 | 1,378,745 | | shares |
| Total | 471,067 | $294.24 | 471,067 | | | |
| W.W. Grainger, Inc. | $ | 100 | | $ | 102 | | $ | 82 | | $ | 96 | | $ | 101 | | $ | 122 | |
| S&P 500 Stock Index | 100 | | | 114 | | | 115 | | | 129 | | | 157 | | | 150 | | |
The high and low sales prices for the common stock and the dividends declared and paid per share for each calendar quarter during 2017 and 2016 are shown below.
| | | | | | | | | | | | | |
| --- | --- | --- | --- | --- | --- | --- | --- | --- | --- | --- | --- | --- |
| | | Market Price Per Share | | | | | | | | | | |
| | Quarters | High | | | | Low | | | | Dividends | | |
| 2017 | First | $ | 262.72 | | | $ | 229.05 | | | $ | 1.22 | |
| | Second | 234.66 | | | | 168.58 | | | | 1.28 | | |
| | Third | 185.82 | | | | 155.00 | | | | 1.28 | | |
| | Fourth | 240.49 | | | | 166.46 | | | | 1.28 | | |
| | Year | $ | 262.72 | | | $ | 155.00 | | | $ | 5.06 | |
| 2016 | First | $ | 234.77 | | | $ | 176.85 | | | $ | 1.17 | |
| | Second | 239.95 | | | | 212.64 | | | | 1.22 | | |
| | Third | 235.53 | | | | 212.54 | | | | 1.22 | | |
| | Fourth | 240.74 | | | | 201.94 | | | | 1.22 | | |
| | Year | $ | 240.74 | | | $ | 176.85 | | | $ | 4.83 | |
| Oct. 1 – Oct. 31 | 206,586 | $185.37 | 206,586 | 3,506,481 | | shares |
| Nov. 1 – Nov. 30 | 237,397 | $199.91 | 237,397 | 3,269,084 | | shares |
| Dec. 1 – Dec. 31 | 410,679 | $227.94 | 410,679 | 2,858,405 | | shares |
| Total | 854,662 | $209.86 | 854,662 | | | |
| W.W. Grainger, Inc. | $ | 100 | | $ | 128 | | $ | 130 | | $ | 105 | | $ | 124 | | $ | 129 | |
| S&P 500 Stock Index | 100 | | | 132 | | | 151 | | | 153 | | | 171 | | | 208 | | |
Item 6. Selected Financial Data
10 rewritten, 5 added, 13 removed, 8 unchanged
| | [removed: 2017] [added: 2018] | | | | [removed: 2016] [added: 2017] | | | | [removed: 2015] [added: 2016] | | | | [removed: 2014] [added: 2015] | | | | [removed: 2013] [added: 2014] | | |
| | (In [removed: thousands] [added: millions] of dollars, except for per share amounts) | | | | | | | | | | | | | | | | | | |
| Net earnings per basic share | [removed: 10.07] [added: 13.82] | | | | [removed: 9.94] [added: 10.07] | | | | [removed: 11.69] [added: 9.94] | | | | [removed: 11.59] [added: 11.69] | | | | [removed: 11.31] [added: 11.59] | | |
| Net earnings per diluted share | [removed: 10.02] [added: 13.73] | | | | [removed: 9.87] [added: 10.02] | | | | [removed: 11.58] [added: 9.87] | | | | [removed: 11.45] [added: 11.58] | | | | [removed: 11.13] [added: 11.45] | | |
| Long-term debt (less current maturities) and other long-term liabilities | [removed: 2,469,860] [added: 2,279] | | | | [removed: 2,159,602] [added: 2,469] | | | | [removed: 1,716,507] [added: 2,160] | | | | [removed: 737,232] [added: 1,717] | | | | [removed: 743,702] [added: 737] | | |
| Cash dividends paid per share | $ | [removed: 5.06] [added: 5.36] | | | $ | [removed: 4.83] [added: 5.06] | | | $ | [removed: 4.59] [added: 4.83] | | | $ | [removed: 4.17] [added: 4.59] | | | $ | [removed: 3.59] [added: 4.17] | |
This was partially offset by the net benefit of $15 million related to U.S. tax legislation and other discrete tax [removed: items and a net benefit of $3 million related to General Services Administrative (GSA) and unclaimed property reserves.][added: items.]
Net earnings for 2016 included a net expense of $105 million primarily [removed: consisting of] [added: related to restructuring actions in] the [removed: following:][added: U.S. and Canada, goodwill and intangible impairments, contingencies and a net tax benefit.]
Net earnings for 2014 included a net charge of $56 million primarily composed of a $28 million charge related to closing of the business in Brazil, a $10 million charge due to [removed: the] [added: a] retirement plan transition in Europe, a $10 million charge related to restructuring of the business in Europe and [removed: a] [added: an] $8 million charge related to a goodwill impairment charge in other businesses.
Grainger completed several acquisitions in the years [removed: 2013 through] [added: 2014 and] 2015, all of which were immaterial individually and in the aggregate.
| Net sales | $ | 11,221 | | | $ | 10,425 | | | $ | 10,137 | | | $ | 9,973 | | | $ | 9,965 | |
| Net earnings attributable to W.W. Grainger, Inc. (herein referred to as Net earnings) | 782 | | | | 586 | | | | 606 | | | | 769 | | | | 802 | | |
| Total assets | 5,873 | | | | 5,804 | | | | 5,694 | | | | 5,858 | | | | 5,283 | | |
| Total shareholders' equity | 2,093 | | | | 1,828 | | | | 1,906 | | | | 2,353 | | | | 3,284 | | |
Net earnings for 2018 included a net expense of $170 million primarily consisting of a $133 million net non-cash charge related to the Cromwell goodwill and trade name impairment in other businesses and a net charge of $37 million related to restructuring primarily consisting of asset impairment charges in Canada and other related charges, net of gains from the sales of branches in the U.S., Canada and corporate offices.
| Net sales | $ | 10,424,858 | | | $ | 10,137,204 | | | $ | 9,973,384 | | | $ | 9,964,953 | | | $ | 9,437,758 | |
| Net earnings attributable to W.W. Grainger, Inc. (herein referred to as Net earnings) | 585,730 | | | | 605,928 | | | | 768,996 | | | | 801,729 | | | | 797,036 | | |
| Total assets | 5,804,254 | | | | 5,694,307 | | | | 5,857,755 | | | | 5,283,049 | | | | 5,266,328 | | |
| Total shareholders' equity | $ | 1,827,733 | | | $ | 1,905,768 | | | $ | 2,352,714 | | | $ | 3,284,101 | | | $ | 3,326,836 | |
| | |
| --- | --- |
| • | Restructuring: A net charge of $26 million related to restructuring actions. These actions primarily included branch closures, net of gains on sale of branch real estate in the U.S. and Canada businesses. |
| • | Goodwill and intangible impairments: An impairment charge of $52 million related to goodwill and intangible impairments in other businesses. |
| • | Unclaimed property contingency: A charge of $23 million related to an adjustment for unclaimed property in the U.S. business primarily related to activity from 2008 through 2012. |
| • | GSA contingency: A charge of $6 million to increase the U.S. business reserve for certain tax, freight and miscellaneous billing issues in connection with the audit of government contracts with the GSA first entered in 1999. |
| • | Inventory adjustment: A charge of $7 million related to an inventory adjustment in the Canada business to reflect an updated reserve methodology and better visibility to inventory performance provided by the conversion to the U.S. ERP system. |
| • | Discrete tax items: A net benefit of $9 million related to the conclusion of the federal income tax audit for the years 2009 through 2012 in the U.S. business and other discrete tax items. |
Net earnings for 2013 included a net charge of $28 million primarily composed of $21 million in impairment charges in other businesses primarily for goodwill and a $7 million charge related to restructuring the businesses in Europe and China.
Item 8. Financial Statements and Supplementary Data
1 rewritten, 0 added, 0 removed, 1 unchanged
The financial statements and supplementary data are included on pages 37 to [removed: 77.][added: 75.]
Item 9A. Controls and Procedures
1 rewritten, 0 added, 0 removed, 15 unchanged
The report from Ernst & Young LLP on its audit of the effectiveness of Grainger's internal control over financial reporting as of December 31, [removed: 2017,] [added: 2018,] is included on page 38 of this Report under the heading Report of Independent Registered Public Accounting Firm.
Item 10. Directors, Executive Officers and Corporate Governance
1 rewritten, 0 added, 0 removed, 5 unchanged
The information required by this item is incorporated by reference to Grainger's proxy statement relating to the annual meeting of shareholders to be held April [removed: 25, 2018,] [added: 24, 2019,] under the captions [removed: “Directors,” “Board of Directors] [added: “Nominees] and [added: Director Experience and Qualifications,” "Annual Election of Directors,” “Candidates for] Board [removed: Committees”] [added: Membership,” “Board Affairs] and [added: Nominating Committee,” “Audit Committee” and] “Section 16(a) Beneficial Ownership Reporting Compliance.” Information required by this item regarding executive officers of Grainger is set forth [removed: below] [added: in Part I, Item 4A,] under the caption “Executive [removed: Officers.”][added: Officers of the Registrant.”]
Item 11. Executive Compensation
1 rewritten, 0 added, 0 removed, 0 unchanged
The information required by this item is incorporated by reference to Grainger's proxy statement relating to the annual meeting of shareholders to be held April [removed: 25, 2018,] [added: 24, 2019,] under the captions [removed: “Board of Directors and Board Committees,”] “Director Compensation,” [added: “Compensation Discussion and Analysis,” “Compensation Committee,”] “Report of the Compensation Committee of the Board” and [removed: “Compensation Discussion and Analysis.”][added: "Fees for Independent Compensation Consultant."]
Item 12. Security Ownership of Certain Beneficial Owners and Management and Related Stockholder Matters
1 rewritten, 0 added, 0 removed, 0 unchanged
The information required by this item is incorporated by reference to Grainger's proxy statement relating to the annual meeting of shareholders to be held April [removed: 25, 2018,] [added: 24, 2019,] under the captions “Ownership of Grainger Stock” and “Equity Compensation Plans.”
Item 13. Certain Relationships and Related Transactions, and Director Independence
1 rewritten, 0 added, 0 removed, 0 unchanged
The information required by this item is incorporated by reference to Grainger's proxy statement relating to the annual meeting of shareholders to be held April [removed: 25, 2018,] [added: 24, 2019,] under the captions [removed: "Election] [added: “Director Independence,” "Annual Election] of Directors" and [removed: "Transactions] [added: “Transactions] with Related [removed: Persons."][added: Persons.”]
Item 14. Principal Accountant Fees and Services
1 rewritten, 0 added, 0 removed, 1 unchanged
The information required by this item is incorporated by reference to Grainger's proxy statement relating to the annual meeting of shareholders to be held April [removed: 25, 2018,] [added: 24, 2019,] under the caption “Audit Fees and Audit Committee Pre-Approval Policies and Procedures.”
Item 15. Exhibits and Financial Statements Schedules
1 rewritten, 0 added, 1,249 removed, 9 unchanged
| (3) | Exhibits Required by Item 601 of Regulation S-K: the information required by this Item 15(a)(3) of Form 10-K is set forth on the Exhibit Index that follows the Signatures page [removed: 77] [added: 75] of the Form 10-K. |
| | |
| --- | --- |
INDEX TO FINANCIAL STATEMENTS AND SUPPLEMENTARY DATA
December 31, 2017, 2016 and 2015
| Page(s) | |
| MANAGEMENT'S ANNUAL REPORT ON INTERNAL CONTROL OVER FINANCIAL REPORTING | [36](#sBE8FAB2373325EF1B981858AD55E7B2F) |
| REPORTS OF INDEPENDENT REGISTERED PUBLIC ACCOUNTING FIRM | [37](#s7CED99EC69C15A1D8BDF0B9F5155FC8D) |
| FINANCIAL STATEMENTS | |
| CONSOLIDATED STATEMENTS OF EARNINGS | [39](#s80BEF605DE445BE7899DF8D03584F78E) |
| CONSOLIDATED STATEMENTS OF COMPREHENSIVE EARNINGS | [40](#s4EB976A8755350DD894B8FC924EF1999) |
| CONSOLIDATED BALANCE SHEETS | [41](#s997DB84BF9845DFABF7262A99BF7AD16) |
| CONSOLIDATED STATEMENTS OF CASH FLOWS | [42](#s62F02945E38A536C9F8F4CD22ABF1975) |
| CONSOLIDATED STATEMENTS OF SHAREHOLDERS' EQUITY | [43](#s8BE49EE0235D5C68BE57647FEEE34259) |
| NOTES TO CONSOLIDATED FINANCIAL STATEMENTS | [44](#sE1D11362EBCF5B1E93C18E802C485404) |
MANAGEMENT'S ANNUAL REPORT ON INTERNAL CONTROL OVER FINANCIAL REPORTING
The management of W.W. Grainger, Inc. (Grainger) is responsible for establishing and maintaining adequate internal control over financial reporting.
Grainger's internal control system was designed to provide reasonable assurance to Grainger's management and Board of Directors regarding the reliability of financial reporting and the preparation of financial statements for external purposes in accordance with accounting principles generally accepted in the United States of America.
Because of its inherent limitations, internal control over financial reporting may not prevent or detect misstatements under all potential conditions.
Therefore, effective internal control over financial reporting provides only reasonable, and not absolute, assurance with respect to the preparation and presentation of financial statements.
Grainger's management assessed the effectiveness of Grainger's internal control over financial reporting as of December 31, 2017, based on criteria established in Internal Control - Integrated Framework issued by the Committee of Sponsoring Organizations of the Treadway Commission (2013 framework) (the COSO criteria).
Based on its assessment under that framework and the criteria established therein, Grainger's management concluded that Grainger's internal control over financial reporting was effective as of December 31, 2017.
Ernst & Young LLP, an independent registered public accounting firm, has audited Grainger's internal control over financial reporting as of December 31, 2017, as stated in their report, which is included herein.
Report of Independent Registered Public Accounting Firm
To the Shareholders and the Board of Directors of
W.W. Grainger, Inc. and Subsidiaries
Opinion on the Financial Statements
We have audited the accompanying consolidated balance sheets of W.W. Grainger, Inc. and subsidiaries (the Company) as of December 31, 2017 and 2016, the related consolidated statements of earnings, comprehensive earnings, and shareholders’ equity and cash flows for each of the three years in the period ended December 31, 2017, and the related notes (collectively referred to as the “consolidated financial statements”).
In our opinion, the consolidated financial statements present fairly, in all material respects, the financial position of the Company at December 31, 2017 and 2016, and the consolidated results of its operations and its cash flows for each of the three years in the period ended December 31, 2017, in conformity with U.S. generally accepted accounting principles.
We also have audited, in accordance with the standards of the Public Company Accounting Oversight Board (United States) (PCAOB), the Company’s internal control over financial reporting as of December 31, 2017, based on criteria established in Internal Control-Integrated Framework issued by the Committee of Sponsoring Organizations of the Treadway Commission (2013 framework) and our report dated February 26, 2018 expressed an unqualified opinion thereon.
Basis for Opinion
These financial statements are the responsibility of the Company’s management.
Our responsibility is to express an opinion on the Company’s financial statements based on our audits.
We are a public accounting firm registered with the PCAOB and are required to be independent with respect to the Company in accordance with the U.S. federal securities laws and the applicable rules and regulations of the Securities and Exchange Commission and the PCAOB.
We conducted our audits in accordance with the standards of the PCAOB.
Those standards require that we plan and perform the audit to obtain reasonable assurance about whether the financial statements are free of material misstatement, whether due to error or fraud.
Our audits included performing procedures to assess the risks of material misstatement of the financial statements, whether due to error or fraud, and performing procedures that respond to those risks.
Such procedures included examining, on a test basis, evidence regarding the amounts and disclosures in the financial statements.
Our audits also included evaluating the accounting principles used and significant estimates made by management, as well as evaluating the overall presentation of the financial statements.
We believe that our audits provide a reasonable basis for our opinion.
/s/ Ernst & Young LLP
An excerpt. Shown here: all 1 rewritten, all 0 added and 40 of 1,249 removed. The counts are complete. For every sentence, read Item 15. Exhibits and Financial Statements Schedules in the FY2018 filing and the FY2017 filing.
Item 16. Form 10-K Summary
0 rewritten, 1,412 added, 0 removed, 0 unchanged
New section this year
None.
INDEX TO FINANCIAL STATEMENTS AND SUPPLEMENTARY DATA
December 31, 2018, 2017 and 2016
| | |
| --- | --- |
| | |
| Page | |
| MANAGEMENT'S ANNUAL REPORT ON INTERNAL CONTROL OVER FINANCIAL REPORTING | [37](#s67F16689B98C5F6484F46B470AF8944D) |
| REPORTS OF INDEPENDENT REGISTERED PUBLIC ACCOUNTING FIRM | [38](#sE60BB6C166D2570E89530AA54BD58881) |
| FINANCIAL STATEMENTS | |
| CONSOLIDATED STATEMENTS OF EARNINGS | [40](#sDB2650611A6E5610984FDA069EA00ADA) |
| CONSOLIDATED STATEMENTS OF COMPREHENSIVE EARNINGS | [41](#s59ED7B9127F75492815E5BC0CB88ED5C) |
| CONSOLIDATED BALANCE SHEETS | [42](#s790F0FCE31715517AA07ACD3EEA81CA8) |
| CONSOLIDATED STATEMENTS OF CASH FLOWS | [43](#s1BE6A9B1059059F09F213672A0540B7A) |
| CONSOLIDATED STATEMENTS OF SHAREHOLDERS' EQUITY | [44](#s552375B334A751D58042BD9CEFA45B91) |
| NOTES TO CONSOLIDATED FINANCIAL STATEMENTS | [45](#sF35EB77D377E5635AF35F606CAB68B45) |
MANAGEMENT'S ANNUAL REPORT ON INTERNAL CONTROL OVER FINANCIAL REPORTING
The management of W.W. Grainger, Inc. (Grainger) is responsible for establishing and maintaining adequate internal control over financial reporting.
Grainger's internal control system was designed to provide reasonable assurance to Grainger's management and Board of Directors regarding the reliability of financial reporting and the preparation of financial statements for external purposes in accordance with accounting principles generally accepted in the United States of America.
Because of its inherent limitations, internal control over financial reporting may not prevent or detect misstatements under all potential conditions.
Therefore, effective internal control over financial reporting provides only reasonable, and not absolute, assurance with respect to the preparation and presentation of financial statements.
Grainger's management assessed the effectiveness of Grainger's internal control over financial reporting as of December 31, 2018, based on criteria established in Internal Control - Integrated Framework issued by the Committee of Sponsoring Organizations of the Treadway Commission (2013 framework) (the COSO criteria).
Based on its assessment under that framework and the criteria established therein, Grainger's management concluded that Grainger's internal control over financial reporting was effective as of December 31, 2018.
Ernst & Young LLP, an independent registered public accounting firm, has audited Grainger's internal control over financial reporting as of December 31, 2018, as stated in their report, which is included herein.
Report of Independent Registered Public Accounting Firm
To the Shareholders and the Board of Directors of
W.W. Grainger, Inc. and Subsidiaries
Opinion on the Financial Statements
We have audited the accompanying consolidated balance sheets of W.W. Grainger, Inc. and subsidiaries (the Company) as of December 31, 2018 and 2017, the related consolidated statements of earnings, comprehensive earnings, shareholders’ equity and cash flows for each of the three years in the period ended December 31, 2018, and the related notes (collectively referred to as the “consolidated financial statements”).
In our opinion, the consolidated financial statements present fairly, in all material respects, the financial position of the Company at December 31, 2018 and 2017, and the consolidated results of its operations and its cash flows for each of the three years in the period ended December 31, 2018, in conformity with U.S. generally accepted accounting principles.
We also have audited, in accordance with the standards of the Public Company Accounting Oversight Board (United States) (PCAOB), the Company’s internal control over financial reporting as of December 31, 2018, based on criteria established in Internal Control-Integrated Framework issued by the Committee of Sponsoring Organizations of the Treadway Commission (2013 framework) and our report dated February 28, 2019 expressed an unqualified opinion thereon.
Basis for Opinion
These financial statements are the responsibility of the Company’s management.
Our responsibility is to express an opinion on the Company’s financial statements based on our audits.
We are a public accounting firm registered with the PCAOB and are required to be independent with respect to the Company in accordance with the U.S. federal securities laws and the applicable rules and regulations of the Securities and Exchange Commission and the PCAOB.
We conducted our audits in accordance with the standards of the PCAOB.
Those standards require that we plan and perform the audit to obtain reasonable assurance about whether the financial statements are free of material misstatement, whether due to error or fraud.
Our audits included performing procedures to assess the risks of material misstatement of the financial statements, whether due to error or fraud, and performing procedures that respond to those risks.
Such procedures included examining, on a test basis, evidence regarding the amounts and disclosures in the financial statements.
Our audits also included evaluating the accounting principles used and significant estimates made by management, as well as evaluating the overall presentation of the financial statements.
An excerpt. Shown here: all 0 rewritten, 40 of 1,412 added and all 0 removed. The counts are complete. For every sentence, read Item 16. Form 10-K Summary in the FY2018 filing.