 filings.tools
Masco (MAS) 10-K risk factor changes: FY2014 vs FY2013
The 2014-12-31 10-K against the 2013-12-31 one, compared heading by heading and sentence by sentence. One of these filings carries no fiscal year tag, so its year is the calendar year of the period end.
Item 1A35 rewritten51 added13 removed82 unchanged
All filing items1,099 rewritten504 added699 removed1,499 unchanged
Summary
counted, not written
- Item 1A lists 18 risk factor headings: 7 new, 1 reworded and 10 unchanged since FY2013. 1 heading from FY2013 no longer appears.
- Sentence by sentence, 504 added, 699 removed, 1,099 rewritten and 1,499 unchanged across 18 items that differ.
New Item 1A headings (7)
- _Risks Related to our Business_
- We may not achieve all of the anticipated benefits of our strategic and operational initiatives or our actions to improve our underperforming cabinetry businesses.
- If we cannot adequately protect or prevent unauthorized use of our intellectual property we may be adversely affected.
- Our operations may be adversely affected by information systems interruptions or intrusions.
- _Risks Related to our Proposed Spin-off Transaction_
- We are pursuing a plan to spin-off our Installation and Other Services segment (our "Services Business"). We are incurring significant costs in connection with this transaction, which also requires considerable time and attention of our management, and we may not be able to complete the transaction or, if the transaction is completed, realize the anticipated benefits.
- The proposed spin-off of our Services Business could result in substantial tax liability to us and our stockholders.
Removed Item 1A headings (1)
- Our actions to improve our underperforming businesses have been costly and may not yield all of the anticipated benefits.
Reworded Item 1A headings (1)
- Compliance with government regulation and industry standards could impact our
[removed: capital expenditures and]operating results.
A heading is new when no FY2013 heading matches it after ignoring case and punctuation, and reworded when it shares at least 60 percent of its words with one that went away. All current risk factor headings.
Sentences by item
21 items, with every count and a link to each item that changed
Underlined words on a shaded ground are new in FY2014; struck-through words were in FY2013. Sentences that are wholly new or wholly gone are labelled rather than marked.
Item 1A. Risk Factors.
35 rewritten, 51 added, 13 removed, 82 unchanged
Read the full itemFY2014 item · filed February 13, 2015FY2013 item · filed February 14, 2014
Macroeconomic [removed: conditions] [added: conditions,] including consumer confidence levels, fluctuations in home prices, unemployment and underemployment levels, [added: student loan debt, household formation] and the availability of home equity loans and mortgages and the interest rates for such loans, affect both consumers' discretionary spending on home improvement projects as well as new home construction activity.
While improving, both new home construction and consumer spending for big ticket remodeling projects [removed: continues] [added: continue] to be [removed: well] below historic average [removed: levels, which affect our results of operations.][added: levels.]
The [removed: volatile and] challenging economic environment of recent years has caused shifts in consumer preferences and purchasing practices and changes in the business models and strategies of our customers.
[removed: For example, consumers] [added: Consumers] are increasingly using the internet and mobile technology to research home improvement products and to inform and [removed: enhance] [added: provide feedback on] their purchasing and ownership experience for these [removed: products, particularly with consumer-initiated messaging.][added: products.]
For example, demand has increased for multi-family housing units such as apartments and condominiums, which typically have smaller kitchens and smaller and fewer bathrooms, each with fewer cabinets and faucets, as well [added: as] less insulation, than single-family houses.
[removed: These] [added: In some of our segments, these] shifts have negatively impacted our sales and/or our profitability, and it is uncertain whether these shifts represent long-term changes in consumer preferences.
If we do not timely and effectively identify and respond to these changing consumer preferences and purchasing practices, our relationships with our customers and with consumers could be harmed, the [added: demand for our brands and products could be reduced and our results of operations could be negatively affected.]
[removed: Our actions to improve our underperforming businesses have been costly and] [added: We] may not [removed: yield] [added: achieve] all of the anticipated [removed: benefits.][added: benefits of our strategic and operational initiatives or our actions to improve our underperforming cabinetry businesses.]
The downturn in home improvement and new home construction activity during the recent recession impacted our results, particularly [removed: in our Cabinets and Related Products and Installation and Other Services segments and certain businesses in] [added: at] our [removed: Plumbing Products segment.][added: cabinetry businesses.]
In response, we [added: have] implemented initiatives to reduce costs and increase sales; however, there is no assurance that our efforts will yield all of the anticipated benefits.
Our [removed: cost-saving initiatives,] [added: initiatives to improve our cabinetry operations,] including rationalizing our businesses, closing plants and reducing [removed: headcount] [added: headcount,] have been complex, time-consuming and expensive.
The consolidation of our North American Cabinet businesses, in particular, [removed: has] involved the integration of multiple manufacturing processes and information technology [removed: platforms.][added: platforms and continues to affect our operations.]
Our strategy to increase our [added: cabinetry businesses'] sales [removed: in the Cabinets and Related Products segment] through brand [removed: building] [added: building, enhanced customer relationships] and new product introductions requires time to [removed: develop, implement] [added: implement, execute] and assess.
Further, [removed: this segment faces] [added: these businesses continue to face] pricing pressures, competition from low-cost manufacturers and a shift in the mix of products in certain channels to more value-priced products.
In [removed: 2013,] [added: 2014, net] sales to our largest customer, The Home Depot, were $2.3 billion (approximately [removed: 28] [added: 27] percent of consolidated net sales).
In [removed: 2013,] [added: 2014,] sales to Lowe's were less than ten percent of our consolidated net sales.
[removed: In addition, we] [added: We] may undermine the business relationships we have with our current customers if we increase the amount of business we transact directly with consumers.
[added: Additionally, home] centers, which have historically concentrated their sales efforts on retail consumers and remodelers, are increasingly marketing directly to professional contractors and installers, which may impact our margins on our products that contractors and installers would otherwise buy through our dealers and wholesalers.
These foreign manufacturers are putting downward pressures on [removed: price, particularly in the emerging markets we are entering.][added: price.]
In some of our segments, we are [removed: experiencing] [added: continuing to experience] a shift in the mix of [added: some] products we sell toward more value-priced or opening price point products, which may impact our ability to maintain or gain share and our profitability.
To [removed: minimize] [added: help reduce] price volatility associated with certain anticipated commodity purchases, we use derivative instruments, including commodity futures and swaps.
Resourcing these products and components to another supplier could take time and involve significant [removed: costs.]
[added: The distances involved in these arrangements, together with differences in business practices,] shipping and delivery requirements, the limited number of suppliers, and laws and regulations, have increased the complexity of our supply chain logistics and the potential for interruptions in our production scheduling.
Approximately [removed: 20] [added: 19] percent of our sales are made outside of North America (principally in Europe) and are transacted in currencies other than U.S. dollars (principally the Euro and the British pound sterling).
[removed: Increased] [added: Increasing our] international sales [removed: make up] [added: is] an important part of our future strategic plans.
[removed: The financial reporting of] [added: In addition,] our [removed: consolidated operating] [added: financial] results [removed: is] [added: could be adversely] affected by [added: the currency conversion rate if the U.S. dollar strengthens in value relative to foreign currencies, particularly the Euro, and] fluctuations in currency exchange [removed: rates, which] [added: rates] may present challenges in comparing operating performance from period to period.
Further, as the economy continues to recover, if we are unable to recruit, train and retain sufficient skilled labor, we may not be able to [removed: adequately satisfy increased demand for our products and services, which could impact our operating results.]
Due to their scope and complexity, however, these lawsuits can be [added: particularly costly to defend and resolve, and we have and may continue to incur significant costs as a result of these types of lawsuits.]
Expectations about the [removed: recovery] [added: growth of new home construction and home improvement activity] may impact whether we are required to recognize additional non-cash, pre-tax impairment charges for goodwill and other indefinite-lived intangible assets or other long-lived assets.
[removed: In the past we] [added: We] have negotiated amendments to our credit agreement to allow for the add-back to shareholders' equity for impairment charges we have taken.
Compliance with government regulation and industry standards could impact our [removed: capital expenditures and] operating results.
We are subject to [removed: U.S.] [added: federal, state] and foreign government regulations, particularly those pertaining to health and safety (including protection of employees and consumers), climate disruption and environmental issues.
In addition to complying with current requirements and requirements that will become effective at a future date, even more stringent requirements could be imposed on [removed: our industries] [added: us] in the future.
Compliance with these regulations and industry standards may require us to alter our [added: product designs, our] manufacturing and installation processes [removed: and our sourcing, which could adversely impact] [added: or] our [removed: competitive position.][added: sourcing.]
Further, if we do not effectively and timely comply with such regulations and industry standards, our [removed: operating] results [added: of operations] could be negatively affected.
_Risks Related to our Business_
In 2014, we announced new strategic initiatives, which are designed to increase shareholder value over the mid- to long-term.
Our business performance and results could be adversely affected if we are unable to execute these strategic initiatives, or if we are unable to execute them in a timely and efficient manner.
We have also identified a number of operational initiatives, which include making significant investments in technology systems that are key to managing our business.
We could be adversely affected if we do not effectively implement our operational initiatives in a timely manner.
If our strategy to increase our sales is not successful, our results of operations may continue to be negatively impacted.
If the mix of our business operations significantly changes, including as a result of acquisitions or divestitures, our reliance on these significant customers may increase.
costs.
If we cannot adequately protect or prevent unauthorized use of our intellectual property we may be adversely affected.
Protecting our intellectual property is critical to our innovation efforts.
We own a number of patents, trade names, brand names and other forms of intellectual property in our products and manufacturing processes throughout the world.
There can be no assurance that our efforts to protect our intellectual property rights will prevent violations.
Our intellectual property may be challenged or infringed upon by third parties, particularly in countries where property rights are not highly developed or protected.
In addition, the global nature of our business increases the risk that we may be unable to obtain or maintain our intellectual property rights on reasonable terms.
Furthermore, others may assert intellectual property infringement claims against us.
If we are not able to protect our existing intellectual property rights, or prevent unauthorized use of our intellectual property, sales of our products may be affected and we may experience reputational damage to our brand names, increased litigation costs and adverse impact to our competitive position, which could affect our results of operations.
adequately satisfy increased demand for our products and services, which could impact our operating results.
Such actions could divert our attention and resources to compliance activities, and could cause us to incur higher costs.
Our operations may be adversely affected by information systems interruptions or intrusions.
We rely on a number of information technology systems to process, transmit, store and manage information to support our business activities.
Increased global cybersecurity vulnerabilities, threats and more sophisticated and targeted attacks pose a risk to our information technology systems.
We have established security policies, processes and layers of defense designed to help identify and protect against intentional and unintentional misappropriation or corruption of our systems and information and disruption of our operations.
Despite these efforts, our systems may be damaged, disrupted, or shut down due to attacks by unauthorized access, malicious software, undetected intrusion, hardware failures, or other events, and in these circumstances our disaster recovery planning may be ineffective or inadequate.
These breaches or intrusions could lead to business interruption, exposure of proprietary or confidential information, data corruption, damage to our reputation, exposure to litigation, and increased operational costs.
Such events could have a material adverse impact on our business, financial condition and results of operation.
In addition, we could be adversely affected if any of our significant customers or suppliers experience any similar events that disrupt their business operations or damage their reputation.
_Risks Related to our Proposed Spin-off Transaction_
We are pursuing a plan to spin-off our Installation and Other Services segment (our "Services Business").
We are incurring significant costs in connection with this transaction, which also requires considerable time and attention of our management, and we may not be able to complete the transaction or, if the transaction is completed, realize the anticipated benefits.
In September 2014, we announced a plan to separate our Services Business from our other businesses through a spin-off transaction in which we would distribute the common stock of the Services Business to our existing shareholders in a tax-free transaction.
Completion of the transaction will be contingent upon approval by our Board of Directors, our receipt of an opinion from tax counsel, the
effectiveness of a Registration Statement on Form 10, and certain other conditions.
Additionally, our ability to complete the spin-off in a timely manner, if at all, could be affected by several factors, including:
our ability to obtain sufficient financing for the newly-created entity on acceptable terms;
our ability to obtain any necessary consents or approvals;
changes in the underlying businesses, contracts, or customers; and
political and economic conditions at the time of the transaction.
For these and other reasons, we may not be able to complete the spin-off within the expected time frame or at all.
Even if the transaction is completed, we may not realize some or all of the anticipated benefits from the spin-off.
We have incurred and will continue to incur significant costs in connection with this transaction, which will affect our profitability and operating results through completion of the transaction.
demand for our brands and products could be reduced and our results of operations could be negatively affected.
While we have experienced positive results from these initiatives, there is no assurance that these benefits will continue.
If we cannot successfully implement these initiatives or respond to these changing market dynamics, our results of operations may continue to be negatively impacted.
Further, if the economy recovers faster than expected, we may not be able to increase our manufacturing and installation capacity to support demand, which could result in lost share and, ultimately, could negatively impact our operating results.
Additionally, home
The distances involved in these arrangements, together with differences in business practices,
particularly costly to defend and resolve, and we have and may continue to incur significant costs as a result of these types of lawsuits.
In recent years, we have recorded significant non-cash impairment charges for financial investments, goodwill and other intangible assets.
While new home construction and home improvement activity are improving, the extent of the recovery remains uncertain.
We have also recorded a valuation allowance related to our deferred tax assets.
A return to sustainable profitability in our U.S. operations is required before we would change our judgment regarding the need for this valuation allowance.
While we believe that we may reverse all or a portion of the valuation allowance as early as the second half of 2014, this is not assured.
Until such time, the profits from our U.S. operations will be offset by the net operating loss carryforward, resulting in a lower U.S. effective tax rate than we would normally incur.
An excerpt. Shown here: all 35 rewritten, 40 of 51 added and all 13 removed. The counts are complete. For every sentence, read Item 1A. Risk Factors. in the FY2014 filing and the FY2013 filing.
Item 7. Management's Discussion and Analysis of Financial Condition and Results of Operations.
206 rewritten, 111 added, 156 removed, 208 unchanged
Read the full itemFY2014 item · filed February 13, 2015FY2013 item · filed February 14, 2014
Forward-looking statements can be identified by words such as [added: "believe,"] "anticipate," [added: "appear," "may," "will," "should,"] "intend," "plan," [removed: "believe,"] "estimate," "expect," "assume," "seek," [removed: "appear," "may," "should," "will,"] "forecast" and similar references to future periods.
In addition to the various factors included in the "Executive Level Overview," "Critical Accounting Policies and Estimates" and "Outlook for the Company" sections, our future performance may be affected by our reliance on new home construction and home improvement, our reliance on key customers, the cost and availability of raw materials, [added: uncertainty in the international economy,] shifts in consumer preferences and purchasing practices, our ability to improve our underperforming [removed: businesses and] [added: businesses,] our ability to maintain our competitive position in our [removed: industries.][added: industries, risks associated with the proposed spin-off of our Installation and Other Services businesses, our ability to realize the expected benefits of the spin-off, the timing and the terms of our share repurchase program, and our ability to reduce corporate expense and simplify our organizational structure.]
[removed: 2013 Results.] Net sales were positively affected by increased new home construction and repair and remodel activity in the U.S. and Europe.
Our results of operations were positively affected by increased sales [removed: volume and the related absorption of fixed costs,] [added: volume,] as well as a more favorable relationship between selling prices and commodity [removed: costs.][added: costs, except in paints and stains.]
Our Cabinets and Related Products segment was [added: negatively] affected by [removed: increased] [added: lower] sales volume [removed: and selling prices, partially] [added: of our North American operations, which completely] offset [removed: by] a [removed: less] [added: more] favorable [removed: product mix.][added: relationship between selling prices and commodity costs and any increased sales volume by our U.K. cabinet business.]
[removed: Our Plumbing Products segment results] [added: Net sales from international operations in 2012] were [removed: favorably] [added: positively] affected by increased [removed: sales volume and increased] selling [removed: prices of our North American and International operations,] [added: prices,] partially offset by [removed: the loss of a portion] [added: lower sales volume] of [removed: our bath products business.][added: international plumbing products, cabinets and windows.]
The Decorative Architectural Products segment [removed: was affected by] [added: benefited from] increased sales [removed: volume, partially] [added: volume of paints and stains and builders' hardware, which was] offset by a less favorable relationship between selling prices and commodity [removed: costs.][added: costs in paints and stains.]
[removed: The] [added: Operating margins in the] Installation and Other Services [removed: and Other Specialty Products segments] [added: segment in 2014] were positively affected by increased sales volume and [removed: increased] [added: a more favorable relationship between] selling [removed: prices.][added: prices and commodity costs.]
[removed: _Revenue] [added: Revenue] Recognition and [removed: Receivables_][added: Receivables]
[removed: _Financial Investments_][added: | Financial investments, net | | | 63 | | | 15 | | | 40 | |]
[removed: _Goodwill] [added: Goodwill] and Other Intangible [removed: Assets_][added: Assets]
Determining market values using a discounted cash flow method requires us to make significant estimates and assumptions, including long-term projections of cash flows, market conditions and [removed: appropriate discount rates.]
In [removed: 2013,] [added: 2014,] we utilized estimated housing starts, from independent industry sources, growing from current levels to [removed: 1.5] [added: 1.45] million units in [removed: 2018] [added: 2019] (terminal growth year) and operating profit margins improving to approximate historical levels for those business units by [removed: 2018] [added: 2019] (terminal growth year).
We utilize our weighted average cost of capital of approximately [removed: 10] [added: 9] percent as the basis to determine the discount rate to apply to the estimated future cash flows.
In [removed: 2013, due to improving market conditions and] [added: 2014,] based upon our assessment of the risks impacting each of our businesses, we applied a risk premium to increase the discount rate to a range of [removed: 11.5] [added: 11.0] percent to [removed: 13.5] [added: 14.0] percent for [removed: most of] our reporting units.
In the fourth quarter of [removed: 2013,] [added: 2014,] we estimated that future discounted cash flows projected for all of our reporting units were greater than the carrying values.
[removed: In 2013,] [added: Accordingly,] we did not recognize any impairment charges for goodwill.
A 10 percent decrease in the estimated fair value of our reporting units at December 31, [removed: 2013] [added: 2014] would not have resulted in any additional analysis of goodwill impairment for any additional [removed: business] [added: reporting] unit.
We review our other indefinite-lived intangible assets for impairment annually, in the fourth quarter, or as events occur or circumstances change that indicate the assets may be impaired without regard to the [removed: reporting] [added: business] unit.
[removed: In 2013, we did not recognize any] [added: Excluding] impairment charges for other [removed: indefinite-lived] intangible assets.
[removed: _Employee] [added: Employee] Retirement [removed: Plans_][added: Plans]
[added: Inherent in] these valuations are key assumptions regarding inflation, expected return on plan assets, mortality rates and discount rates for obligations and expenses.
In December [removed: 2013, we increased] [added: 2014,] our discount rate [added: decreased] for obligations to an average of [removed: 4.40] [added: 3.80] percent from [removed: 3.80] [added: 4.40] percent.
[removed: The discount rate for obligations is based upon the expected duration of each defined-benefit] [added: benefit] pension plan's liabilities matched to the December 31, [removed: 2013] [added: 2014] Towers Watson Rate Link curve.
The discount rates we use for our defined-benefit pension plans ranged from [removed: 1.75] [added: 2.00] percent to [removed: 4.80] [added: 4.00] percent, with the most significant portion of the liabilities having a discount rate for obligations of [removed: 4.20] [added: 3.70] percent or higher.
Our net underfunded amount for our qualified defined-benefit pension plans, which is the difference between the projected benefit obligation and plan assets, [removed: decreased] [added: increased] to [removed: $324] [added: $454] million at December 31, [removed: 2013] [added: 2014] from [removed: $462] [added: $324] million at December 31, [removed: 2012, primarily due to increased asset returns, as well as higher rates of return in the bond market in 2013, which decreased our long-term pension liabilities.][added: 2013.]
[removed: Qualified] [added: Our qualified] domestic pension plan assets in [removed: 2013] [added: 2014] had a net gain of [removed: 13.6] [added: 3.6] percent compared to average gains of [removed: 12] [added: 9.5] percent for the InvestorForce Defined Benefit Plan Universe.
Our projected benefit obligation for our unfunded non-qualified defined-benefit pension plans was [removed: $163] [added: $190] million at December 31, [removed: 2013] [added: 2014] compared with [removed: $181] [added: $163] million at December 31, [removed: 2012.][added: 2013.]
At December 31, [removed: 2013,] [added: 2014,] we reported a net liability of [removed: $487] [added: $644] million, of which [removed: $163] [added: $190] million was related to our non-qualified, supplemental retirement plans, which are not subject to the funding requirements of the Pension Protection Act of 2006.
In accordance with the Pension Protection Act, the Adjusted Funding Target Attainment Percentage [removed: ("AFTAP")] for the various defined-benefit pension plans ranges from [removed: 74] [added: 79] percent to [removed: 82] [added: 90] percent.
We expect pension expense for our qualified defined-benefit pension plans to be [removed: $18] [added: $23] million in [removed: 2014] [added: 2015] compared with [removed: $23] [added: $16] million in [removed: 2013.][added: 2014.]
If we assumed that the future return on plan assets was one-half percent lower than the assumed asset return and the discount rate decreased by 50 basis points, the [removed: 2014] [added: 2015] pension expense would increase by $5 million.
We expect pension expense for our non-qualified defined-benefit pension plans to be [removed: $8] [added: $10] million in [removed: 2014] [added: 2015] compared with [removed: $8] [added: $9] million in [removed: 2013.][added: 2014.]
We anticipate that we will be required to contribute approximately [removed: $60] [added: $55] million to [removed: $70] [added: $65] million in [removed: 2014] [added: 2015] to our qualified and non-qualified defined-benefit plans.
[removed: _Income Taxes_][added: Income Taxes]
In [removed: the fourth quarter of] 2010, we recorded a $372 million valuation allowance against our U.S. Federal deferred tax assets as a non-cash charge to income tax expense.
During 2012 and 2011, objective and verifiable negative evidence, such as U.S. operating losses and significant impairment charges for U.S. goodwill in 2011 and other intangible assets, continued to [removed: outweigh positive evidence necessary to reduce the valuation allowance.]
As a result, we recorded increases of $65 million and [removed: $89] [added: $87] million in the valuation allowance related to our U.S. Federal deferred tax assets as a non-cash charge to income tax expense in 2012 and 2011, respectively.
It is reasonably possible that the continued improvements in [added: certain of] our [added: businesses located in the] U.S. [removed: operations] could result in the objective positive evidence necessary to warrant the [added: additional] reversal of all or a portion of the valuation allowance, up to approximately [removed: $550] [added: $27] million, [removed: as early as] [added: by] the [removed: second half] [added: end] of [removed: 2014.][added: 2015.]
Should we determine that we would not be able to realize our remaining deferred tax assets in [added: these jurisdictions in] the future, an adjustment to the valuation allowance would be recorded in the period such determination is made.
2014 Results
Such increases were partially offset by decreased sales volume in our North American cabinetry business.
Our results of operations were negatively affected by increased business rationalization costs and costs associated with our proposed spin-off transaction.
Most of our business segments also benefited from the business rationalizations and cost savings initiatives we have undertaken over the last several years.
Our Plumbing Products segment benefited from increased sales volume of North American and International operations, as well as a more favorable relationship between selling prices and commodity costs.
The Installation and Other Services segment benefited from increased new home construction and
commercial activity and a more favorable relationship between selling prices and commodity costs.
Note A to our consolidated financial statements includes our accounting policies, estimates and methods used in the preparation of our consolidated financial statements.
Receivables include unbilled revenue related to the Installation and Other Services segment of $24 million at both December 31, 2014 and 2013.
appropriate discount rates.
Our weighted average cost of capital decreased in 2014 primarily due to lower bond rates.
In 2014, we recognized an insignificant impairment charge for other indefinite-lived intangible assets.
The discount rate for obligations is based upon the expected duration of each defined-
The increase in the projected benefit obligations was primarily due to lower bond rates and a change to the RP 2014 Mortality tables issued by the U.S. Society of Actuaries, which increased our long-term pension liabilities.
outweigh positive evidence necessary to reduce the valuation allowance.
In the third quarter of 2014, we recorded a $517 million tax benefit from the release of the valuation allowance against our U.S. Federal and certain state deferred tax assets due primarily to a return to sustainable profitability in our U.S. operations.
In reaching this conclusion, we considered the continued improvement in both the new home construction market and repair and remodel activity in the U.S. and our progress on strategic initiatives to reduce costs and expand our product leadership positions which contributed to the continued improvement in our U.S. operations over the past few years.
In the fourth quarter of 2014, we recorded an additional $12 million tax benefit from the release of the valuation allowances against certain U.K. and Mexican deferred tax assets primarily resulting from a return to sustainable profitability in these jurisdictions.
We continue to maintain a valuation allowance on certain state and foreign deferred tax assets as of December 31, 2014.
Warranty
On September 30, 2014, we announced a plan to spin off 100 percent of our Installation and Other Services businesses into an independent, publicly-traded company through a tax-free stock distribution to our shareholders.
The transaction is expected to be completed in mid-2015.
In the second quarter of 2014, we increased our quarterly dividend to $.09 per common share from $.075 per common share.
The decrease in the current ratio was due to the short-term classification of $500 million of 4.8% Notes due June 2015 at December 31, 2014.
| | | | | | | | | | | |
Our working capital days were as follows:
| | | At December 31, | | | | | |
| | | 2014 | | | 2013 | | |
| Receivable days | | | 47 | | | 46 | |
| Inventory days | | | 49 | | | 49 | |
| Accounts Payable days | | | 71 | | | 67 | |
| Working capital (receivables plus inventories, less accounts payable) as a % of net sales | | | 10.7 | % | | 10.6 | % |
Our cash provided by operations was positively affected by increased sales and more effective accounts payable management.
In September 2014, our Board of Directors authorized the repurchase of up to 50 million shares for retirement of our common stock in open-market transactions or otherwise, replacing the previous Board of Directors authorization established in 2007.
During the fourth quarter of 2014, we repurchased and retired 5 million common shares for cash of $119 million.
We expect to repurchase between $400 million and $500 million of our common stock in 2015.
The effect of currency translation and acquisitions was insignificant compared with 2013.
| --- | --- | --- | --- | --- | --- | --- | --- |
| | | 2014 | | | 2013 | | |
| | | | | | | | |
Also, all of our businesses were positively affected by the benefits associated with the business rationalizations and process improvement initiatives that we have implemented over the last several years.
During downturns in our markets, declines in the financial condition and creditworthiness of customers impact the credit risk of the receivables involved and we have incurred bad debt expense related to customer defaults.
Our bad debt expense was $8 million, $14 million and $12 million for the years ended December 31, 2013, 2012 and 2011, respectively.
_Inventories_
We record inventories at the lower of cost or net realizable value, with expense estimates made for obsolescence or unsaleable inventory equal to the difference between the recorded cost of inventories and their estimated market value based upon assumptions about future demand and market conditions.
On an on-going basis, we monitor these estimates and record adjustments for differences between estimates and actual experience.
Historically, actual results have not significantly deviated from those determined using these estimates.
We follow accounting guidance that defines fair value, establishes a framework for measuring fair value and expands disclosures about fair value measurements for our financial investments and liabilities.
This guidance defines fair value as "the price that would be received to sell an asset or paid to transfer a liability in an orderly transaction between market participants at the measurement date." Further, it defines a fair value hierarchy, as follows: Level 1 inputs as quoted prices in active markets for identical assets or liabilities; Level 2 inputs as observable inputs other than Level 1 prices, such as quoted market prices for similar assets or liabilities or other inputs that are observable or can be corroborated by market data; and Level 3 inputs as unobservable inputs that are supported by little or no market activity and that are financial instruments whose value is determined using pricing models or instruments for which the determination of fair value requires significant management judgment or estimation.
If applicable, we record investments in available-for-sale securities at fair value, and unrealized gains or losses (that are deemed to be temporary) are recognized, net of tax effect, through shareholders' equity, as a component of other comprehensive income in our consolidated balance sheet.
In the past, we have invested excess cash in auction rate securities.
Auction rate securities are investment securities that have interest rates which are reset every 7, 28 or 35 days.
At December 31, 2013, our investment in auction rate securities was $22 million; we have not increased our investment in auction rate securities since 2007.
The fair value of auction rate securities is estimated, on a recurring basis, using a discounted cash flow model (Level 3 input).
If we changed the discount rate used in the fair value estimate by 75 basis points, the value of the auction rate securities would change by approximately $1 million.
We have maintained investments in a number of private equity funds, which aggregated $63 million at December 31, 2013.
We carry our investments in private equity funds and other private investments at cost.
It is not practicable for us to estimate a fair value for private equity funds and other private investments because there are no quoted market prices, and sufficient information is not readily available for us to utilize a valuation model to determine the fair value for each fund.
These investments are evaluated, on a non-recurring basis, for potential other-than-temporary impairment when impairment indicators are present, or when an event or change in circumstances has occurred that may have a significant adverse effect on the fair value of the investment.
Due to the significant unobservable inputs, the fair value measurements used to evaluate impairment are a Level 3 input.
Impairment indicators we consider include the following: whether there has been a significant deterioration in earnings performance, asset quality or business prospects; a significant adverse change in the regulatory, economic or technological environment; a significant adverse change in the general market condition or geographic area in which the investment operates; industry and sector performance; current equity and credit market conditions; and any bona fide offers to purchase the investment for less than the carrying value.
We also consider specific adverse conditions related to the financial health of and business outlook for the fund, including industry and sector performance.
The significant assumptions utilized in analyzing a fund for potential other-than-temporary impairment include current economic conditions, market analysis for specific funds and performance indicators in the applicable sectors.
We have and will continue to reduce our investments in long-term financial assets.
At December 31, 2013, we have investments in 14 venture capital funds, with an aggregate carrying value of $15 million.
The venture capital funds have invested in start-up or smaller, early-stage established businesses, principally in the information technology, bio-technology and health care sectors.
At December 31, 2013, we also have investments in 15 buyout funds, with an aggregate carrying value of $48 million.
The buyout funds have invested in later-stage, established businesses and no buyout fund has a concentration in a particular sector.
Since there is no active trading market for these investments, they are for the most part illiquid.
These investments, by their nature, can also have a relatively higher degree of business risk, including financial leverage, than other financial investments.
The timing of distributions from the funds, which depends on particular events related to the underlying investments, as well as the funds' schedules for making distributions and their needs for cash, can be difficult to predict.
As a result, the amount of income we record from these investments can vary substantially from quarter to quarter.
Future changes in market conditions, the future performance of the underlying investments or new information provided by private equity fund managers could affect the recorded values of these investments and the amounts realized upon liquidation.
We record an impairment charge to earnings when an investment has experienced a decline in fair value that is deemed to be other-than-temporary.
Our operating segments are reporting units that engage in business activities for which discrete financial information, including five-year forecasts, is available.
Our weighted average cost of capital increased in 2013 due to improving market conditions and an increased stock price.
Any increases in estimated discounted cash flows would have no effect on the reported value of goodwill.
Intangible assets with finite useful lives are amortized using the straight-line method over their estimated useful lives.
We evaluate the remaining useful lives of amortizable identifiable intangible assets at each reporting period to determine whether events and circumstances warrant a revision to the remaining periods of amortization.
_Stock-Based Compensation_
An excerpt. Shown here: 40 of 206 rewritten, 40 of 111 added and 40 of 156 removed. The counts are complete. For every sentence, read Item 7. Management's Discussion and Analysis of Financial Condition and Results of Operations. in the FY2014 filing and the FY2013 filing.
Item 7A. Quantitative and Qualitative Disclosures about Market Risk.
1 rewritten, 0 added, 0 removed, 6 unchanged
Read the full itemFY2014 item · filed February 13, 2015FY2013 item · filed February 14, 2014
At December 31, [removed: 2013,] [added: 2014,] we performed sensitivity analyses to assess the potential loss in the fair values of market risk sensitive instruments resulting from a hypothetical change of 10 percent in foreign currency exchange rates, a 10 percent decline in the market value of our long-term investments, a 10 percent change in commodity costs, or a 10 percent change in interest rates.
Item 1. Business.
55 rewritten, 28 added, 35 removed, 99 unchanged
Read the full itemFY2014 item · filed February 13, 2015FY2013 item · filed February 14, 2014
We are among the largest manufacturers in North America of a number of home improvement and building products, including faucets, cabinets, architectural coatings and windows, and we are [removed: one] [added: a leading provider] of [added: services that include] the [removed: largest installers] [added: installation] of insulation [removed: for new home construction.][added: and other building products.]
Approximately 81 percent of our [removed: 2013] [added: 2014] sales were generated by our North American operations.
[removed: Sales of] [added: The market for] home improvement and building products at retailers increased by [removed: almost 6] [added: approximately four] percent during [removed: 2013,] [added: 2014,] despite continued economic [removed: uncertainties, weak consumer confidence] [added: uncertainties] and modest consumer spending.
First, we [removed: are extending and expanding] [added: leveraged] our product leadership positions by [removed: leveraging] [added: expanding] our brands and introducing innovative new and improved products.
We believe that we gained [removed: market] share in our North American plumbing business with our DELTA®, PEERLESS®, and BRIZO® brands, and internationally with our HANSGROHE® products.
[removed: Our] [added: In addition to its strong position with the "do-it-yourself" consumer, our] decorative architectural products businesses [removed: focused] [added: continued to focus] on the professional segment with BEHRPRO® paint and KILZ® PRO-X product lines.
Milgard Manufacturing, our manufacturer of windows in the western U.S., and our U.K. Window Group continued to gain [removed: share in their markets.][added: share.]
[removed: Another strategic initiative is to improve our performance by] [added: In addition, we continued] reducing [removed: costs, primarily through supply chain savings,] [added: costs] and implementing lean principles and production process improvements.
Our Installation [removed: segment continued] [added: and Other Services segments saw progress toward] its [removed: improvement] [added: goals] during [removed: 2013] [added: 2014] through incremental new home construction activity, cost reductions from lean [removed: processes,] [added: processes and] leveraging our ERP system and supply chain savings.
At December 31, [removed: 2013,] [added: 2014,] we had approximately [removed: $1.5] [added: $1.7] billion of cash, cash investments and short-term bank deposits.
The following table sets forth the contribution of our segments to net sales and operating profit (loss) for the three years ended December 31, [removed: 2013.][added: 2014.]
Additional financial information concerning our operations by segment and by geographic regions, as well as general corporate expense, net, as of and for the three years ended December 31, [removed: 2013,] [added: 2014,] is set forth in Note P to our consolidated financial statements included in Item 8 of this Report.
| | | [removed: 2013] [added: 2014] | | | [removed: 2012] [added: 2013] | | | [removed: 2011] [added: 2012] | | |
| Cabinets and Related Products | | $ | [removed: 1,014] [added: 999] | | $ | [removed: 939] [added: 1,014] | | $ | [removed: 934] [added: 939] | |
| Plumbing Products | | | [removed: 3,183] [added: 3,308] | | | [removed: 2,955] [added: 3,183] | | | [removed: 2,913] [added: 2,955] | |
| Installation and Other Services | | | [removed: 1,412] [added: 1,515] | | | [removed: 1,209] [added: 1,412] | | | [removed: 1,077] [added: 1,209] | |
| Decorative Architectural Products | | | [removed: 1,927] [added: 1,998] | | | [removed: 1,818] [added: 1,927] | | | [removed: 1,670] [added: 1,818] | |
| Other Specialty Products | | | [removed: 637] [added: 701] | | | [removed: 574] [added: 637] | | | [removed: 576] [added: 574] | |
| Total | | $ | [removed: 8,173] [added: 8,521] | | $ | [removed: 7,495] [added: 8,173] | | $ | [removed: 7,170] [added: 7,495] | |
| | | [removed: 2013] [added: 2014] | | | [removed: 2012] [added: 2013] | | | [removed: 2011] [added: 2012] | | |
| Cabinets and Related Products | | $ | [removed: (10] [added: (62] | ) | $ | [removed: (89] [added: (10] | ) | $ | [removed: (126] [added: (89] | ) |
| Plumbing Products | | | [removed: 394] [added: 512] | | | [removed: 307] [added: 394] | | | [removed: 322] [added: 307] | |
| Installation and Other Services | | | [removed: 37] [added: 58] | | | [removed: (19] [added: 37] | [removed: )] | | [removed: (79] [added: (19] | ) |
| Decorative Architectural Products | | | [removed: 351] [added: 360] | | | [removed: 329] [added: 351] | | | [removed: 196] [added: 329] | |
| Other Specialty Products | | | [removed: 35] [added: 47] | | | [removed: (31] [added: 35] | [removed: )] | | [removed: (401] [added: (31] | ) |
| Total | | $ | [removed: 807] [added: 915] | | $ | [removed: 497] [added: 807] | | $ | [removed: (88] [added: 497] | [removed: )] |
Operating profit (loss) is before [removed: net charges] [added: income] of [removed: $77] [added: $9] million regarding the [removed: 2012] [added: 2014] litigation [removed: settlement, primarily] [added: settlement] in the [removed: Installation and Other Services] [added: Decorative Architectural Products] segment and [removed: $9] [added: before net charges of $77] million regarding the [removed: 2011] [added: 2012] litigation [removed: settlements] [added: settlement, primarily] in the [removed: Cabinets and Related Products] [added: Installation] and [removed: the] Other [removed: Specialty Products segments.][added: Services segment.]
Operating profit (loss) includes impairment charges for [removed: goodwill and] other intangible assets as follows: For 2012 – Other Specialty Products – $42 million.
Our [removed: Cabinet] [added: Cabinets and Related Products] segment was particularly affected by the economic downturn and decline in new home construction and repair and remodel activity.
[removed: We continue] [added: Although faced with challenges, we are continuing to pursue] our strategy to increase sales in this segment through brand building, new product introductions aimed to provide differentiated products to our multiple sales channels, and product innovation.
We [removed: also] continue to focus on our cost structure in this segment and improving cabinet production efficiencies.
Our North American competitors include American Woodmark [removed: Corporation and] [added: Corporation,] Fortune Brands Home & Security, Inc. [added: and Norcraft Companies, Inc.]
The majority of our plumbing products are sold in North America and Europe under the brand names DELTA®, PEERLESS®, HANSGROHE®, AXOR®, BRIZO®, BRASSTECH®, BRISTAN™, GINGER®, [added: HERITAGE™,] NEWPORT [removed: BRASS] [added: BRASS®] and PLUMB SHOP®.
In [removed: 2013,] [added: 2014,] we [removed: began] [added: completed] the process of integrating our plumbing products sold under our AQUA GLASS® and AMERICAN SHOWER & BATH™ brands into the DELTA and PEERLESS brands.
[removed: INNOVEX® and] [added: Our] acrylic tub and shower systems, bath and shower enclosure units, shower trays and laundry tubs are now manufactured and sold under the [removed: Delta and Peerless, Aqua Glass, American Shower & Bath] [added: DELTA, PEERLESS,] and MIROLIN® brand names.
These products are sold primarily to home center retailers for home improvement and new home construction in North America, although [removed: the Mirolin] [added: our MIROLIN] products are also sold to wholesalers and distributors in Canada.
Our spas are manufactured and sold under HOT SPRING®, [removed: CALDERA®] [added: CALDERA®, FREEFLOW®] and other trademarks directly to independent [removed: dealers.][added: specialty retailers as well as through online mass merchant retailers.]
These products are marketed in North America for the wholesale trade under our [removed: BRASSCRAFT®] [added: BRASSCRAFT®, COBRA®, PLUMB SHOP®,] and [removed: BRASSTECH® trademarks] [added: BRASSTECH®,] and [removed: for "do-it-yourself" consumers under our] MASTER PLUMBER® [removed: and PLUMB SHOP®] trademarks, and are also sold under private label.
We believe that our plumbing products are among the leaders in sales in North America and Europe, with American [removed: Standard, Kohler, Moen] [added: Standard Brands, Kohler Co., Fortune Brands Home & Security Inc.] and Pfister [added: Faucets] as major competitors.
Many of the faucet and showering products with which our products compete are manufactured by foreign manufacturers that are putting downward [removed: pressures] [added: pressure] on [removed: price, particularly in the emerging markets we are entering.][added: price.]
Housing starts increased approximately ten percent during 2014.
Throughout 2014, we continued the execution of our strategy to position the Company for future growth, focusing on three strategic pillars: leveraging opportunities across our businesses, driving the full potential of our core businesses and actively managing our portfolio.
We achieved gains in each of these areas.
BEHR® paint expanded its MARQUEE® product line from exterior paint to interior paint and continued to pursue international opportunities.
To help drive the full potential of our core businesses, the second pillar of our strategy, we adopted a leaner operating model.
We are transforming our corporate structure to a center-led model.
We believe this model will increase our business units' efficiencies and our overall effectiveness as an organization.
This change will align our corporate structure to support our strategy to drive the full potential of our businesses.
During 2014, we remained focused on improvements at our Cabinets and Related Products businesses, which continued to face challenges.
The third pillar of our strategy is to actively manage our portfolio.
In September 2014, we announced a plan to spin off 100 percent of our Installation and Other Services businesses into an independent, publicly-traded company through a tax-free stock distribution to our shareholders.
We believe that these businesses will be better positioned to operate as a separate company that will focus on growth by capitalizing on new home construction in the United States as well as further expanding into commercial and retrofit categories.
The transaction is expected to be completed in mid-2015.
To further drive value creation for our shareholders, our Board of Directors approved the repurchase of an aggregate 50 million shares of our common stock and increased our dividend by 20 percent.
During 2014, we repurchased 7 million shares (including 1.7 million shares repurchased in the first quarter of 2014 to offset the dilutive impact of long-term stock awards) of our common stock.
We believe that the actions we took during 2014 help provide the foundation for us to enhance future shareholder value.
We also believe that the spin-off of our Installation and Other Services businesses will allow us to pursue a more focused strategy of growth through the innovation and manufacturing of
branded building products.
We plan to continue to actively manage our portfolio, identify growth opportunities in key industries and produce new products that differentiate us in the marketplace.
By continuing our disciplined execution of our strategy, we believe that we will increase shareholder value by enhancing our customer experience and improving our efficiencies.
| | | | | | | | | | | |
| | | | | | | | | | | |
In addition, our initiatives to improve this segment, including rationalizing our businesses, closing plants and reducing headcount, have been complex, time-consuming and expensive.
The consolidation of our North American cabinet businesses has involved the integration of multiple manufacturing processes and information technology platforms and continues to affect our operations.
Competitors include Jacuzzi, Sundance Spas, Master Spas and Dynasty Spas.
Our distributed products include insulation, insulation
In 2014, Behr introduced MARQUEE® Interior Paint that delivers high-performance, one-coat coverage with every color in the exclusive MARQUEE Interior One-Coat Color Collection.
under the MILGARD® brand name for home improvement and new home construction, principally in the western United States.
Housing starts increased approximately 18 percent during 2013, with the pace slowing in the second half of the year.
Throughout 2013, we continued to focus on our four strategic initiatives to improve our performance, and we achieved gains in each of those areas.
BEHR® paint also expanded its product offering by introducing its MARQUEE™ exterior paint and PREMIUM DECKOVER® solid color coating for wood and concrete surfaces and by pursuing international opportunities.
Our Masco Contractor Services business continued to achieve share gains in the installation of insulation for the new home construction, retrofit and commercial channels.
Over the last several years, we have taken out over $600 million of fixed costs, on a gross basis.
We continue to seek improvements in our global supply chain to realize cost savings by or through simplifying the purchasing process and coordinating logistical operations.
Another strategic initiative is to improve our underperforming businesses, and during 2013, we saw our Cabinets and Related Products and our Installation and Other Services segments return to profitability.
Approximately one third ($200 million) of our fixed cost reduction was attributable to our cabinetry businesses and one third came from our insulation businesses.
By lowering our breakeven point, each of these segments saw a return to profitability during 2013 at much lower levels of revenue than historically.
By reducing our fixed costs, we believe that we are strengthening the foundation for continued growth.
Our final strategic initiative is strengthening our balance sheet through net debt reduction and maintaining strong liquidity through continued working capital improvements.
We continued to reduce our debt by approximately $200 million through the retirement of notes due in August.
We believe that we have managed our businesses successfully through the economic crisis and subsequent recession of recent years.
We believe that our focus on our strategic initiatives of expanding our product leadership positions, reducing costs, improving our underperforming businesses and
strengthening our balance sheet have improved our performance and, as we continue to focus on these initiatives, will position us well as our markets continue to recover.
Recent Developments
On January 8, 2014, we announced that Timothy Wadhams is retiring from his position as the Company's President and Chief Executive Officer, effective February 14, 2014.
Our Board of Directors has elected Keith J.
Allman, age 51, to succeed Mr. Wadhams as President and Chief Executive Officer and to join the Company's Board of Directors, effective as of February 14, 2014.
Mr. Allman joined the Company in 1998 and has served most recently as a Group President, with responsibilities for our Plumbing and North American Cabinet businesses.
We thank Mr. Wadhams for his 37 years of service.
| | | | | | | | | | | |
| | | | | | | | | | | |
| | | | | | | | | | | |
| | | | | | | | | | | |
| | | | | | | | | | | |
| | | | | | | | | | | |
For 2011 – Plumbing Products – $1 million; Decorative Architectural Products – $75 million; and Other Specialty Products – $374 million.
As a result of the integration, we exited the wholesale plumbing distribution channel for these bath products.
Our
Major competitors include Kohler, Aquatic, Maax and Jacuzzi.
Our plumbing products that are affected by this legislation meet the federal standards.
In response to the economic downturn and resulting decline in new home construction, we expanded our ability to serve the residential retrofit and light commercial channels.
In 2013, Behr introduced MARQUEE™ exterior paint with enhanced stain-blocking and fade-resistant properties, and PREMIUM DECKOVER™, a deck resurfacing product which conceals cracks and splinters in wood surfaces and helps to create a slip-resistant finish for decks.
directly to production and custom homebuilders and through lumber yards and home centers.
An excerpt. Shown here: 40 of 55 rewritten, all 28 added and all 35 removed. The counts are complete. For every sentence, read Item 1. Business. in the FY2014 filing and the FY2013 filing.
Cover and table of contents
28 rewritten, 6 added, 6 removed, 48 unchanged
Read the full itemFY2014 item · filed February 13, 2015FY2013 item · filed February 14, 2014
For the Fiscal Year Ended December 31, [removed: 2013] [added: 2014] Commission File Number 1-5794
| [added: | | | |] (Do not check if a smaller reporting company) | | | [removed: | | | |]
The aggregate market value of the Registrant's Common Stock held by non-affiliates of the Registrant on June [removed: 28, 2013] [added: 30, 2014] (based on the closing sale price of [removed: $19.49] [added: $22.20] of the Registrant's Common Stock, as reported by the New York Stock Exchange on such date) was approximately [removed: $6,794,823,000.][added: $7,790,502,000.]
Number of shares outstanding of the Registrant's Common Stock at January 31, [removed: 2014:][added: 2015:]
[removed: 356,404,200] [added: 349,544,600] shares of Common Stock, par value $1.00 per share
Portions of the Registrant's definitive Proxy Statement to be filed for its [removed: 2014] [added: 2015] Annual Meeting of Stockholders are incorporated by reference into Part III of this Form 10-K.
[removed: 2013] [added: 2014] Annual Report on Form 10-K
| [removed: [1.](#da78301_item_1._business.)] [added: [1.](#da77001_item_1._business.)] | | [removed: [Business](#da78301_item_1._business.)] [added: [Business](#da77001_item_1._business.)] | | [removed: [2](#da78301_item_1._business.)] [added: [2](#da77001_item_1._business.)] |
| [removed: [1A.](#dc78301_item_1a._risk_factors.)] [added: [1A.](#dc77001_item_1a._risk_factors.)] | | [Risk [removed: Factors](#dc78301_item_1a._risk_factors.)] [added: Factors](#dc77001_item_1a._risk_factors.)] | | [removed: [8](#dc78301_item_1a._risk_factors.)] [added: [8](#dc77001_item_1a._risk_factors.)] |
| [removed: [1B.](#de78301_item_1b._unresolved_staff_comments.)] [added: [1B.](#dc77001_item_1b._unresolved_staff_comments.)] | | [Unresolved Staff [removed: Comments](#de78301_item_1b._unresolved_staff_comments.)] [added: Comments](#dc77001_item_1b._unresolved_staff_comments.)] | | [removed: [13](#de78301_item_1b._unresolved_staff_comments.)] [added: [14](#dc77001_item_1b._unresolved_staff_comments.)] |
| [removed: [2.](#de78301_item_2._properties.)] [added: [2.](#de77001_item_2._properties.)] | | [removed: [Properties](#de78301_item_2._properties.)] [added: [Properties](#de77001_item_2._properties.)] | | [removed: [14](#de78301_item_2._properties.)] [added: [15](#de77001_item_2._properties.)] |
| [removed: [3.](#de78301_item_3._legal_proceedings.)] [added: [3.](#de77001_item_3._legal_proceedings.)] | | [Legal [removed: Proceedings](#de78301_item_3._legal_proceedings.)] [added: Proceedings](#de77001_item_3._legal_proceedings.)] | | [removed: [14](#de78301_item_3._legal_proceedings.)] [added: [15](#de77001_item_3._legal_proceedings.)] |
| [removed: [4.](#de78301_item_4._mine_safety_disclosures.)] [added: [4.](#de77001_item_4._mine_safety_disclosures.)] | | [Mine Safety [removed: Disclosures](#de78301_item_4._mine_safety_disclosures.)] [added: Disclosures](#de77001_item_4._mine_safety_disclosures.)] | | [removed: [14](#de78301_item_4._mine_safety_disclosures.)] [added: [15](#de77001_item_4._mine_safety_disclosures.)] |
| [removed: [5.](#de78301_item_5._market_for_registrant___ite04647)] [added: [5.](#de77001_item_5._market_for_registrant___ite04647)] | | [Market for Registrant's Common Equity, Related Stockholder Matters and Issuer Purchases of Equity [removed: Securities](#de78301_item_5._market_for_registrant___ite04647)] [added: Securities](#de77001_item_5._market_for_registrant___ite04647)] | | [removed: [15](#de78301_item_5._market_for_registrant___ite04647)] [added: [16](#de77001_item_5._market_for_registrant___ite04647)] |
| [removed: [6.](#de78301_item_6._selected_financial_data.)] [added: [6.](#de77001_item_6._selected_financial_data.)] | | [Selected Financial [removed: Data](#de78301_item_6._selected_financial_data.)] [added: Data](#de77001_item_6._selected_financial_data.)] | | [removed: [17](#de78301_item_6._selected_financial_data.)] [added: [18](#de77001_item_6._selected_financial_data.)] |
| [removed: [7.](#dg78301_item_7._management_s_discussio__ite03649)] [added: [7.](#dg77001_item_7._management_s_discussio__ite03649)] | | [Management's Discussion and Analysis of Financial Condition and Results of [removed: Operations](#dg78301_item_7._management_s_discussio__ite03649)] [added: Operations](#dg77001_item_7._management_s_discussio__ite03649)] | | [removed: [18](#dg78301_item_7._management_s_discussio__ite03649)] [added: [19](#dg77001_item_7._management_s_discussio__ite03649)] |
| [removed: [7A.](#dm78301_item_7a._quantitative_and_qual__ite02650)] [added: [7A.](#dm77001_item_7a._quantitative_and_qual__ite02650)] | | [Quantitative and Qualitative Disclosures About Market [removed: Risk](#dm78301_item_7a._quantitative_and_qual__ite02650)] [added: Risk](#dm77001_item_7a._quantitative_and_qual__ite02650)] | | [removed: [38](#dm78301_item_7a._quantitative_and_qual__ite02650)] [added: [38](#dm77001_item_7a._quantitative_and_qual__ite02650)] |
| [removed: [8.](#I8)] [added: [8.](#AFA)] | | [Financial Statements and Supplementary [removed: Data](#I8)] [added: Data](#AFA)] | | [removed: [39](#I8)] [added: [39](#AFA)] |
| [removed: [9.](#I9)] [added: [9.](#gi77001_item_9._changes_in_and_disagre__ite03557)] | | [Changes in and Disagreements with Accountants on Accounting and Financial [removed: Disclosure](#I9)] [added: Disclosure](#gi77001_item_9._changes_in_and_disagre__ite03557)] | | [removed: [89](#I9)] [added: [85](#gi77001_item_9._changes_in_and_disagre__ite03557)] |
| [removed: [9A.](#9A)] [added: [9A.](#gi77001_item_9a._controls_and_procedures.)] | | [Controls and [removed: Procedures](#9A)] [added: Procedures](#gi77001_item_9a._controls_and_procedures.)] | | [removed: [89](#9A)] [added: [85](#gi77001_item_9a._controls_and_procedures.)] |
| [removed: [9B.](#I9B)] [added: [9B.](#gi77001_item_9b._other_information.)] | | [Other [removed: Information](#I9B)] [added: Information](#gi77001_item_9b._other_information.)] | | [removed: [89](#I9B)] [added: [85](#gi77001_item_9b._other_information.)] |
| | | [PART [removed: III](#ja78301_part_iii)] [added: III](#ja77001_part_iii)] | | |
| [removed: [10.](#ja78301_item_10._directors,_executive___ite02317)] [added: [10.](#ja77001_item_10._directors,_executive___ite02317)] | | [Directors, Executive Officers and Corporate [removed: Governance](#ja78301_item_10._directors,_executive___ite02317)] [added: Governance](#ja77001_item_10._directors,_executive___ite02317)] | | [removed: [90](#ja78301_item_10._directors,_executive___ite02317)] [added: [86](#ja77001_item_10._directors,_executive___ite02317)] |
| [removed: [11.](#ja78301_item_11._executive_compensation.)] [added: [11.](#ja77001_item_11._executive_compensation.)] | | [Executive [removed: Compensation](#ja78301_item_11._executive_compensation.)] [added: Compensation](#ja77001_item_11._executive_compensation.)] | | [removed: [90](#ja78301_item_11._executive_compensation.)] [added: [86](#ja77001_item_11._executive_compensation.)] |
| [removed: [12.](#ja78301_item_12._security_ownership_of__ite03985)] [added: [12.](#ja77001_item_12._security_ownership_of__ite03985)] | | [Security Ownership of Certain Beneficial Owners and Management and Related Stockholder [removed: Matters](#ja78301_item_12._security_ownership_of__ite03985)] [added: Matters](#ja77001_item_12._security_ownership_of__ite03985)] | | [removed: [90](#ja78301_item_12._security_ownership_of__ite03985)] [added: [86](#ja77001_item_12._security_ownership_of__ite03985)] |
| [removed: [13.](#ja78301_item_13._certain_relationships__ite03048)] [added: [13.](#ja77001_item_13._certain_relationships__ite03048)] | | [Certain Relationships and Related Transactions, and Director [removed: Independence](#ja78301_item_13._certain_relationships__ite03048)] [added: Independence](#ja77001_item_13._certain_relationships__ite03048)] | | [removed: [90](#ja78301_item_13._certain_relationships__ite03048)] [added: [86](#ja77001_item_13._certain_relationships__ite03048)] |
| [removed: [14.](#ja78301_item_14._principal_accountant_fees_and_services.)] [added: [14.](#ja77001_item_14._principal_accountant_fees_and_services.)] | | [Principal Accounting Fees and [removed: Services](#ja78301_item_14._principal_accountant_fees_and_services.)] [added: Services](#ja77001_item_14._principal_accountant_fees_and_services.)] | | [removed: [90](#ja78301_item_14._principal_accountant_fees_and_services.)] [added: [86](#ja77001_item_14._principal_accountant_fees_and_services.)] |
| [removed: [15.](#jb78301_item_15._exhibits_and_financial_statement_schedules.)] [added: [15.](#jb77001_item_15._exhibits_and_financial_statement_schedules.)] | | [Exhibits and Financial Statement [removed: Schedule](#jb78301_item_15._exhibits_and_financial_statement_schedules.)] [added: Schedule](#jb77001_item_15._exhibits_and_financial_statement_schedules.)] | | [removed: [91](#jb78301_item_15._exhibits_and_financial_statement_schedules.)] [added: [87](#jb77001_item_15._exhibits_and_financial_statement_schedules.)] |
10-K 1 a2222936z10-k.htm 10-K
[PART IV](#jb77001_part_iv)
| | | [PART I](#da77001_part_i) | | |
| | | [PART II](#de77001_part_ii) | | |
| | | [PART IV](#jb77001_part_iv) | | |
| | | [Signatures](#jc77001_signatures) | | [88](#jc77001_signatures) |
10-K 1 a2218121z10-k.htm 10-K
[PART IV](#jb78301_part_iv)
| | | [PART I](#da78301_part_i) | | |
| | | [PART II](#de78301_part_ii) | | |
| | | [PART IV](#jb78301_part_iv) | | |
| | | [Signatures](#jc78301_signatures) | | [92](#jc78301_signatures) |
Item 2. Properties.
5 rewritten, 2 added, 6 removed, 33 unchanged
Read the full itemFY2014 item · filed February 13, 2015FY2013 item · filed February 14, 2014
| Cabinets and Related Products | | | 8 | | | [removed: 8] [added: 7] | |
| Plumbing Products | | | 18 | | | [removed: 4] [added: 5] | |
Our Installation and Other Services segment operates approximately 190 installation branch locations and approximately [removed: 70] [added: 75] distribution centers in the United States, most of which are leased.
| Plumbing Products | | | 11 | | | [removed: 26] [added: 22] | |
| Totals | | | 19 | | | [removed: 27] [added: 23] | |
| | | | | | | | |
| | | | | | | | |
| | | | | | | | |
| | | | | | | | |
| | | | | | | | |
| | | | | | | | |
| | | | | | | | |
| | | | | | | | |
Item 5. Market for Registrant's Common Equity, Related Stockholder Matters and Issuer Purchases of Equity Securities.
8 rewritten, 21 added, 18 removed, 24 unchanged
Read the full itemFY2014 item · filed February 13, 2015FY2013 item · filed February 14, 2014
On January 31, [removed: 2014,] [added: 2015,] there were approximately [removed: 4,779] [added: 4,500] holders of record of our common stock.
The table below compares the cumulative total shareholder return on our common stock with the cumulative total return of (i) the Standard & Poor's 500 Composite Stock Index ("S&P 500 Index"), (ii) The Standard & Poor's Industrials Index ("S&P Industrials Index") and (iii) the Standard & Poor's Consumer Durables & Apparel Index ("S&P Consumer Durables & Apparel Index"), from December 31, [removed: 2008] [added: 2009] through December 31, [removed: 2013,] [added: 2014,] when the closing price of our common stock was [removed: $22.77.][added: $25.20.]
The graph assumes investments of $100 on December 31, [removed: 2008] [added: 2009] in our common stock and in each of the three indices and the reinvestment of dividends.
[removed: 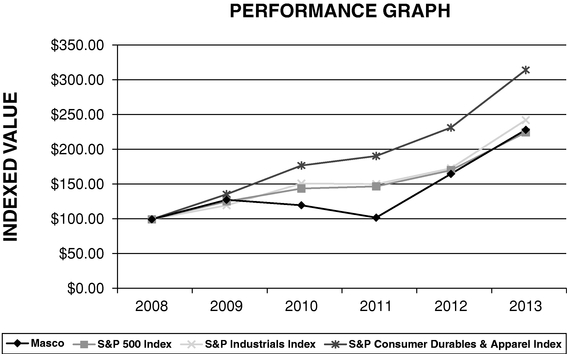][added: 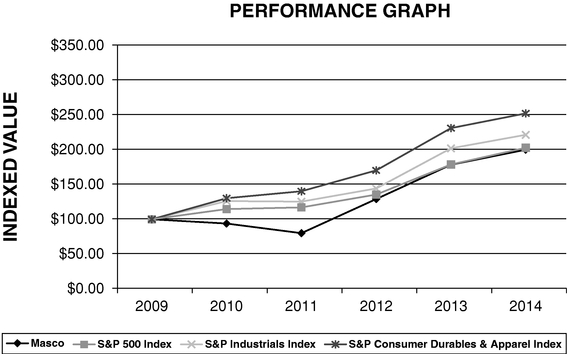]
The table below sets forth the value, as of December 31 for each of the years indicated, of a $100 investment made on December 31, [removed: 2008] [added: 2009] in each of our common stock, the S&P 500 Index, the S&P Industrials Index and the S&P Consumer Durables & Apparel Index and includes the reinvestment of dividends.
| | | [removed: 2009 | | |] 2010 | | | 2011 | | | 2012 | | | 2013 | | | [added: 2014 | | |]
In [removed: July 2007,] [added: September 2014,] our Board of Directors authorized the purchase of up to 50 million [removed: shares] [added: shares, for retirement] of our common stock in open-market transactions or [removed: otherwise.][added: otherwise, replacing the previous authorization established in 2007.]
During [removed: the first quarter of 2013,] [added: 2014,] we repurchased and retired [removed: 1.7] [added: 7] million shares of our common [removed: stock, for cash aggregating $35] [added: stock (including 1.7] million [added: shares repurchased in the first quarter of 2014] to offset the dilutive impact of [removed: the 2013 grant of 1.7 million shares of] long-term stock [removed: awards.][added: awards) for cash aggregating $158 million.]
| 2014 | | | | | | | | | | |
| Fourth | | $ | 25.58 | | $ | 19.84 | | $ | .09 | |
| Third | | | 24.91 | | | 20.18 | | | .09 | |
| Second | | | 23.42 | | | 19.50 | | | .09 | |
| First | | | 23.73 | | | 20.60 | | | .075 | |
| Total | | | | | | | | $ | .345 | |
| | | | | | | | | | | |
| | | | | | | | | | | |
The following table provides information regarding the repurchase of our common stock for the three months ended December 31, 2014:
| | | | | | | | | | | | | | |
| --- | --- | --- | --- | --- | --- | --- | --- | --- | --- | --- | --- | --- | --- |
| Period | | Total Number of Shares Purchased | | | Average Price Paid Per Common Share | | | Total Number of Shares Purchased as Part of Publicly Announced Plans or Programs | | | Maximum Number of Shares That May Yet Be Purchased Under the Plans or Programs | | |
| 10/1/14 - 10/31/14 | | | — | | $ | — | | | — | | | 50,000,000 | |
| 11/1/14 - 11/30/14 | | | 2,600,000 | | $ | 22.86 | | | 2,600,000 | | | 47,400,000 | |
| 12/1/14 - 12/31/14 | | | 2,400,000 | | $ | 24.63 | | | 2,400,000 | | | 45,000,000 | |
| | | | | | | | | | | | | | |
| Total for the quarter | | | 5,000,000 | | $ | 23.71 | | | 5,000,000 | | | 45,000,000 | |
| Masco | | $ | 93.85 | | $ | 79.91 | | $ | 129.32 | | $ | 179.07 | | $ | 200.78 | |
| S&P 500 Index | | $ | 114.82 | | $ | 117.22 | | $ | 135.83 | | $ | 179.36 | | $ | 203.60 | |
| S&P Industrials Index | | $ | 126.37 | | $ | 125.60 | | $ | 144.66 | | $ | 202.79 | | $ | 222.39 | |
| S&P Consumer Durables & Apparel Index | | $ | 130.54 | | $ | 140.61 | | $ | 170.84 | | $ | 232.06 | | $ | 253.37 | |
| | | | | | | | | | | |
| | | | | | | | | | | |
| Total | | | | | | | | $ | .30 | |
| | | | | | | | | | | |
| | | | | | | | | | | |
| 2012 | | | | | | | | | | |
| Fourth | | $ | 17.19 | | $ | 14.06 | | $ | .075 | |
| Third | | | 16.48 | | | 11.53 | | | .075 | |
| Second | | | 14.68 | | | 11.55 | | | .075 | |
| First | | | 14.41 | | | 10.75 | | | .075 | |
| | | | | | | | | | | |
| | | | | | | | | | | |
| Masco | | $ | 128.21 | | $ | 120.32 | | $ | 102.45 | | $ | 165.80 | | $ | 229.59 | |
| S&P 500 Index | | $ | 125.92 | | $ | 144.58 | | $ | 147.60 | | $ | 171.04 | | $ | 225.85 | |
| S&P Industrials Index | | $ | 120.19 | | $ | 151.89 | | $ | 150.97 | | $ | 173.87 | | $ | 243.73 | |
| S&P Consumer Durables & Apparel Index | | $ | 136.29 | | $ | 177.91 | | $ | 191.64 | | $ | 232.84 | | $ | 316.28 | |
At December 31, 2013, we had remaining authorization to repurchase up to 22.6 million shares.
We have not purchased any shares since March 2013.
Item 6. Selected Financial Data.
8 rewritten, 5 added, 5 removed, 15 unchanged
Read the full itemFY2014 item · filed February 13, 2015FY2013 item · filed February 14, 2014
| | | [added: 2014 | | |] 2013 | | | 2012 | | | 2011 | | | 2010 | | | [removed: 2009 | | |]
| Net Sales (1) | | $ | [removed: 8,173] [added: 8,521] | | $ | [removed: 7,495] [added: 8,173] | | $ | [removed: 7,170] [added: 7,495] | | $ | [removed: 7,183] [added: 7,170] | | $ | [removed: 7,297] [added: 7,183] | |
| Operating profit (loss) [removed: (1)(2)(3)(4)(5)] [added: (1)(3)(4)(5)] | | $ | [added: 788 | | $ |] 673 | | $ | 302 | | $ | (215 | ) | $ | (466 | ) | [removed: $ | 57 | |]
| Income (loss) from continuing operations attributable to Masco Corporation (1)(2)(3)(4)(5) | | $ | [removed: 282] [added: 861] | | $ | [removed: (53] [added: 298] | [removed: )] | $ | [removed: (394] [added: (53] | ) | $ | [removed: (1,027] [added: (385] | ) | $ | [removed: (145] [added: (1,028] | ) |
| Dividends declared | | $ | [removed: .30] [added: .345] | | $ | .30 | | $ | .30 | | $ | .30 | | $ | .30 | |
| Dividends paid | | $ | [removed: .30] [added: .33] | | $ | .30 | | $ | .30 | | $ | .30 | | $ | [removed: .46] [added: .30] | |
| Long-term debt | | | [added: 2,919 | | |] 3,421 | | | 3,422 | | | 3,222 | | | 4,032 | | [removed: | 3,604 | |]
The year 2010 also includes a [added: $372 million non-cash charge to income tax expense to establish a] valuation allowance on [removed: U.S.] deferred tax [removed: assets of $372 million.][added: assets.]
| Basic | | $ | 2.42 | | $ | .83 | | $ | (.16 | ) | $ | (1.11 | ) | $ | (2.95 | ) |
| Diluted | | $ | 2.39 | | $ | .83 | | $ | (.16 | ) | $ | (1.11 | ) | $ | (2.95 | ) |
| Total assets | | $ | 7,167 | | $ | 6,957 | | $ | 6,883 | | $ | 7,305 | | $ | 8,139 | |
| Shareholders' equity | | | 1,128 | | | 787 | | | 542 | | | 750 | | | 1,581 | |
The year 2014 includes a $529 million tax benefit from the release of the valuation allowance on deferred tax assets.
| Basic | | $ | .79 | | $ | (.16 | ) | $ | (1.14 | ) | $ | (2.95 | ) | $ | (.42 | ) |
| Diluted | | $ | .78 | | $ | (.16 | ) | $ | (1.14 | ) | $ | (2.95 | ) | $ | (.42 | ) |
| Total assets | | $ | 6,933 | | $ | 6,875 | | $ | 7,297 | | $ | 8,140 | | $ | 9,175 | |
| Shareholders' equity | | | 763 | | | 534 | | | 742 | | | 1,582 | | | 2,817 | |
The year 2009 includes non-cash impairment charges for goodwill aggregating $180 million after tax ($262 million pre-tax).
Item 8. Financial Statements and Supplementary Data
693 rewritten, 253 added, 440 removed, 830 unchanged
Read the full itemFY2014 item · filed February 13, 2015FY2013 item · filed February 14, 2014
The management of Masco Corporation assessed the effectiveness of the Company's internal control over financial reporting as of December 31, [removed: 2013 based on] [added: 2014 using] the [removed: 1992 framework established] [added: criteria set forth] by the Committee of Sponsoring Organizations of the Treadway Commission (COSO) in "Internal Control – Integrated Framework." Based on this assessment, management has determined that the Company's internal control over financial reporting was effective as of December 31, [removed: 2013.][added: 2014.]
PricewaterhouseCoopers LLP, an independent registered public accounting firm, performed an audit of the Company's consolidated financial statements and of the effectiveness of Masco Corporation's internal control over financial reporting as of December 31, [removed: 2013.][added: 2014.]
Their report expressed an unqualified opinion on the effectiveness of Masco Corporation's internal control over financial reporting as of December 31, [removed: 2013] [added: 2014] and expressed an unqualified opinion on the Company's [removed: 2013] [added: 2014] consolidated financial statements.
Report of Independent Registered Public Accounting [removed: Firm][added: Firm]
In our opinion, the consolidated financial statements listed in the index appearing under Item 15(a) (1) present fairly, in all material respects, the financial position of Masco Corporation and its subsidiaries at December 31, [removed: 2013] [added: 2014] and [removed: 2012,] [added: 2013,] and the results of their operations and their cash flows for each of the three years in the period ended December 31, [removed: 2013] [added: 2014] in conformity with accounting principles generally accepted in the United States of America.
Also in our opinion, the Company maintained, in all material respects, effective internal control over financial reporting as of December 31, [removed: 2013,] [added: 2014,] based on criteria established in _Internal Control – Integrated Framework [removed: (1992)_] [added: (2013)_] issued by the Committee of Sponsoring Organizations of the Treadway Commission (COSO).
at December 31, [removed: 2013] [added: 2014] and [removed: 2012][added: 2013]
| | | [added: 2014 | | |] 2013 | | | 2012 | | |
| Cash and cash investments | | $ | [removed: 1,223] [added: 1,383] | | $ | [removed: 1,040] [added: 1,223] | |
| Short-term bank deposits | | | [removed: 321] [added: 306] | | | [removed: 311] [added: 321] | |
| Receivables | | | [removed: 1,004] [added: 1,040] | | | [removed: 933] [added: 1,004] | |
| Inventories | | | [removed: 765] [added: 819] | | | [removed: 726] [added: 765] | |
| Prepaid expenses and other | | | [removed: 155] [added: 71] | | | [removed: 107] [added: 82] | |
| [removed: Assets] [added: Impairment of assets] held for sale | | | — | | | [removed: 100] [added: (10] | [added: )] | [added: | (3 | ) |]
| Total current assets | | | [removed: 3,468] [added: 3,863] | | | [removed: 3,217] [added: 3,468] | |
| Property and equipment, net | | | [removed: 1,252] [added: 1,139] | | | [removed: 1,326] [added: 1,252] | |
| Goodwill | | | [removed: 1,903] [added: 1,884] | | | [removed: 1,894] [added: 1,903] | |
| Other intangible assets, net | | | [removed: 149] [added: 145] | | | [removed: 151] [added: 149] | |
| [removed: Other assets | | | 161] [added: Other assets] | | | [removed: 184] | |
| Assets held for sale | | | [added: | | | | | | | | | | | | | | | | | |] — | | | [removed: 103] [added: —] | | [added: | 203 | |]
| [removed: Total Assets | | $ | 6,933] [added: Total assets] | | [removed: $] | [removed: 6,875] | |
| Accounts payable | | $ | [removed: 902] [added: 950] | | $ | [removed: 788] [added: 902] | |
| Notes payable | | | [removed: 6] [added: 505] | | | [removed: 206] [added: 6] | |
| Accrued liabilities | | | [removed: 874] | | | [removed: 823] [added: (1] | [added: )] |
| Total current liabilities | | | [removed: 1,782] [added: 2,211] | | | [removed: 1,862] [added: 1,686] | |
| Long-term debt | | | [removed: 3,421] [added: 2,919] | | | [removed: 3,422] [added: 3,421] | |
| Total Liabilities | | | [removed: 6,170] [added: 6,039] | | | [removed: 6,341] [added: 6,170] | |
| Masco Corporation's shareholders' equity Common shares authorized: 1,400,000,000; issued and outstanding: [removed: 2013] [added: 2014] – [removed: 349,500,000; 2012] [added: 345,000,000; 2013] – [removed: 349,000,000] [added: 349,500,000] | | | [removed: 349] [added: 345] | | | 349 | |
| Preferred shares authorized: 1,000,000; issued and outstanding: [removed: 2013] [added: 2014] and [removed: 2012] [added: 2013] – None | | | — | | | — | |
| Paid-in capital | | | [removed: 16] [added: —] | | | 16 | |
| Retained earnings [removed: (deficit)] | | | [removed: 55] [added: 690] | | | [removed: (102] [added: 79] | [removed: )] |
| Accumulated other comprehensive [added: (loss)] income | | | [removed: 115] [added: (111] | [added: )] | | [removed: 59] [added: 115] | |
| Total Masco Corporation's shareholders' equity | | | [removed: 535] [added: 924] | | | [removed: 322] [added: 559] | |
| Noncontrolling interest | | | [removed: 228] [added: 204] | | | [removed: 212] [added: 228] | |
| Total Liabilities and Equity | | $ | [removed: 6,933] [added: 7,167] | | $ | [removed: 6,875] [added: 6,957] | |
for the years ended December 31, [removed: 2013, 2012] [added: 2014, 2013] and [removed: 2011][added: 2012]
| | | [removed: 2013] [added: 2014] | | | [removed: 2012] [added: 2013] | | | [removed: 2011] [added: 2012] | | |
| Net sales | | $ | [removed: 8,173] [added: 8,521] | | $ | [removed: 7,495] [added: 8,173] | | $ | [removed: 7,170] [added: 7,495] | |
| Cost of sales | | | [removed: 5,918] [added: 6,134] | | | [removed: 5,539] [added: 5,918] | | | [removed: 5,383] [added: 5,539] | |
| Gross profit | | | [removed: 2,255] [added: 2,387] | | | [removed: 1,956] [added: 2,255] | | | [removed: 1,787] [added: 1,956] | |
February 13, 2015
| Other assets | | | 136 | | | 185 | |
| Accrued liabilities | | | 756 | | | 778 | |
| Other liabilities | | | 803 | | | 666 | |
| Deferred income taxes | | | 106 | | | 397 | |
| Total Equity | | | 1,128 | | | 787 | |
| Impairment charge for other intangible assets | | | 1 | | | — | | | 42 | |
| | | | (213 | ) | | (223 | ) | | (229 | ) |
| | | | (37 | ) | | 9 | | | 2 | |
| Issuance of Company common stock | | | 1 | | | — | | | — | |
| Repurchased | | | (158 | ) | | (7 | ) | | (28 | ) | | (123 | ) | | | | | | |
| Balance, December 31, 2014 | | $ | 1,128 | | $ | 345 | | $ | — | | $ | 690 | | $ | (111 | ) | $ | 204 | |
appropriate discount rates.
Our weighted average cost of capital decreased in 2014 due to lower bond rates.
In 2014, based upon our assessment of the risks impacting each of our businesses, we applied a risk premium to increase the discount rate to a range of 11.0 percent to 14.0 percent for our reporting units.
If the carrying amount of a reporting unit exceeds its fair value, we measure the possible goodwill impairment based upon an allocation of the estimate of fair value of the reporting unit to all of the underlying assets and liabilities of the reporting unit, including any previously unrecognized intangible assets (Step Two Analysis).
The excess of the fair value of a reporting unit over the amounts assigned to its assets and liabilities is the implied fair value of goodwill.
An impairment loss is recognized to the extent that a reporting unit's recorded goodwill exceeds the implied fair value of goodwill.
We have revised previously reported balances on our consolidated balance sheet as of December 31, 2013 to correct for claims not expected to be settled within the next year.
Accrued liabilities decreased from the amounts previously reported by $96 million.
Other liabilities increased from the amounts previously reported by $96 million.
During the quarter ended March 31, 2014, we identified an error in the accounting for certain of our investments in private equity limited partnership funds.
The investments were inappropriately accounted for under the cost basis versus the equity method.
The impact of the error was to under report the investment value (included in other assets on the consolidated balance sheets) and to over (under) state equity investment earnings (loss) (included in other income (expense), net in the consolidated statements of operations).
We have revised our December 31, 2013 and 2012 consolidated statement of operations and consolidated balance sheet as of December 31, 2013 in these financial statements to reflect the investment accounted for as an equity investment.
Retained earnings and other comprehensive income were adjusted for the changes in net income.
This error is not considered material to any prior period financial statement.
This revision has no net effect on our consolidated statement of cash flows.
| Correction | | | 16 | | | — | |
| As revised | | $ | (223 | ) | $ | (229 | ) |
| Correction | | | 16 | | | — | |
| Correction | | | 16 | | | — | |
| As revised | | $ | 339 | | $ | (18 | ) |
| As reported | | $ | 313 | | $ | (79 | ) |
| Correction | | | 16 | | | — | |
| As revised | | $ | 329 | | $ | (79 | ) |
| | | | | |
| --- | --- | --- | --- | --- |
| As reported | | $ | 161 | |
| Correction | | | 24 | |
PricewaterhouseCoopers LLP
February 14, 2014
| | | | | | | | |
| --- | --- | --- | --- | --- | --- | --- | --- |
| | | | | | | | |
| | | | | | | | |
| | | | | | | | |
| | | | | | | | |
| Liabilities held for sale | | | — | | | 45 | |
| | | | | | | | |
| Deferred income taxes and other | | | 967 | | | 1,053 | |
| Liabilities held for sale | | | — | | | 4 | |
| | | | | | | | |
| | | | | | | | |
| | | | | | | | |
| | | | | | | | |
| Total Equity | | | 763 | | | 534 | |
| | | | | | | | |
| | | | | | | | |
| | | | | | | | |
| | | | | | | | | | | |
| --- | --- | --- | --- | --- | --- | --- | --- | --- | --- | --- |
| | | | | | | | | | | |
| | | | | | | | | | | |
| | | | | | | | | | | |
| | | | | | | | | | | |
| | | | | | | | | | | |
| | | | | | | | | | | |
| | | | | | | | | | | |
| | | | | | | | | | | |
| | | | | | | | | | | |
| | | | | | | | | | | |
| | | | | | | | | | | |
| | | | | | | | | | | |
| | | | | | | | | | | |
| | | | | | | | | | | |
| | | | | | | | | | | |
An excerpt. Shown here: 40 of 693 rewritten, 40 of 253 added and 40 of 440 removed. The counts are complete. For every sentence, read Item 8. Financial Statements and Supplementary Data in the FY2014 filing and the FY2013 filing.
Item 9. Changes in and Disagreements with Accountants on Accounting and Financial Disclosure.
0 rewritten, 1 added, 0 removed, 1 unchanged
Read the full itemFY2014 item · filed February 13, 2015FY2013 item · filed February 14, 2014
Item 9A. Controls and Procedures.
2 rewritten, 1 added, 0 removed, 10 unchanged
Read the full itemFY2014 item · filed February 13, 2015FY2013 item · filed February 14, 2014
The Company, with the participation of the Chief Executive Officer and Chief Financial Officer, conducted an evaluation of its disclosure controls and procedures as required by Exchange Act Rules 13a-15(b) and 15d-15(b) as of December 31, [removed: 2013.][added: 2014.]
In connection with the evaluation of the Company's "internal control over financial reporting" that occurred during the quarter ended December 31, [removed: 2013,] [added: 2014,] which is required under the Securities Exchange Act of 1934 by paragraph (d) of Exchange Rules 13a-15 or 15d-15 (as defined in paragraph (f) of Rule 13a-15), management determined that there was no change that materially affected or is reasonably likely to materially affect internal control over financial reporting.
Item 9B. Other Information.
0 rewritten, 1 added, 0 removed, 3 unchanged
Read the full itemFY2014 item · filed February 13, 2015FY2013 item · filed February 14, 2014
Item 10. Directors, Executive Officers and Corporate Governance.
1 rewritten, 0 added, 0 removed, 2 unchanged
Read the full itemFY2014 item · filed February 13, 2015FY2013 item · filed February 14, 2014
Other information required by this Item will be contained in our definitive Proxy Statement for the [removed: 2014] [added: 2015] Annual Meeting of Stockholders, to be filed on or before April 30, [removed: 2014,] [added: 2015,] and such information is incorporated herein by reference.
Item 11. Executive Compensation.
1 rewritten, 0 added, 0 removed, 1 unchanged
Read the full itemFY2014 item · filed February 13, 2015FY2013 item · filed February 14, 2014
Information required by this Item will be contained in our definitive Proxy Statement for the [removed: 2014] [added: 2015] Annual Meeting of Stockholders, to be filed on or before April 30, [removed: 2014,] [added: 2015,] and such information is incorporated herein by reference.
Item 12. Security Ownership of Certain Beneficial Owners and Management and Related Stockholder Matters.
3 rewritten, 1 added, 1 removed, 6 unchanged
Read the full itemFY2014 item · filed February 13, 2015FY2013 item · filed February 14, 2014
We grant equity under our [removed: 2005] [added: 2014] Long Term Stock Incentive Plan (the [removed: "2005] [added: "2014] Plan").
The following table sets forth information as of December 31, [removed: 2013] [added: 2014] concerning the [removed: 2005] [added: 2014] Plan, which was approved by our stockholders.
The remaining information required by this Item will be contained in our definitive Proxy Statement for our [removed: 2014] [added: 2015] Annual Meeting of Stockholders, to be filed on or before April 30, [removed: 2014,] [added: 2015,] and such information is incorporated herein by reference.
| Equity compensation plans approved by stockholders | | | 18,201,674 | | $ | 20.98 | | | 12,193,137 | |
| Equity compensation plans approved by stockholders | | | 24,691,784 | | $ | 21.52 | | | 9,257,457 | |
Item 13. Certain Relationships and Related Transactions, and Director Independence.
1 rewritten, 0 added, 0 removed, 1 unchanged
Read the full itemFY2014 item · filed February 13, 2015FY2013 item · filed February 14, 2014
Information required by this Item will be contained in our definitive Proxy Statement for the [removed: 2014] [added: 2015] Annual Meeting of Stockholders, to be filed on or before April 30, [removed: 2014,] [added: 2015,] and such information is incorporated herein by reference.
Item 14. Principal Accountant Fees and Services.
1 rewritten, 0 added, 0 removed, 3 unchanged
Read the full itemFY2014 item · filed February 13, 2015FY2013 item · filed February 14, 2014
Information required by this Item will be contained in our definitive Proxy Statement for the [removed: 2014] [added: 2015] Annual Meeting of Stockholders, to be filed on or before April 30, [removed: 2014,] [added: 2015,] and such information is incorporated herein by reference.
Item 15. Exhibits and Financial Statement Schedules.
51 rewritten, 23 added, 19 removed, 119 unchanged
Read the full itemFY2014 item · filed February 13, 2015FY2013 item · filed February 14, 2014
_Financial Statements._ Our consolidated financial statements included in Item 8 hereof, as required at December 31, [removed: 2013] [added: 2014] and [removed: 2012,] [added: 2013,] and for the years ended December 31, [removed: 2013, 2012] [added: 2014, 2013] and [removed: 2011,] [added: 2012,] consist of the following:
| [removed: [](#SOC)] [added: [](#fi77001_masco_corporation_and_consolid__mas05190)] [Consolidated Statements of Comprehensive Income [removed: (Loss)](#SOC)] [added: (Loss)](#fi77001_masco_corporation_and_consolid__mas05190)] | | [removed: [43](#SOC)] [added: [43](#fi77001_masco_corporation_and_consolid__mas05190)] |
| [removed: [](#CF)] [added: [](#fk77001_masco_corporation_and_consolid__mas04605)] [Consolidated Statements of Cash [removed: Flows](#CF)] [added: Flows](#fk77001_masco_corporation_and_consolid__mas04605)] | | [removed: [44](#CF)] [added: [44](#fk77001_masco_corporation_and_consolid__mas04605)] |
| [removed: [](#NOTES)] [added: [](#fo77001_masco_corporation_note__fo702526)] [Notes to Consolidated Financial [removed: Statements](#NOTES)] [added: Statements](#fo77001_masco_corporation_note__fo702526)] | | [removed: [46](#NOTES)] [added: [46](#fo77001_masco_corporation_note__fo702526)] |
Our Financial Statement Schedule appended hereto, as required for the years ended December 31, [removed: 2013, 2012] [added: 2014, 2013] and [removed: 2011,] [added: 2012,] consists of the following:
See separate Exhibit Index beginning on page [removed: 94.][added: 92.]
[removed: February 14, 2014][added: | 2014 | | $ | 27 | | $ | 6 | | $ | — | | | | | $ | (15 | ) | | (a | ) | $ | 18 | |]
| /s/ [removed: TIMOTHY WADHAMS Timothy Wadhams] [added: KEITH ALLMAN Keith Allman] | | _President, Chief Executive Officer and Director_ | | | | |
| /s/ DENNIS W. ARCHER Dennis W. Archer | | _Director_ | | | | [added: _February 13, 2015_] |
| [removed: /s/] [added: _/s/] J. MICHAEL LOSH [removed: J.] [added: __J.] Michael [removed: Losh] [added: Losh_] | | [removed: _Director_] [added: _ Director_] | | | | [removed: _ February 14, 2014_] |
| [removed: /s/] [added: _/s/] CHRISTOPHER A. O'HERLIHY [removed: Christopher] [added: __Christopher] A. [removed: O'Herlihy] [added: O'Herlihy_] | | [removed: _Director_] [added: _ Director_] | | | | |
for the years ended December 31, [removed: 2013, 2012] [added: 2014, 2013] and [removed: 2011][added: 2012]
| | | (In [removed: Millions)] [added: Millions)] | | | | | | | | | | | | | | | | | | | | |
| Exhibit No. | | | | | | | | Filed [removed: Herewith] [added: Here-with] | | | | | | | |
| 3.i | | Restated Certificate of Incorporation of Masco [removed: Corporation and amendments thereto.] [added: Corporation.] | | | | | | 2010 10-K | | 3.i | | | 02/18/2011 | | |
| | | (i) | | 6.625% Debentures Due April 15, 2018; and | | | | [added: 2013 10-K] | | [added: 4.a.i(i)] | | | [added: 02/14/2014] | | [removed: X] |
| | | (ii) | | 73/4% Debentures Due August 1, 2029. | | | | [removed: 2009 10-K] | | [removed: 4.a.i(iii)] | | | [removed: 02/16/2010] | | [added: X] |
| 4.a.ii | | Supplemental Indenture dated as of July 26, 1994 between Masco Corporation and Bank of New York Trust Company, N.A., as successor trustee under agreement originally with The First National Bank of Chicago, as Trustee. | | | | | | [removed: 2009 10-K] | | [removed: 4.a.iii] | | | [removed: 02/16/2010] | | [added: X] |
| Exhibit No. | | | | | | | | Filed [removed: Herewith] [added: Here-with] | | | | | | | |
| Note 2: | | Exhibits 10.b through [removed: 10.k] [added: 10.n] constitute the management contracts and executive compensatory plans or arrangements in which certain of the Directors and executive officers of the Company participate. | | | | | | | | | | | | | |
| | | | | (A) | | for awards prior to January 1, 2005, including supplemental letter; and | | [removed: 2009 10-K] | | [removed: 10.a(i)(A)] | | | [removed: 02/16/2010] | | [added: X] |
| | | | | (B) | | for awards on and after January 1, 2005; | | [removed: 2009 10-K] | | [removed: 10.a(i)(B)] | | | [removed: 02/16/2010] | | [added: X] |
| | | (ii) | | Form of Restoration Stock Option; | | | | [removed: 2009 10-K] | | [removed: 10.a(ii)] | | | [removed: 02/16/2010] | | [added: X] |
| | | (iii) | | Form of Stock Option Grant; | | | | [removed: 2009 10-K] | | [removed: 10.a(iii)] | | | [removed: 02/16/2010] | | [added: X] |
| | | (iv) | | Form of Stock Option Grant for Non-Employee Directors; and | | | | [removed: 2009 10-K] | | [removed: 10.a(iv)] | | | [removed: 02/16/2010] | | [added: X] |
| 10.b.ii | | Masco Corporation 2004 Restricted Stock Award Program (under the 1991 Long Term Stock Incentive Plan). | | | | | | [removed: 2009 10-K] | | [removed: 10.f] | | | [removed: 02/16/2010] | | [added: X] |
| | | | | (A) | | for awards on or after January 1, 2013; | | [removed: 2013] [added: 2012] 10-K | | 10.b.i(i)(A) | | | 02/15/2013 | | |
| | | | | (B) | | for awards during 2012; | | [removed: 2013] [added: 2012] 10-K | | 10.b.i(i)(B) | | | 02/15/2013 | | |
| | | | | (A) | | for grants on or after January 1, 2013; | | [removed: 2013] [added: 2012] 10-K | | 10.b.i(ii)(A) | | | 02/15/2013 | | |
| | | | | (B) | | for grants during 2012 | | [removed: 2013] [added: 2012] 10-K | | 10.b.i(ii)(B) | | | 02/15/2013 | | |
| | | (iv) | | Form of Stock Option Grant for [removed: Non-Employee] [added: Non- Employee] Directors. | | | | [removed: 2010 10-K] | | [removed: 10.b.i(iv)] | | | [removed: 02/18/2011] | | [added: X] |
| 10.c.ii | | Non-Employee Directors Equity Program under Masco Corporation's 2005 Long Term Stock Incentive Plan (Amended July 2012): | | | | | | [removed: 2013] [added: 2012] 10-K | | 10.b.ii | | | 02/15/2013 | | |
| | | (i) | | Form of Restricted Stock Awards. | | | | [removed: 2013] [added: 2012] 10-K | | 10.b.ii(i) | | | 02/15/2013 | | |
| Exhibit No. | | | | | | | | Filed [removed: Herewith] [added: Here-with] | | | | | | | |
| | | (i) | | Form of Restricted Stock Award for awards 2010 through 2012. | | | | [removed: 2013] [added: 2012] 10-K | | 10.b.iii(i) | | | 02/15/2013 | | |
| 10.c.iv | | Non-Employee Directors Equity Program under Masco Corporation's 2005 Long Term Stock Incentive Plan (for awards prior to 2010): | | | | | | [removed: 2013] [added: 2012] 10-K | | 10.b.iv | | | 02/15/2013 | | |
| | | (i) | | Form of Restricted Stock Award Agreement; and | | | | [removed: 2013] [added: 2012] 10-K | | 10.b.iv(i) | | | 02/15/2013 | | |
| | | (ii) | | Form of Stock Option Grant Agreement. | | | | [removed: 2013] [added: 2012] 10-K | | 10.b.iv(ii) | | | 02/15/2013 | | |
| [removed: 10.d.i] [added: 10.e.i] | | Forms of Masco Corporation Supplemental Executive Retirement and Disability Plan and amendments thereto: | | | | | | | | | | | | | |
| [removed: 10.d.ii] [added: 10.e.ii] | | Form of letter agreement dated March 21, 2012 amending the Masco Corporation Supplemental Executive Retirement and Disability [removed: Plan] [added: Plan.] | | | | | | 10-Q | | 10.c | | | 05/02/2012 | | |
| [](#fe77001_financial_statements_and_suppl__fin05321) [Consolidated Balance Sheets](#fe77001_financial_statements_and_suppl__fin05321) | | [41](#fe77001_financial_statements_and_suppl__fin05321) |
| [](#fg77001_masco_corporation_and_consolid__mas04632) [Consolidated Statements of Operations](#fg77001_masco_corporation_and_consolid__mas04632) | | [42](#fg77001_masco_corporation_and_consolid__mas04632) |
| [](#fm77001_masco_corporation_and_consolid__mas05037) [Consolidated Statements of Shareholders' Equity](#fm77001_masco_corporation_and_consolid__mas05037) | | [45](#fm77001_masco_corporation_and_consolid__mas05037) |
February 13, 2015
| /s/ MARK R. ALEXANDER Mark R. Alexander | | _Director_ | | | | |
| 2014 | | $ | 662 | | $ | (539 | ) | $ | (57 | ) | | (b | ) | $ | — | | | | | $ | 66 | |
| 2013 | | $ | 785 | | $ | (36 | ) | $ | (87 | ) | | (c | ) | $ | — | | | | | $ | 662 | |
| | | | | | | | | | | | | | | | | | | | | | | |
| | | | | | | | | | | | | | | | | | | | | | | |
| | | | | | | | | | | | | | | | | | | | | | | |
| 2012 | | $ | 686 | | $ | 113 | | $ | (14 | ) | | (c | ) | $ | — | | | | | $ | 785 | |
| | | | | | | | | | | | | | | | | | | | | | | |
| | | | | | | | | | | | | | | | | | | | | | | |
| | | | | | | | | | | | | | | | | | | | | | | |
Write off of a $55 million deferred tax asset on certain net operating loss carryforward against the valuation allowance as it was determined that there was only a remote likelihood that such a carryforward could be utilized; and $2 million valuation allowance on deferred tax assets recorded primarily in other comprehensive income.
(c)
| 10.d.i | | Masco Corporation 2014 Long Term Stock Incentive Plan: | | | | | | 8-K | | 10.a | | | 05/06/2014 | | |
| | | (i) | | Form of Restricted Stock Award Agreement; and | | | | 8-K | | 10.b | | | 05/06/2014 | | |
| | | (ii) | | Form of Stock Option Grant Agreement. | | | | 8-K | | 10.d | | | 05/06/2014 | | |
| 10.d.ii | | Non-Employee Directors Equity Program under Masco Corporation's 2014 Long Term Stock Incentive Plan: | | | | | | 10-Q | | 10 | | | 10/28/2014 | | |
| | | (i) | | Form of Restricted Stock Award Agreement for Non-Employee Directors | | | | 8-K | | 10.c | | | 05/06/2014 | | |
| 10.m | | Employment Offer Letter dated October 23, 2014 between Christopher Kastner and Masco Corporation. | | | | | | | | | | | | | X |
| 10.n | | Employment Offer Letter dated November 1, 2014 between Amit Bhargave and Masco Corporation. | | | | | | | | | | | | | X |
| [](#BS) [Consolidated Balance Sheets](#BS) | | [41](#BS) |
| [](#SOP) [Consolidated Statements of Operations](#SOP) | | [42](#SOP) |
| [](#SSE) [Consolidated Statements of Shareholders' Equity](#SSE) | | [45](#SSE) |
| | | | | | | | | | | | | | | | | | | | | | | |
| | | | | | | | | | | | | | | | | | | | | | | |
| | | | | | | | | | | | | | | | | | | | | | | |
| | | | | | | | | | | | | | | | | | | | | | | |
| | | | | | | | | | | | | | | | | | | | | | | |
| 2011 | | $ | 34 | | $ | 12 | | $ | — | | | | | $ | (17 | ) | | (a | ) | $ | 29 | |
| | | | | | | | | | | | | | | | | | | | | | | |
| | | | | | | | | | | | | | | | | | | | | | | |
| 2013 | | $ | 787 | | $ | (30 | ) | $ | (87 | ) | | (b | ) | $ | — | | | | | $ | 670 | |
| | | | | | | | | | | | | | | | | | | | | | | |
| | | | | | | | | | | | | | | | | | | | | | | |
| 2012 | | $ | 688 | | $ | 113 | | $ | (14 | ) | | (b | ) | $ | — | | | | | $ | 787 | |
| | | | | | | | | | | | | | | | | | | | | | | |
| | | | | | | | | | | | | | | | | | | | | | | |
| 2011 | | $ | 462 | | $ | 178 | | $ | 48 | | | (b | ) | $ | — | | | | | $ | 688 | |
| | | | | | | | | | | | | | | | | | | | | | | |
An excerpt. Shown here: 40 of 51 rewritten, all 23 added and all 19 removed. The counts are complete. For every sentence, read Item 15. Exhibits and Financial Statement Schedules. in the FY2014 filing and the FY2013 filing.