 filings.tools
MSCI (MSCI) 10-K risk factor changes: FY2019 vs FY2018
The 2019-12-31 10-K against the 2018-12-31 one, compared heading by heading and sentence by sentence. One of these filings carries no fiscal year tag, so its year is the calendar year of the period end.
Item 1A140 rewritten57 added137 removed120 unchanged
All filing items1,039 rewritten552 added1,047 removed1,490 unchanged
Summary
counted, not written
- Item 1A headings could not be compared: only 0 carried over between the two years, which usually means one filing was read wrongly, so none is reported as new or removed.
- Sentence by sentence, 552 added, 1,047 removed, 1,039 rewritten and 1,490 unchanged across 16 items that differ.
Sentences by item
22 items, with every count and a link to each item that changed
Underlined words on a shaded ground are new in FY2019; struck-through words were in FY2018. Sentences that are wholly new or wholly gone are labelled rather than marked.
Item 1A. Risk Factors
140 rewritten, 57 added, 137 removed, 120 unchanged
Read the full itemFY2019 item · filed February 18, 2020FY2018 item · filed February 22, 2019
We are dependent on third parties to supply [removed: data] [added: data, applications] and [removed: software] [added: services] for our products and [added: services and] are dependent on certain vendors to distribute our [removed: data.][added: products.]
A refusal [added: or failure] by a key vendor to distribute our [removed: data] [added: products] or any loss of key outside suppliers of [removed: data] [added: data, applications] or [removed: software products] [added: services] or [added: a] reduction in the accuracy or quality of such [removed: data] [added: data, applications] or [removed: products] [added: services] or any failure by us to comply with our [removed: vendors’] [added: suppliers’ or distributors’] licensing requirements could impair our ability to provide our clients with [removed: the data,] [added: our] products [removed: or services they desire,] [added: and services,] which could have a material adverse effect on our business, financial condition or results of operations.
We rely on [added: third-party suppliers of data, applications and services, including data from stock exchanges (“Vendor Products”), and depend on] the accuracy and quality of [removed: third-party data and software products] [added: Vendor Products] and [removed: depend on] the ability and willingness of [removed: third-party data and software providers] [added: such suppliers] to [removed: deliver and support reliable products,] [added: deliver, support,] enhance [removed: their current products,] [added: and] develop new [removed: products] [added: Vendor Products] on a timely and cost-effective basis, and respond to emerging industry standards and other technological changes [added: in order] to [removed: produce and] [added: produce,] deliver [removed: our products, provide services] and develop [removed: new] [added: our] products and services.
[removed: Additionally, we] [added: We also] rely on certain third-party vendors to distribute our data to clients.
Should any of our key vendors refuse to distribute our data for any [removed: reason,] [added: reason or require that] we [added: pay them fees in connection with the distribution of our data, we] would need to find alternative ways to distribute our [removed: data,] [added: data or lose revenue in connection with paying distribution fees,] which may have a material adverse effect on our business, financial condition or results of operations.
If [removed: the data and software products from our suppliers have] [added: Vendor Products include] errors, [removed: are delayed, have] design defects, [added: are delayed,] become incompatible with future versions of our products, are unavailable on acceptable terms or are not available at all, we may not be able to deliver our products and [removed: services and our business, financial condition or results of operations could be materially adversely affected.][added: services.]
Some of our agreements with [removed: data] [added: third party] suppliers allow them to cancel on short notice and we have not completed formal agreements [removed: with] [added: for] all [removed: of] our [removed: data suppliers,] [added: Vendor Products,] such as certain stock exchanges.
From time to time we receive notices from [removed: data] [added: third party] suppliers, including stock exchanges, threatening to terminate the provision of their [removed: data] [added: products or services] to us, and some data suppliers, including at least one stock exchange, have terminated the provision of their data to us.
Termination of the provision of [removed: data] [added: Vendor Products] by one or more of our significant [removed: data] suppliers or exclusion from, or restricted use of, or litigation in connection with [removed: a data provider’s information] [added: Vendor Products] could decrease the [removed: information] [added: data and materials] available for us to use [removed: (and offer our clients)] and [removed: may have a material adverse effect on] [added: deliver to] our [removed: business, financial condition or results of operations.][added: clients.]
[removed: Although data suppliers and stock exchanges typically benefit from providing broad access to their data,] [added: In addition,] some of our competitors could enter into exclusive contracts with our data suppliers, including with certain stock exchanges.
If our competitors enter into such exclusive contracts, we may be precluded from receiving certain data [added: or other materials] from these suppliers or restricted in our use of such [removed: data,] [added: data or other materials,] which would give our competitors a competitive advantage.
Such exclusive contracts could hinder our ability to [added: create our products and services or to] provide our clients with the data [added: or other products or services] they prefer, which could lead to a decrease in our client [removed: base and could have a material adverse effect on our business, financial condition or results of operations.][added: base.]
Despite our [removed: efforts,] [added: efforts to comply with the licensing requirements of Vendor Products,] our use of certain [removed: third-party data and software products] [added: Vendor Products] has been challenged in the past and there can be no assurance that [removed: such] third parties may not challenge our use in the future, resulting in increased [removed: data] acquisition or [removed: software] [added: licensing] costs, loss of rights and/or costly legal actions.
Our business could be materially adversely affected if we are unable to timely or effectively replace the functionality provided by [removed: data or software] [added: Vendor Products] that becomes unavailable or fails to operate effectively for any reason.
Our operating costs could increase if [added: additional] license fees [removed: for third-party data] [added: are imposed] or [removed: software products] [added: current license fees] increase or the efforts to incorporate enhancements to [removed: third-party or other data or software] [added: Vendor Products] are substantial and we are unable to negotiate acceptable licensing arrangements with these suppliers or find alternative sources of equivalent [removed: data] [added: products] or [removed: software products.][added: services.]
Our clients that pay us a fee based on the assets [added: under management or total expense ratio] of an index-linked investment product may seek to negotiate a lower asset-based fee percentage or lower the total expense ratio of such products or may cease using our indexes, which could limit the growth of or decrease our revenues from asset-based fees.
A portion of our revenues are from asset-based fees and these revenue streams are concentrated in some of our largest clients, including BlackRock, and in our largest market, the U.S. Our clients, including our largest clients, may seek [added: for a variety of reasons] to negotiate [removed: a] [added: to pay us] lower asset-based fee [removed: percentage for] [added: percentages, which are sometimes calculated as] a [removed: variety] [added: percentage] of [removed: reasons.][added: the relevant product’s total expense ratio (“TER”).]
Additionally, competition is intense [removed: and increasing rapidly] among our clients that [removed: provide] [added: offer or manage] index-linked investment products, including [removed: ETFs.][added: ETFs, and low fees are one of the competitive differentiators.]
[removed: A] [added: Where an investment product’s TER determines our fees, a] reduction in the TER [removed: or an elimination of TER] may negatively impact our revenues.
Additionally, our clients, including our largest clients, may seek to lower or eliminate [removed: AUM] floors [added: on asset-based fees] (i.e., minimum asset-based fee percentages) or impose or lower [removed: AUM] ceilings [added: on asset-based fees] (i.e., maximum asset-based fee percentages).
Such changes [removed: in] [added: affecting] our [added: fees and] fee [removed: structure] [added: structures] could individually, or in the aggregate, negatively impact our revenues.
[removed: Additionally, clients] [added: Clients] that license our indexes to serve as the basis for listed futures and options contracts might [added: also] discontinue such contracts.
[removed: We] [added: Additionally, we] have a differentiated licensing strategy for our indexes and from time to time experience faster growth [removed: in] [added: from] lower fee [removed: product areas,] [added: products,] resulting in a lower average asset-based fee percentage [removed: for licensing our indexes.][added: from index-linked investment products.]
While we [removed: look] [added: aim] to maximize the price and volume trade-off over the long-term, there can be no assurance that we will be able to do [removed: so in the future.][added: so.]
Results for any given quarter could be materially adversely affected by stronger growth in [removed: AUM] [added: assets] in index-linked investment products with lower than average [removed: product] fees not sufficiently offset by growth in [removed: AUM] [added: assets] in index-linked investment products [removed: in] [added: with] higher than average [removed: product] fees.
[removed: In the instances described above, our] [added: Our] asset-based fees could dramatically decrease, which could have a material adverse effect on our business, financial condition or results of operations.
[removed: If investment in equity markets declines, revenue attributable to our clients’] [added: Such changes could decrease the] use of our [removed: indexes or Analytics] products [removed: could decrease] which could have a material adverse effect on our business, financial condition or results of operations.
Our equity indexes serve as equity benchmarks against which our clients can measure the performance of their investments and are also used by clients as the basis for certain index-linked investment [removed: products, such as ETFs and mutual funds,] [added: products] for a fee based on the value of the investment product’s assets.
Our Analytics segment offers performance attribution and portfolio management content, applications and services [added: and MAC models] that provide clients with an integrated view of risk and return of their [removed: equity portfolios.][added: portfolios across markets and asset classes.]
[removed: Accordingly,] [added: Additionally,] the value of assets in index-linked investment products can fluctuate significantly over short periods of time and such volatility may be further impacted by fluctuations in foreign currency exchange rates.
Any [removed: resulting] failures, [removed: disruptions or] [added: disruptions,] instability [removed: of] [added: or vulnerabilities in] our information technology [removed: platform, electronic] [added: architecture, platforms, production and] delivery systems, [removed: or] [added: software, code, internal network,] the [removed: internet, including a cybersecurity breach] [added: Internet] or [removed: cyberattack,] [added: other systems or applications] may [added: cause our products to be unavailable or fail and impose delays or additional costs in deploying our products, or impose conditions or restrictions on our ability to commercialize our products or keep them confidential and] result in reputational [added: and other] harm and have a material adverse effect on our business, financial condition or results of operations.
We depend heavily on the capacity, reliability and security of our information technology [removed: platform, electronic delivery] systems and [added: platforms and] their components, including our data [removed: centers,] [added: centers] and [added: production and delivery systems as well] the [removed: internet] [added: Internet,] to [removed: seamlessly provide clients with] [added: create and deliver our] products and [removed: customer service.][added: service our clients.]
Heavy use of our electronic delivery systems and other factors such as loss of service from third parties, operational failures, [removed: sabotage, break-ins and similar disruptions from unauthorized changes (tampering, intrusions or hacking),] human error, [removed: cyberterrorism, cybercrime, ransomware,] terrorist [added: or other] attacks affecting [added: systems or] sites where we are located, [added: climate or weather related events (e.g.,] natural [removed: disasters,] [added: disasters),] power loss, telecommunications failures, technical breakdowns, [removed: internet] [added: Internet] failures or computer viruses could impair our systems’ operations or interrupt their availability for extended periods of time.
[removed: If disruptions,] [added: Disruptions,] failures or slowdowns [added: that could] occur with respect to our operations, including to our information technology [removed: platform,] [added: systems and platforms,] our electronic delivery systems or the [removed: internet,] [added: Internet, could damage] our [removed: reputation] [added: brand] and [added: reputation, result in litigation and negatively affect] our ability to distribute our products effectively and to [removed: serve] [added: service] our clients, including [removed: those clients for whom we provide] [added: delivering] managed services or [removed: to whom we distribute] [added: delivering real-time] index [removed: and constituent data on a real time basis that is used to manage funds that replicate MSCI indexes, may be materially adversely affected.][added: data.]
[removed: While we have been able to defend our systems against such disruptions and attacks in the past, there] [added: There] is no assurance that we will be able to [removed: do so] successfully [removed: in the future] [added: defend against such disruptions] or that our disaster recovery or business continuity plans will be effective in mitigating the risks and [removed: costs] associated [removed: with the particular event that has occurred.][added: costs, which could have a material impact on our business, financial condition or results of operations.]
Any [removed: of the foregoing could lead] [added: failure] to [removed: unexpected or higher than estimated costs] [added: ensure] and [added: protect the confidentiality of data could] have a material adverse effect on our business, financial condition or results of operations.
[removed: See “—Any] [added: Any] failure to [removed: ensure and protect] [added: effectively manage expansion or to effectively manage] the [removed: confidentiality of data] [added: business globally] could [removed: adversely affect] [added: damage] our brand and [removed: reputation] [added: reputation, result in increased costs] and [added: litigation and] have a material adverse effect on our business, financial condition or results of [removed: operations” below.][added: operations.]
[removed: Any failure to ensure] [added: Successful cyber-attacks] and [removed: protect] the [removed: confidentiality] [added: failure] of [removed: data could adversely affect our brand and reputation] [added: cyber-security systems] and [added: procedures could] have a material adverse effect on our business, financial condition or results of operations.
The Company may [removed: also] be exposed to more targeted [removed: cyberattacks] [added: and more sophisticated cyber-attacks] aimed at accessing certain information on our systems because of our prominence in the global marketplace, including client [added: portfolio] data, [added: the composition of] our [added: indexes and MSCI] ESG [added: Research] ratings of corporate [removed: issuers and the composition of our indexes.][added: issuers.]
[removed: As] [added: We may also incur additional costs as] a result of [removed: increased cyber threats and cybersecurity and privacy regulations, clients have increasingly requested additional security measures on the products we provide] [added: increasing] and [removed: details about] [added: refining] our internal processes and software [removed: controls,] [added: controls and] policies and procedures related to security, processing integrity and confidentiality or privacy.
This information should be read in conjunction with "Management’s Discussion and Analysis of Financial Condition and Result of Operations" and the consolidated financial statements and related notes.
The following discussion of risks is not all-inclusive but is designed to highlight what we believe are important factors to consider when evaluating our business and expectations.
These factors could cause our future results to differ materially from our historical results and from expectations reflected in forward-looking statements.
Operational Risks
Client Risks
Finally, to the extent that multiple investment products are based on the same index, (i) assets under management in one product could shift to products that pay MSCI lower fee levels, (ii) the products could compete for the same assets such that none of the products becomes large enough to be successful or sustained, or (iii) the failure or discontinuance of one product (e.g., derivatives used for hedging) could have a detrimental effect on the use of the other products (e.g., ETFs).
A material portion of our revenues is concentrated in some of our largest customers.
For the fiscal year ended December 31, 2018, BlackRock, accounted for 11.9% of our total revenues.
Technology Risks
In addition, we change the composition of our indexes from time to time and we believe that, in some cases, such changes can have an indirect effect on the prices of constituent securities and on certain index-linked investment products based on our indexes as a result of trading activity related to replicating our indexes.
If our internal processes, confidentiality policies, conflict of interest policies or information barrier procedures fail or are insufficient, including as a result of human error or manual processes, or if an employee purposely circumvents or violates our internal controls, policies or procedures, then unauthorized access to, or disclosure or misappropriation of, data, including material non-public or other confidential information (e.g., index composition data), our brand and reputation may suffer and we may become subject to litigation, regulatory actions, sanctions or other penalties, leading to a loss of client confidence, which could have a material adverse effect on our business, financial condition or results of operations.
The Company’s operations rely on the secure processing, storage and transmission of confidential, sensitive, proprietary and other types of data and information, and on those of its third-party vendors.
We and our vendors are subject to cyber risks, including cyber-attacks, such as phishing scams, hacking, tampering, intrusions, viruses, ransomware, malware and denial-of-service attacks.
Our and our vendors’ use of mobile and cloud technologies may increase our risk for such threats.
Any such threats may cause material interruptions or malfunctions in our or our vendors’ products or services, networks, systems, websites, applications, data or data processing, or may otherwise compromise the availability, confidentiality or integrity of data or information in our possession.
While the Company has not experienced cyber incidents that are individually, or in the aggregate, material, the Company has experienced cyber-attacks of varying degrees in the past, including denial-of-service attacks, and there can be no assurance that there will not be a material adverse effect in the future.
Our security measures or those of our third-party providers, including any cloud-based technologies, may prove insufficient depending upon the attack or threat posed.
Cyber-attacks, security breaches or third-party reports of perceived security vulnerability to the Company’s systems, even if no breach has occurred, could damage our brand and reputation, result in litigation, regulatory actions, sanctions or other penalties, lead to loss of client confidence in our security measures and reliability, which would harm our ability to retain clients and gain new ones, and lead to financial losses.
Any of the foregoing could lead to unexpected or higher than estimated costs.
Strategy and Growth Risks
Our business may be affected by changes in the global capital markets, including adverse equity market conditions, volatility in the financial markets and evolving investment trends.
Our business is impacted by economic conditions and volatility in the global capital markets.
Our clients use our products for a variety of investment objectives, including benchmarking and portfolio construction and ESG, factor, private real estate and MAC investing.
Volatile capital markets may impact whether investors choose to invest in developed or emerging markets, or in the U.S. or non-U.S. markets, as well as whether to adopt different investment styles.
Our ESG segment offers ESG ratings and research on companies worldwide to provide clients with an understanding of how ESG factors can impact the long-term risk of their investments.
Such research is also used in the construction of equity and fixed income indexes, which help investors more effectively benchmark ESG investment performance and manage and measure ESG mandates.
Additionally, an increasing portion of our revenues comes from products that relate to certain investment trends, such as ESG, factor and MAC investing.
A decline in the equity markets or a trend away from such investment trends could decrease demand for the Company’s related products, which could have a material adverse effect on our business, financial condition or results of operations.
Some competitors may offer price incentives or different pricing structures that are more attractive to clients.
The competitive landscape may also experience consolidation in the form of mergers and acquisitions, joint ventures or strategic partnerships, which result in a narrower pool of competitors that are better capitalized or that are able to gain a competitive advantage through synergies.
We may not be successful in developing, introducing, implementing, marketing, pricing, launching or licensing new products or enhancements on a timely or cost-effective basis or without impacting the stability and efficiency of existing products and systems.
Any new products and enhancements may not adequately meet the requirements of the marketplace or industry standards or achieve market acceptance.
Additionally, strategic partnerships may increase our reliance on third-parties, which may result in future disruptions if those partnerships are discontinued or the content or level of support provided by strategic partners is diminished.
For example, as of December 31, 2019, 62.9% of our employees were located in emerging market locations.
Additionally, public health epidemics impacting the global economy and our employees, such as COVID-19 that originated in China and has had reverberating effects around the world, particularly in the APAC region, may have a material adverse effect on our business, financial condition or results of operations.
Legal and Regulatory Risks
business and our clients’ businesses.
Uncertainty caused by political change in the U.S., Europe and Asia heightens regulatory uncertainty.
For example, the benchmark industry is subject to regulations in the EU, such as Regulation (EU) 2016/1011 and Regulation (EU) No 600/2014, as well as increased scrutiny and potential new or increased regulation in various other jurisdictions.
The heightened attention and scrutiny on benchmarks and index providers by regulators, policymakers and the media in the EU, the U.S. and other jurisdictions around the world could result
Risks Related to Our Business
As of December 31, 2018, we relied on the data of over 200 suppliers, including large volumes of data from certain stock exchanges around the world.
Many of our data and software suppliers compete with one another and, in some cases, with us.
We also monitor our use of third-party data and software products to comply with applicable licensing requirements.
As the assets of index-linked investment products, including ETFs, mutual funds and institutional accounts, managed by our clients change, they may request to pay us lower asset-based fee percentages, which are sometimes calculated as a percentage of the relevant product’s total expense ratio (“TER”).
The fees providers of index-linked investment products charge their clients are one of the competitive differentiators for these managers with some providers seeking to win or retain business by charging their clients lower fees.
As noted above, in many cases our fees can be affected by an increase or decrease in an investment product’s TER.
Finally, to the extent that an asset manager finds it beneficial to offer clients multiple kinds of index-linked investment products based on the same indexes, a shift away from use of an index as the basis of one type of product may lead to a corresponding shift away from the use of the same index as the basis of another type of product.
If we are required to offer clients materially lower asset-based fee percentages with respect to index-linked investment products that generate fees based on the assets of such products or our largest clients cease to use our indexes, our revenues could be negatively impacted, which could have a material adverse effect on our business, financial condition or results of operations.
Our business may be affected by changes in the capital markets, particularly the equity capital markets, and is dependent on our clients’ continued investment in equity securities as well as the measurement of the performance of their equity investment against equity benchmarks.
A significant portion of our revenues comes from our products that are focused on various aspects of managing or monitoring equity portfolios.
For example, cash inflows into an ETF may be offset by a decline in the performance of the ETF and vice versa.
Asset-based fees accounted for 23.5% and 21.7% of revenues for the fiscal years ended December 31, 2018 and 2017, respectively.
These asset-based fees accounted
for 56.1% and 55.5% of the total revenues from our ten largest clients for the fiscal years ended December 31, 2018 and 2017, respectively.
A move away from equity investing could decrease demand for such products.
Volatile capital markets, which may impact whether investors choose to invest in developed or emerging markets, or in the U.S. or non-U.S. markets, as well as changing investment styles, among other factors, may influence an investor’s decision to invest in and maintain an investment in an index-linked investment product or lead clients to significantly deemphasize equity securities in their investment strategies, which could have a material adverse effect on our business, financial condition or results of operations.
If clients decide to measure performance on an absolute return basis instead of against an equity benchmark, the demand for our equity indexes could decrease.
While we offer products and services to both active and passive investment managers, an economic trend that significantly favors active investment could lead to decreased demand for index-linked investment products or equity based investment strategies, which could decrease our revenues.
If we are unable to offset the impact of decreased revenues associated with our indexes and Analytics products, including by managing our operating costs, our profitability could be materially adversely affected.
See “—Our growth and profitability may not continue at the same rate as we have experienced in the past for several reasons, including if our operating costs are higher than expected, which could have a material adverse effect on our business, financial condition or results of operations” below.
For example, we have in recent years experienced denial-of-service attacks.
While we have and continue to invest in risk management and information security measures, including employee training, disaster recovery and business continuity plans, the total cost of ongoing development and implementation may increase over time given enhanced government and regulatory scrutiny of the measures taken by companies to protect against cybersecurity breaches.
Although we currently estimate that the total cost of ongoing development and implementation of our disaster recovery and business continuity plans will not have a material impact on our business, financial condition or results of operations, we cannot provide any assurance that our estimates regarding the timing and cost of implementing these plans will be accurate.
Any material breaches of cybersecurity or third-party reports of perceived security vulnerability to the Company’s systems, even if no breach has occurred, could cause the Company to suffer reputational harm, loss of
customers and revenue, regulatory actions and scrutiny, litigation or financial losses that are either not insured against or not fully covered through any insurance maintained by the Company.
Such requests may increase our cost of implementation and expose us to additional cybersecurity risks.
If we fail to maintain the adequacy of our internal controls, including any failure to implement required new or improved controls, if we experience difficulties in the implementation of our internal controls, policies or procedures or additional security measures requested by clients, if we experience cyberattacks that lead to a security or data privacy breach or if an employee purposely circumvents or violates our internal controls, policies or procedures, then unauthorized access to, or disclosure or misappropriation of, data could occur.
Additionally, while we believe our internal controls, policies and procedures are currently adequate in protecting the confidentiality of data, breaches of confidentiality may still occur as a result of human error, particularly in connection with a more manual process for processing such data.
Such breaches, unauthorized access, disclosure or misappropriation may result in claims against us by our clients or regulatory inquiry or censure, which could, individually or in the aggregate, damage our brand and reputation and/or have a material adverse effect on our business, financial condition or results of operations.
If a failure of our internal controls, policies or procedures or a cyberattack results in a security or data privacy breach, we could also incur increased operating expenses to remediate the problems caused by the breach and prevent future breaches, which could have a material adverse effect on our business, financial condition or results of operations.
Accordingly, any significant failures, disruptions or instability affecting our information technology platform, electronic delivery systems or the internet
may have a material adverse effect on our financial condition or results of operations and our insurance may not be adequate to compensate us for all losses, failures, or breaches.
We have confidentiality and conflict of interest policies in place regarding index composition decisions and have implemented information barrier procedures to protect the confidentiality of any material, non-public information regarding changes to and the integrity of our equity indexes.
If our confidentiality policies, conflict of interest policies or information barrier procedures fail, our reputation could be damaged and our business, financial condition or results of operations could be materially adversely affected
We change the composition of our indexes from time to time.
We believe that, in some cases, the changes we make to our equity indexes can affect the prices of constituent securities as well as products based on our indexes.
Our index clients rely on us to keep confidential material non-public information about changes to the future composition of an index and to protect against the misuse of that information until the change to the composition of the index is disclosed to clients.
We have confidentiality policies in place and have implemented information barrier procedures to limit access to this information and to prevent the unauthorized disclosure and misuse of information regarding material non-public changes relating to our equity indexes.
These policies are designed to limit dissemination of information not only between MSCI and the rest of the world, but also within MSCI.
An excerpt. Shown here: 40 of 140 rewritten, 40 of 57 added and 40 of 137 removed. The counts are complete. For every sentence, read Item 1A. Risk Factors in the FY2019 filing and the FY2018 filing.
Item 7. Management’s Discussion and Analysis of Financial Condition and Results of Operations
202 rewritten, 147 added, 469 removed, 305 unchanged
Read the full itemFY2019 item · filed February 18, 2020FY2018 item · filed February 22, 2019
The following discussion and analysis of the financial condition and results of our operations [added: for the year ended December 31, 2019] should be read in conjunction with the consolidated financial statements and related notes included elsewhere in this Annual Report on Form 10-K.
We are a leading provider of [removed: mission-critical investment] [added: critical] decision support tools and services [removed: — we power investors to make better decisions about their] [added: for the global] investment [removed: portfolios.][added: community.]
We are [removed: dynamic and] flexible in the delivery of our content and capabilities, [removed: such as our indexes; portfolio construction tools and risk-management services; ESG research and ratings; and real estate benchmarks, return analytics services and market insights;] much of which can be accessed by our clients through multiple channels and platforms.
As of December 31, [removed: 2018,] [added: 2019,] we had offices in [removed: 31] [added: more than 30] cities [removed: in 21] [added: across more than 20] countries to help serve our diverse client base, with [removed: 50.2%] [added: 49.0%] of our revenues coming from clients in the Americas, [removed: 35.4%] [added: 36.0%] in Europe, the Middle East and Africa (“EMEA”) and [removed: 14.4%] [added: 15.0%] in Asia and Australia.
In addition, we focus on operating metrics, including Run Rate, subscription sales and Retention [removed: Rate] [added: Rate,] to manage the business.
As detailed below, we review revenues by type and by segment, or [added: by] major product line.
Approximately two-thirds of the AUM are invested in securities denominated in currencies other than the U.S. dollar, and accordingly, any such impact is excluded from the disclosed foreign [removed: currency adjusted] [added: currency-adjusted] variances.
Recurring subscription revenues represent fees earned from clients primarily under renewable contracts [removed: or agreements] and are [added: generally] recognized [removed: in most cases] ratably over the term of the license or service pursuant to the contract terms.
Non-recurring revenues primarily represent fees earned on products and services where we do not have renewal contracts and primarily include revenues for providing historical data, certain implementation services and other special client [removed: requests.][added: requests, which are generally recognized at a point in time.]
[removed: Effective January 1, 2018, MSCI adopted the new revenue standard as set forth under ASC Subtopic 606-10, “Revenue from Contracts with Customers.”] See Note 1, “Introduction [removed: and] [added: And] Basis [removed: of Presentation—Significant] [added: Of Presentation—*Significant Accounting* *Policies*,” and Note 2, “Recent] Accounting [removed: Policies—Revenue Recognition,”] [added: Standards Updates,”] of the Notes to the Consolidated Financial Statements included herein for [removed: further information on] [added: a listing of] our [removed: revenue recognition policy.][added: accounting policies.]
Costs are assigned to these activity categories based on the nature of the expense or, when not directly attributable, an [removed: estimate is allocated] [added: estimated allocation] based on the type of effort involved.
[removed: Cost] [added: Cost] of [removed: Revenues][added: Revenues]
Cost of revenues [removed: consists] [added: expenses consist] of costs related to the production and servicing of our products and services and primarily includes related information technology costs, including data center, platform and infrastructure costs; costs to acquire, produce and maintain market data information; costs of research to support and maintain existing products; costs of product management teams; costs of client service and consultant teams to support customer needs; as well as other support costs directly attributable to the cost of revenues including certain human resources, finance and legal costs.
Selling and marketing expenses consist of costs associated with acquiring new clients or selling new products or product renewals to existing clients and primarily includes the costs of our sales [removed: force] and marketing teams, as well as costs incurred in other groups associated with acquiring new business, including product management, research, technology and sales operations.
[added: |] Research and [removed: Development][added: development | | | 98,334 | | | | 81,411 | | | | 16,923 | | | | 20.8 | % |]
R&D expenses consist of costs to develop new or enhance existing products and [removed: the] costs to develop new or improved technology and service platforms for the delivery of our products and services and primarily include the costs of development, research, product management, project management and the technology support associated with these efforts.
[added: |] Depreciation and amortization of property, equipment and leasehold improvements [added: | | | 29,999 | | | | 31,346 | | | | (1,347 | ) | | | (4.3 | %) |]
[removed: Other Expense (Income), net][added: Net Income]
[removed: Non-GAAP] [added: Non-GAAP] Financial [removed: Measures][added: Measures]
[added: |] Adjusted EBITDA [added: margin % | | | 72.8 | % | | | 72.8 | % | | | | | | | | |]
“Adjusted [removed: EBITDA,”] [added: EBITDA expenses,”] a [added: non-GAAP] measure used by management to assess operating performance, is defined as [removed: net income before (1) provision for income taxes, (2) other expense (income), net, (3)] [added: operating expenses less] depreciation and amortization of property, equipment and leasehold [removed: improvements, (4)] [added: improvements and] amortization of intangible assets and, at times, [removed: (5)] certain other transactions or [removed: adjustments.][added: adjustments, including the impact related to the vesting of the 2016 Multi-Year PSUs.]
Accordingly, the Company’s computation of the Adjusted EBITDA and Adjusted EBITDA expenses measures may not be comparable to [removed: similarly titled] [added: similarly-titled] measures computed by other companies.
We measure the fees related to these agreements and refer to this as “Run Rate.” See [removed: “—Operating Metrics—Run Rate”] [added: “—*Operating Metrics*—*Run Rate*”] below for additional information on the calculation of this metric.
[removed: Subscription Sales][added: *Subscription Sales*]
See [removed: “—Operating Metrics—Subscription Sales”] [added: “—*Operating Metrics*—*Subscription Sales*”] below for additional information.
[removed: Retention Rate][added: *Retention Rate*]
See [removed: “—Operating Metrics—Retention Rate”] [added: “—*Operating Metrics*—*Retention Rate*”] below for additional information on the calculation of this metric.
On October 12, 2018, we completed the divestiture of InvestorForce and received $62.8 million in cash, [removed: subject to a working capital adjustment,] which resulted in a gain of $46.6 million.
See Note [removed: 9,] [added: 10,] “Shareholders’ Equity (Deficit),” of the Notes to Consolidated Financial Statements included herein for additional information on our stock repurchase program.
The weighted average shares outstanding used to calculate our diluted earnings per share for the year ended December 31, [removed: 2018] [added: 2019] decreased by [removed: 2.4% compared to the year ended December 31, 2017, and by 4.8% for the year ended December 31, 2017] [added: 4.6%] compared to the year ended December 31, [removed: 2016.][added: 2018.]
Senior Notes [removed: and Credit Agreement]
We have [removed: issued] an aggregate of [removed: $2.6 billion] [added: $3,100.0 million] in [removed: Senior Notes] [added: senior unsecured notes (collectively, the “Senior Notes”) consisting of five discrete private placement offerings] and entered into a [removed: $250] [added: $400.0] million Revolving Credit Agreement with a syndicate of banks.
Tax Reform [added: which was enacted on December 22, 2017,] significantly revised the U.S. corporate income tax by, among other things, lowering U.S. corporate income tax rates, implementing a territorial tax system and imposing a one-time tax on deemed repatriation of historic earnings of foreign subsidiaries (the “Toll Charge”).
In the year ended December 31, 2018, the Company finalized the Toll Charge and determined the final impact of Tax [removed: Reform] [added: Reform,] resulting in a net benefit of $11.2 million that included a benefit of $5.7 million on the true-up of the Toll Charge and a benefit of $2.6 million for a reduction in the expected withholding taxes from foreign subsidiaries.
Year Ended December 31, [removed: 2018] [added: 2019] Compared to Year Ended December 31, [removed: 2017][added: 2018]
| | | Years Ended | | | | | | | [removed: | | | | | | | |]
| | | [removed: 2018] [added: 2019] | | | | [removed: 2017] [added: 2018] | | | | Increase/(Decrease) | | | | | | |
| Research and development | | | [removed: 81,411] [added: 98,334] | | | | [removed: 75,849] [added: 81,411] | | | | [removed: 5,562] [added: 16,923] | | | | [removed: 7.3] [added: 20.8] | % |
[removed: |] Amortization of [removed: intangible assets | | | 54,189 | | | | 44,547 | | | | 9,642 | | | | 21.6 | % |][added: Intangible Assets]
| Depreciation and amortization of property, equipment and leasehold improvements | | | [removed: 31,346] [added: 29,999] | | | | [removed: 35,440] [added: 31,346] | | | | [removed: (4,094] [added: (1,347] | ) | | | [removed: (11.6] [added: (4.3] | %) |
The discussion summarizing the significant factors affecting the results of operations and financial condition of MSCI for the year ended December 31, 2018 can be found in Part II, “Item 7.
Management’s Discussion and Analysis of Financial Condition and Results of Operations” of our Annual Report on Form 10-K for the year ended December 31, 2018 (the “2018 Annual Report”), which was filed with the Securities and Exchange Commission on February 22, 2019.
Leveraging our knowledge of the global investment process and our expertise in research, data and technology, our actionable solutions power better investment decisions by enabling our clients to understand and analyze key drivers of risk and return and confidently and efficiently build more effective portfolios.
Investors all over the world use our tools and services to gain insight and improve transparency throughout their investment processes, including to help define their investment universe, inform and analyze their asset allocation and portfolio construction decisions, measure and manage portfolio performance and risk, conduct performance attribution, implement sustainable and other investment strategies, design and issue ETFs and other index-enabled financial products, and facilitate reporting to stakeholders.
Our industry-leading, research-enhanced products and services include indexes; portfolio construction and risk management analytics; ESG research and ratings; and real estate benchmarks, return-analytics and market insights.
Through our integrated franchise we provide solutions across our products and services to support our clients’ dynamic and complex needs.
We are focused on staying at the forefront of investment trends to address the evolving needs of our clients in a changing industry.
In order to most effectively serve our clients, we are committed to driving an integrated solutions-based approach, achieving service excellence, enhancing our differentiated research and content, and delivering flexible, cutting-edge technology and platforms.
Our clients comprise a wide spectrum of the global investment industry and include the following key client types:
| | • | Asset owners (pension funds, endowments, foundations, central banks, sovereign wealth funds, family offices and insurance companies) |
| | • | Asset managers (institutional funds and accounts, mutual funds, hedge funds, ETFs, insurance products, private banks and real estate investment trusts) |
| | • | Financial intermediaries (banks, broker-dealers, exchanges, custodians, trust companies and investment consultants) |
| | • | Wealth managers (including an increasing number of “robo-advisors”) |
“Adjusted EBITDA,” a non-GAAP measure used by management to assess operating performance, is defined as net income before (1) provision for income taxes, (2) other expense (income), net, (3) depreciation and amortization of property, equipment and leasehold improvements, (4) amortization of intangible assets and, at times, (5) certain other transactions or adjustments, including the impact related to the vesting of multi-year restricted stock units granted in 2016 to certain senior executives that are subject to the achievement of multi-year total shareholder return targets, which are performance targets with a market condition (the “2016 Multi-Year PSUs”).
The decrease primarily reflects the impact of share repurchases made prior to March 31, 2019 pursuant to the 2016 and 2018 Repurchase Programs and the vesting of the restricted stock units that were included in the dilutive share count in the prior year.
We have an aggregate $3,100.0 million of Senior Notes outstanding as of December 31, 2019.
| Operating revenues | | $ | 1,557,796 | | | $ | 1,433,984 | | | $ | 123,812 | | | | 8.6 | % |
| Cost of revenues | | | 294,961 | | | | 287,335 | | | | 7,626 | | | | 2.7 | % |
| Selling and marketing | | | 219,298 | | | | 192,923 | | | | 26,375 | | | | 13.7 | % |
| General and administrative | | | 110,093 | | | | 99,882 | | | | 10,211 | | | | 10.2 | % |
| Total operating expenses | | | 802,095 | | | | 747,086 | | | | 55,009 | | | | 7.4 | % |
| Operating income | | | 755,701 | | | | 686,898 | | | | 68,803 | | | | 10.0 | % |
| Other expense (income), net | | | 152,383 | | | | 57,002 | | | | 95,381 | | | | 167.3 | % |
| Net income | | $ | 563,648 | | | $ | 507,885 | | | $ | 55,763 | | | | 11.0 | % |
| Recurring subscriptions | | $ | 1,154,040 | | | $ | 1,066,536 | | | $ | 87,504 | | | | 8.2 | % |
| Asset-based fees | | | 361,927 | | | | 336,565 | | | | 25,362 | | | | 7.5 | % |
| Non-recurring | | | 41,829 | | | | 30,883 | | | | 10,946 | | | | 35.4 | % |
The increase in revenues from futures and options contracts was driven by approximately $5.0 million in additional fees associated with prior periods attributed to a retrospective price increase from a renegotiated contract entered into during the year ended December 31, 2019, as well as the cumulative impact of price and volume increases.
In addition, the increase in revenues from asset-based fees was driven by higher revenues from non-ETF passive products linked to MSCI indexes.
| | | 2018 | | | | | | | | | | | | | | | | 2019 | | | | | | | | | | | | | | |
| | | 2018 | | | | | | | | | | | | | | | | 2019 | | | | | | | | | | | | | | |
| (2) | The values for periods prior to April 26, 2019 were based on data from Bloomberg and MSCI, while the values for periods on or after April 26, 2019 were based on data from Refinitiv and MSCI. De minimis amounts of data are reported on a delayed basis. |
| Recurring subscriptions | | $ | 530,968 | | | $ | 477,612 | | | $ | 53,356 | | | | 11.2 | % |
| Asset-based fees | | | 361,927 | | | | 336,565 | | | | 25,362 | | | | 7.5 | % |
| Non-recurring | | | 28,042 | | | | 21,298 | | | | 6,744 | | | | 31.7 | % |
| Index total | | | 920,937 | | | | 835,475 | | | | 85,462 | | | | 10.2 | % |
| Recurring subscriptions | | | 486,282 | | | | 474,334 | | | | 11,948 | | | | 2.5 | % |
| Non-recurring | | | 10,643 | | | | 5,605 | | | | 5,038 | | | | 89.9 | % |
| Analytics total | | | 496,925 | | | | 479,939 | | | | 16,986 | | | | 3.5 | % |
| Recurring subscriptions | | | 136,790 | | | | 114,590 | | | | 22,200 | | | | 19.4 | % |
| --- | --- |
This discussion contains forward-looking statements that involve risks and uncertainties.
Our actual results could differ materially from those described below.
Such risks and uncertainties include, but are not limited to, those identified below and those described in Part 1, Item 1A.
“Risk Factors,” within this Annual Report on Form 10-K.
Our tools and services help investors better understand the drivers of risk and return and build portfolios to more effectively and efficiently achieve their investment objectives.
We are able to do this by leveraging our knowledge of the global investment process and our expertise in research, data, and technology in order to deliver actionable solutions to our clients.
Our clients comprise a wide spectrum of the global investment industry and include the following key client segments: asset owners (pension funds, endowments, foundations, central banks, sovereign wealth funds, family offices and insurance companies), asset managers (institutional, mutual funds, hedge funds, ETFs, insurance, private wealth, private banks and real estate investment trusts), financial intermediaries (banks, broker-dealers, exchanges, custodians, trust companies and investment consultants) and wealth managers (including an increasing number of “robo-advisors”).
Through a combined use of the content and capabilities provided by each of our operating segments — Index, Analytics, ESG and Real Estate — our clients gain a broad view of the global investment industry, which enables them to manage their investment objectives across multiple asset classes in an increasingly integrated manner.
As of December 31, 2018, we had over 7,000 clients across 90 countries.
To calculate the number of clients, we use the shipping address of the ultimate customer utilizing the product which counts affiliates, user locations, or business units within a single organization as separate clients.
If we aggregate all related clients under their respective parent entity, the number of clients would be over 4,000 as of December 31, 2018.
Our principal business model is generally to license annual, recurring subscriptions for the majority of our Index, Analytics and ESG products and services for a fee due in advance of the service period.
We also license annual recurring subscriptions for the majority of our Real Estate products for a fee which is primarily paid in arrears after the product is delivered, with the exception of the Market Information product for which the fees are generally paid in advance.
Recurring fees may vary based on a number of factors including by product or service, number of users or volume of services.
Our recurring client contracts do not have a financing component and the consideration received is typically not variable.
A portion of our fees are variable and comes from clients who use our indexes as the basis for index-linked investment products, such as ETFs, passively managed funds and separate accounts.
These clients commonly pay us a license fee, typically in arrears, primarily based on the AUM in their investment products and these fees are typically variable.
We also have variable fees from certain exchanges that use our indexes as the basis for futures and options contracts and pay us in arrears, primarily based on the volume of trades or number of instruments.
We also realize one-time fees commonly related to customized reports, historical data sets, certain derivative financial products and certain implementation and consulting services, as well as from particular products and services that are purchased on a non-renewal basis.
See Part 1, Item 1.
“Business—Our Operating Segments” above for additional details on the products and services that we offer.
The contracts state the terms under which these fees are to be calculated.
Operating Expenses
Selling and Marketing
General and Administrative
“Adjusted EBITDA expenses,” a measure used by management to assess operating performance, is defined as operating expenses less depreciation and amortization of property, equipment and leasehold improvements and amortization of intangible assets and, at times, certain other transactions or adjustments.
See Note 1, “Introduction And Basis Of Presentation—Significant Accounting Policies,” and Note 2, “Recent Accounting Standards Updates,” of the Notes to the Consolidated Financial Statements included herein for a listing of our accounting policies.
On August 1, 2016, we completed the divestiture of our Real Estate occupiers business, which was included as a component of the All Other segment through the date of divestiture.
The value of the disposed assets and liabilities and the resulting gain on disposal were not material to the Company.
For the year ended December 31, 2016, the Company repurchased approximately 10.3 million shares at an average price of $73.71 per share for a total value of $759.4 million pursuant to open market repurchases.
For the year ended December 31, 2017, the Company repurchased approximately 1.6 million shares at an average price of $87.96 per share for a total value of $136.9 million pursuant to open market repurchases.
For the year ended December 31, 2018, the Company repurchased approximately 6.2 million shares at an average price of $148.34 per share for a total value of $925.0 million pursuant to open market repurchases.
The decreases in both periods primarily reflect the impact of share repurchases made pursuant to the 2016 and 2018 Repurchase Programs, partially offset by the impact of higher dilution, primarily caused by restricted stock units for which the ultimate payout is tied to the achievement of multi-year total shareholder return targets.
On December 22, 2017, the U.S. government enacted comprehensive tax legislation commonly referred to as the Tax Cuts and Jobs Act (“Tax Reform”).
In the year ended December 31, 2017, as part of Tax Reform, the Company recorded a provisional net charge to the provision for income taxes of $34.5 million for the year ended December 31, 2017.
The net charge of $34.5 million primarily included an estimated tax charge of approximately $47.5 million related to the Toll Charge and an estimated tax charge of approximately $16.0 million related to a change in assertion that profits were permanently reinvested overseas as of December 31, 2017, partially offset by an estimated tax benefit of approximately $29.0 million related to the revaluation of deferred taxes at the now-lower statutory corporate rate.
The cumulative net charge of Tax Reform was $23.3 million.
Basis of Presentation
Certain prior period amounts have been reclassified to conform to the current period presentation.
An excerpt. Shown here: 40 of 202 rewritten, 40 of 147 added and 40 of 469 removed. The counts are complete. For every sentence, read Item 7. Management’s Discussion and Analysis of Financial Condition and Results of Operations in the FY2019 filing and the FY2018 filing.
Item 7A. Quantitative and Qualitative Disclosures About Market Risk
6 rewritten, 1 added, 1 removed, 12 unchanged
Read the full itemFY2019 item · filed February 18, 2020FY2018 item · filed February 22, 2019
For the years ended December 31, [removed: 2018] [added: 2019] and [removed: 2017, 12.9%] [added: 2018, 13.5%] and [removed: 13.4%,] [added: 12.9%,] respectively, of our revenues are subject to foreign currency exchange rate risk and primarily includes clients billed in foreign currency as well as U.S. dollar exposures on non-U.S. dollar foreign operating entities.
Of the [removed: 13.4%] [added: 13.5%] of non-U.S dollar exposure for the year ended December 31, [removed: 2017, 39.6%] [added: 2019, 40.8%] was in Euros, [removed: 27.3%] [added: 26.9%] was in Japanese yen and [removed: 26.8%] [added: 23.1%] was in British pounds sterling.
Revenues from index-linked investment products represented [removed: 23.5%] [added: 23.2%] and [removed: 21.7%] [added: 23.5%] of operating revenues for the years ended December 31, [removed: 2018] [added: 2019] and [removed: 2017,] [added: 2018,] respectively.
[added: While a substantial portion of our fees for index-linked] investment products are invoiced in U.S. dollars, the fees are based on the investment product’s assets, of which two-thirds are invested in securities denominated in currencies other than the U.S. dollar.
Approximately [removed: 40.4%] [added: 41.2%] and [removed: 36.9%] [added: 40.4%] of our operating expenses for the years ended December 31, [removed: 2018] [added: 2019] and [removed: 2017,] [added: 2018,] respectively, were denominated in foreign currencies, the significant majority of which were denominated in British pounds sterling, Indian rupees, Hungarian forints, Euros, Hong Kong dollars, Swiss francs and Mexican pesos.
We recognized total foreign currency exchange losses of [removed: $0.4 million, $2.2] [added: $4.0] million [added: for the year ended December 31, 2019] and [removed: $0.2] [added: foreign currency exchange gains of $0.4] million for the [removed: years] [added: year] ended December 31, [removed: 2018, 2017 and 2016, respectively.][added: 2018.]
| --- | --- |
While a substantial portion of our fees for index-linked
Item 1. Business
74 rewritten, 89 added, 146 removed, 121 unchanged
Read the full itemFY2019 item · filed February 18, 2020FY2018 item · filed February 22, 2019
[removed: We are dynamic and flexible in the delivery of our content] [added: Our industry-leading, research-enhanced products] and [removed: capabilities, such as our] [added: services include] indexes; portfolio construction [removed: tools] and [removed: risk-management services;] [added: risk management analytics;] environmental, social and governance (“ESG”) research and ratings; and real estate benchmarks, [removed: return analytics services] [added: return-analytics] and market [removed: insights; much of which can be accessed by our clients through multiple channels and platforms.][added: insights.]
| | [removed: (3)] [added: •] | Growing use of advanced technologies to enhance investment analytics and streamline [removed: operations;] [added: operations] |
| | [removed: (5)] [added: •] | Increasing integration of ESG considerations into investment processes and [removed: products.] [added: products as sustainable investing goes mainstream] |
| 1 | The term “solutions” as used throughout this Annual Report on Form 10-K refers to the [removed: usage] [added: use] of our products [removed: and/or] [added: or] services by our clients to help them achieve their [removed: specific investment] objectives. |
We [added: believe we] are uniquely positioned to benefit from [removed: these] [added: emerging] trends and to help our clients adapt to [removed: the changing] [added: a large and rapidly expanding and evolving investment] industry.
We [removed: remain keenly] [added: are] focused on staying at the forefront of investment trends to address the evolving needs of our clients in a changing industry.
In order to most effectively serve our [removed: clients and remain differentiated from competition,] [added: clients,] we [removed: remain] [added: are] committed to driving [removed: a] [added: an integrated] solutions-based approach, achieving service excellence, enhancing our differentiated research and [removed: content] [added: content,] and delivering flexible, cutting-edge technology and platforms.
[removed: Clients][added: Clients]
Our clients comprise a wide spectrum of the global investment industry and include the following key client [removed: segments:][added: types:]
| | [removed: (1)] [added: •] | [removed: asset] [added: Asset] owners (pension funds, endowments, foundations, central banks, sovereign wealth funds, family offices and insurance [removed: companies);] [added: companies)] |
| | [removed: (2)] [added: •] | [removed: asset] [added: Asset] managers [removed: (institutional,] [added: (institutional funds and accounts,] mutual funds, hedge funds, ETFs, [removed: insurance, private wealth,] [added: insurance products,] private banks and real estate investment [removed: trusts);] [added: trusts)] |
| | [removed: (3)] [added: •] | [removed: financial] [added: Financial] intermediaries (banks, broker-dealers, exchanges, custodians, trust companies and investment [removed: consultants); and] [added: consultants)] |
| | [removed: (4)] [added: •] | [removed: wealth] [added: Wealth] managers (including an increasing number of [removed: “robo-advisors”).] [added: “robo-advisors”)] |
For the [removed: fiscal] year ended December 31, [removed: 2018,] [added: 2019,] our largest client organization by revenue, BlackRock, accounted for [removed: 11.9%] [added: 11.5%] of our total [removed: revenues.][added: revenues, with 94.5% of the revenue from BlackRock coming from fees based on the assets in BlackRock’s ETFs that are based on our indexes.]
[removed: Growth] Strategy
| | • | [removed: Expand leadership in] [added: *Differentiated] research-enhanced [removed: content. Our research-driven content plays a key role in our ability] [added: content*, which is integral] to [removed: help our] [added: the solutions we provide to] clients [removed: develop relevant, global and sustainable investment strategies in an efficient manner.] [added: to help them adapt to a fast-changing marketplace.] We are continually developing a wide range of differentiated content and have amassed an extensive database of historical global market data, proprietary equity index data, factor models, private real estate [added: assets] benchmark data, risk algorithms and ESG data, all of which are critical components of our clients’ investment processes. [added: This content is grounded in our deep knowledge of the global investment process and fueled by experienced research and product development and data management teams. We consult with clients and other market participants to discuss their needs, investment trends and implications for our business.] |
| 2 | To calculate the number of clients, we use the shipping address of the ultimate customer utilizing the product which counts affiliates, user locations, or business units within a single organization as separate clients. If we aggregate all related clients under their respective parent entity, the number of clients would be [removed: approximately 4,000] [added: over 4,200] as of December 31, [removed: 2018.] [added: 2019.] |
Our product management, research and product development, data operations and [removed: technology] [added: technology,] and application development departments are at the center of this process.
Our content is developed by a research and product development team [removed: (“research team”)] comprised of mathematicians, economists, statisticians, financial engineers and investment industry experts.
Through our relationships with the world’s largest investment institutions, we monitor investment trends and their drivers globally and support instrument valuation, risk modeling, portfolio construction, portfolio attribution, asset allocation and [removed: Value at Risk (“VaR”)] [added: VaR] simulation.
An important way we monitor global investment trends and their implications for our business is through direct public consultations and client advisory panels and through the forum provided by our [removed: Editorial] Advisory [removed: Board (“EAB”).][added: Council.]
Our [removed: EAB] [added: Advisory Council] meets twice a year to discuss [removed: industry] [added: current] and emerging [added: investment industry] trends and is comprised of senior investment professionals from around the world and senior members of our research [added: and product development] team.
| | [removed: 3)] [added: •] | [removed: incorporate] [added: *Enhance] data [added: processing* by incorporating data] science and [removed: robotic technology] [added: machine learning] into our data collection processes to enable us to [added: efficiently] build scale [added: and facilitate faster product releases] while also maintaining the highest quality [removed: standards;] [added: standards.] |
| | • | [removed: Execute] [added: *Execute] strategic relationships and acquisitions with complementary content and technology [removed: companies.] [added: companies.*] We regularly evaluate and selectively pursue strategic relationships with, and acquisitions of, providers of unique and differentiated content, products and technologies that we believe have the potential to complement, enhance or expand our offerings and client [removed: base, as well as improve our ability to provide mission critical content, applications and services to enhance the investment decision processes of investment institutions, and the intermediaries that serve such institutions.] [added: base.] In order to drive value, we target acquisitions and strategic relationships that can be efficiently integrated into our existing operational structure and global sales network. [added: In 2019, we completed the acquisition of Carbon Delta AG, an environmental fintech and data analytics company. This acquisition enhanced our existing ESG offerings] |
As the investment industry becomes more global and investors become increasingly focused on [removed: multi-asset class] [added: multi-asset-class] portfolios, we [added: believe we] are well positioned to help our clients achieve their investment objectives by [removed: delivering] [added: powering] a more comprehensive analysis of their investment strategies using the content, applications and services across our four [added: operating segments — Index, Analytics, ESG and Real Estate.]
[removed: Because] [added: For reporting purposes,] the ESG and Real Estate operating segments [removed: do not meet segment disclosure reporting thresholds, ESG and Real Estate] are combined and presented as All Other [added: as they do not meet the thresholds] for [removed: reporting purposes.][added: separate presentation.]
A portion of our fees [removed: also come] [added: comes] from clients who use our indexes as the basis for index-linked investment products.
Such fees are primarily based on [added: a client’s] assets under management [removed: (“AUM”).][added: (“AUM”) and trading volumes.]
“Management’s Discussion and Analysis of Financial Condition and Results of Operations—Overview” and Note 1, “Introduction and Basis of [removed: Presentation—Significant Accounting Policies—Revenue Recognition,”] [added: Presentation—*Significant Accounting* *Policies*—*Revenue Recognition*,”] of the Notes to the Consolidated Financial Statements included herein for further information on how we generate revenue and our revenue recognition policy.
Clients use our indexes in many areas of the investment process, including index-linked product creation [added: (*e.g.*, ETFs] and [added: futures and options),] performance benchmarking, [removed: as well as] portfolio construction and rebalancing, [added: broker-dealer structured products] and asset allocation.
We currently calculate more than [removed: 215,5003] [added: 226,0003] end-of-day indexes daily and more than [removed: 11,500] [added: 12,000] indexes in real time for a variety of markets and industries.
Clients receive [added: index] data directly from us or from third-party [removed: providers of financial information] [added: vendors] worldwide.
| | • | [removed: MSCI Global Equity Indexes. MSCI] [added: *MSCI] Global Equity [removed: Indexes] [added: Indexes*] are designed to measure returns across a wide variety of equity [removed: markets (e.g., World, EAFE, Emerging Markets, USA, Europe, Japan),] [added: markets,] size [removed: segments (e.g., Large, Mid and Small capitalization),] [added: segments,] sectors [removed: (e.g., Utilities, Financials)] and [removed: industries (e.g., Banks, Media).] [added: industries.] As of December 31, [removed: 2018,] [added: 2019,] we calculated indexes that covered more than [removed: 80] [added: 85] countries in developed, emerging, frontier and standalone markets, as well as various regional indexes built from the component [removed: country] indexes. [removed: These indexes include the MSCI ACWI IMI, MSCI World, MSCI EAFE, MSCI Emerging Markets and MSCI USA Indexes. We believe that MSCI Global Equity Indexes are the most widely used benchmarks by cross-border equity investors. A large number of asset owners use the MSCI ACWI IMI Indexes or their component parts as the asset allocation benchmark for their equity portfolios.] |
| 3 | The number of indexes [removed: takes into consideration different currency and] [added: includes] return versions (e.g., price, net and gross [removed: returns).] [added: returns) but does not include different currency versions.] |
Our Analytics segment offers risk management, performance attribution and portfolio management content, applications and services that provide clients with an integrated view of risk and return and an analysis of market, credit, liquidity and counterparty risk across all major asset classes, spanning [removed: short, medium] [added: short-medium-] and long-term time horizons.
The content we create in our Analytics segment includes models to support factor-based analytics [removed: (equity,] [added: (*e.g.*, Barra equity models and] fixed income and [removed: multi-asset class] [added: multi-asset-class (“MAC”)] models), pricing models, time series-based analytics, [added: stress testing and liquidity risk analytics,] as well as underlying content that is used as inputs to these models such as interest rate and credit curves.
Our clients access our Analytics content through our [removed: own] proprietary applications and [removed: application] [added: APIs (application] programming [removed: interfaces, or through] [added: interfaces),] third-party applications or directly [removed: on] [added: through] their own platforms.
[removed: MSCI] [added: MSCI’s] Analytics applications provide clients with integrated market data and constituent-level indexes aggregated from multiple third-party and proprietary sources.
This integrated market and benchmark data significantly reduces the operational burden on clients for both the implementation and [removed: on-going] [added: ongoing] operation of our Analytics products.
| | • | [removed: RiskMetrics RiskManager.] [added: *RiskMetrics RiskManager*.] We believe that RiskMetrics RiskManager is an industry leader in [removed: VaR] [added: value at risk (“VaR”)] simulation and in stress testing. Clients use RiskManager for daily analysis, measuring and monitoring of market and liquidity risk at fund and firm levels, sensitivity and stress testing, interactive what-if analysis, counterparty credit exposure and regulatory risk reporting. [removed: RiskManager is a scalable platform accessed by clients via a license to a secure, interactive web-based application service. RiskManager is also offered as an outsourced risk reporting service.] |
Mission
MSCI’s mission is to enable investors to build better portfolios for a better world.
We are a leading provider of critical decision support tools and services for the global investment community.
Leveraging our knowledge of the global investment process and our expertise in research, data and technology, our actionable solutions1 power better investment decisions by enabling our clients to understand and analyze key drivers of risk and return and confidently and efficiently build more effective portfolios.
Investors all over the world use our tools and services to gain insight and improve transparency throughout their investment processes, including to help define their investment universe, inform and analyze their asset allocation and portfolio construction decisions, measure and manage portfolio performance and risk, conduct performance attribution, implement sustainable and other investment strategies, design and issue exchange traded funds (“ETFs”) and other index-enabled financial products, and facilitate reporting to stakeholders.
Through our integrated franchise we provide solutions across our products and services to support our clients’ dynamic and complex needs.
We are flexible in the delivery of our content and capabilities, much of which can be accessed by our clients through multiple channels and platforms.
As of December 31, 2019, we served over 7,500 clients2 in more than 85 countries.
Industry Trends and Competitive Advantages
Investing has grown in complexity, with more choices across asset classes, security types and geographies.
Investors are increasingly looking outside their home countries, and the access to and diversity of investment choices are growing.
As a result, the investment process is transforming, reflected in a number of significant changes, including:
| | • | Changing client operating models and business strategies, including an increased focus on ESG, factors and private asset investments, driven in part by fee compression, changing demographics and economics |
| | • | Increasing focus on global and multi-asset class investing as investors seek outcome-oriented results |
| | • | Continuing growth of index-based investing and assets in ETFs and other vehicles that seek to replicate an index as investors increasingly seek lower-cost investment strategies |
We believe the following competitive advantages position us well to meet client demands in light of these trends:
| | • | *Strong client relationships* supported by a client coverage team with significant experience in the industry. This team builds and maintains strong and trusted client relationships with senior executives and investment professionals at the world’s largest investment institutions. We believe that these relationships and our global operating footprint are competitive advantages that enable us to tailor our coverage initiatives to better serve our clients in the markets in which they operate. |
| | • | *Flexible, scalable, cutting-edge technology* that is developed and enhanced by a global team of sophisticated technology and data professionals. Our technology enables clients to use content created by MSCI, themselves and third parties in an efficient manner and thereby helps them be more cost-effective in their own operations. Our technology allows us to continually improve our overall products and services by more efficiently processing data for distribution and ensuring advanced platform flexibility that provides for easy integration of our solutions into clients’ workflows. We continue to attract experienced talent within our technology team by hiring employees who will help us accelerate the pace of innovation, expand our program management capabilities and enhance the technology driving our content creation. |
We provide the tools and solutions that enable investors to take advantage of the transformation taking place in the investment industry, helping them better understand performance and risk, become more effective and efficient at building portfolios and achieve their investment objectives.
In particular, we are focused on delivering actionable and integrated client solutions with the following key initiatives:
| | • | *Expand leadership in research-enhanced content across asset classes.* We continue to deliver solutions that incorporate multiple areas of content and are supported by rich insights from our research and product development team. In addition to continuing to enhance our position as a leader with respect to tools and services for equity investors globally, our strategic priorities with respect to content are global equities, ESG, factors, fixed income and private assets, all of which represent significant growth opportunities. We have invested in expanding performance and risk capabilities and content across asset classes, which will allow us to provide more tools to our clients that help them pursue and achieve their investment objectives. |
| | • | *Improve distribution and content-enabling technology.* We have and will continue to invest in the development and use of advanced technology to drive integration and efficiencies, accelerate innovation and enhance the client experience. In addition, we increasingly employ proprietary and third-party machine learning and artificial intelligence to enhance our ability to gather and analyze data and automate and enhance the efficiency of many of our data processes. See Part I, Item 1. “Business—Technology” below for additional information. |
| | • | *Strengthen existing client relationships and grow by developing new ones.* In support of our solutions-driven strategy, we continue to grow our existing offerings by cultivating and expanding relationships across our client base and serving the needs of different client types across multiple asset classes. We remain focused on building the strength and knowledge of our client coverage team to enable them to educate our clients on the full breadth of our content and capabilities and how using complementary tools can help clients analyze performance and risk across asset classes and geographies. We continue to prioritize relationships with key growth client groups such as private assets, wealth and listed derivatives, and in fast-growing regions, such as Asia. In 2019, we made a significant key senior hire in Asia and transitioned other senior management in the region, which we believe will help expand our presence in the market. We also entered into agreements with key strategic clients who are creating exchange-listed and index-based futures and options based on our indexes to help industry participants manage investment risk. |
| | | with expert climate change scenario analysis and allowed us to expand our climate risk assessment and reporting offerings. |
Financial Model
We have an attractive financial model due to our recurring revenue and strong cash generation.
Clients purchase our products and services primarily through recurring fixed and variable fee arrangements, a business model which has historically delivered stable revenue and predictable cash flows.
Finally, our disciplined capital-allocation policy provides us with flexibility to balance internal resources and investment needs, acquisitions and shareholder returns through dividends and opportunistic share repurchases.
Our business model is susceptible to market movements that affect our AUM revenue, which generally have more influence on our revenues than seasonality.
Our indexes include:
| | • | *Factor Indexes* are created using the Barra Equity Models from our Analytics segment to address a growing trend among institutional investors and asset managers to target systematic style factors, such as volatility, size and momentum. |
| | • | *ESG Indexes* are constructed using data from our ESG segment to meet the growing demand for indexes that integrate ESG criteria to facilitate sustainable investing strategies. |
| | • | *Custom Indexes* are calculated by applying a client’s criteria such as stock exclusions, currency hedging, tax rates or special weighting to an existing MSCI index. |
| | • | *Thematic Indexes* are designed to measure the performance of specific social, economic, industrial, environmental or demographic investment strategies. |
| | • | *Private Real Assets Indexes* provide transparency and insight to private real estate investment strategies. |
In 2019, we launched the following indexes:
| | • | *Climate Change Indexes* designed to enable investors to holistically integrate climate risk considerations into their investment processes. The indexes are based on other MSCI indexes (e.g., the MSCI ACWI index) and reweights the securities based on a transition to a lower carbon economy, while seeking to minimize exclusions from the parent index. |
| | • | *Adaptive Multiple-Factor Indexes* designed to reflect a strategy that adapts multi-factor allocations to changing market environments based on four pillars: macro cycle, momentum, valuation and market sentiment. |
| | • | *Megatrend Indexes* designed to systematically identify companies based on the linkage of their business lines with the trend or theme being modeled. For example, the MSCI ACWI IMI Digital Economy Index tracks companies that derive significant revenues from the digital economy value chain, including digital payments and robotics, and the MSCI ACWI IMI Disruptive Technologies Index tracks “disruptive technology” companies that are broadly classified under the subthemes of 3D printing, the Internet of Things, cloud computing, fintech, digital payments, healthcare innovations, robotics, cybersecurity, clean energy and smart grids. |
| | • | *Fixed Income Indexes* designed to reflect the investment opportunity set of US Dollar-denominated investment grade corporate bonds. The issuance-weighted constituents meet certain issuance minimums and certain other criteria in the fixed income sector. The *USD Investment Grade Corporate Bond Factor Fixed Income Indexes* are constructed using constituent weights that reflect systematic style factor exposures such as carry, value, size and low risk. The *USD Investment Grade Corporate Bond ESG Fixed Income Indexes* are constructed using data from our ESG segment and expand existing ESG methodologies in equities such as ESG Leaders and ESG Universal to the Fixed Income USD investment grade corporate sector, enabling clients to construct multi-asset-class portfolios with a consistent ESG approach. |
MSCI is a leading provider of mission critical investment decision support tools and services — we power investors to make better decisions about their investment portfolios.
Our tools and services help investors better understand the drivers of risk and return and build portfolios to more effectively and efficiently achieve their investment objectives.
We are able to do this by leveraging our knowledge of the global investment process and our expertise in research, data, and technology in order to deliver actionable solutions1 to our clients.
Professionally managed investment assets generally continue to grow at a rapid pace as global economies and markets continue to evolve, and both individuals and sovereign entities are increasing their savings.
In addition to this growth, the investment industry continues to transform, as evidenced by a number of notable trends, including:
| | (1) | Transformation of clients’ operating models and business strategies, including an increased focus on factor and indexed investments, to address the changing competitive landscape characterized by an intense focus by investors on the drivers of risk and return, manager fee compression and industry consolidation; |
| --- | --- | --- |
| | (2) | Continuing growth of index-based investing and assets linked to exchange traded funds (“ETFs”); |
| --- | --- | --- |
| --- | --- | --- |
| | (4) | Increasing outsourcing of non-core functions and vendor/supply chain consolidation; and |
| --- | --- | --- |
| --- | --- | --- |
Our clients rely on us to provide consistent, scalable and integrated solutions across their entire investment process, driving more informed investment decisions and increased operational efficiency.
These solutions increasingly involve multiple areas of content or services and may also be supported by insights from our research team to help our clients understand how our tools can be utilized alone or in combination.
The differentiated research insights and content embedded in our innovative tools are central to the MSCI franchise.
Through the content developed in each of our operating segments — Index, Analytics, ESG and Real Estate — our clients gain a broad view of the global investment industry, which enables them to manage their investment objectives across multiple asset classes in an increasingly integrated manner.
Our clients use the offerings from each of our operating segments to achieve a wide range of objectives:
| | • | Index and Analytics help investors define investment universes, measure performance, analyze returns, set asset allocations, construct portfolios, conduct portfolio attribution and manage risk. Additionally, our indexes serve as a basis for index-linked investment products such as ETFs; |
| --- | --- | --- |
| | • | ESG’s research and ratings provide unique insights that help investors identify and measure ESG risks and opportunities; and |
| --- | --- | --- |
| | • | Real Estate offers data-driven analytics and research of global and individual property markets as well as benchmarks for performance measurement. |
| --- | --- | --- |
As a client-centric company, we offer innovative solutions to help our clients adapt to a fast-changing marketplace.
As the needs of our clients change, so do our offerings.
| --- | --- | --- |
| --- | --- | --- |
| --- | --- | --- |
| --- | --- | --- |
The clients described above have unique investment objectives and turn to us for an integrated set of tools that help them effectively and efficiently achieve these objectives.
For example:
| | (1) | Asset owners and, increasingly, wealth managers, are seeking to better understand the drivers of risk and return as well as the value provided by active managers (versus their passive counterparts). Additionally, they are seeking tools for model portfolio creation and to gain a complete and detailed picture of their entire portfolio. These investors include those with long time horizons who are turning to private assets, such as real estate, private equity and hedge funds, as they seek uncorrelated and above-market returns. |
| --- | --- | --- |
| | (2) | Active asset managers must enhance and explain their investment processes and strategies, and find ways to differentiate themselves from their competitors in order to attract assets and justify their fees. |
| --- | --- | --- |
| | (3) | Asset managers are increasingly developing index-based products, such as ETFs, to more efficiently implement their investment strategies and continue to attract assets. |
| --- | --- | --- |
| | (4) | Financial intermediaries, such as exchanges and broker dealers, are creating exchange-listed and over-the-counter index-based products such as futures, options, swaps and structured products to help industry participants manage investment risk and efficiently achieve their investment objectives. |
| --- | --- | --- |
An excerpt. Shown here: 40 of 74 rewritten, 40 of 89 added and 40 of 146 removed. The counts are complete. For every sentence, read Item 1. Business in the FY2019 filing and the FY2018 filing.
Cover and table of contents
31 rewritten, 2 added, 3 removed, 66 unchanged
Read the full itemFY2019 item · filed February 18, 2020FY2018 item · filed February 22, 2019
☒ [removed: ANNUAL] [added: ANNUAL] REPORT PURSUANT TO SECTION 13 OR [removed: 15(d)][added: 15(d)]
For the fiscal year ended December 31, [removed: 2018][added: 2019]
☐ [removed: TRANSITION] [added: TRANSITION] REPORT PURSUANT TO SECTION 13 OR [removed: 15(d)][added: 15(d)]
[removed: MSCI INC.][added: MSCI INC.]
| Title of [removed: Each Class] [added: each class] | | [added: Trading Symbol(s) | |] Name of [removed: Each Exchange] [added: each exchange] on [removed: Which Registered] [added: which registered] |
| Common stock, par value $0.01 per share | | [added: MSCI | |] New York Stock Exchange |
| [removed: Emerging growth company] | | [removed: ☐] | | [added: Emerging growth company] | | [added: ☐] |
The aggregate market value of Common Stock held by non-affiliates of the registrant as of the last business day of the registrant’s most recently completed second fiscal quarter (based on the closing price of these securities as reported by The New York Stock Exchange on June 30, [removed: 2018)] [added: 2019)] was [removed: $14,368,769,114.][added: $19,627,001,148.]
As of February [removed: 15, 2019,] [added: 11, 2020,] there were [removed: 84,323,295] [added: 84,808,104] shares of the registrant’s Common Stock, par value $0.01 per share, outstanding.
Documents incorporated by reference: Portions of the registrant’s proxy statement for its annual meeting of stockholders, to be held on April [removed: 25, 2019,] [added: 28, 2020,] are incorporated herein by reference into Part III of this Form 10-K.
FOR THE YEAR ENDED DECEMBER 31, [removed: 2018][added: 2019]
| Item 1A. | | [Risk Factors](#ITEM_1A_RISK_FACTORS) | | [removed: 14] [added: 12] |
| Item 1B. | | [Unresolved Staff Comments](#ITEM_1B_UNRESOLVED_STAFF_COMMENTS) | | [removed: 32] [added: 26] |
| Item 2. | | [Properties](#ITEM_2_PROPERTIES) | | [removed: 33] [added: 26] |
| Item 3. | | [Legal Proceedings](#ITEM_3_LEGAL_PROCEEDINGS) | | [removed: 33] [added: 26] |
| Item 4. | | [Mine Safety Disclosures](#ITEM_4_MINE_SAFETY_DISCLOSURES) | | [removed: 33] [added: 26] |
| Item 5. | | [Market for Registrant’s Common Equity, Related Stockholder Matters and Issuer Purchases of Equity Securities](#ITEM_5_MARKET_FOR_REGISTRANTS_COMMON_EQU) | | [removed: 34] [added: 27] |
| Item 6. | | [Selected Financial Data](#ITEM_6_SELECTED_FINANCIAL_DATA) | | [removed: 37] [added: 31] |
| Item 7. | | [Management’s Discussion and Analysis of Financial Condition and Results of Operations](#ITEM_7_MANAGEMENTS_DISCUSSION_ANALYSIS_F) | | [removed: 40] [added: 33] |
| Item 7A. | | [Quantitative and Qualitative Disclosures About Market [removed: Risk](#ITEM_7A_QUALITATIVE_QUANTITATIVE_DISCLOS)] [added: Risk](#ITEM_7A_QUANTITATIVE_QUALITATIVE_DISCLOS)] | | [removed: 71] [added: 55] |
| Item 8. | | [Financial Statements and Supplementary Data](#ITEM_8_FINANCIAL_STATEMENTS_SUPPLEMENTAR) | | [removed: 72] [added: 55] |
| Item 9. | | [Changes in and Disagreements With Accountants on Accounting and Financial Disclosure](#ITEM_9_CHANGES_IN_DISAGREEMENTS_WITH_ACC) | | [removed: 72] [added: 55] |
| Item 9A. | | [Controls and Procedures](#ITEM_9A_CONTROLS_PROCEDURES) | | [removed: 72] [added: 56] |
| Item 9B. | | [Other Information](#ITEM_9B_OR_INFORMATION) | | [removed: 73] [added: 56] |
| Item 10. | | [Directors, Executive Officers and Corporate Governance](#ITEM_10_DIRECTORS_EXECUTIVE_FICERS_CORPO) | | [removed: 74] [added: 57] |
| Item 11. | | [Executive Compensation](#ITEM_11_EXECUTIVE_COMPENSATION) | | [removed: 74] [added: 57] |
| Item 12. | | [Security Ownership of Certain Beneficial Owners and Management and Related Stockholder Matters](#ITEM_12_SECURITY_OWNERSHIP_CERTAIN_BENEF) | | [removed: 74] [added: 57] |
| Item 13. | | [Certain Relationships and Related Transactions, and Director Independence](#ITEM_13_CERTAIN_RELATIONSHIPS_RELATED_TR) | | [removed: 74] [added: 57] |
| Item 14. | | [Principal Accounting Fees and Services](#ITEM_14_PRINCIPAL_ACCOUNTING_FEES_SERVIC) | | [removed: 74] [added: 57] |
| Item 15. | | [Exhibits, Financial Statement Schedules](#ITEM_15_EXHIBITS_FINANCIAL_STATEMENT_SCH) | | [removed: 75] [added: 58] |
| Item 16. | | [Form 10-K Summary](#ITEM_16_FORM_10K_SUMMARY) | | [removed: 93] [added: 74] |
f-
| --- | --- | --- | --- | --- |
10-K 1 msci-10k_20181231.htm 10-K
| --- | --- | --- |
Indicate by check mark if disclosure of delinquent filers pursuant to Item 405 of Regulation S-K (§229.405 of this chapter) is not contained herein, and will not be contained, to the best of registrant’s knowledge, in definitive proxy or information statements incorporated by reference in Part III of this Form 10-K or any amendment to this Form 10-K.
Item 2. Properties
12 rewritten, 2 added, 6 removed, 3 unchanged
Read the full itemFY2019 item · filed February 18, 2020FY2018 item · filed February 22, 2019
As of December 31, [removed: 2018,] [added: 2019,] our principal offices consisted of the following leased properties:
| Location | | Square Feet | | | | [removed: Offices | | | |] Expiration Date |
| Mumbai, India | | | 126,286 | | | [removed: | 1 | | |] August 31, 2023 |
| New York, New York | | | 125,811 | | | [removed: | 1 | | |] February 28, 2033 |
| Budapest, Hungary | | | [removed: 49,318 | | | | 1] [added: 70,833] | | | February [removed: 29, 2024] [added: 28, 2029] |
| Monterrey, Mexico | | | 46,569 | | | [removed: | 1 | | |] October 31, 2028 |
| Berkeley, California | | | 34,178 | | | [removed: | 1 | | |] February 28, 2030 |
| London, England | | | 30,519 | | | [removed: | 1 | | |] December 25, 2026 |
| Manila, Philippines | | | [removed: 25,750 | | | | 1] [added: 31,543] | | | February [removed: 29, 2024] [added: 28, 2027] |
| Norman, Oklahoma | | | 23,664 | | | [removed: | 1 | | |] May 31, 2024 |
| Boston, Massachusetts | | | 13,506 | | | [removed: | 1 | | |] November 30, 2021 |
[removed: As of December 31, 2018, we] [added: We] also [removed: leased and occupied offices in] [added: have additional office locations, including but not limited to,] the following [added: leased] locations (in descending order of square footage): [added: Chicago, Illinois; Geneva, Switzerland;] San Francisco, California; Beijing, China; Frankfurt, Germany; Shanghai, China; Hong Kong, China; Paris, France; Tokyo, Japan; [removed: Ann Arbor, Michigan;] Portland, Maine; Sydney, Australia; Toronto, Canada; [removed: Singapore; Seoul, Korea; Milan, Italy; Gaithersburg, Maryland; Cape Town, South Africa; Stockholm, Sweden; Sao Paolo, Brazil; Dubai, United Arab Emirates; Barcelona, Spain;] and [removed: Taipei, Taiwan.][added: Singapore.]
| --- | --- | --- | --- | --- | --- | --- |
As of December 31, 2019, we have more than 30 leased and occupied locations of which the principal offices are listed above.
Our corporate headquarters is located in New York, New York.
This is also our largest sales office and one of our main research centers.
| | | | | | | Number of | | | | |
| --- | --- | --- | --- | --- | --- | --- | --- | --- | --- | --- |
| Chicago, Illinois | | | 8,859 | | | | 1 | | | August 31, 2025 |
| Geneva, Switzerland | | | 8,826 | | | | 1 | | | August 31, 2028 |
Item 5. Market for Registrant’s Common Equity, Related Stockholder Matters and Issuer Purchases of Equity Securities
17 rewritten, 18 added, 24 removed, 40 unchanged
Read the full itemFY2019 item · filed February 18, 2020FY2018 item · filed February 22, 2019
Our common stock has traded on the New York Stock Exchange since November 15, 2007 and trades under the symbol “MSCI.” As of February [removed: 15, 2019,] [added: 11, 2020,] there were [removed: 121] [added: 118] shareholders of record of our common stock.
Despite the changes implemented by Tax Reform, the Company will continue to maintain the Performance Plan and may make awards pursuant to [removed: this plan.][added: it.]
Pursuant to the Omnibus Plan, the Company reserved 7,565,483 shares of common stock for issuance; plus any additional shares which become available due to forfeiture, expiration or cancellation of outstanding awards, [added: which were registered under the Securities Act of 1933, as amended (the “Securities Act”) following approval by the Company’s shareholders.]
The following table presents certain information with respect to our equity compensation plans at December 31, [removed: 2018:][added: 2019:]
| MSCI Amended and Restated 2007 Equity Incentive Compensation Plan | | | [removed: 611,374] [added: 21,386] | | | $ | [removed: 58.98] [added: 54.55] | | | | — | |
| MSCI Inc. 2016 Non-Employee Directors Compensation Plan | | | [removed: 11,004] [added: 6,603] | | | $ | [removed: 149.83] [added: 225.38] | | | | [removed: 297,688] [added: 290,500] | |
The following table provides information with respect to purchases made by or on behalf of the Company of its common stock during the quarter ended December 31, [removed: 2018.][added: 2019.]
[removed: Issuer] [added: Issuer] Purchases of Equity [removed: Securities][added: Securities]
| (1) | Includes (i) shares purchased by the Company on the open market under the [removed: 2018] [added: 2019] Repurchase Program; (ii) shares withheld to satisfy tax withholding obligations on behalf of employees that occur upon vesting and delivery of outstanding shares underlying restricted stock units; (iii) shares withheld to satisfy tax withholding obligations and exercise price on behalf of employees that occur upon exercise and delivery of outstanding shares underlying stock options; and (iv) shares held in treasury under the MSCI Inc. Non-Employee Directors Deferral Plan. The value of shares withheld to satisfy tax withholding obligations was determined using the fair market value of the Company’s common stock on the date of withholding, using a valuation methodology established by the Company. |
| (2) | See Note [removed: 8,] [added: 10,] “Shareholders’ Equity” of the Notes to the Consolidated Financial Statements included herein for further information regarding our stock repurchase programs. |
Since January 1, [removed: 2016,] [added: 2017,] the Company has issued an aggregate [removed: principle] [added: principal] amount of [removed: $1.0 billion in Senior Notes] [added: $1,500.0 million] in [removed: two discrete private offerings] [added: senior unsecured notes] in the amounts of $500.0 million [removed: each,] [added: during the year ended December 31, 2018 and $1,000.0 million during the year ended December 31, 2019,] to qualified institutional buyers pursuant to Rule 144A under the Securities Act of 1933, as amended (the “Securities Act”), and to certain non-U.S. persons in accordance with Regulation S under the Securities Act.
The [added: 2024] Senior [added: Notes, the 2027 Senior] Notes [added: and the 2029 Senior Notes] have not been registered under the Securities Act or any state securities laws.
There were no unregistered sales of equity securities in the year ended December 31, [removed: 2018.][added: 2019.]
[removed: FIVE-YEAR] [added: FIVE-YEAR] STOCK PERFORMANCE [removed: GRAPH][added: GRAPH]
The following graph compares the cumulative total shareholders’ return on our common stock, the Standard & Poor’s 500 Stock Index and the NYSE Composite Index since December 31, [removed: 2013] [added: 2014] assuming an investment of $100 at the closing price on December 31, [removed: 2013.][added: 2014.]
[removed: ][added: 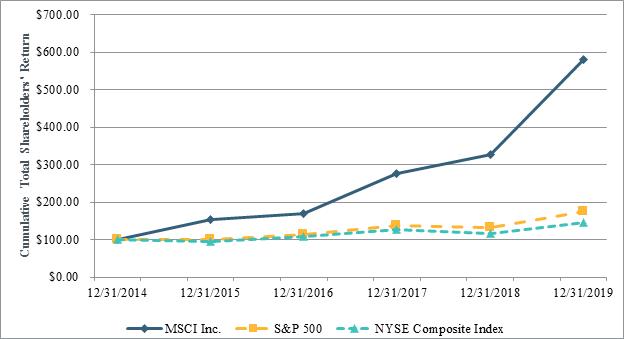]
| | | [removed: 2013 | | | |] 2014 | | | | 2015 | | | | 2016 | | | | 2017 | | | | 2018 | | | [added: | 2019 | | |]
See Part II, Item 7.
“Management’s Discussion and Analysis of Financial Condition and Results of Operations—Liquidity and Capital Resources” for additional information on our dividend policy.
Effective May 1, 2020, non-employee directors will be entitled to receive an annual grant of $165,000 and the lead director will be entitled to an additional $50,000 in stock units (a total of $215,000), which will also be subject to a one-year vesting schedule.
| MSCI Inc. 2016 Omnibus Plan | | | 729,226 | | | $ | 123.48 | | | | 4,945,088 | |
| Total | | | 757,215 | | | $ | 122.42 | | | | 5,235,588 | |
The Board of Directors has approved a stock repurchase program for the purchase of the Company’s common stock in the open market.
See Note 10, “Shareholders’ Equity (Deficit),” of the Notes to Consolidated Financial Statements included herein for additional information on our stock repurchase program.
| October 1, 2019-October 31, 2019 | | | 137 | | | $ | 222.58 | | | | \- | | | $ | 1,456,072,000 | |
| November 1, 2019-November 30, 2019 | | | 2,989 | | | $ | 245.86 | | | | \- | | | $ | 1,456,072,000 | |
| December 1, 2019-December 31, 2019 | | | 19,217 | | | $ | 261.21 | | | | \- | | | $ | 1,456,072,000 | |
| Total | | | 22,343 | | | $ | 258.92 | | | | \- | | | $ | 1,456,072,000 | |
The Company completed its private placement offering of $500.0 million aggregate principal amount of 5.375% senior unsecured notes due 2027 (the “2027 Senior Notes”) on May 15, 2018.
The Company issued $1,000.0 million aggregate principal amount of 4.000% senior unsecured notes due 2029 (the “2029 Senior Notes”) in November 2019 by completing a private placement offering of $500.0 million aggregate principal amount of the 2029 Senior Notes on November 7, 2019 with an add-on of $500.0 million aggregate principal amount of the 2029 Senior Notes on November 20, 2019.
The Company used a portion of the net proceeds from the 2029 Senior Notes, together with available cash, for the partial pre-maturity redemption of $500.0 million aggregate principal amount of the $800.0 million aggregate principal amount of 5.250% senior unsecured notes due 2024 (the “2024 Senior Notes”).
| MSCI Inc. | | $ | 100 | | | $ | 154 | | | $ | 170 | | | $ | 277 | | | $ | 327 | | | $ | 579 | |
| S&P 500 | | $ | 100 | | | $ | 101 | | | $ | 114 | | | $ | 138 | | | $ | 132 | | | $ | 174 | |
| NYSE Composite Index | | $ | 100 | | | $ | 96 | | | $ | 107 | | | $ | 127 | | | $ | 116 | | | $ | 146 | |
Source: S&P Global
On September 17, 2014, the Board of Directors approved a plan to initiate a regular quarterly cash dividend.
On January 30, 2019, our Board of Directors declared a quarterly cash dividend, in an amount of $0.58 per share of common stock, to be paid on March 15, 2019 to shareholders of record as of the close of trading on February 22, 2019.
which were registered under the Securities Act of 1933, as amended (the “Securities Act”) following approval by the Company’s shareholders.
In connection with the acquisition of RiskMetrics Group, LLC (“RiskMetrics”) in 2010, we filed a registration statement registering under the Securities Act the 4,257,779 shares of MSCI common stock reserved for issuance in respect of incentive awards to officers and certain employees of RiskMetrics pursuant to the RiskMetrics Group, Inc. 2000 Stock Option Plan, RiskMetrics Group, Inc. 2004 Stock Option Plan, Institutional Shareholder Services Holdings, Inc. Equity Incentive Plan and RiskMetrics Group, Inc. 2007 Omnibus Incentive Compensation Plan (collectively, the “RMG Plans”).
In June 2010, we also filed a registration statement assuming 3,060,090 shares available under the RiskMetrics Group, Inc. 2007 Omnibus Incentive Compensation Plan, which terminated on June 30, 2012.
| RiskMetrics Group, Inc. 2007 Omnibus Incentive Compensation Plan | | | 61,977 | | | $ | 22.74 | | | | — | |
| MSCI Inc. 2016 Omnibus Plan | | | 716,726 | | | $ | 97.64 | | | | 6,740,573 | |
| Total | | | 1,401,081 | | | $ | 77.87 | | | | 7,038,261 | |
On October 26, 2016, the Board of Directors approved a stock repurchase program for the purchase of up to $750.0 million worth of shares of the Company’s common stock (together with the amount then remaining under a previously existing share repurchase program, the “2016 Repurchase Program”).
On May 1, 2018, the Board of Directors authorized an additional stock repurchase program for the purchase of up to $1.0 billion worth of shares of the Company’s common stock (together with the $523.1 million of authorization then remaining under the 2016 Repurchase Program, the “2018 Repurchase Program”).
Share
repurchases made pursuant to the 2018 Repurchase Program may take place in the open market or in privately negotiated transactions from time to time based on market and other conditions.
This authorization may be modified, suspended or terminated by the Board of Directors at any time without prior notice.
As of December 31, 2018, there was $808.1 million of available authorization remaining under the 2018 Repurchase Program.
For the year ended December 31, 2018, the Company repurchased approximately 6.2 million shares at an average price of $148.34 per share for a total value of $925.0 million pursuant to open market repurchases under the 2018 Repurchase Program.
| Month #1 (October 1, 2018-October 31, 2018) | | | 777,349 | | | $ | 153.92 | | | | 777,030 | | | $ | 1,344,652,000 | |
| Month #2 (November 1, 2018-November 30, 2018) | | | 2,297,622 | | | $ | 148.57 | | | | 2,294,078 | | | $ | 1,003,839,000 | |
| Month #3 (December 1, 2018-December 31, 2018) | | | 1,371,422 | | | $ | 142.86 | | | | 1,370,023 | | | $ | 808,146,000 | |
| Total | | | 4,446,393 | | | $ | 147.74 | | | | 4,441,131 | | | $ | 808,146,000 | |
The Company completed its offering of the 2027 Senior Notes on May 15, 2018 and the 2026 Senior Notes on August 4, 2016.
| MSCI Inc. | | $ | 100 | | | $ | 154 | | | $ | 236 | | | $ | 261 | | | $ | 424 | | | $ | 502 | |
| S&P 500 | | $ | 100 | | | $ | 151 | | | $ | 153 | | | $ | 171 | | | $ | 208 | | | $ | 199 | |
| NYSE Composite Index | | $ | 100 | | | $ | 135 | | | $ | 129 | | | $ | 145 | | | $ | 172 | | | $ | 157 | |
Source: Bloomberg
Item 6. Selected Financial Data
28 rewritten, 1 added, 10 removed, 20 unchanged
Read the full itemFY2019 item · filed February 18, 2020FY2018 item · filed February 22, 2019
| | | [removed: 2018 (1)] | [added: 2019] | | | [removed: 2017 (2)] [added: 2018 (1)] | | | | | [removed: 2016] [added: 2017] | | | [removed: 2015 (3)] | [added: 2016] | | | [removed: 2014 (4)] [added: 2015 (2)] | | | |
| Operating revenues | | $ | [removed: 1,433,984] [added: 1,557,796] | | | $ | [removed: 1,274,172] [added: 1,433,984] | | | $ | [removed: 1,150,669] [added: 1,274,172] | | | $ | [removed: 1,075,013] [added: 1,150,669] | | | $ | [removed: 996,680] [added: 1,075,013] | | |
| Total operating expenses | | | [removed: 747,086] [added: 802,095] | | | | [removed: 694,402] [added: 747,086] | | | | [removed: 662,565] [added: 694,402] | | | | [removed: 671,115] [added: 662,565] | | | | [removed: 659,514] [added: 671,115] | | |
| Operating income | | | [removed: 686,898] [added: 755,701] | | | | [removed: 579,770] [added: 686,898] | | | | [removed: 488,104] [added: 579,770] | | | | [removed: 403,898] [added: 488,104] | | | | [removed: 337,166] [added: 403,898] | | |
| Other expense (income), net | | | [removed: 57,002] [added: 152,383] | | | | [removed: 112,871] [added: 57,002] | | | | [removed: 102,166] [added: 112,871] | | | | [removed: 54,344] [added: 102,166] | | | | [removed: 28,828] [added: 54,344] | | |
| Provision for income taxes | | | [removed: 122,011] [added: 39,670] | | | | [removed: 162,927] [added: 122,011] | | | | [removed: 125,083] [added: 162,927] | | | | [removed: 119,516] [added: 125,083] | | | | [removed: 109,396] [added: 119,516] | | |
| Income from continuing operations, net of income taxes | | | [removed: 507,885] [added: 563,648] | | | | [removed: 303,972] [added: 507,885] | | | | [removed: 260,855] [added: 303,972] | | | | [removed: 230,038] [added: 260,855] | | | | [removed: 198,942] [added: 230,038] | | |
| Income (loss) from discontinued operations, net of income taxes | | | — | | | | — | | | | — | | | | [removed: (6,390] [added: —] | [removed: )] | | | [removed: 85,171] [added: (6,390] | [added: )] | [removed: (5)] |
| Net income | | $ | [removed: 507,885] [added: 563,648] | | | $ | [removed: 303,972] [added: 507,885] | | | $ | [removed: 260,855] [added: 303,972] | | | $ | [removed: 223,648] [added: 260,855] | | | $ | [removed: 284,113] [added: 223,648] | | |
| Operating margin | | | [removed: 47.9] [added: 48.5] | % | | | [removed: 45.5] [added: 47.9] | % | | | [removed: 42.4] [added: 45.5] | % | | | [removed: 37.6] [added: 42.4] | % | | | [removed: 33.8] [added: 37.6] | % | |
| Earnings per basic common share from continuing operations | | $ | [removed: 5.83] [added: 6.66] | | | $ | [removed: 3.36] [added: 5.83] | | | $ | [removed: 2.72] [added: 3.36] | | | $ | [removed: 2.11] [added: 2.72] | | | $ | [removed: 1.72] [added: 2.11] | | |
| Earnings per basic common share from discontinued operations | | | — | | | | — | | | | — | | | | [removed: (0.06] [added: —] | [removed: )] | | | [removed: 0.73] [added: (0.06] | [added: )] | |
| Earnings per basic common share | | $ | [removed: 5.83] [added: 6.66] | | | $ | [removed: 3.36] [added: 5.83] | | | $ | [removed: 2.72] [added: 3.36] | | | $ | [removed: 2.05] [added: 2.72] | | | $ | [removed: 2.45] [added: 2.05] | | |
| Earnings per diluted common share from continuing operations | | $ | [removed: 5.66] [added: 6.59] | | | $ | [removed: 3.31] [added: 5.66] | | | $ | [removed: 2.70] [added: 3.31] | | | $ | [removed: 2.09] [added: 2.70] | | | $ | [removed: 1.70] [added: 2.09] | | |
| Earnings per diluted common share from discontinued operations | | | — | | | | — | | | | — | | | | [removed: (0.06] [added: —] | [removed: )] | | | [removed: 0.73] [added: (0.06] | [added: )] | |
| Earnings per diluted common share | | $ | [removed: 5.66] [added: 6.59] | | | $ | [removed: 3.31] [added: 5.66] | | | $ | [removed: 2.70] [added: 3.31] | | | $ | [removed: 2.03] [added: 2.70] | | | $ | [removed: 2.43] [added: 2.03] | | |
| Basic | | | [removed: 87,179] [added: 84,644] | | | | [removed: 90,336] [added: 87,179] | | | | [removed: 95,986] [added: 90,336] | | | | [removed: 109,124] [added: 95,986] | | | | [removed: 115,737] [added: 109,124] | | |
| Diluted | | | [removed: 89,701] [added: 85,536] | | | | [removed: 91,914] [added: 89,701] | | | | [removed: 96,540] [added: 91,914] | | | | [removed: 109,926] [added: 96,540] | | | | [removed: 116,706] [added: 109,926] | | |
| Dividends declared per common share | | $ | [removed: 1.92] [added: 2.52] | | | $ | [removed: 1.32] [added: 1.92] | | | $ | [removed: 1.00] [added: 1.32] | | | $ | [removed: 0.80] [added: 1.00] | | | $ | [removed: 0.18] [added: 0.80] | | |
| | | [removed: 2018 (1)] [added: 2019 (3)] | | | | [removed: 2017] [added: 2018 (1)] | | | | | [removed: 2016] [added: 2017] | | | [removed: 2015 (3)] | [added: 2016] | | | [removed: 2014 (4)] [added: 2015 (2)] | | | |
| Cash and cash equivalents | | $ | [removed: 904,176] [added: 1,506,567] | | | $ | [removed: 889,502] [added: 904,176] | | | $ | [removed: 791,834] [added: 889,502] | | | $ | [removed: 777,706] [added: 791,834] | | | $ | [removed: 508,799] [added: 777,706] | | |
| Accounts receivable (net of allowances) | | $ | [removed: 473,433] [added: 499,268] | | | $ | [removed: 327,597] [added: 473,433] | | | $ | [removed: 221,504] [added: 327,597] | | | $ | [removed: 208,239] [added: 221,504] | | | $ | [removed: 178,717] [added: 208,239] | | |
| Goodwill and intangibles, net of accumulated amortization | | $ | [removed: 1,826,564] [added: 1,824,355] | | | $ | [removed: 1,882,457] [added: 1,826,564] | | | $ | [removed: 1,903,490] [added: 1,882,457] | | | $ | [removed: 1,957,111] [added: 1,903,490] | | | $ | [removed: 1,998,532] [added: 1,957,111] | | |
| Total assets | | $ | [removed: 3,387,952] [added: 4,204,439] | | | $ | [removed: 3,275,668] [added: 3,387,952] | | | $ | [removed: 3,082,578] [added: 3,275,668] | | | $ | [removed: 3,146,987] [added: 3,082,578] | | | $ | [removed: 2,882,533] [added: 3,146,987] | | |
| Deferred revenue | | $ | [removed: 537,977] [added: 574,656] | | | $ | [removed: 374,365] [added: 537,977] | | | $ | [removed: 334,358] [added: 374,365] | | | $ | [removed: 317,552] [added: 334,358] | | | $ | [removed: 310,775] [added: 317,552] | | |
| Long-term debt, net of current maturities | | $ | [removed: 2,575,502] [added: 3,071,926] | | | $ | [removed: 2,078,093] [added: 2,575,502] | | | $ | [removed: 2,075,201] [added: 2,078,093] | | | $ | [removed: 1,579,404] [added: 2,075,201] | | | $ | [removed: 788,358] [added: 1,579,404] | | |
| Total shareholders' equity (deficit) | | $ | [removed: (166,494] [added: (76,714] | ) | | $ | [removed: 401,012] [added: (166,494] | [added: )] | | $ | [removed: 317,605] [added: 401,012] | | | $ | [removed: 901,487] [added: 317,605] | | | $ | [removed: 1,432,833] [added: 901,487] | | |
| [removed: (3)] [added: (2)] | Includes the impact of the Insignis business (“Insignis”) from the October 16, 2015 acquisition date, which was not material. [removed: Deferred taxes have been presented in accordance with new accounting guidance prospectively beginning on December 31, 2015. Prior periods have not been retrospectively restated to match this presentation.] |
| (3) | Reflects the impact of the adoption on January 1, 2019 of Accounting Standards Update 2016-02, "Lease (Topic 842)," the impact of which was the inclusion of $166.4 million of right-of-use assets on the Company's Consolidated Statement of Financial Condition as of December 31, 2019. |
| --- | --- |
The selected Consolidated Statement of Income data for the years ended December 31, 2018, 2017 and 2016 and the selected Consolidated Statement of Financial Condition data as of December 31, 2018 and 2017 are derived from our audited consolidated financial statements beginning on page F-1 of this Annual Report on Form 10-K.
Our consolidated financial statements for the years ended December 31, 2018, 2017 and 2016 have been audited and
reported upon by an independent registered public accounting firm in each period.
The selected Consolidated Statement of Income data for the years ended December 31, 2015 and 2014 and the selected Consolidated Statement of Financial Condition data as of December 31, 2016, 2015 and 2014 are derived from our audited consolidated financial statements not included in this Annual Report on Form 10-K.
The selected financial information presented below may not be indicative of our future performance.
| --- | --- |
| (2) | As a result of the adoption of Accounting Standards Update 2017-07, the Company has restated its Consolidated Statements of Income by reclassifying $0.6 million of non-service related pension costs from Operating Expenses to Other expense (income) for the year ended December 31, 2017. |
| (4) | Includes the results of GMI Ratings from the August 11, 2014 acquisition date, the impact of which was not material. |
| (5) | Includes the net gain resulting from the divestiture of Institutional Shareholder Services Inc. in 2014. |
Item 9A. Controls and Procedures
5 rewritten, 0 added, 0 removed, 19 unchanged
Read the full itemFY2019 item · filed February 18, 2020FY2018 item · filed February 22, 2019
Based on their evaluation, as of December 31, [removed: 2018,] [added: 2019,] the end of the period covered by this Annual Report on Form 10-K, the Company’s CEO and CFO have concluded that the Company’s disclosure controls and procedures (as defined in Rules 13a-15(e) and 15d-15(e) under the Exchange Act) were effective.
Management assessed the effectiveness of our internal control over financial reporting as of December 31, [removed: 2018] [added: 2019] based on the criteria described in [removed: Internal] [added: *Internal] Control—Integrated Framework [removed: (2013)] [added: (2013)*] issued by the Committee of Sponsoring Organizations of the Treadway Commission (COSO).
Based on this assessment, management, including the Company’s CEO and CFO, concluded that, as of December 31, [removed: 2018,] [added: 2019,] our internal control over financial reporting was effective in providing reasonable assurance regarding the reliability of financial reporting and the preparation of financial statements for external purposes in accordance with generally accepted accounting principles.
PricewaterhouseCoopers LLP, our independent registered public accounting firm, has audited and issued a report on the effectiveness of our internal control over financial reporting as of December 31, [removed: 2018,] [added: 2019,] which appears on page F-2 of this Annual Report on Form 10-K.
There have been no changes in our internal control over financial reporting (as defined in Rules 13a-15(f) and 15d-15(f) under the Exchange Act) during the fiscal quarter ended December 31, [removed: 2018] [added: 2019] that have materially affected, or are reasonably likely to materially affect, our internal control over financial reporting.
Item 10. Directors, Executive Officers and Corporate Governance
2 rewritten, 0 added, 0 removed, 3 unchanged
Read the full itemFY2019 item · filed February 18, 2020FY2018 item · filed February 22, 2019
Except for the information relating to our Executive Officers set forth in Part I of this Annual Report on Form 10-K, we incorporate by reference the information responsive to this Item appearing in our Proxy Statement, which will be filed no later than 120 days after December 31, [removed: 2018.][added: 2019.]
Information regarding our Code of Ethics and Business Conduct and Corporate Governance Policies is incorporated herein by reference from our Proxy Statement, which will be filed no later than 120 days after December 31, [removed: 2018.][added: 2019.]
Item 11. Executive Compensation
1 rewritten, 0 added, 0 removed, 1 unchanged
Read the full itemFY2019 item · filed February 18, 2020FY2018 item · filed February 22, 2019
We incorporate by reference the information responsive to this Item appearing in our Proxy Statement, which will be filed no later than 120 days after December 31, [removed: 2018.][added: 2019.]
Item 12. Security Ownership of Certain Beneficial Owners and Management and Related Stockholder Matters
1 rewritten, 0 added, 0 removed, 3 unchanged
Read the full itemFY2019 item · filed February 18, 2020FY2018 item · filed February 22, 2019
We incorporate by reference the information responsive to this Item appearing in our Proxy Statement, which will be filed no later than 120 days after December 31, [removed: 2018.][added: 2019.]
Item 13. Certain Relationships and Related Transactions, and Director Independence
1 rewritten, 0 added, 0 removed, 1 unchanged
Read the full itemFY2019 item · filed February 18, 2020FY2018 item · filed February 22, 2019
We incorporate by reference the information responsive to this Item appearing in our Proxy Statement, which will be filed no later than 120 days after December 31, [removed: 2018.][added: 2019.]
Item 14. Principal Accounting Fees and Services
2 rewritten, 0 added, 0 removed, 1 unchanged
Read the full itemFY2019 item · filed February 18, 2020FY2018 item · filed February 22, 2019
We incorporate by reference the information responsive to this Item appearing in our Proxy Statement, which will be filed no later than 120 days after December 31, [removed: 2018.][added: 2019.]
[removed: PART IV][added: PART IV]
Item 15. Exhibits, Financial Statement Schedules
43 rewritten, 26 added, 14 removed, 174 unchanged
Read the full itemFY2019 item · filed February 18, 2020FY2018 item · filed February 22, 2019
(a)(1) [removed: Financial Statements][added: *Financial Statements*]
(a)(2) [removed: Financial] [added: *Financial] Statement [removed: Schedules][added: Schedules*]
(a)(3) [removed: Exhibits][added: *Exhibits*]
| 10.54 | [Amendment to the Index License Agreement for Funds, dated as of October 4, 2011, by and between MSCI Inc. and BlackRock Institutional Trust Company, N.A. (formerly known as Barclays Global Investors, N.A.)](http://www.sec.gov/Archives/edgar/data/1408198/000119312512086989/d264713dex1065.htm) [removed: [ ](http://www.sec.gov/Archives/edgar/data/1408198/000119312512086989/d264713dex1065.htm)] | 10-K | 001-33812 | 10.65 | 2/29/2012 |
| [removed: 10.99*] [added: 10.185*] | [Form of [added: 2019] Award Agreement for Restricted Stock Units [removed: for Executive Officers under] [added: For Employees Under] the MSCI Inc. [removed: 2007 Amended and Restated Equity] [added: 2016 Omnibus] Incentive [removed: Compensation Plan](http://www.sec.gov/Archives/edgar/data/1408198/000119312515069699/d832959dex10101.htm)] [added: Plan](http://www.sec.gov/Archives/edgar/data/1408198/000156459019003885/msci-ex10185_715.htm)] | 10-K | 001-33812 | [removed: 10.101] [added: 10.185] | [removed: 2/27/2015] [added: 2/22/2019] |
| [removed: 10.100*] [added: 10.186*] | [Form of [added: 2019] Annual Performance Award Agreement for Performance Stock Units for Managing Directors [removed: under] [added: Under] the MSCI Inc. [removed: 2007 Amended and Restated Equity] [added: Omnibus] Incentive [removed: Compensation Plan](http://www.sec.gov/Archives/edgar/data/1408198/000119312516567595/d158720dex104.htm)] [added: Plan](http://www.sec.gov/Archives/edgar/data/1408198/000156459019003885/msci-ex10186_714.htm)] | [removed: 10-Q] [added: 10-K] | 001-33812 | [removed: 10.4] [added: 10.186] | [removed: 04/29/2016] [added: 2/22/2019] |
| [removed: 10.101*] [added: 10.195*] | [Form of [added: 2018] Award Agreement for Restricted Stock Units for Managing Directors [removed: under] [added: Under] the MSCI Inc. [removed: 2007 Amended and Restated Equity] [added: 2016 Omnibus] Incentive [removed: Compensation Plan](http://www.sec.gov/Archives/edgar/data/1408198/000119312516567595/d158720dex105.htm)] [added: Plan](http://www.sec.gov/Archives/edgar/data/1408198/000156459019015544/msci-ex104_121.htm)] | 10-Q | 001-33812 | [removed: 10.5] [added: 10.4] | [removed: 04/29/2016] [added: 5/3/2019] |
| 10.113† | [Amendment (to amend the Amendments dated January 23, 2014 and April 15, 2014) to the Index License Agreement for Funds, dated as of June 4, 2015, by and between MSCI Inc. (formerly, Morgan Stanley Capital International Inc.) and BlackRock Fund Advisors (as successor to Barclays Global Investors, [removed: N.A.)](https://www.sec.gov/Archives/edgar/data/1408198/000156459019003885/msci-ex10113_950.htm)] [added: N.A.)](http://www.sec.gov/Archives/edgar/data/1408198/000156459019003885/msci-ex10113_950.htm)] | [removed: Filed Herewith] [added: 10-K] | [added: 011-33812] | [added: 10.113] | [added: 2/22/2019] |
| [removed: 10.124*] [added: 10.191*] | [Form of [removed: 2016 Multi-Year Performance] [added: 2019 Special] Award Agreement for Performance Stock Units [removed: for the Executive Committee under] [added: Under] the MSCI Inc. [removed: 2007 Amended and Restated Equity] [added: 2016 Omnibus] Incentive [removed: Compensation Plan](http://www.sec.gov/Archives/edgar/data/1408198/000119312516567595/d158720dex106.htm)] [added: Plan](http://www.sec.gov/Archives/edgar/data/1408198/000156459019013792/msci-ex102_7.htm)] | [removed: 10-Q] [added: 8-K] | 001-33812 | [removed: 10.6] [added: 10.2] | [removed: 4/29/2016] [added: 4/29/2019] |
| [removed: 10.125*] [added: 10.198*] | [Form of [removed: 2016 Multi-Year] [added: 2019 Special] Performance Award Agreement for Performance Stock Units [removed: for the Executive Committee under] [added: Under] the MSCI Inc. 2016 Omnibus Incentive [removed: Plan](http://www.sec.gov/Archives/edgar/data/1408198/000119312516567595/d158720dex107.htm)] [added: Plan](http://www.sec.gov/Archives/edgar/data/1408198/000156459019013792/msci-ex102_7.htm)] | 10-Q | 001-33812 | [removed: 10.7] [added: 10.1] | [removed: 4/29/2016] [added: 8/1/2019] |
| [removed: 10.128*] [added: 10.193*] | [Offer Letter, [removed: effective as of March] [added: executed May] 15, [removed: 2016,] [added: 2018,] between MSCI Inc. and [removed: Kathleen A. Winters](http://www.sec.gov/Archives/edgar/data/1408198/000119312516559687/d185890dex101.htm)] [added: Jigar Thakkar](http://www.sec.gov/Archives/edgar/data/1408198/000156459019015544/msci-ex101_117.htm)] | [removed: 8-K] [added: 10-Q] | 001-33812 | 10.1 | [removed: 4/27/2016] [added: 5/3/2019] |
| [removed: 10.134*] [added: 10.197*] | [Form of Award Agreement for Restricted Stock Units for Directors [removed: under] [added: Under] the MSCI Inc. 2016 Non-Employee Directors Compensation [removed: Plan](http://www.sec.gov/Archives/edgar/data/1408198/000119312516567595/d158720dex103.htm)] [added: Plan](http://www.sec.gov/Archives/edgar/data/1408198/000156459019015544/msci-ex106_118.htm)] | 10-Q | 001-33812 | [removed: 10.3] [added: 10.6] | [removed: 4/29/2016] [added: 5/3/2019] |
| [removed: 10.138*] [added: 10.192*] | [Offer Letter, [removed: effective as of October 15, 2014, by and] [added: executed April 17, 2019,] between MSCI Inc. and [removed: Laurent Seyer](http://www.sec.gov/Archives/edgar/data/1408198/000119312516567595/d158720dex1013.htm)] [added: Linda S. Huber](http://www.sec.gov/Archives/edgar/data/1408198/000156459019013792/msci-ex103_6.htm)] | [removed: 10-Q] [added: 8-K] | 001-33812 | [removed: 10.13] [added: 10.3] | [removed: 4/29/2016] [added: 4/29/2019] |
| [removed: 10.145*] [added: 10.187*] | [Form of [removed: 2016] [added: 2019 Annual Performance] Award Agreement for [removed: Restricted] [added: Performance] Stock Units for Managing Directors [removed: under] [added: Under] the MSCI Inc. [removed: 2016] Omnibus Incentive [removed: Plan](http://www.sec.gov/Archives/edgar/data/1408198/000156459016021770/msci-ex105_295.htm)] [added: Plan](http://www.sec.gov/Archives/edgar/data/1408198/000156459019003885/msci-ex10187_713.htm)] | [removed: 10-Q] [added: 10-K] | 001-33812 | [removed: 10.5] [added: 10.187] | [removed: 7/29/2016] [added: 2/22/2019] |
| [removed: 10.146*] [added: 10.146†] | [Amendment to the Index License Agreement for Funds, dated as of August 1, 2016, by and between MSCI Inc. (formerly, Morgan Stanley Capital International Inc.) and BlackRock Fund Advisors (as successor to Barclays Global Investors, N.A.)](http://www.sec.gov/Archives/edgar/data/1408198/000156459018003147/msci-ex10146_25.htm) | 10-K | 001-33812 | 10.146 | 2/26/2018 |
| 10.157† | [Amendment to the Second Schedule to the Index License Agreement for Funds, dated as of April 12, 2017, by and between MSCI Inc. (formerly, Morgan Stanley Capital International Inc.) and BlackRock Fund Advisors (as successor to Barclays Global Investors, [removed: N.A.)](https://www.sec.gov/Archives/edgar/data/1408198/000156459019003885/msci-ex10157_949.htm)] [added: N.A.)](http://www.sec.gov/Archives/edgar/data/1408198/000156459019003885/msci-ex10157_949.htm)] | [removed: Filed Herewith] [added: 10-K] | [added: 001-33812] | [added: 10.157] | [added: 2/22/2019] |
| 10.161† | [Amendment to the Index License Agreement for Funds, dated as of October 1, 2017, by and between MSCI Inc. (formerly, Morgan Stanley Capital International Inc.) and BlackRock Fund Advisors (as successor to Barclays Global Investors, [removed: N.A.)](https://www.sec.gov/Archives/edgar/data/1408198/000156459019003885/msci-ex10161_948.htm)] [added: N.A.)](http://www.sec.gov/Archives/edgar/data/1408198/000156459019003885/msci-ex10161_948.htm)] | [removed: Filed Herewith] [added: 10-K] | [added: 001-33812] | [added: 10.161] | [added: 2/22/2019] |
| 10.162 | [Amendment to the Index License Agreement for Funds, dated as of October 1, 2017, by and between MSCI Inc. (formerly, Morgan Stanley Capital International Inc.) and BlackRock Fund Advisors (as successor to Barclays Global Investors, [removed: N.A.)](https://www.sec.gov/Archives/edgar/data/1408198/000156459019003885/msci-ex10162_947.htm)] [added: N.A.)](http://www.sec.gov/Archives/edgar/data/1408198/000156459019003885/msci-ex10162_947.htm)] | [removed: Filed Herewith] [added: 10-K] | [added: 001-33812] | [added: 10.162] | [added: 2/22/2019] |
| [removed: 10.169††] [added: 10.169†] | [Amendment to the Index License Agreement for Funds, dated as of January 18, 2018, by and between MSCI Inc. (formerly, Morgan Stanley Capital International Inc.) and BlackRock Fund Advisors (as successor to Barclays Global Investors, [removed: N.A.)](https://www.sec.gov/Archives/edgar/data/1408198/000156459019003885/msci-ex10169_946.htm)] [added: N.A.)](http://www.sec.gov/Archives/edgar/data/1408198/000156459019003885/msci-ex10169_946.htm)] | [removed: Filed Herewith] [added: 10-K] | [added: 001-33812] | [added: 10.169] | [added: 2/22/2019] |
| [removed: 10.170††] [added: 10.170†] | [Amendment to the Index License Agreement for Funds, dated as of February 8, 2018, by and between MSCI Inc. (formerly, Morgan Stanley Capital International Inc.) and BlackRock Fund Advisors (as successor to Barclays Global Investors, [removed: N.A.)](https://www.sec.gov/Archives/edgar/data/1408198/000156459019003885/msci-ex10170_945.htm)] [added: N.A.)](http://www.sec.gov/Archives/edgar/data/1408198/000156459019003885/msci-ex10170_945.htm)] | [removed: Filed Herewith] [added: 10-K] | [added: 001-33812] | [added: 10.170] | [added: 2/22/2019] |
| 10.171 | [Amendment to the Previous Amendment to the Index License Agreement for Funds, dated as of February 19, 2018, by and between MSCI Inc. (formerly, Morgan Stanley Capital International Inc.) and BlackRock Fund Advisors (as successor to Barclays Global Investors, [removed: N.A.)](https://www.sec.gov/Archives/edgar/data/1408198/000156459019003885/msci-ex10171_944.htm)] [added: N.A.)](http://www.sec.gov/Archives/edgar/data/1408198/000156459019003885/msci-ex10171_944.htm)] | [removed: Filed Herewith] [added: 10-K] | [added: 001-33812] | [added: 10.171] | [added: 2/22/2019] |
| [removed: 10.172††] [added: 10.172†] | [Amendment No. 2 to the Index License Agreement for Funds, dated as of March 1, 2018, by and between MSCI ESG Research LLC and BlackRock Fund [removed: Advisors](https://www.sec.gov/Archives/edgar/data/1408198/000156459019003885/msci-ex10172_943.htm)] [added: Advisors](http://www.sec.gov/Archives/edgar/data/1408198/000156459019003885/msci-ex10172_943.htm)] | [removed: Filed Herewith] [added: 10-K] | [added: 001-33812] | [added: 10.172] | [added: 2/22/2019] |
| 10.173 | [Amendment to the Schedules to the Index License Agreement for Funds, dated as of May 15, 2018, by and between MSCI Inc. and BlackRock Fund [removed: Advisors](https://www.sec.gov/Archives/edgar/data/1408198/000156459019003885/msci-ex10173_942.htm)] [added: Advisors](http://www.sec.gov/Archives/edgar/data/1408198/000156459019003885/msci-ex10173_942.htm)] | [removed: Filed Herewith] [added: 10-K] | [added: 001-33812] | [added: 10.173] | [added: 2/22/2019] |
| [removed: 10.175††] [added: 10.175†] | [Amendment to the Index License Agreement for Funds, dated as of June 1, 2018, by and between MSCI Inc. (formerly, Morgan Stanley Capital International Inc.) and BlackRock Fund Advisors (as successor to Barclays Global Investors, [removed: N.A.)](https://www.sec.gov/Archives/edgar/data/1408198/000156459019003885/msci-ex10175_940.htm)] [added: N.A.)](http://www.sec.gov/Archives/edgar/data/1408198/000156459019003885/msci-ex10175_940.htm)] | [removed: Filed Herewith] [added: 10-K] | [added: 001-33812] | [added: 10.175] | [added: 2/22/2019] |
| [removed: 10.176††] [added: 10.176†] | [Amendment No. 3 to the Index License Agreement for Funds, dated as of July 1, 2018, by and between MSCI ESG Research LLC and BlackRock Fund [removed: Advisors](https://www.sec.gov/Archives/edgar/data/1408198/000156459019003885/msci-ex10176_941.htm)] [added: Advisors](http://www.sec.gov/Archives/edgar/data/1408198/000156459019003885/msci-ex10176_941.htm)] | [removed: Filed Herewith] [added: 10-K] | [added: 001-33812] | [added: 10.176] | [added: 2/22/2019] |
| 10.177 | [Amendment to the Schedules to the Index License Agreement for Funds, dated as of September 1, 2018, by and between MSCI Inc. and BlackRock Fund [removed: Advisors](https://www.sec.gov/Archives/edgar/data/1408198/000156459019003885/msci-ex10177_939.htm)] [added: Advisors](http://www.sec.gov/Archives/edgar/data/1408198/000156459019003885/msci-ex10177_939.htm)] | [removed: Filed Herewith] [added: 10-K] | [added: 001-33812] | [added: 10.177] | [added: 2/22/2019] |
| 10.178 | [Amendment to the Previous Amendment to the Index License Agreement for Funds, dated as of September 10, 2018, by and between MSCI Inc. (formerly, Morgan Stanley Capital International Inc.) and BlackRock Fund Advisors (as successor to Barclays Global Investors, [removed: N.A.)](https://www.sec.gov/Archives/edgar/data/1408198/000156459019003885/msci-ex10178_938.htm)] [added: N.A.)](http://www.sec.gov/Archives/edgar/data/1408198/000156459019003885/msci-ex10178_938.htm)] | [removed: Filed Herewith] [added: 10-K] | [added: 001-33812] | [added: 10.178] | [added: 2/22/2019] |
| [removed: 10.179††] [added: 10.179†] | [Amendment to the Previous Amendment, the Previous Conversion Amendment and Previous Name Change Amendment to the Index License Agreement for Funds, dated as of September 10, 2018, by and between MSCI Inc. (formerly, Morgan Stanley Capital International Inc.) and BlackRock Fund Advisors (as successor to Barclays Global Investors, [removed: N.A.)](https://www.sec.gov/Archives/edgar/data/1408198/000156459019003885/msci-ex10179_937.htm)] [added: N.A.)](http://www.sec.gov/Archives/edgar/data/1408198/000156459019003885/msci-ex10179_937.htm)] | [removed: Filed Herewith] [added: 10-K] | [added: 001-33812] | [added: 10.179] | [added: 2/22/2019] |
| [removed: 10.180††] [added: 10.180†] | [Amendment to the Index License Agreement for Funds, dated as of October 1, 2018, by and between MSCI Inc. (formerly, Morgan Stanley Capital International Inc.) and BlackRock Institutional Trust Company, N.A. (formerly, Barclays Global Investors, [removed: N.A.)](https://www.sec.gov/Archives/edgar/data/1408198/000156459019003885/msci-ex10180_936.htm)] [added: N.A.)](http://www.sec.gov/Archives/edgar/data/1408198/000156459019003885/msci-ex10180_936.htm)] | [removed: Filed Herewith] [added: 10-K] | [added: 001-33812] | [added: 10.180] | [added: 2/22/2019] |
| [removed: 10.181††] [added: 10.181†] | [Amendment to the Index License Agreement for Funds, dated as of October 1, 2018, by and between MSCI Inc. (formerly, Morgan Stanley Capital International Inc.) and BlackRock Institutional Trust Company, N.A. (formerly, Barclays Global Investors, [removed: N.A.)](https://www.sec.gov/Archives/edgar/data/1408198/000156459019003885/msci-ex10181_935.htm)] [added: N.A.)](http://www.sec.gov/Archives/edgar/data/1408198/000156459019003885/msci-ex10181_935.htm)] | [removed: Filed Herewith] [added: 10-K] | [added: 001-33812] | [added: 10.181] | [added: 2/22/2019] |
| [removed: 10.182††] [added: 10.182†] | [Amendment to the Index License Agreement for Funds, dated as of November 1, 2018, by and between MSCI Inc. (formerly, Morgan Stanley Capital International Inc.) and BlackRock Fund Advisors (as successor to Barclays Global Investors, [removed: N.A.)](https://www.sec.gov/Archives/edgar/data/1408198/000156459019003885/msci-ex10182_934.htm)] [added: N.A.)](http://www.sec.gov/Archives/edgar/data/1408198/000156459019003885/msci-ex10182_934.htm)] | [removed: Filed Herewith] [added: 10-K] | [added: 001-33812] | [added: 10.182] | [added: 2/22/2019] |
| [removed: 10.183††] [added: 10.183†] | [Amendment to the Index License Agreement for Funds, dated as of November 1, 2018, by and between MSCI Inc. (formerly, Morgan Stanley Capital International Inc.) and BlackRock Fund Advisors (as successor to Barclays Global Investors, [removed: N.A.)](https://www.sec.gov/Archives/edgar/data/1408198/000156459019003885/msci-ex10183_933.htm)] [added: N.A.)](https://www.sec.gov/Archives/edgar/data/1408198/000156459020004992/msci-ex10183_26.htm)] | Filed Herewith | | | |
| [removed: 10.184††] [added: 10.184†] | [Amendment to the Previous Amendment to the Index License Agreement for Funds, dated as of November 16, 2018, by and between MSCI Inc. (formerly, Morgan Stanley Capital International Inc.) and BlackRock Fund Advisors (as successor to Barclays Global Investors, [removed: N.A.)](https://www.sec.gov/Archives/edgar/data/1408198/000156459019003885/msci-ex10184_932.htm)] [added: N.A.)](http://www.sec.gov/Archives/edgar/data/1408198/000156459019003885/msci-ex10184_932.htm)] | [removed: Filed Herewith] [added: 10-K] | [added: 001-33812] | [added: 10.184] | [added: 2/22/2019] |
| [removed: 10.185*] [added: 10.216*] | [Form of [removed: 2019] [added: 2020] Award Agreement for Restricted Stock Units For Employees Under the MSCI Inc. 2016 Omnibus Incentive [removed: Plan](https://www.sec.gov/Archives/edgar/data/1408198/000156459019003885/msci-ex10185_715.htm)] [added: Plan](https://www.sec.gov/Archives/edgar/data/1408198/000156459020004992/msci-ex10216_692.htm)] | Filed Herewith | | | |
| [removed: 10.186*] [added: 10.217*] | [Form of [removed: 2019] [added: 2020] Annual Performance Award Agreement for Performance Stock Units for Managing Directors Under the MSCI Inc. [added: 2016] Omnibus Incentive [removed: Plan](https://www.sec.gov/Archives/edgar/data/1408198/000156459019003885/msci-ex10186_714.htm)] [added: Plan](https://www.sec.gov/Archives/edgar/data/1408198/000156459020004992/msci-ex10217_690.htm)] | Filed Herewith | | | |
| [removed: 10.187*] [added: 10.218*] | [Form of [removed: 2019] [added: 2020] Annual Performance Award Agreement for Performance Stock Units for Managing Directors Under the MSCI Inc. [added: 2016] Omnibus Incentive [removed: Plan](https://www.sec.gov/Archives/edgar/data/1408198/000156459019003885/msci-ex10187_713.htm)] [added: Plan](https://www.sec.gov/Archives/edgar/data/1408198/000156459020004992/msci-ex10218_693.htm)] | Filed Herewith | | | |
| 10.188* | [MSCI Inc. Executive Committee Stock Ownership [removed: Guidelines](https://www.sec.gov/Archives/edgar/data/1408198/000156459019003885/msci-ex10188_712.htm)] [added: Guidelines](http://www.sec.gov/Archives/edgar/data/1408198/000156459019015544/msci-ex103_120.htm)] | [removed: Filed Herewith] [added: 10-Q] | [added: 001-33812] | [added: 10.3] | [added: 5/3/2019] |
| 10.189* | [MSCI Inc. Clawback [removed: Policy](https://www.sec.gov/Archives/edgar/data/1408198/000156459019003885/msci-ex10189_711.htm)] [added: Policy](http://www.sec.gov/Archives/edgar/data/1408198/000156459019003885/msci-ex10189_711.htm)] | [removed: Filed Herewith] [added: 10-K] | [added: 001-33812] | [added: 10.189] | [added: 2/22/2019] |
| 21.1 | [Subsidiaries of the [removed: Registrant](https://www.sec.gov/Archives/edgar/data/1408198/000156459019003885/msci-ex211_16.htm)] [added: Registrant](https://www.sec.gov/Archives/edgar/data/1408198/000156459020004992/msci-ex211_9.htm)] | Filed Herewith | | | |
| 23.1 | [Consent of PricewaterhouseCoopers [removed: LLP](https://www.sec.gov/Archives/edgar/data/1408198/000156459019003885/msci-ex231_12.htm)] [added: LLP](https://www.sec.gov/Archives/edgar/data/1408198/000156459020004992/msci-ex231_28.htm)] | Filed Herewith | | | |
| 4.12 | [Indenture, dated as of November 7, 2019, among MSCI Inc., each of the subsidiary guarantors party thereto and Wells Fargo Bank, National Association, as Trustee](http://www.sec.gov/Archives/edgar/data/1408198/000119312519286824/d828551dex41.htm) | 8-K | 001-33812 | 4.1 | 11/7/2019 |
| 4.13 | [Form of Note for MSCI Inc. 4.000% Senior Notes due November 15, 2029 (included in Exhibit 4.1)](http://www.sec.gov/Archives/edgar/data/1408198/000119312519286824/d828551dex41.htm) | 8-K | 001-33812 | 4.2 | 11/7/2019 |
| 4.14 | [Description of Securities](https://www.sec.gov/Archives/edgar/data/1408198/000156459020004992/msci-ex414_565.htm) | Filed Herewith | | | |
| 10.190* | [Form of 2019 Special Award Agreement for Restricted Stock Units Under the MSCI Inc. 2016 Omnibus Incentive Plan](http://www.sec.gov/Archives/edgar/data/1408198/000156459019013792/msci-ex101_8.htm) | 8-K | 001-33812 | 10.1 | 4/29/2019 |
| 10.194* | [Offer Letter, executed May 16, 2012, between MSCI Inc. and Andrew C. Wiechmann](http://www.sec.gov/Archives/edgar/data/1408198/000156459019015544/msci-ex102_122.htm) | 10-Q | 001-33812 | 10.2 | 5/3/2019 |
| 10.196* | [Special Restricted Stock Unit Award Agreement Under the MSCI Inc. 2016 Omnibus Incentive Plan](http://www.sec.gov/Archives/edgar/data/1408198/000156459019015544/msci-ex105_119.htm) | 10-Q | 001-33812 | 10.5 | 5/3/2019 |
| 10.199†† | [Amendment, dated as of the 30th day of October 2019, by and among MSCI Inc., MSCI Limited, BlackRock Fund Advisors and BlackRock Institutional Trust Company, N.A.](http://www.sec.gov/Archives/edgar/data/1408198/000156459019039046/msci-ex101_262.htm) | 10-Q | 001-33812 | 10.1 | 10/31/2019 |
| 10.200 | [Amendment No. 3 to the Revolving Credit Agreement, dated as of November 15, 2019, among MSCI Inc., each of the subsidiary guarantors party thereto, JPMorgan Chase Bank, N.A., as Administrative Agent and L/C Issuer and the other lenders party thereto](http://www.sec.gov/Archives/edgar/data/1408198/000119312519294904/d834499dex101.htm) | 8-K | 001-33812 | 10.1 | 11/19/2019 |
| 10.201 | [Amendment to the Previous Amendment to the Index License Agreement for Funds, dated as of January 31, 2019, by and between MSCI Inc. and BlackRock Fund Advisors](https://www.sec.gov/Archives/edgar/data/1408198/000156459020004992/msci-ex10201_809.htm) | Filed Herewith | | | |
| 10.202†† | [Amendment to the Index License Agreement for Funds, dated as of February 1, 2019, by and between MSCI Inc. (formerly, Morgan Stanley Capital International Inc.) and BlackRock Fund Advisors (as successor to Barclays Global Investors, N.A.)](https://www.sec.gov/Archives/edgar/data/1408198/000156459020004992/msci-ex10202_808.htm) | Filed Herewith | | | |
| 10.203 | [Amendment to the Previous Amendment to the Index License Agreement for Funds, dated as of March 1, 2019, by and between MSCI Inc. (formerly, Morgan Stanley Capital International Inc.) and BlackRock Fund Advisors (as successor to Barclays Global Investors, N.A.)](https://www.sec.gov/Archives/edgar/data/1408198/000156459020004992/msci-ex10203_807.htm) | Filed Herewith | | | |
| 10.204 | [Amendment to the Previous Amendment to the Index License Agreement for Funds, dated as of March 1, 2019, by and between MSCI Inc. (formerly, Morgan Stanley Capital International Inc.) and BlackRock Fund Advisors (as successor to Barclays Global Investors, N.A.)](https://www.sec.gov/Archives/edgar/data/1408198/000156459020004992/msci-ex10204_806.htm) | Filed Herewith | | | |
| 10.205†† | [Amendment to the Index License Agreement for Funds, dated as of April 1, 2019, by and between MSCI Inc. (formerly, Morgan Stanley Capital International Inc.) and BlackRock Fund Advisors (as successor to Barclays Global Investors, N.A.)](https://www.sec.gov/Archives/edgar/data/1408198/000156459020004992/msci-ex10205_805.htm) | Filed Herewith | | | |
| 10.206†† | [Amendment to the Index License Agreement for Funds, dated as of April 1, 2019, by and between MSCI Inc. (formerly, Morgan Stanley Capital International Inc.) and BlackRock Fund Advisors (as successor to Barclays Global Investors, N.A.)](https://www.sec.gov/Archives/edgar/data/1408198/000156459020004992/msci-ex10206_804.htm) | Filed Herewith | | | |
| 10.207†† | [Amendment to the Index License Agreement for Funds, dated as of April 1, 2019, by and between MSCI Inc. (formerly, Morgan Stanley Capital International Inc.) and BlackRock Fund Advisors (as successor to Barclays Global Investors, N.A.)](https://www.sec.gov/Archives/edgar/data/1408198/000156459020004992/msci-ex10207_803.htm) | Filed Herewith | | | |
| 10.208†† | [Amendment to the Index License Agreement for Funds, dated as of April 1, 2019, by and between MSCI Inc. (formerly, Morgan Stanley Capital International Inc.) and BlackRock Fund Advisors (as successor to Barclays Global Investors, N.A.)](https://www.sec.gov/Archives/edgar/data/1408198/000156459020004992/msci-ex10208_802.htm) | Filed Herewith | | | |
| 10.209†† | [Amendment to the Index License Agreement for Funds, dated as of April 1, 2019, by and between MSCI Inc. (formerly, Morgan Stanley Capital International Inc.) and BlackRock Fund Advisors (as successor to Barclays Global Investors, N.A.)](https://www.sec.gov/Archives/edgar/data/1408198/000156459020004992/msci-ex10209_801.htm) | Filed Herewith | | | |
| 10.210†† | [Amendment to the Index License Agreement for Funds, dated as of April 1, 2019, by and between MSCI Inc. (formerly, Morgan Stanley Capital International Inc.) and BlackRock Fund Advisors (as successor to Barclays Global Investors, N.A.)](https://www.sec.gov/Archives/edgar/data/1408198/000156459020004992/msci-ex10210_800.htm) | Filed Herewith | | | |
| 10.211†† | [Amendment to the Index License Agreement for Funds, dated as of April 1, 2019, by and between MSCI Inc. (formerly, Morgan Stanley Capital International Inc.) and BlackRock Fund Advisors (as successor to Barclays Global Investors, N.A.)](https://www.sec.gov/Archives/edgar/data/1408198/000156459020004992/msci-ex10211_799.htm) | Filed Herewith | | | |
| 10.212†† | [Amendment to the Index License Agreement for Funds, dated as of October 1, 2019, by and between MSCI Inc. (formerly, Morgan Stanley Capital International Inc.) and BlackRock Fund Advisors (as successor to Barclays Global Investors, N.A.)](https://www.sec.gov/Archives/edgar/data/1408198/000156459020004992/msci-ex10212_798.htm) | Filed Herewith | | | |
| 10.213 | [Amendment to the Previous Amendment to the Index License Agreement for Funds, dated as of October 25, 2019, by and between MSCI Inc. (formerly, Morgan Stanley Capital International Inc.) and BlackRock Fund Advisors (as successor to Barclays Global Investors, N.A., which was succeeded by BlackRock Institutional Trust Company, N.A.)](https://www.sec.gov/Archives/edgar/data/1408198/000156459020004992/msci-ex10213_797.htm) | Filed Herewith | | | |
| 10.214†† | [Amendment to the Index License Agreement for Funds, dated as of November 25, 2019, by and between MSCI Inc. (formerly, Morgan Stanley Capital International Inc.) and BlackRock Fund Advisors (as successor to Barclays Global Investors, N.A.)](https://www.sec.gov/Archives/edgar/data/1408198/000156459020004992/msci-ex10214_796.htm) | Filed Herewith | | | |
| 10.215†† | [Amendment to the Index License Agreement for Funds, dated as of November 25, 2019, by and between MSCI Inc. (formerly, Morgan Stanley Capital International Inc.) and BlackRock Fund Advisors (as successor to Barclays Global Investors, N.A.)](https://www.sec.gov/Archives/edgar/data/1408198/000156459020004992/msci-ex10215_795.htm) | Filed Herewith | | | |
| 101.INS | XBRL Instance Document - the instance document does not appear in the Interactive Data File because its XBRL tags are embedded within the Inline XBRL document. | Filed Herewith | | | |
| 104.DEF | Cover Page Interactive Data File (formatted as Inline XBRL and contained in Exhibit 101) | Filed Herewith | | | |
| †† | Certain confidential portions of this Exhibit have been omitted pursuant to Item 601(b) of Regulation S-K because the identified confidential portions (i) are not material and (ii) would be competitively harmful if publicly disclosed. |
| Exhibit Number | Description | Form | File No. | Exhibit No. | Filing Date |
| --- | --- | --- | --- | --- | --- |
| Exhibit Number | Description | Form | File No. | Exhibit No. | Filing Date |
| --- | --- | --- | --- | --- | --- |
| 10.32* | [MSCI Equity Incentive Compensation Plan 2007 Founders Grant Award Certificate for Stock Options](http://www.sec.gov/Archives/edgar/data/1408198/000119312508040715/dex1019.htm) | 10-K | 001-33812 | 10.19 | 2/28/2008 |
| 10.34* | [RiskMetrics Group, Inc. 2000 Stock Option Plan](http://www.sec.gov/Archives/edgar/data/1408198/000095010310001664/dp17838_ex9901.htm) | S-8 | 333-165888 | 99.1 | 6/3/2010 |
| 10.35* | [RiskMetrics Group, Inc. 2004 Stock Option Plan](http://www.sec.gov/Archives/edgar/data/1408198/000095010310001664/dp17838_ex9902.htm) | S-8 | 333-165888 | 99.2 | 6/3/2010 |
| 10.36* | [RiskMetrics Group, Inc. 2007 Omnibus Incentive Compensation Plan](http://www.sec.gov/Archives/edgar/data/1408198/000119312513087988/d448124dex1038.htm) | 10-K | 001-33812 | 10.38 | 3/1/2013 |
| 10.43* | [Award Agreement for 2010 Price Vested Stock Option Award for the Chief Executive Officer under the MSCI Inc. 2007 Amended and Restated Equity Incentive Compensation Plan](http://www.sec.gov/Archives/edgar/data/1408198/000119312511017728/dex1054.htm) | 10-K | 001-33812 | 10.54 | 1/31/2011 |
| 10.80* | [Award Agreement for 2013 Non-Qualified Stock Option Award](http://www.sec.gov/Archives/edgar/data/1408198/000119312514077882/d640965dex1085.htm) | 10-K | 001-33812 | 10.85 | 2/28/2014 |
| 10.123* | [Transition and Release Agreement, dated as of February 10, 2016, by and between MSCI Inc. and Robert Qutub](http://www.sec.gov/Archives/edgar/data/1408198/000119312516482334/d20757dex10123.htm) | 10-K | 001-33812 | 10.123 | 2/26/2016 |
| 10.137 | [Letter Agreement to Cooperation Agreement, dated as of March 10, 2016, by and among MSCI Inc., Value Act Capital Management, L.P. and D. Robert Hale.](http://www.sec.gov/Archives/edgar/data/1408198/000119312516567595/d158720dex1010.htm) | 10-Q | 001-33812 | 10.10 | 4/29/2016 |
| 101.INS | XBRL Instance Document. | Filed Herewith | | | |
| †† | Confidential treatment requested. |
An excerpt. Shown here: 40 of 43 rewritten, all 26 added and all 14 removed. The counts are complete. For every sentence, read Item 15. Exhibits, Financial Statement Schedules in the FY2019 filing and the FY2018 filing.
Item 16. Form 10-K Summary
474 rewritten, 209 added, 237 removed, 584 unchanged
Read the full itemFY2019 item · filed February 18, 2020FY2018 item · filed February 22, 2019
| [added: |] MSCI INC. | | | | |
| [added: |] By: | | /S/ HENRY A. FERNANDEZ | | |
| | | [added: |] Name: | | Henry A. Fernandez |
| | | [added: |] Title: | | Chairman and Chief Executive Officer |
Date: February [removed: 22, 2019][added: 18, 2020]
[removed: POWER OF ATTORNEY][added: POWER OF ATTORNEY]
KNOW ALL PERSONS BY THESE PRESENTS, that each person whose signature appears below constitutes and appoints [removed: Kathleen A.][added: Linda S.]
[removed: Bogdan] [added: Gutowski] and Cecilia Aza, and each or any one of them, his or her true and lawful attorneys-in-fact and agents, with full powers of substitution and resubstitution, for him or her and in his or her name, place and stead, in the capacities indicated below, to sign any and all amendments to this Annual Report on Form 10-K and to file the same, with all exhibits thereto and other documents in connection therewith, with the Securities and Exchange Commission, hereby ratifying and confirming his or her signatures as they may be signed by his or her said attorneys-in-fact and agents, or their substitute or substitutes, to any and all amendments to this Annual Report on Form 10-K.
| /S/ HENRY A. FERNANDEZ | | Chairman and Chief Executive Officer | | February [removed: 22, 2019] [added: 18, 2020] |
| [removed: Kathleen A. Winters] [added: Linda S. Huber] | | (principal financial officer) | | |
| /S/ JENNIFER MAK | | [removed: Principal Accounting Officer and] Global Controller [added: and Head of Finance Operations] | | February [removed: 22, 2019] [added: 18, 2020] |
| /S/ ROBERT G. ASHE | | Director | | February [removed: 22, 2019] [added: 18, 2020] |
| /S/ BENJAMIN F. DUPONT | | Director | | February [removed: 22, 2019] [added: 18, 2020] |
| /S/ WAYNE EDMUNDS | | Director | | February [removed: 22, 2019] [added: 18, 2020] |
| /S/ ALICE W. HANDY | | Director | | February [removed: 22, 2019] [added: 18, 2020] |
| /S/ CATHERINE R. KINNEY | | Director | | February [removed: 22, 2019] [added: 18, 2020] |
| /S/ JACQUES P. PEROLD | | Director | | February [removed: 22, 2019] [added: 18, 2020] |
| Jacques P. Perold /S/ LINDA H. RIEFLER | | Director | | February [removed: 22, 2019] [added: 18, 2020] |
| /S/ GEORGE W. SIGULER | | Director | | February [removed: 22, 2019] [added: 18, 2020] |
| /S/ MARCUS L. SMITH | | Director | | February [removed: 22, 2019] [added: 18, 2020] |
[removed: INDEX] [added: INDEX] TO CONSOLIDATED FINANCIAL [removed: STATEMENTS][added: STATEMENTS]
| [Consolidated Statements of Financial Condition as of December 31, [removed: 2018] [added: 2019] and December 31, [removed: 2017](#CONSOLIDATED_STATEMENTS_FINANCIAL_CONDIT)] [added: 2018](#CONSOLIDATED_STATEMENTS_FINANCIAL_CONDIT)] | | [removed: F-4] [added: F-5] |
| [Consolidated Statements of Income for the Years Ended December 31, [removed: 2018,] [added: 2019,] December 31, [removed: 2017,] [added: 2018,] and December 31, [removed: 2016](#CONSOLIDATED_STATEMENTS_INCOME)] [added: 2017](#CONSOLIDATED_STATEMENTS_INCOME)] | | [removed: F-5] [added: F-6] |
| [Consolidated Statements of Comprehensive Income for the Years Ended December 31, [removed: 2018,] [added: 2019,] December 31, [removed: 2017,] [added: 2018,] and December 31, [removed: 2016](#CONSOLIDATED_STATEMENTS_COMPREHENSIVE_IN)] [added: 2017](#CONSOLIDATED_STATEMENTS_COMPREHENSIVE_IN)] | | [removed: F-6] [added: F-7] |
| [Consolidated Statements of Shareholders’ Equity (Deficit) for the Years Ended December 31, [removed: 2018,] [added: 2019,] December 31, [removed: 2017,] [added: 2018,] and December 31, [removed: 2016](#CONSOLIDATED_STATEMENTS_SHAREHOLDERS_EQU)] [added: 2017](#CONSOLIDATED_STATEMENTS_SHAREHOLDERS_EQU)] | | [removed: F-7] [added: F-8] |
| [Consolidated Statements of Cash Flows for the Years Ended December 31, [removed: 2018,] [added: 2019,] December 31, [removed: 2017,] [added: 2018,] and December 31, [removed: 2016](#CONSOLIDATED_STATEMENTS_CASH_FLOWS)] [added: 2017](#CONSOLIDATED_STATEMENTS_CASH_FLOWS)] | | [removed: F-8] [added: F-9] |
| [Notes to Consolidated Financial Statements](#NOTES_TO_CONSOLIDATED_FINANCIAL_STATEMEN) | | [removed: F-9] [added: F-10] |
[removed: REPORT] [added: REPORT] OF INDEPENDENT [removed: REGISTERED] [added: REGISTERED] PUBLIC ACCOUNTING [removed: FIRM][added: FIRM]
We have audited the accompanying consolidated statements of financial condition of MSCI Inc. and its subsidiaries (the “Company”) as of December 31, [removed: 2018] [added: 2019] and [removed: 2017,] [added: 2018,] and the related consolidated statements of income, [added: of] comprehensive income, [removed: shareholders’] [added: of shareholders'] equity (deficit) and [added: of] cash flows for each of the three years in the period ended December 31, [removed: 2018,] [added: 2019,] including the related notes (collectively referred to as the “consolidated financial statements”).
We also have audited the Company's internal control over financial reporting as of December 31, [removed: 2018,] [added: 2019,] based on criteria established in [removed: Internal] [added: *Internal] Control - Integrated [removed: Framework] [added: Framework*] (2013) issued by the Committee of Sponsoring Organizations of the Treadway Commission (COSO).
In our opinion, the consolidated financial statements referred to above present fairly, in all material respects, the financial position of the Company as of December 31, [removed: 2018] [added: 2019] and [removed: 2017,] [added: 2018,] and the results of its operations and its cash flows for each of the three years in the period ended December 31, [removed: 2018] [added: 2019] in conformity with accounting principles generally accepted in the United States of America.
Also in our opinion, the Company maintained, in all material respects, effective internal control over financial reporting as of December 31, [removed: 2018,] [added: 2019,] based on criteria established in [removed: Internal] [added: *Internal] Control - Integrated [removed: Framework] [added: Framework*] (2013) issued by the COSO.
[removed: Definition] [added: Definition] and Limitations of Internal Control over Financial [removed: Reporting][added: Reporting]
A company’s internal control over financial reporting includes those policies and procedures that (i) pertain to the maintenance of records that, in reasonable detail, accurately and fairly reflect the transactions and dispositions of the assets of the company; (ii) provide reasonable assurance that transactions are recorded as necessary to permit preparation of financial statements in accordance with generally accepted accounting principles, and that receipts and expenditures of the company are being made [added: only in accordance with authorizations of management and directors of the company; and (iii) provide reasonable assurance regarding prevention or timely detection of unauthorized acquisition, use, or disposition of the company’s assets that could have a material effect on the financial statements.]
[removed: February 22,] [added: | | |] 2019 [added: | | |]
[removed: MSCI INC.][added: MSCI INC.]
| | | [removed: 2018] [added: 2019] | | | | [added: | 2018 | | |] 2017 | | |
| Cash and cash [removed: equivalents] [added: equivalents, beginning of period] | | [removed: $] | 904,176 | | | [removed: $] | 889,502 | | [added: | | 791,834 | | |]
| Prepaid income taxes | | | [removed: 19,273] [added: 31,590] | | | | [removed: 15,103] [added: 19,273] | |
| Prepaid and other assets | | | [removed: 38,207] [added: 44,352] | | | | [removed: 34,927] [added: 38,207] | |
SIGNATURES
| --- | --- | --- | --- | --- | --- |
| | | | | | |
Huber, Robert J.
| /S/ LINDA S. HUBER | | Chief Financial Officer | | February 18, 2020 |
Change in Accounting Principle
As discussed in Note 1 to the consolidated financial statements, the Company changed the manner in which it accounts for leases in 2019.
Critical Audit Matters
The critical audit matter communicated below is a matter arising from the current period audit of the consolidated financial statements that was communicated or required to be communicated to the audit committee and that (i) relates to accounts or disclosures that are material to the consolidated financial statements and (ii) involved our especially challenging, subjective, or complex judgments.
The communication of critical audit matters does not alter in any way our opinion on the consolidated financial statements, taken as a whole, and we are not, by communicating the critical audit matter below, providing a separate opinion on the critical audit matter or on the accounts or disclosures to which it relates.
Unrecognized tax benefits
As described in Note 11 to the consolidated financial statements, the Company has $15.8 million of gross unrecognized tax benefits as of December 31, 2019.
Management regularly assesses the likelihood of additional assessments in each of the taxing jurisdictions in which it files income tax returns.
Once unrecognized tax benefits are established, management adjusts unrecognized tax benefits only when more information is available or when an event occurs necessitating a change.
As part of management’s periodic review of unrecognized tax benefits and based on new information regarding the status of federal and state examinations, the Company’s unrecognized tax benefits are remeasured.
The Company is under examination by the Internal Revenue Service (“IRS”) and other tax authorities in certain jurisdictions, including foreign jurisdictions, such as the United Kingdom, Switzerland and India, and states in which the Company has significant operations, such as New York.
The principal considerations for our determination that performing procedures relating to unrecognized tax benefits is a critical audit matter are there was significant judgment by management when determining unrecognized tax benefits, including a high degree of estimation uncertainty relative to the numerous and complex tax laws, frequency of tax examinations, and the nature of intercompany transactions and tax positions.
This in turn led to a high degree of auditor judgment, effort, and subjectivity in performing procedures to evaluate the timely identification and accurate measurement of unrecognized tax benefits.
Also, the evaluation of audit evidence available to support the unrecognized tax benefits is complex and required significant auditor judgment as the nature of the evidence is often highly subjective, and the audit effort involved the use of professionals with specialized skill and knowledge to assist in evaluating the audit evidence obtained.
Addressing the matter involved performing procedures and evaluating audit evidence in connection with forming our overall opinion on the consolidated financial statements.
These procedures included testing the effectiveness of controls relating to the identification and recognition of the unrecognized tax benefits, including controls relating to the completeness of balances and measurement of the unrecognized tax benefits.
These procedures also included, among others, (i) testing the information used in the calculation of the unrecognized tax benefits, including intercompany agreements, international, federal and state filing positions, and reviewing the final tax returns, (ii) testing the calculation of the unrecognized tax benefits, including management’s assessment of the technical merits of tax positions and estimates of the amount of tax benefit expected to be sustained, (iii) testing the completeness of management’s assessment of both the identification of uncertain tax positions and possible outcomes of each uncertain tax position, and (iv) evaluating the status and results of income tax audits with the relevant tax authorities.
Professionals with specialized skill and knowledge were used to assist in the evaluation of the completeness and measurement of the Company’s unrecognized tax benefits, including evaluating the reasonableness of management’s assessment of whether tax positions are more-likely-than-not of being sustained and the amount of potential benefit to be realized, the application of relevant tax laws, and estimated interest and penalties.
February 18, 2020
| | | 2019 | | | | 2018 | | |
| Cash and cash equivalents | | $ | 1,506,567 | | | $ | 904,176 | |
| Accounts receivable, net of allowances | | | 499,268 | | | | 473,433 | |
| Right of use assets | | | 166,406 | | | | — | |
| Intangible assets, net | | | 261,487 | | | | 280,803 | |
| Long-term operating lease liabilities | | | 164,144 | | | | — | |
| Net income | | | | | | | | | | | | | | | 563,648 | | | | | | | | 563,648 | |
| Dividends ($2.52 per common share) | | | | | | | | | | | 230 | | | | (221,305 | ) | | | | | | | (221,075 | ) |
| Balance at December 31, 2019 | | $ | 1,324 | | | $ | (3,565,784 | ) | | $ | 1,351,031 | | | $ | 2,199,294 | | | $ | (62,579 | ) | | $ | (76,714 | ) |
| --- | --- | --- | --- | --- | --- | --- | --- | --- | --- | --- | --- | --- | --- |
| Non-cash operating lease expense | | | 22,489 | | | | — | | | | — | | |
| Loss on extinguishment of debt | | | 16,794 | | | | — | | | | — | | |
| Long-term operating lease liabilities | | | (20,244 | ) | | | — | | | | — | | |
| | | | | | | | | | | | | | |
| | | | | | | | | | | | | | |
| Repayment of long-term debt | | | (513,125 | ) | | | — | | | | — | | |
SIGNATURES
| | | | | |
Winters, Frederick W.
| /S/ KATHLEEN A. WINTERS | | Chief Financial Officer and Treasurer | | February 22, 2019 |
| /S/ WENDY E. LANE | | Director | | February 22, 2019 |
| Wendy E. Lane | | | | |
| --- | --- | --- |
only in accordance with authorizations of management and directors of the company; and (iii) provide reasonable assurance regarding prevention or timely detection of unauthorized acquisition, use, or disposition of the company’s assets that could have a material effect on the financial statements.
| Accounts receivable (net of allowances of $1,027 and $1,700 at December 31, 2018 and December 31, 2017, respectively) | | | 473,433 | | | | 327,597 | |
| Property, equipment and leasehold improvements (net of accumulated depreciation and amortization of $185,505 and $171,280 at December 31, 2018 and December 31, 2017, respectively) | | | 90,877 | | | | 94,437 | |
| Intangible assets (net of accumulated amortization of $541,967 and $507,612 at December 31, 2018 and December 31, 2017, respectively) | | | 280,803 | | | | 321,836 | |
| --- | --- | --- | --- | --- | --- | --- | --- | --- | --- | --- | --- | --- |
| | | | | | | | | | | | | |
| | | | | | | | | | | | | |
| | | | | | | | | | | | | |
| | | | | | | | | | | | | |
| | | | | | | | | | | | | |
| | | | | | | | | | | | | |
| | | | | | | | | | | | | |
| --- | --- | --- | --- | --- | --- | --- | --- | --- | --- | --- | --- | --- |
| Balance at December 31, 2015 | | $ | 1,282 | | | $ | (1,395,695 | ) | | $ | 1,173,183 | | | $ | 1,158,462 | | | $ | (35,745 | ) | | $ | 901,487 | |
| Net income | | | | | | | | | | | | | | | 260,855 | | | | | | | | 260,855 | |
| Dividends ($1.00 per common share) | | | | | | | | | | | 34 | | | | (97,093 | ) | | | | | | | (97,059 | ) |
| Excess tax benefits from employee stock incentive plans | | | | | | | | | | | 7,625 | | | | | | | | | | | | 7,625 | |
| Excess tax benefits from employee stock incentive plans | | | | | | | | | | | | | | | | | | | | | | | \- | |
| --- | --- | --- | --- | --- | --- | --- | --- | --- | --- | --- | --- | --- |
| Cash and cash equivalents, beginning of period | | | 889,502 | | | | 791,834 | | | | 777,706 | |
| (1) Includes $43.6 million accrual for amounts payable after December 31, 2018 related to the estimated one-time tax charge on the deemed repatriation of historic earnings and profits of foreign subsidiaries. See Note 11, “Income Taxes,” for additional information. | | | | | | | | | | | | |
The Company’s policy is to consolidate all entities in which it owns more than 50% of the outstanding voting stock unless it does not control the entity.
It is also the Company’s policy to consolidate any variable interest entity for which the Company is the primary beneficiary, as required by the Financial Accounting Standards Board’s (“FASB”) Accounting Standards Codification (“ASC”) Subtopic 810-10, “Consolidations.” As of December 31, 2018, the Company had no such variable interest entities or investments.
The Company’s operating expenses are grouped and presented in the following activity categories: cost of revenues, selling and marketing, research and development and general and administrative.
Costs are assigned to these activity categories based on the nature of the expense to which they directly relate, or, when not directly attributable, based on an allocation method that considers the type of effort related to such activities.
Cost of revenues consists of costs related to the production and servicing of the Company’s products and services and primarily includes related information technology costs, including data center, platform and infrastructure costs; costs to acquire, produce and maintain market data information; costs of research to support and maintain existing products; costs of product management teams; costs of client service and consultant teams to support customer needs; as well as other support costs directly attributable to the cost of revenues including certain human resources, finance and legal costs.
Selling and marketing expenses consist of costs associated with acquiring new clients or selling new products or product renewals to existing clients and primarily includes the costs of MSCI’s sales force and marketing teams as well as costs incurred in other groups associated with acquiring new business, including product management, research, technology and sales operations.
Research and development expenses consist of costs to develop new or enhance existing products and the costs to develop new or improved technology and service platforms for the delivery of MSCI’s products and services and primarily includes the costs of development, research, product management, project management and the technology support associated with these efforts.
General and administrative expenses consist of costs primarily related to finance operations, human resources, office of the CEO, legal, corporate technology, corporate development and certain other administrative costs that are not directly attributed, but are instead allocated, to a product or service.
Certain prior period amounts have been reclassified to conform to the current period presentation.
The Company’s consolidated financial statements are prepared in accordance with accounting principles generally accepted in the United States of America (“GAAP”).
These accounting principles require the Company to
Discounts applied to the contract will be allocated based on the same proportion of standalone selling prices.
An excerpt. Shown here: 40 of 474 rewritten, 40 of 209 added and 40 of 237 removed. The counts are complete. For every sentence, read Item 16. Form 10-K Summary in the FY2019 filing and the FY2018 filing.