 filings.tools
Nasdaq 10-K 2018-12-31
Filed 2019-02-22. 22 sections, 591K characters. Original on sec.gov · Markdown · JSON
Cover and table of contents
10-K 1 ndaq1231201810-k.htm 10-K
UNITED STATES
SECURITIES AND EXCHANGE COMMISSION
Washington, D.C. 20549
FORM 10-K
| ☒ | ANNUAL REPORT PURSUANT TO SECTION 13 OR 15(d) OF THE SECURITIES EXCHANGE ACT OF 1934 |
| For the fiscal year ended December 31, 2018 | |
| OR | |
| ☐ | TRANSITION REPORT PURSUANT TO SECTION 13 OR 15(d) OF THE SECURITIES EXCHANGE ACT OF 1934 |
| For the transition period from ________ to ________ |
Commission file number: 000-32651
Nasdaq, Inc.
(Exact name of registrant as specified in its charter)
| Delaware (State or Other Jurisdiction of Incorporation or Organization) | 52-1165937 (I.R.S. Employer Identification No.) |
| One Liberty Plaza, New York, New York (Address of Principal Executive Offices) | 10006 (Zip Code) |
Registrant’s telephone number, including area code:
+1 212 401 8700
Securities registered pursuant to Section 12(b) of the Act:
| Title of each class | Name of each exchange on which registered |
| Common Stock, $.01 par value per share | The Nasdaq Stock Market |
Securities registered pursuant to Section 12(g) of the Act: None
Indicate by check mark if the registrant is a well-known seasoned issuer, as defined in Rule 405 of the Securities Act. Yes ☒ No ☐
Indicate by check mark if the registrant is not required to file reports pursuant to Section 13 or Section 15(d) of the Exchange Act. Yes ☐ No ☒
Indicate by check mark whether the registrant (1) has filed all reports required to be filed by Section 13 or 15(d) of the Securities Exchange Act of 1934 during the preceding 12 months (or for such shorter period that the registrant was required to file such reports), and (2) has been subject to such filing requirements for the past 90 days. Yes ☒ No ☐
Indicate by check mark whether the registrant has submitted electronically every Interactive Data File required to be submitted pursuant to Rule 405 of Regulation S-T (§232.405 of this chapter) during the preceding 12 months (or for such shorter period that the registrant was required to submit such files). Yes ☒ No ☐
Indicate by check mark if disclosure of delinquent filers pursuant to Item 405 of Regulation S-K (§229.405 of this chapter) is not contained herein, and will
not be contained, to the best of registrant’s knowledge, in definitive proxy or information statements incorporated by reference in Part III of this Form 10-K or any
amendment to this Form 10-K. ☒
Indicate by check mark whether the registrant is a large accelerated filer, an accelerated filer, a non-accelerated filer, a smaller reporting company, or an emerging growth company. See the definitions of “large accelerated filer,” “accelerated filer,” “smaller reporting company” and “emerging growth company” in Rule 12b-2 of the Exchange Act.
| Large accelerated filer | ☒ | Accelerated filer | ☐ |
| Non-accelerated filer | ☐ | Smaller reporting company | ☐ |
| Emerging growth company | ☐ |
If an emerging growth company, indicate by check mark if the registrant has elected not to use the extended transition period for complying with any new or revised financial accounting standards provided pursuant to Section 13(a) of the Exchange Act. ☐
Indicate by check mark whether the registrant is a shell company (as defined in Rule 12b-2 of the Exchange Act). Yes ☐ No ☒
As of June 30, 2018, the aggregate market value of the registrant’s common stock held by non-affiliates of the registrant was approximately $10.5 billion (this amount represents approximately 114.8 million shares of Nasdaq, Inc.’s common stock based on the last reported sales price of $91.27 of the common stock on The Nasdaq Stock Market on such date).
Indicate the number of shares outstanding of each of the issuer’s classes of common stock, as of the latest practicable date.
| Class | Outstanding at February 14, 2019 | |
| Common Stock, $.01 par value per share | 165,420,039 shares |
| DOCUMENTS INCORPORATED BY REFERENCE | |
| Document | Parts Into Which Incorporated |
| Certain portions of the Definitive Proxy Statement for the 2019 Annual Meeting of Stockholders | Part III |
Nasdaq, Inc.
About This Form 10-K
Throughout this Form 10-K, unless otherwise specified:
| • | “Nasdaq,” “we,” “us” and “our” refer to Nasdaq, Inc. |
| • | “Nasdaq Baltic” refers to collectively, Nasdaq Tallinn AS, Nasdaq Riga, AS, and AB Nasdaq Vilnius. |
| • | “Nasdaq BX” refers to the cash equity exchange operated by Nasdaq BX, Inc. |
| • | “Nasdaq BX Options” refers to the options exchange operated by Nasdaq BX, Inc. |
| • | “Nasdaq Clearing” refers to the clearing operations conducted by Nasdaq Clearing AB. |
| • | “Nasdaq GEMX” refers to the options exchange operated by Nasdaq GEMX, LLC. |
| • | “Nasdaq ISE” refers to the options exchange operated by Nasdaq ISE, LLC. |
| • | “Nasdaq MRX” refers to the options exchange operated by Nasdaq MRX, LLC. |
| • | “Nasdaq Nordic” refers to collectively, Nasdaq Clearing AB, Nasdaq Stockholm AB, Nasdaq Copenhagen A/S, Nasdaq Helsinki Ltd, and Nasdaq Iceland hf. |
| • | “Nasdaq PHLX” refers to the options exchange operated by Nasdaq PHLX LLC. |
| • | “Nasdaq PSX” refers to the cash equity exchange operated by Nasdaq PHLX LLC. |
- “The Nasdaq Options Market” refers to the options exchange operated by The Nasdaq Stock Market LLC.
| • | “The Nasdaq Stock Market” refers to the cash equity exchange operated by The Nasdaq Stock Market LLC. |
Nasdaq also provides as a tool for the reader the following list of abbreviations and acronyms that are used throughout this Annual Report on Form 10-K.
401(k) Plan: Voluntary Defined Contribution Savings Plan
2016 Credit Facility: $400 million senior unsecured term loan facility which matures on November 25, 2019
2017 Credit Facility: $1 billion senior unsecured revolving credit facility which matures on April 25, 2022
2019 Notes: $500 million aggregate principal amount of senior unsecured floating rate notes due March 22, 2019 with an interest rate equal to the three-month U.S. dollar LIBOR plus 0.39%
2020 Notes: $600 million aggregate principal amount of 5.55% senior unsecured notes due January 15, 2020
2021 Notes: €600 million aggregate principal amount of 3.875% senior unsecured notes due June 7, 2021
2023 Notes: €600 million aggregate principal amount of 1.75% senior unsecured notes due May 19, 2023
2024 Notes: $500 million aggregate principal amount of 4.25% senior unsecured notes due June 1, 2024
2026 Notes: $500 million aggregate principal amount of 3.85% senior unsecured notes due June 30, 2026
ASU: Accounting Standards Update
ATS: Alternative Trading System
BWise: BWise Beheer B.V. and its subsidiaries
CCP: Central Counterparty
CFTC: U.S. Commodity Futures Trading Commission
DEA: Designated Examining Authority
DWA: Dorsey, Wright & Associates, LLC
EMIR: European Market Infrastructure Regulation
Equity Plan: Nasdaq Equity Incentive Plan
ESPP: Nasdaq Employee Stock Purchase Plan
ETF: Exchange Traded Fund
ETP: Exchange Traded Product
eVestment: eVestment, Inc. and its subsidiaries
Exchange Act: Securities Exchange Act of 1934, as amended
FASB: Financial Accounting Standards Board
FICC: Fixed Income and Commodities Trading and Clearing
FINRA: Financial Industry Regulatory Authority
IPO: Initial Public Offering
ISE: U.S. Exchange Holdings, Inc. and its subsidiaries
LCH: LCH Group Holdings Limited
i
LIBOR: London Interbank Offered Rate
MiFID II: Update to the Markets in Financial Instruments Directive
MiFIR: Markets in Financial Instruments Regulation
MTF: Multilateral Trading Facility
NFX: Nasdaq Futures, Inc.
NPM: The NASDAQ Private Market, LLC
NSCC: National Securities Clearing Corporation
OCC: The Options Clearing Corporation
OTC: Over-the-Counter
Proxy Statement: Nasdaq’s Definitive Proxy Statement for the 2019 Annual Meeting of Stockholders
PSU: Performance Share Unit
Regulation NMS: Regulation National Market System
Regulation SCI: Regulation Systems Compliance and Integrity
SEC: U.S. Securities and Exchange Commission
SERP: Supplemental Executive Retirement Plan
SFSA: Swedish Financial Supervisory Authority
SMARTS: SMARTS Group Holdings Pty
S&P: Standard & Poor’s
S&P 500: S&P 500 Stock Index
SRO: Self-regulatory Organization
SSMA: Swedish Securities Markets Act 2007:528
TSR: Total Shareholder Return
U.S. GAAP: U.S. Generally Accepted Accounting Principles
UTP: Unlisted Trading Privileges
UTP Plan: Joint SRO Plan Governing the Collection, Consolidation, and Dissemination of Quotation and Transaction Information for Nasdaq-Listed Securities Traded on Exchanges on a UTP Basis
VAT: Value Added Tax
NASDAQ, the NASDAQ logos, and other brand, service or product names or marks referred to in this report are trademarks or services marks, registered or otherwise, of Nasdaq, Inc. and/or its subsidiaries. FINRA and TRADE REPORTING FACILITY are registered trademarks of FINRA.
This Annual Report on Form 10-K includes market share and industry data that we obtained from industry publications and surveys, reports of governmental agencies and internal company surveys. Industry publications and surveys generally state that the information they contain has been obtained from sources believed to be reliable, but we cannot assure you that this information is accurate or complete. We have not independently verified any of the data from third-party sources nor have we ascertained the underlying economic assumptions relied upon therein. Statements as to our market position are based on the most currently available market data. For market comparison purposes, The Nasdaq Stock Market data in this Annual Report on Form 10-K for IPOs is based on data generated internally by us, which includes best efforts underwritings; therefore, the data may not be comparable to other publicly-available IPO data. Data in this Annual Report on Form 10-K for new listings of equity securities on The Nasdaq Stock Market is based on data generated internally by us, which includes best efforts underwritings, issuers that switched from other listing venues, closed-end funds and ETPs. Data in this Annual Report on Form 10-K for IPOs and new listings of equity securities on the Nasdaq Nordic and Nasdaq Baltic exchanges also is based on data generated internally by us. IPOs and new listings data is presented as of period end. While we are not aware of any misstatements regarding industry data presented herein, our estimates involve risks and uncertainties and are subject to change based on various factors, including those discussed in “Item 1A. Risk Factors” in this Annual Report on Form 10-K.
Nasdaq intends to use its website, ir.nasdaq.com, as a means for disclosing material non-public information and for complying with SEC Regulation FD and other disclosure obligations. These disclosures will be included on Nasdaq’s website under “Investor Relations.”
ii
Forward-Looking Statements
The SEC encourages companies to disclose forward-looking information so that investors can better understand a company’s future prospects and make informed investment decisions. This Annual Report on Form 10-K contains these types of statements. Words such as “may,” “will,” “could,” “should,” “anticipates,” “envisions,” “estimates,” “expects,” “projects,” “intends,” “plans,” “believes” and words or terms of similar substance used in connection with any discussion of future expectations as to industry and regulatory developments or business initiatives and strategies, future operating results or financial performance, and other future developments identify forward-looking statements. These include, among others, statements relating to:
| • | our strategy, growth forecasts and 2019 outlook; |
| • | the integration of acquired businesses, including accounting decisions relating thereto; |
| • | the scope, nature or impact of acquisitions, divestitures, investments, joint ventures or other transactional activities; |
| • | the effective dates for, and expected benefits of, ongoing initiatives, including transactional activities and other strategic, restructuring, technology, de-leveraging and capital return initiatives; |
| • | our products, order backlog and services; |
| • | the impact of pricing changes; |
| • | tax matters; |
| • | the cost and availability of liquidity and capital; and |
| • | any litigation, or any regulatory or government investigation or action, to which we are or could become a party or which may affect us. |
Forward-looking statements involve risks and uncertainties. Factors that could cause actual results to differ materially from those contemplated by the forward-looking statements include, among others, the following:
| • | our operating results may be lower than expected; |
| • | our ability to successfully integrate acquired businesses or divest sold businesses or assets, including the fact that any integration or transition may be more difficult, time consuming or costly than expected, and we may be unable to realize synergies from business combinations, acquisitions, divestitures or other transactional activities; |
| • | loss of significant trading and clearing volumes or values, fees, market share, listed companies, market data products customers or other customers; |
| • | our ability to keep up with rapid technological advances and adequately address cybersecurity risks; |
| • | economic, political and market conditions and fluctuations, including interest rate and foreign currency risk, inherent in U.S. and international operations; |
| • | the performance and reliability of our technology and technology of third parties on which we rely; |
| • | any significant error in our operational processes; |
| • | our ability to continue to generate cash and manage our indebtedness; and |
| • | adverse changes that may occur in the litigation or regulatory areas, or in the securities markets generally. |
Most of these factors are difficult to predict accurately and are generally beyond our control. You should consider the uncertainty and any risk related to forward-looking statements that we make. These risk factors are discussed under the caption “Item 1A. Risk Factors,” in this Annual Report on Form 10-K. You are cautioned not to place undue reliance on these forward-looking statements, which speak only as of the date of this report. You should carefully read this entire Annual Report on Form 10-K, including “Item 7. Management’s Discussion and Analysis of Financial Condition and Results of Operations,” and the consolidated financial statements and the related notes. Except as required by the federal securities laws, we undertake no obligation to update any forward-looking statement, release publicly any revisions to any forward-looking statements or report the occurrence of unanticipated events. For any forward-looking statements contained in any document, we claim the protection of the safe harbor for forward-looking statements contained in the Private Securities Litigation Reform Act of 1995.
PART I
Item 1. Business
Overview
Nasdaq, Inc. is a leading provider of trading, clearing, marketplace technology, regulatory, securities listing, information and public and private company services. Our global offerings are diverse and include trading and clearing across multiple asset classes, trade management services, data products, financial indexes, capital formation solutions, corporate solutions, and market technology products and services. Our technology powers markets across the globe, supporting equity derivative trading, clearing and settlement, cash equity trading, fixed income trading, trading surveillance and many other functions.
History
Nasdaq was founded in 1971 as a wholly-owned subsidiary of FINRA. Beginning in 2000, FINRA restructured and broadened ownership in Nasdaq by selling shares to FINRA members, investment companies and issuers listed on The Nasdaq Stock Market. In connection with this restructuring, FINRA fully divested its ownership of Nasdaq in 2006, and The Nasdaq Stock Market became fully operational as an independent registered national securities exchange in 2007. In 2006, Nasdaq also reorganized its operations into a holding company structure.
In February 2008, Nasdaq and OMX AB combined their businesses. This transformational combination resulted in the expansion of our business from a U.S.-based exchange operator to a global exchange company offering technology that powers our own exchanges and markets as well as many other marketplaces around the world. In connection with this acquisition, we changed our corporate name to The NASDAQ OMX Group, Inc. We operated under this name until we rebranded our business as Nasdaq, Inc. in 2015.
Growth Strategy
Since our transformative combination with OMX AB in 2008, we have grown our business both organically and through acquisitions that have expanded our operations globally and increasingly diversified our product and service offerings. This evolution was driven by our ability to create opportunities in areas adjacent to our core businesses, many of which are non-transaction based and rooted in innovative technology. To keep pace with our understanding of future trends and to ensure our continued success in the evolving business environment, we have focused on refining our vision, mission and strategy:
Our Vision: We reimagine markets to realize the potential of tomorrow.
Our Mission: We bring together ingenuity, integrity and insights to deliver markets that accelerate economic progress and empower people to achieve their greatest ambitions.
Our Strategy: Our strategic direction is driven by our continuous examination of: (i) key macroeconomic, regulatory and technology trends, (ii) consultation with our clients about
short- and long-term trends in their businesses and (iii) the competitive landscape.
Under the strategic direction that we have been implementing over the past two years, we have focused on maximizing the resources, people and capital allocated to our largest growth opportunities, particularly in our Market Technology and Information Services businesses. In addition, we are committed to maintaining and enhancing the marketplace platform businesses that are core to Nasdaq, and reducing capital and resources in areas that we believe are not as strategic to our clients and have less growth potential within Nasdaq.
| • | Increasing Investment in Businesses Where We See the Highest Growth Opportunity. We have increased investment in areas that we believe help solve our clients’ biggest challenges and are likely to generate growth for our stockholders. In 2018, these businesses included: the data analytics business within our Information Services segment, NPM, within our Corporate Services segment, and our Market Technology segment (including our regulatory technology business). |
Consistent with this objective, we recently acquired eVestment and Quandl, Inc., which are part of our Information Services segment, and Sybenetix and Cinnober Financial Technology AB, or Cinnober, which are now part of our Market Technology segment. We also are investing further in the Market Technology segment through the Nasdaq Financial Framework, the expansion of our SMARTS products and customers, and our efforts to commercialize disruptive technologies, including blockchain, machine intelligence and the cloud.
| • | Sustaining Our Foundation. As we strive to grow our business, we also have focused on enhancing our leadership position in the marketplaces in which we operate as we continue to innovate with new functionality and strong market share in our core markets. |
| • | Optimizing Slower Growth Businesses. We continually review areas that are not critical to our core. In these areas, we expect to target resiliency and efficiency versus growth, and free up resources when possible to redirect toward greater opportunities. In furtherance of this strategy, in April 2018 we sold the public relations (Public Relations Solutions) and webcasting and webhosting (Digital Media Services) businesses within our Corporate Solutions business to West Corporation. In addition, in December 2018, we sold our 5.0% ownership interest in LCH. |
Products and Services
We manage, operate and provide our products and services in four business segments: Market Services, Corporate Services, Information Services and Market Technology.
Market Services
Our Market Services segment includes our Equity Derivative Trading and Clearing, Cash Equity Trading, FICC and Trade Management Services businesses.
Equity Derivative Trading and Clearing
We operate six electronic options exchanges in the U.S.: Nasdaq PHLX, The Nasdaq Options Market, Nasdaq BX Options, Nasdaq ISE, Nasdaq GEMX and Nasdaq MRX. These exchanges facilitate the trading of equity, ETF, index and foreign currency options. Together, our combined options market share in 2018 represented the largest share of the U.S. market for multiply-listed options on equities and ETFs. Our options trading platforms provide trading opportunities to both retail investors, algorithmic trading firms and market makers, who tend to prefer electronic trading, and institutional investors, who typically pursue more complex trading strategies and often trade on the floor.
In Europe, Nasdaq offers trading in derivatives, such as stock options and futures, index options and futures and fixed-income options and futures. Nasdaq Clearing offers clearing services for fixed-income options and futures, stock options and futures, index options and futures, and interest rate swaps by serving as the CCP. Nasdaq Clearing also operates a clearing service for the resale and repurchase agreement market.
Cash Equity Trading
In the U.S., we operate three cash equity exchanges: The Nasdaq Stock Market, Nasdaq BX and Nasdaq PSX. The Nasdaq Stock Market is the largest single venue of liquidity for trading U.S.-listed cash equities.
Our U.S. cash equity exchanges offer trading of both Nasdaq-listed and non-Nasdaq-listed securities. Market participants include market makers, broker-dealers, ATSs and registered securities exchanges. In addition, we operate a Canadian exchange with three independent markets, CXC, CX2 and CXD, for the trading of Canadian-listed securities.
In Europe, Nasdaq operates exchanges in Stockholm (Sweden), Copenhagen (Denmark), Helsinki (Finland), and Reykjavik (Iceland). We also operate exchanges in Tallinn (Estonia), Riga (Latvia) and Vilnius (Lithuania).
Collectively, the Nasdaq Nordic and Nasdaq Baltic exchanges offer trading in cash equities, depository receipts, warrants, convertibles, rights, fund units and ETFs. Our platform allows the exchanges to share the same trading system, which enables efficient cross-border trading and settlement, cross membership and a single source for Nordic data products. Settlement and registration of cash equity trading takes place in Sweden, Finland, Denmark and Ice
Showing the first 8K of 69K characters. Open the full section
Item 1A. Risk Factors
The risks and uncertainties described below are not the only ones facing us. Additional risks and uncertainties not presently known to us or that we currently believe to be immaterial may also adversely affect our business. If any of the following risks actually occur, our business, financial condition, or operating results could be adversely affected.
Economic conditions and market factors, which are beyond our control, may adversely affect our business and financial condition.
Our business performance is impacted by a number of factors, including general economic conditions in both the U.S. and Europe, market volatility, changes in investment patterns and priorities, and other factors that are generally beyond our control. To the extent that global or national economic conditions weaken and result in slower growth or recessions, our business is likely to be negatively impacted. Adverse market conditions could reduce customer demand for our services and the ability of our customers, lenders and other counterparties to meet their obligations to us. Poor economic conditions may result in a reduction in the demand for our products and services, including our market technology, data, index and corporate solutions, a decline in trading volumes or values and deterioration of the economic welfare of our listed companies. Over 73% of our revenues less transaction-based expenses in 2018 were recurring or subscription-based and if adverse conditions cause our customers to delay or cancel existing orders or subscriptions, our revenues will decline.
Trading volumes and values are driven primarily by general market conditions and declines in trading volumes or values may affect our market share and impact our pricing. In addition,
our Market Services businesses receive revenues from a relatively small number of customers concentrated in the financial industry, so any event that impacts one or more customers or the financial industry in general could impact our revenues.
The number of listings on our markets is primarily influenced by factors such as investor demand, the global economy, available sources of financing, and tax and regulatory policies. Adverse conditions may jeopardize the ability of our listed companies to comply with the continued listing requirements of our exchanges.
Information Services revenues may be significantly affected by global economic conditions. Professional subscriptions to our data products are at risk if staff reductions occur in financial services companies, which could result in significant reductions in our professional user revenue. In addition, adverse market conditions may cause reductions in the number of non-professional investors with investments in the market and in ETP assets under management tracking Nasdaq indexes.
There may be less demand for our Corporate Solutions or Market Technology products if global economic conditions are weak. Our customers historically cut back on purchases of new services and technology when growth rates decline, thereby reducing our opportunities to sell new products and services or upgrade existing products and services.
A reduction in trading volumes or values, market share of trading, the number of our listed companies, or demand for Information Services, Market Technology or Corporate Services products and services due to economic conditions or other market factors could adversely affect our business, financial condition and operating results.
The industries we operate in are highly competitive.
We face significant competition in our Market Technology, Information Services and Corporate Services businesses from other market participants. We face intense competition from other exchanges and markets for market share of trading activity and listings. This competition includes both product and price competition.
The liberalization and globalization of world markets has resulted in greater mobility of capital, greater international participation in local markets and more competition. As a result, both in the U.S. and in other countries, the competition among exchanges and other execution venues has become more intense. Marketplaces in both Europe and the U.S. have also merged to achieve greater economies of scale and scope.
Regulatory changes also have facilitated the entry of new participants in the European Union that compete with our European markets. The regulatory environment, both in the U.S. and in Europe, is structured to maintain this environment of intense competition. In addition, a high proportion of business in the securities markets is becoming concentrated in a smaller number of institutions and our revenue may therefore become concentrated in a smaller number of customers.
We also compete globally with other regulated exchanges and markets, ATSs, MTFs and other traditional and non-traditional execution venues. Some of these competitors also are our customers. Competitors may develop market trading platforms that are more competitive than ours. Competitors may leverage data more effectively or enter into strategic partnerships, mergers or acquisitions that could make their trading, listings, clearing, data or technology businesses more competitive than ours.
We face intense price competition in all areas of our business. In particular, the trading industry is characterized by intense price competition. We have in the past lowered prices, and in the U.S., increased rebates for trade executions to attempt to gain or maintain market share. These strategies have not always been successful and have at times hurt operating performance. Additionally, we have also been, and may once again be, required to adjust pricing to respond to actions by competitors and new entrants, which could adversely impact operating results. We also compete with respect to the pricing of data products and with respect to products for pre-trade book data and for post-trade last sale data. In addition, pricing in our Corporate Services, Index Licensing and Services and Market Technology businesses is subject to competitive pressures.
If we are unable to compete successfully in the industries in which we do business, our business, financial condition and operating results will be adversely affected.
System limitations or failures could harm our business.
Our businesses depend on the integrity and performance of the technology, computer and communications systems supporting them. If new systems fail to operate as intended or our existing systems cannot expand to cope with increased demand or otherwise fail to perform, we could experience unanticipated disruptions in service, slower response times and delays in the introduction of new products and services. These consequences could result in service outages, lower trading volumes or values, financial losses, decreased customer satisfaction and regulatory sanctions. Our markets and the markets that rely on our technology have experienced systems failures and delays in the past and could experience future systems failures and delays.
Although we currently maintain and expect to maintain multiple computer facilities that are designed to provide redundancy and back-up to reduce the risk of system disruptions and have facilities in place that are expected to maintain service during a system disruption, such systems and facilities may prove inadequate. If trading volumes increase unexpectedly or other unanticipated events occur, we may need to expand and upgrade our technology, transaction processing systems and network infrastructure. We do not know whether we will be able to accurately project the rate, timing or cost of any volume increases, or expand and upgrade our systems and infrastructure to accommodate any increases in a timely manner.
While we have programs in place to identify and minimize our exposure to vulnerabilities and work in collaboration with the technology industry to share corrective measures with our business partners, we
Showing the first 8K of 77K characters. Open the full section
Item 1B. Unresolved Staff Comments
None.
Item 2. Properties
The following is a description of our principal properties which are all leased.
| Location | Use | Size (approximate, in square feet) | |||
| Stockholm, Sweden | European headquarters | 264,000 | |||
| New York, New York | U.S. headquarters | 113,000 | |||
| Philadelphia, Pennsylvania | General office space | 74,000 | |||
| Atlanta, Georgia | General office space | 68,000 | |||
| New York, New York | Location of MarketSite | 66,000 | |||
| Bengaluru, India | General office space | 63,000 | |||
| New York, New York | General office space | 53,000 | |||
| Vilnius, Lithuania | General office space | 51,000 | |||
| Rockville, Maryland | General office space | 48,000 | |||
| Manila, Philippines | General office space | 36,000 | |||
| London, England | General office space | 31,000 | |||
| Sydney, Australia | General office space | 29,000 | |||
| Toronto, Canada | General office space | 26,000 |
Outside the U.S., we also maintain leased locations in Belgium, China, Denmark, Estonia, Finland, France, Germany, Hong Kong, Iceland, Italy, Japan, Latvia, Netherlands, Norway, Singapore, South Korea, Spain and Ukraine. In some countries, we maintain multiple locations.
Within the U.S., we also maintain leased locations in California, Colorado, Connecticut, Illinois, Massachusetts, New Jersey, Oregon, Virginia and Washington, DC. In some states, we maintain multiple locations.
In addition to the above, we also lease approximately 67,000 square feet of space used as data centers and disaster preparedness facilities in multiple locations.
Generally, our properties are not earmarked for use by a particular segment. Instead, most of our properties are used by two or more segments. We believe the facilities we occupy are adequate for the purposes for which they are currently used and are well-maintained.
Item 3. Legal Proceedings
See “Legal and Regulatory Matters - Litigation,” of Note 19, “Commitments, Contingencies and Guarantees,” to the consolidated financial statements, which is incorporated herein by reference.
Item 4. Mine Safety Disclosures
Not applicable.
PART II
Item 5. Market for Registrant’s Common Equity, Related Stockholder Matters and Issuer Purchases of Equity Securities
Market Information
Our common stock is listed on The Nasdaq Stock Market under the ticker symbol “NDAQ.” As of February 14, 2019, we had approximately 250 holders of record of our common stock.
Issuer Purchases of Equity Securities
Share Repurchase Program
See “Share Repurchase Program,” of Note 12, “Nasdaq Stockholders’ Equity,” to the consolidated financial statements for further discussion of our share repurchase program.
Purchases of Equity Securities by the Issuer and Affiliated Purchasers
The following table summarizes the share repurchase activity of our common stock during the fiscal quarter ended December 31, 2018:
| Period | (a) Total Number of Shares Purchased | (b) Average Price Paid Per Share | (c) Total Number of Shares Purchased as Part of Publicly Announced Plans or Programs | (d) Maximum Dollar Value of Shares that May Yet Be Purchased Under the Plans or Programs (in millions) | ||||||||||
| October 2018 | ||||||||||||||
| Share repurchase program | — | $ | — | — | $ | 332 | ||||||||
| Employee transactions(1) | 2,060 | 84.57 | N/A | N/A | ||||||||||
| November 2018 | ||||||||||||||
| Share repurchase program | — | $ | — | — | $ | 332 | ||||||||
| Employee transactions(1) | 1,370 | 87.33 | N/A | N/A | ||||||||||
| December 2018 | ||||||||||||||
| Share repurchase program | — | $ | — | — | $ | 332 | ||||||||
| Employee transactions(1) | 66,133 | 82.11 | N/A | N/A | ||||||||||
| Total Quarter Ended December 31, 2018 | ||||||||||||||
| Share repurchase program | — | $ | — | — | $ | 332 | ||||||||
| Employee transactions | 69,563 | $ | 82.29 | N/A | N/A |
| (1) | Represents shares we purchased from employees in connection with the settlement of employee tax withholding obligations arising from the vesting of restricted stock and PSUs. |
PERFORMANCE GRAPH
The following graph compares the total return of our common stock to the Nasdaq Composite Index, the S&P 500 and a selected peer group for the past five years. The peer group includes ASX Limited, CBOE, CME Group Inc., Deutsche Börse A.G., ICE, LSE, and TMX Group Limited. Information for the indices and the peer group is provided from December 31, 2013 through December 31, 2018. The figures represented below assume an initial investment of $100 in the common stock or index at the closing price on December 31, 2013 and the reinvestment of all dividends.
COMPARISON OF 5 YEAR CUMULATIVE TOTAL RETURN*
Among Nasdaq, Inc., the Nasdaq Composite Index, the S&P 500, and a Peer Group
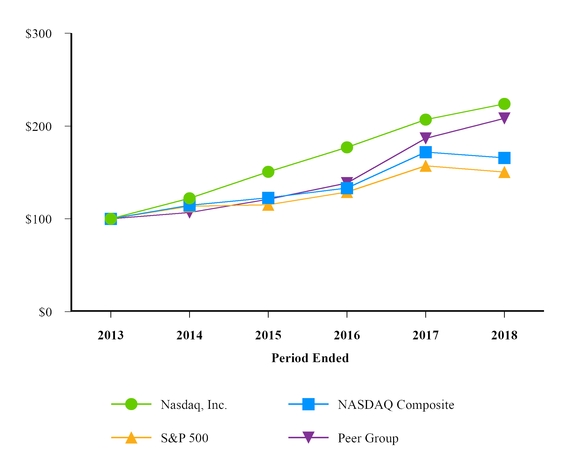
- $100 invested on 12/31/2013 in stock or index, including reinvestment of dividends.
| Fiscal Year Ended December 31, | |||||||||||||||||||||
| 2013 | 2014 | 2015 | 2016 | 2017 | 2018 | ||||||||||||||||
| Nasdaq, Inc. | $ 100 | $ | 122 | $ | 151 | $ | 177 | $ | 207 | $ | 224 | ||||||||||
| Nasdaq Composite | 100 | 115 | 123 | 133 | 172 | 166 | |||||||||||||||
| S&P 500 | 100 | 114 | 115 | 129 | 157 | 150 | |||||||||||||||
| Peer Group | 100 | 107 | 121 | 139 | 187 | 208 |
Copyright© 2019 Standard & Poor's, a division of S&P Global. All rights reserved.
Item 6. Selected Financial Data.
The following tables present selected financial data and should be read in conjunction with the consolidated financial statements and notes thereto of Nasdaq included elsewhere in this Form 10-K. We completed a divestiture in April 2018 and several acquisitions during the years ended December 31, 2018, 2017, 2016 and 2015 and included the financial results of such acquisitions in our consolidated financial statements from the respective acquisition dates. On January 1, 2018, we adopted Topic 606 using the full retrospective method which required restatement of 2017 and 2016 financial statements. Earlier periods were not restated.
Selected Financial Data
| Year Ended December 31, | ||||||||||||||||||||
| 2018 | 2017 | 2016 | 2015 | 2014 | ||||||||||||||||
| (in millions, except share and per share amounts) | ||||||||||||||||||||
| Statements of Income Data: | ||||||||||||||||||||
| Total revenues | $ | 4,277 | $ | 3,948 | $ | 3,704 | $ | 3,403 | $ | 3,500 | ||||||||||
| Transaction-based expenses | (1,751 | ) | (1,537 | ) | (1,428 | ) | (1,313 | ) | (1,433 | ) | ||||||||||
| Revenues less transaction-based expenses | 2,526 | 2,411 | 2,276 | 2,090 | 2,067 | |||||||||||||||
| Total operating expenses | 1,498 | 1,420 | 1,440 | 1,370 | 1,313 | |||||||||||||||
| Operating income | 1,028 | 991 | 836 | 720 | 754 | |||||||||||||||
| Net income attributable to Nasdaq | 458 | 729 | 106 | 428 | 414 | |||||||||||||||
| Per share information: | ||||||||||||||||||||
| Basic earnings per share | $ | 2.77 | $ | 4.38 | $ | 0.64 | $ | 2.56 | $ | 2.45 | ||||||||||
| Diluted earnings per share | $ | 2.73 | $ | 4.30 | $ | 0.63 | $ | 2.50 | $ | 2.39 | ||||||||||
| Cash dividends declared per common share | $ | 1.70 | $ | 1.46 | $ | 1.21 | $ | 0.90 | $ | 0.58 | ||||||||||
| Weighted-average common shares outstanding for earnings per share: | ||||||||||||||||||||
| Basic | 165,349,471 | 166,364,299 | 165,182,290 | 167,285,450 | 168,926,733 | |||||||||||||||
| Diluted | 167,691,299 | 169,585,031 | 168,800,997 | 171,283,271 | 173,018,849 |
| December 31, | ||||||||||||||||||||
| 2018 | 2017 | 2016 | 2015 | 2014 | ||||||||||||||||
| (in millions) | ||||||||||||||||||||
| Balance Sheets Data: | ||||||||||||||||||||
| Cash and cash equivalents and financial investments | $ | 813 | $ | 612 | $ | 648 | $ | 502 | $ | 601 | ||||||||||
| Default funds and margin deposits | 4,742 | 3,988 | 3,301 | 2,228 | 2,194 | |||||||||||||||
| Goodwill | 6,363 | 6,586 | 6,027 | 5,395 | 5,538 | |||||||||||||||
| Total assets | 15,700 | 15,354 | 13,411 | 11,257 | 11,542 | |||||||||||||||
| Long-term debt | 2,956 | 3,727 | 3,603 | 2,364 | 2,297 | |||||||||||||||
| Total Nasdaq stockholders' equity | 5,449 | 5,880 | 5,428 | 5,609 | 5,794 |
Item 7. Management’s Discussion and Analysis of Financial Condition and Results of Operations
The following discussion and analysis of the financial condition and results of operations of Nasdaq should be read in conjunction with our consolidated financial statements and related notes included in this Form 10-K, as well as the discussion under “Item 1A. Risk Factors.” For further discussion of our business, including our growth strategy, see “Item 1. Business.”
Overview
Our Company
We are a leading provider of trading, clearing, marketplace technology, regulatory, securities listing, information and public and private company services. Our global offerings are diverse and include trading and clearing across multiple asset classes, trade management services, market data products, financial indexes, investment data and analytics, capital formation solutions, corporate solutions, and market technology products and services. Our technology powers markets across the globe, supporting equity derivative trading, clearing and settlement, cash equity trading, fixed income trading, trading surveillance and many other functions.
Strategic Direction
Under the strategic direction that we have been implementing over the past two years, we have focused on maximizing the resources, people and capital allocated to our largest growth opportunities, particularly in our Market Technology and Information Services businesses. Our investments include our organic initiatives, notably the Nasdaq Financial Framework and related initiatives to deliver our marketplace expertise to banks, brokers and market operators outside the financial industry, as well as to provide compliance capabilities to the buy-side, and our eVestment private markets solutions. It also includes the recent acquisitions of Cinnober and Quandl.
The other pillar of our strategic direction is our continued investment and commitment to sustain our marketplace core. These foundational businesses, comprising the Market Services and Corporate Services segments, have earned Nasdaq a strategic position at the center of the capital markets in the U.S. and Europe. We have been able to create strategic relationships across broker-dealers, investment professionals, corporate clients, and other global market centers, which then provides the potential to expand those relationships with our technology and analytics capabilities.
The focus for both our non-trading (which includes Market Technology, Information Services, Corporate Services and Trade Management Services) and trading (which includes all of Market Services except Trade Management Services) businesses continues to include identifying organic growth and developing adjacent opportunities to our existing businesses. In addition, our strategy includes identifying acquisitions that both complement our strengths and extend our capabilities, as well as offer opportunities for revenue and expense synergies and increased shareholder value.
Factors Affecting Our Business
In broad terms, our business performance is impacted by a number of drivers including macroeconomic events affecting the risk and return of financial assets, investor sentiment, government and private sector demands for capital, the regulatory environment for capital markets, changes in technology, and changes in investment patterns and priorities. Our future revenues and net income will continue to be influenced by a number of domestic and international economic trends including, among others:
| • | the challenges created by the automation of market data consumption, including competition and the quickly evolving nature of the market data business; |
| • | regulatory changes relating to market structure, including market data, or affecting certain types of instruments, transactions, pricing structures or capital market participants; |
| • | the demand for information about, or access to, our markets, which is dependent on the products we trade, our importance as a liquidity center, and the quality and pricing of our market data and trade management services; |
| • | the demand for ETPs licensed to Nasdaq's indexes, enhanced analytics and other financial products based on our indexes as well as changes to the underlying assets associated with existing licensed financial products; |
| • | the outlook of our technology customers for capital market activity; |
| • | technological advances and members’ and customers’ demand for speed, efficiency, and reliability; |
| • | the acceptance of cloud-based services and advanced analytics by our customers and global regulators; |
| • | trading volumes and values in equity derivatives, cash equities and FICC, which are driven primarily by overall macroeconomic conditions; |
| • | the number of companies seeking equity financing, which is affected by factors such as investor demand, the global economy, and availability of diverse sources of financing, as well as tax and regulatory policies; |
| • | the demand by companies and other organizations for the products sold by our Corporate Solutions business, which is largely driven by the overall state of the economy and the attractiveness of our offerings; |
| • | continuing pressure in transaction fee pricing due to intense competition in the U.S. and Europe; and |
| • | competition related to pricing, product features and service offerings. |
The following chart presents the current consensus forecast for gross domestic product growth:
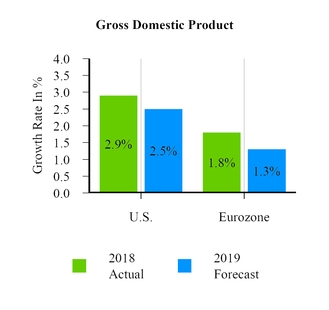
Although employment and wage data in many regions seems robust, indicating that the underlying global economy is still quite strong, leading indicators in many regions are pointing to a slowdown. Global gross domestic product growth forecasts have recently started to slow. In the last quarter of 2018, consensus 2019 growth forecasts have declined 0.1 percentage points to 2.5% for the U.S. and 0.5 percentage points to 1.3% for the Eurozone. There are a number of significant structural and political issues continuing to impact the global economy. Uncertainty surrounding the impact of China's economy, trade tariffs and Brexit contributed to an increase in market volatility in the last quarter of 2018 and continue to pose a risk to global growth.
Additional impacts on our business drivers include the international enactment and implementation of legislative and regulatory initiatives (notably MiFID II in Europe), the evolution of market participants’ trading and investment strategies, and the continued rapid progression and deployment of new technology in the financial services industry.
The business environment that we expect may influence our financial performance in 2019 may be characterized as follows:
| • | rapidly evolving technology for our businesses and their clients; |
| • | increased demand for applications using emerging technologies and sophisticated analytics by both new entrants and industry incumbents; |
| • | the expansion of the number of industries, and emergence of new industries, seeking to use advanced market technology; |
| • | intense competition among U.S. exchanges and dealer-owned systems for cash equity trading and strong competition between MTFs and exchanges in Europe for cash equity trading; and |
| • | globalization of exchanges, customers and competitors extending the competitive horizon beyond national markets. |
Business Segments
We manage, operate and provide our products and services in four business segments: Market Services, Corporate Services, Information Services and Market Technology. See Note 1, “Organization
Showing the first 8K of 122K characters. Open the full section
Item 7A. Quantitative and Qualitative Disclosures About Market Risk
Information about quantitative and qualitative disclosures about market risk is incorporated herein by reference from “Item 7. Management’s Discussion and Analysis of Financial Condition and Results of Operations - Quantitative and Qualitative Disclosures About Market Risk.”
Item 8. Financial Statements and Supplementary Data.
Nasdaq’s consolidated financial statements, including Consolidated Balance Sheets as of December 31, 2018 and 2017, Consolidated Statements of Income for the years ended December 31, 2018, 2017 and 2016, Consolidated Statements of Comprehensive Income (Loss) for the years ended December 31, 2018, 2017 and 2016, Consolidated Statements of Changes in Equity for the years ended December 31, 2018, 2017 and 2016, Consolidated Statements of Cash Flows for the years ended December 31, 2018, 2017 and 2016 and notes to our consolidated financial statements, together with a report thereon of Ernst & Young LLP, dated February 22, 2019, are attached hereto as pages F-1 through F-51 and incorporated by reference herein.
Summarized Quarterly Financial Data (Unaudited)
| 1st Qtr | 2nd Qtr | 3rd Qtr | 4th Qtr | |||||||||||||
| 2018 | 2018 | 2018 | 2018 | |||||||||||||
| (in millions, except per share amounts) | ||||||||||||||||
| Total revenues | $ | 1,151 | $ | 1,027 | $ | 964 | $ | 1,136 | ||||||||
| Transaction-based expenses | (485 | ) | (412 | ) | (364 | ) | (491 | ) | ||||||||
| Revenues less transaction-based expenses | 666 | 615 | 600 | 645 | ||||||||||||
| Total operating expenses | 393 | 346 | 354 | 404 | ||||||||||||
| Operating income | 273 | 269 | 246 | 241 | ||||||||||||
| Net income (loss) attributable to Nasdaq | $ | 177 | $ | 162 | $ | 163 | $ | (44 | ) | |||||||
| Basic earnings (loss) per share | $ | 1.06 | $ | 0.98 | $ | 0.99 | $ | (0.27 | ) | |||||||
| Diluted earnings (loss) per share | $ | 1.05 | $ | 0.97 | $ | 0.97 | $ | (0.27 | ) | |||||||
| Cash dividends declared per common share | $ | 0.82 | $ | — | $ | 0.44 | $ | 0.44 | ||||||||
| 1st Qtr | 2nd Qtr | 3rd Qtr | 4th Qtr | |||||||||||||
| 2017 | 2017 | 2017 | 2017 | |||||||||||||
| (in millions, except per share amounts) | ||||||||||||||||
| Total revenues | $ | 969 | $ | 994 | $ | 965 | $ | 1,019 | ||||||||
| Transaction-based expenses | (388 | ) | (398 | ) | (362 | ) | (389 | ) | ||||||||
| Revenues less transaction-based expenses | 581 | 596 | 603 | 630 | ||||||||||||
| Total operating expenses | 335 | 354 | 341 | 390 | ||||||||||||
| Operating income | 246 | 242 | 262 | 240 | ||||||||||||
| Net income attributable to Nasdaq | $ | 168 | $ | 146 | $ | 170 | $ | 246 | ||||||||
| Basic earnings per share | $ | 1.01 | $ | 0.88 | $ | 1.02 | $ | 1.47 | ||||||||
| Diluted earnings per share | $ | 0.99 | $ | 0.87 | $ | 1.00 | $ | 1.45 | ||||||||
| Cash dividends declared per common share | $ | 0.32 | $ | 0.38 | $ | 0.38 | $ | 0.38 |
Item 9. Changes in and Disagreements with Accountants on Accounting and Financial Disclosure
None.
Item 9A. Controls and Procedures
(a) Disclosure controls and procedures. Nasdaq’s management, with the participation of Nasdaq’s President and Chief Executive Officer, and Executive Vice President, Accounting and Corporate Strategy and Chief Financial Officer, has evaluated the effectiveness of Nasdaq’s disclosure controls and procedures (as defined in Rule 13a-15(e) and Rule 15d-15(e) under the Exchange Act) as of the end of the period covered by this report. Based upon that evaluation, Nasdaq’s President and Chief Executive Officer and Executive Vice President, Accounting and Corporate Strategy and Chief Financial Officer, have concluded that, as of the end of such period, Nasdaq’s disclosure controls and procedures are effective.
(b) Internal control over financial reporting. There have been no changes in Nasdaq’s internal control over financial reporting (as defined in Rule 13a-15(f) and Rule 15d-15(f) under the Exchange Act) that occurred during the quarter ended December 31, 2018 that have materially affected, or are reasonably likely to materially affect, Nasdaq’s internal control over financial reporting.
Management’s Report on Internal Control Over Financial Reporting
Management is responsible for the preparation and integrity of the consolidated financial statements appearing in the reports that we file with the SEC. The consolidated financial statements were prepared in conformity with U.S. generally accepted accounting principles and include amounts based on management’s estimates and judgments.
Management is also responsible for establishing and maintaining adequate internal control over Nasdaq’s financial reporting. Although there are inherent limitations in the effectiveness of any system of internal control over financial reporting, we maintain a system of internal control that is designed to provide reasonable assurance as to the fair and reliable preparation and presentation of the consolidated financial statements, as well as to safeguard assets from unauthorized use or disposition that could have a material effect on the financial statements.
Our management assessed the effectiveness of our internal control over financial reporting as of December 31, 2018, based on criteria established in Internal Control - Integrated Framework issued by the Committee of Sponsoring Organizations of the Treadway Commission (COSO) (2013 framework). This evaluation included review of the documentation of controls, evaluation of the design effectiveness of controls, testing of the operating effectiveness of controls and a conclusion on this evaluation. Based on its assessment, our management believes that, as of December 31, 2018, our internal control over financial reporting is effective.
Ernst & Young LLP, an independent registered public accounting firm, has issued an attestation report on Nasdaq’s internal control over financial reporting, which is included herein.
Report of Independent Registered Public Accounting Firm
To the Shareholders and the Board of Directors of Nasdaq, Inc.
Opinion on Internal Control over Financial Reporting
We have audited Nasdaq, Inc.’s internal control over financial reporting as of December 31, 2018, based on criteria established in Internal Control—Integrated Framework issued by the Committee of Sponsoring Organizations of the Treadway Commission (2013 framework) (the COSO criteria). In our opinion, Nasdaq, Inc. (the Company) maintained, in all material respects, effective internal control over financial reporting as of December 31, 2018, based on the COSO criteria.
We also have audited, in accordance with the standards of the Public Company Accounting Oversight Board (United States) (PCAOB), the consolidated balance sheets of the Company as of December 31, 2018 and 2017, and the related consolidated statements of income, comprehensive income (loss), changes in equity and cash flows for each of the three years in the period ended December 31, 2018, and the related notes and our report dated February 22, 2019 expressed an unqualified opinion thereon.
Basis for Opinion
The Company’s management is responsible for maintaining effective internal control over financial reporting and for its assessment of the effectiveness of internal control over financial reporting included in the accompanying Management’s Report on Internal Control Over Financial Reporting. Our responsibility is to express an opinion on the Company’s internal control over financial reporting based on our audit. We are a public accounting firm registered with the PCAOB and are required to be independent with respect to the Company in accordance with the U.S. federal securities laws and the applicable rules and regulations of the Securities and Exchange Commission and the PCAOB.
We conducted our audit in accordance with the standards of the PCAOB. Those standards require that we plan and perform the audit to obtain reasonable assurance about whether effective internal control over financial reporting was maintained in all material respects. Our audit included obtaining an understanding of internal control over financial reporting, assessing the risk that a material weakness exists, testing and evaluating the design and operating effectiveness of internal control based on the assessed risk, and performing such other procedures as we considered necessary in the circumstances. We believe that our audit provides a reasonable basis for our opinion.
Definition and Limitations of Internal Control Over Financial Reporting
A company’s internal control over financial reporting is a process designed to provide reasonable assurance regarding the reliability of financial reporting and the preparation of financial statements for external purposes in accordance with generally accepted accounting principles. A company’s internal control over financial reporting includes those policies and procedures that (1) pertain to the maintenance of records that, in reasonable detail, accurately and fairly reflect the transactions and dispositions of the assets of the company; (2) provide reasonable assurance that transactions are recorded as necessary to permit preparation of financial statements in accordance with generally accepted accounting principles, and that receipts and expenditures of the company are being made only in accordance with authorizations of management and directors of the company; and (3) provide reasonable assurance regarding prevention or timely detection of unauthorized acquisition, use, or disposition of the company’s assets that could have a material effect on the financial statements.
Because of its inherent limitations, internal control over financial reporting may not prevent or detect misstatements. Also, projections of any evaluation of effectiveness to future periods are subject to the risk that controls may become inadequate because of changes in conditions, or that the degree of compliance with the policies or procedures may deteriorate.
/s/ Ernst & Young LLP
New York, New York
February 22, 2019
Item 9B. Other Information
None.
PART III
Item 10. Directors, Executive Officers and Corporate Governance
Information about Nasdaq’s directors, as required by Item 401 of Regulation S-K, is incorporated by reference from the discussion under the caption “Board of Directors-Proposal I: Election of Directors” in Nasdaq’s Proxy Statement. Information about Nasdaq’s executive officers, as required by Item 401 of Regulation S-K, is incorporated by reference from the discussion under the caption “Other Items-Executive Officers” in the Proxy Statement. Information about Section 16 reports, as required by Item 405 of Regulation S-K, is incorporated by reference from the discussion under the caption “Other Items-Section 16(a) Beneficial Ownership Reporting Compliance” in the Proxy Statement. Information about Nasdaq’s code of ethics, as required by Item 406 of Regulation S-K, is incorporated by reference from the discussion under the caption “Corporate Governance” in the Proxy Statement. Information about Nasdaq’s nomination procedures, audit committee and audit committee financial experts, as required by Items 407(c)(3), 407(d)(4) and 407(d)(5) of Regulation S-K, is incorporated by reference from the discussions under the headings “Board of Directors-Proposal I: Election of Directors” and “Board of Directors-Board Committees” in the Proxy Statement.
Item 11. Executive Compensation
Information about Nasdaq’s director and executive compensation, as required by Items 402, 407(e)(4) and 407(e)(5) of Regulation S-K, is incorporated by reference from the discussions under the headings “Board of Directors-Director Compensation” and “Named Executive Officer Compensation” in the Proxy Statement.
Item 12. Security Ownership of Certain Beneficial Owners and Management and Related Stockholder Matters
Information about security ownership of certain beneficial owners and management, as required by Item 403 of Regulation S-K, is incorporated by reference from the discussion under the heading “Other Items-Security Ownership of Certain Beneficial Owners and Management” in the Proxy Statement.
Equity Compensation Plan Information
Nasdaq’s Equity Plan provides for the issuance of our equity securities to our officers and other employees, directors and consultants. In addition, most employees of Nasdaq and its subsidiaries are eligible to participate in the ESPP, at 85.0% of the fair market value of our common stock on the price calculation date. The Equity Plan and the ESPP have been approved previously by our stockholders. The following table sets forth information regarding outstanding options and shares reserved for future issuance under all of Nasdaq’s compensation plans as of December 31, 2018.
| Plan Category | Number of shares to be issued upon exercise of outstanding options, warrants and rights(a)(1) | Weighted-average exercise price of outstanding options, warrants and rights(b) | Number of shares remaining available for future issuance under equity compensation plans (excluding shares reflected in column(a))(c) | ||||||||
| Equity compensation plans approved by stockholders | 447,716 | $ | 49.19 | 12,870,957 | (2) | ||||||
| Equity compensation plans not approved by stockholders | — | — | — | ||||||||
| Total | 447,716 | $ | 49.19 | 12,870,957 | (2) |
| (1) | The amounts in this column include only the number of shares to be issued upon exercise of outstanding options, warrants and rights. As of December 31, 2018, we also had 2,735,356 shares to be issued upon vesting of outstanding restricted stock and PSUs. |
| (2) | This amount includes 10,986,965 shares of common stock that may be awarded pursuant to the Equity Plan and 1,883,992 shares of common stock that may be issued pursuant to the ESPP. |
Item 13. Certain Relationships and Related Transactions, and Director Independence
Information about certain relationships and related transactions, as required by Item 404 of Regulation S-K, is incorporated herein by reference from the discussion under the heading “Other Items-Certain Relationships and Related Transactions” in the Proxy Statement. Information about director independence, as required by Item 407(a) of Regulation S-K, is incorporated herein by reference from the discussion under the heading “Board of Directors-Proposal I: Election of Directors” in the Proxy Statement.
Item 14. Principal Accountant Fees and Services
Information about principal accountant fees and services, as required by Item 9(e) of Schedule 14A, is incorporated herein by reference from the discussion under the heading “Audit Committee Matters-Annual Evaluation and 2019 Selection of Independent Auditors” in the Proxy Statement.
PART IV
Item 15. Exhibits, Financial Statement Schedules.
(a)(1) Financial Statements
See “Index to Consolidated Financial Statements.”
(a)(2) Financial Statement Schedules
All schedules are omitted because they are not applicable or the required information is included in the consolidated financial statements or notes.
(a)(3) Exhibits
Exhibit Index
| Exhibit Number | ||
| 2.1 | Purchase Agreement, dated as of April 1, 2013, among Nasdaq, Inc. (f/k/a The NASDAQ OMX Group, Inc.), BGC Partners, Inc., BGC Holdings, L.P., BGC Partners, L.P., and, solely for purposes of certain sections thereof, Cantor Fitzgerald, L.P. (incorporated herein by reference to Exhibit 2.1 to the Quarterly Report on Form 10-Q for the quarter ended June 30, 2013 filed on August 8, 2013). | |
| 2.2 | Agreement and Plan of Merger, dated as of September 4, 2017, by and among eVestment, Inc., Nasdaq, Inc., Echo Holding Company and Insight Venture Partners, LLC (solely in its capacity as representative for eVestment’s securityholders) (incorporated herein by reference to Exhibit 2.1 to the Current Report on Form 8-K filed on September 8, 2017).† | |
| 3.1 | Amended and Restated Certificate of Incorporation of Nasdaq (incorporated herein by reference to Exhibit 3.1 to the Current Report on Form 8-K filed on January 28, 2014). | |
| 3.1.1 | Certificate of Elimination of Nasdaq’s Series A Convertible Preferred Stock (incorporated herein by reference to Exhibit 3.1.1 to the Current Report on Form 8-K filed on January 28, 2014). | |
| 3.1.2 | Certificate of Amendment of Nasdaq’s Amended and Restated Certificate of Incorporation (incorporated herein by reference to Exhibit 3.1 to the Current Report on Form 8-K filed on November 19, 2014). | |
| 3.1.3 | Certificate of Amendment of Nasdaq’s Amended and Restated Certificate of Incorporation (incorporated herein by reference to Exhibit 3.1 to the Current Report on Form 8-K filed on September 8, 2015). | |
| 3.2 | Nasdaq’s By-Laws (incorporated herein by reference to Exhibit 3.2 to the Current Report on Form 8-K filed on November 21, 2016). | |
| 4.1 | Form of Common Stock certificate (incorporated herein by reference to Exhibit 4.1 to the Quarterly Report on Form 10-Q for the quarter ended September 30, 2015 filed on November 4, 2015). | |
| 4.2 | Stockholders’ Agreement, dated as of February 27, 2008, between Nasdaq, Inc. (f/k/a The NASDAQ OMX Group, Inc.) and Borse Dubai Limited (incorporated herein by reference to Exhibit 10.2 to the Current Report on Form 8-K filed on March 3, 2008). | |
| 4.2.1 | First Amendment to Stockholders’ Agreement, dated as of February 19, 2009, between Nasdaq, Inc. (f/k/a The NASDAQ OMX Group, Inc.) and Borse Dubai Limited (incorporated herein by reference to Exhibit 4.10.1 to the Annual Report on Form 10-K for the year ended December 31, 2008 filed on February 27, 2009). | |
| 4.3 | Registration Rights Agreement, dated as of February 27, 2008, among Nasdaq, Inc. (f/k/a The NASDAQ OMX Group, Inc.), Borse Dubai Limited and Borse Dubai Nasdaq Share Trust (incorporated herein by reference to Exhibit 10.3 to the Current Report on Form 8-K filed on March 3, 2008). | |
| 4.3.1 | First Amendment to Registration Rights Agreement, dated as of February 19, 2009, among Nasdaq, Inc. (f/k/a The NASDAQ OMX Group, Inc.), Borse Dubai Limited and Borse Dubai Nasdaq Share Trust (incorporated herein by reference to Exhibit 4.11.1 to the Annual Report on Form 10-K for the year ended December 31, 2008 filed on February 27, 2009). | |
| 4.4 | Indenture, dated as of January 15, 2010, between Nasdaq (f/k/a The NASDAQ OMX Group, Inc.) and Wells Fargo Bank, National Association, as Trustee (incorporated herein by reference to Exhibit 4.1 to the Current Report on Form 8-K filed on January 19, 2010). | |
| 4.5 | First Supplemental Indenture, dated as of January 15, 2010, among Nasdaq (f/k/a The NASDAQ OMX Group, Inc.) and Wells Fargo Bank, National Association, as Trustee (incorporated herein by reference to Exhibit 4.2 to the Current Report on Form 8-K filed on January 19, 2010). | |
| 4.6 | Second Supplemental Indenture, dated as of December 21, 2010, among Nasdaq (f/k/a The NASDAQ OMX Group, Inc.) and Wells Fargo Bank, National Association, as Trustee (incorporated herein by reference to Exhibit 4.1 to the Current Report on Form 8-K filed on December 21, 2010). | |
| 4.7 | Stockholders’ Agreement, dated as of December 16, 2010, between Nasdaq, Inc. (f/k/a The NASDAQ OMX Group, Inc.) and Investor AB (incorporated herein by reference to Exhibit 4.12 to the Annual Report on Form 10-K for the year ended December 31, 2010 filed on February 24, 2011). | |
| 4.8 | Indenture, dated as of June 7, 2013, between Nasdaq, Inc. (f/k/a The NASDAQ OMX Group, Inc.) and Wells Fargo Bank, National Association, as Trustee (incorporated herein by reference to Exhibit 4.1 to the Current Report on Form 8-K filed on June 10, 2013). | |
| 4.9 | First Supplemental Indenture, dated as of June 7, 2013, among Nasdaq, Inc. (f/k/a The NASDAQ OMX Group, Inc.), Wells Fargo Bank, National Association, as Trustee, Deutsche Bank AG, London Branch, as paying agent, and Deutsche Bank Luxembourg S.A., as registrar and transfer agent (incorporated herein by reference to Exhibit 4.2 to the Current Report on Form 8-K filed on June 10, 2013). | |
| 4.10 | Second Supplemental Indenture, dated as of May 29, 2014, among Nasdaq, Inc. (f/k/a The NASDAQ OMX Group, Inc.) and Wells Fargo Bank, National Association, as Trustee (incorporated herein by reference to Exhibit 4.1 to the Current Report on Form 8-K filed on May 30, 2014). | |
| 4.11 | Third Supplemental Indenture, dated as of May 20, 2016, among Nasdaq, Inc., Wells Fargo Bank, National Association, as Trustee, and HSBC Bank USA, National Association, as paying agent and as registrar and transfer agent (incorporated herein by reference to the Current Report on Form 8-K filed on May 23, 2016). | |
| 4.12 | Fourth Supplemental Indenture, dated as of June 7, 2016, among Nasdaq, Inc. and Wells Fargo Bank, National Association, as Trustee (incorporated herein by reference to the Current Report on Form 8-K filed on June 7, 2016). | |
| 4.13 | Fifth Supplemental Indenture, dated as of September 22, 2017, among Nasdaq, Inc. and Wells Fargo Bank, National Association, as Trustee (incorporated herein by reference to Exhibit 4.1 to the Current Report on Form 8-K filed on September 22, 2017). | |
| 4.14 | Registration Rights Agreement, dated as of June 28, 2013, by and among Nasdaq, Inc. (f/k/a The NASDAQ OMX Group, Inc.), BGC Partners, Inc., BGC Holdings, L.P. and BGC Partners, L.P. (incorporated herein by reference to Exhibit 10.1 to the Current Report on Form 8-K filed on July 1, 2013). | |
| 10.1 | Amended and Restated Board Compensation Policy, effective on April 24, 2018 (incorporated herein by reference to Exhibit 10.1 to the Quarterly Report on Form 10-Q for the quarter ended June 30, 2018 filed on August 1, 2018).* | |
| 10.2 | Nasdaq Executive Corporate Incentive Plan, effective as of January 1, 2015 (incorporated herein by reference to Exhibit 10.1 to the Current Report on Form 8-K filed on May 11, 2015).* | |
| 10.3 | Form of Nasdaq Non-Qualified Stock Option Award Certificate (incorporated herein by reference to Exhibit 10.3 to the Annual Report on Form 10-K for the year ended December 31, 2010 filed on February 24, 2011).* | |
| 10.4 | Form of Nasdaq Restricted Stock Unit Award Certificate (employees) (incorporated herein by reference to Exhibit 10.2 to the Quarterly Report on Form 10-Q for the quarter ended June 30, 2018 filed on August 1, 2018).* | |
| 10.5 | Form of Nasdaq Restricted Stock Unit Award Certificate (directors) (incorporated herein by reference to Exhibit 10.3 to the Quarterly Report on Form 10-Q for the quarter ended June 30, 2018 filed on August 1, 2018).* | |
| 10.6 | Form of Nasdaq One-Year Performance Share Unit Agreement (incorporated herein by reference to Exhibit 10.4 to the Quarterly Report on Form 10-Q for the quarter ended June 30, 2018 filed on August 1, 2018).* | |
| 10.7 | Form of Nasdaq Three-Year Performance Share Unit Agreement (incorporated herein by reference to Exhibit 10.5 to the Quarterly Report on Form 10-Q for the quarter ended June 30, 2018 filed on August 1, 2018).* | |
| 10.8 | Form of Nasdaq Continuing Obligations Agreement (incorporated herein by reference to Exhibit 10.1 to the Quarterly Report on Form 10-Q for the quarter ended March 31, 2017 filed on May 10, 2017).* | |
| 10.9 | Amended and Restated Supplemental Executive Retirement Plan, dated as of December 17, 2008 (incorporated herein by reference to Exhibit 10.6 to the Annual Report on Form 10-K for the year ended December 31, 2008 filed on February 27, 2009).* | |
| 10.9.1 | Amendment No. 1 to Amended and Restated Supplemental Executive Retirement Plan, effective as of December 31, 2008 (incorporated herein by reference to Exhibit 10.6.1 to the Annual Report on Form 10-K for the year ended December 31, 2008 filed on February 27, 2009).* | |
| 10.10 | Nasdaq Supplemental Employer Retirement Contribution Plan, dated as of December 17, 2008 (incorporated herein by reference to Exhibit 10.7 to the Annual Report on Form 10-K for the year ended December 31, 2008 filed on February 27, 2009).* | |
| 10.11 | Employment Agreement between Nasdaq and Adena Friedman, made and entered into on November 14, 2016 and effective as of January 1, 2017 (incorporated herein by reference to Exhibit 10.10 to the Annual Report on Form 10-K for the year ended December 31, 2016 filed on March 1, 2017).* | |
| 10.12 | Nonqualified Stock Option Award Certificate to Adena T. Friedman from Nasdaq, Inc. in connection with grant made on January 3, 2017 (incorporated herein by reference to Exhibit 10.1 to the Quarterly Report on Form 10-Q for the quarter ended September 30, 2017 filed on November 7, 2017).* | |
| 10.13 | Employment Offer Letter, dated as of May 10, 2016, between Nasdaq, Inc. and Michael Ptasznik (incorporated herein by reference to Exhibit 10.2 to the Quarterly Report on Form 10-Q for the quarter ended March 31, 2017 filed on May 10, 2017).* | |
| 10.14 | Employment Agreement between Nasdaq and Edward Knight, effective as of July 29, 2018 (incorporated herein by reference to Exhibit 10.1 to the Quarterly Report on Form 10-Q for the quarter ended September 30, 2018 filed on November 6, 2018).* | |
| 10.15 | Employment Agreement between Nasdaq and Bradley J. Peterson, dated August 1, 2016 (incorporated herein by reference to Exhibit 10.1 to the Quarterly Report on Form 10-Q for the quarter ended September 30, 2016 filed on November 8, 2016).* | |
| 10.16 | Nasdaq Change in Control Severance Plan for Executive Vice Presidents and Senior Vice Presidents, effective November 26, 2013 (incorporated herein by reference to Exhibit 10.1 to the Current Report on Form 8-K filed on November 29, 2013).* | |
| 10.17 | Credit Agreement, dated as of April 25, 2017, among Nasdaq, Inc., the various lenders from time to time party thereto, Bank of America, N.A., as administrative agent and an issuing bank, and the other financial institutions party thereto (incorporated herein by reference to Exhibit 10.1 to the Current Report on Form 8-K filed on April 26, 2017). | |
| 10.18 | Credit Agreement, dated March 17, 2016, among Nasdaq, Inc., the various lenders party thereto and Bank of America, N.A., as Administrative Agent (incorporated herein by reference to the Current Report on Form 8-K filed on March 22, 2016). | |
| 10.18.1 | Amendment No. 1 to Credit Agreement, dated as of April 25, 2017, among Nasdaq, Inc., the lenders party thereto and Bank of America, N.A., as administrative agent (incorporated herein by reference to Exhibit 10.2 to the Current Report on Form 8-K filed on April 26, 2017). | |
| 10.19 | Form of Commercial Paper Dealer Agreement between Nasdaq, Inc., as Issuer, and the Dealer party thereto (incorporated herein by reference to Exhibit 10.3 to the Current Report on Form 8-K filed on April 26, 2017). | |
| 11 | Statement regarding computation of per share earnings (incorporated herein by reference from Note 13 to the consolidated financial statements under Part II, Item 8 of this Form 10-K). | |
| 21.1 | List of all subsidiaries. | |
| 23.1 | Consent of Ernst & Young LLP. | |
| 24.1 | Powers of Attorney. | |
| 31.1 | Certification of President and Chief Executive Officer pursuant to Section 302 of the Sarbanes-Oxley Act of 2002 (“Sarbanes-Oxley”). | |
| 31.2 | Certification of Executive Vice President, Accounting and Corporate Strategy and Chief Financial Officer pursuant to Section 302 of Sarbanes-Oxley. | |
| 32.1 | Certifications Pursuant to 18 U.S.C. Section 1350, as adopted pursuant to Section 906 of Sarbanes-Oxley. | |
| 101.INS | XBRL Instance Document.** | |
| 101.SCH | XBRL Taxonomy Extension Schema. | |
| 101.CAL | XBRL Taxonomy Extension Calculation Linkbase. | |
| 101.DEF | Taxonomy Extension Definition Linkbase. | |
| 101.LAB | XBRL Taxonomy Extension Label Linkbase. | |
| 101.PRE | XBRL Taxonomy Extension Presentation Linkbase. |
| * | Management contract or compensatory plan or arrangement. |
| ** | The following materials from the Nasdaq, Inc. Annual Report on Form 10-K for the year ended December 31, 2018, formatted in XBRL (eXtensible Business Reporting Language): (i) Consolidated Balance Sheets as of December 31, 2018 and December 31, 2017; (ii) Consolidated Statements of Income for the years ended December 31, 2018, 2017 and 2016; (iii) Consolidated Statements of Comprehensive Income (Loss) for the years ended December 31, 2018, 2017 and 2016; (iv) Consolidated Statements of Changes in Equity for the years ended December 31, 2018, 2017 and 2016; (v) Consolidated Statements of Cash Flows for the years December 31, 2018, 2017 and 2016; and (vi) notes to consolidated financial statements. |
| † | Schedules have been omitted pursuant to Item 601(b)(2) of Regulation S-K. Nasdaq hereby undertakes to furnish supplementally copies of any of the omitted schedules upon request by the SEC. |
| (b) | Exhibits: |
See Item 15(a)(3) above.
| (c) | Financial Statement Schedules: |
All schedules are omitted because they are not applicable or the required information is included in the consolidated financial statements or notes.
Item 16. Form 10-K Summary
None.
SIGNATURES
Pursuant to the requirements of Section 13 or 15(d) of the Securities Exchange Act of 1934, the registrant has duly caused this report to be signed on its behalf by the undersigned, thereunto duly authorized, on February 22, 2019.
| Nasdaq, Inc. | ||||
| (Registrant) | ||||
| By: | /s/ Adena T. Friedman | |||
| Name: | Adena T. Friedman | |||
| Title: | President and Chief Executive Officer |
Pursuant to the requirements of the Securities Exchange Act of 1934, this report has been signed below by the following persons on behalf of the registrant and in the capacities indicated as of February 22, 2019.
| Name | Title | |
| /s/ Adena T. Friedman | President and Chief Executive Officer and Director | |
| Adena T. Friedman | (Principal Executive Officer) | |
| /s/ Michael Ptasznik | Executive Vice President, Accounting and Corporate Strategy and Chief Financial Officer | |
| Michael Ptasznik | (Principal Financial Officer) | |
| /s/ Ann M. Dennison | Senior Vice President and Controller | |
| Ann M. Dennison | (Principal Accounting Officer) | |
| * | Chairman of the Board | |
| Michael R. Splinter | ||
| * | Director | |
| Melissa M. Arnoldi | ||
| * | Director | |
| Charlene T. Begley | ||
| * | Director | |
| Steven D. Black | ||
| * | Director | |
| Essa Kazim | ||
| * | Director | |
| Thomas A. Kloet | ||
| * | Director | |
| John D. Rainey | ||
| * | Director | |
| Lars R. Wedenborn | ||
| * Pursuant to Power of Attorney | ||
| By: | /s/ Edward S. Knight | |
| Edward S. Knight | ||
| Attorney-in-Fact |
Nasdaq, Inc.
INDEX TO CONSOLIDATED FINANCIAL STATEMENTS
The following consolidated financial statements of Nasdaq, Inc. and its subsidiaries are presented herein on the page indicated:
F- 1
Report of Independent Registered Public Accounting Firm
To the Shareholders and the Board of Directors of Nasdaq, Inc.
Opinion on the Financial Statements
We have audited the accompanying consolidated balance sheets of Nasdaq, Inc. (the Company) as of December 31, 2018 and 2017, the related consolidated statements of income, comprehensive income (loss), changes in equity and cash flows for each of the three years in the period ended December 31, 2018 and the related notes (collectively referred to as the “consolidated financial statements”). In our opinion, the consolidated financial statements present fairly, in all material respects, the financial position of the Company at December 31, 2018 and 2017, and the results of its operations and its cash flows for each of the three years in the period ended December 31, 2018, in conformity with U.S. generally accepted accounting principles.
We also have audited, in accordance with the standards of the Public Company Accounting Oversight Board (United States) (PCAOB), the Company's internal control over financial reporting as of December 31, 2018, based on criteria established in Internal Control-Integrated Framework issued by the Committee of Sponsoring Organizations of the Treadway Commission (2013 framework), and our report dated February 22, 2019 expressed an unqualified opinion thereon.
Basis for Opinion
These financial statements are the responsibility of the Company's management. Our responsibility is to express an opinion on the Company’s financial statements based on our audits. We are a public accounting firm registered with the PCAOB and are required to be independent with respect to the Company in accordance with the U.S. federal securities laws and the applicable rules and regulations of the Securities and Exchange Commission and the PCAOB.
We conducted our audits in accordance with the standards of the PCAOB. Those standards require that we plan and perform the audit to obtain reasonable assurance about whether the financial statements are free of material misstatement, whether due to error or fraud. Our audits included performing procedures to assess the risks of material misstatement of the financial statements, whether due to error or fraud, and performing procedures that respond to those risks. Such procedures included examining, on a test basis, evidence regarding the amounts and disclosures in the financial statements. Our audits also included evaluating the accounting principles used and significant estimates made by management, as well as evaluating the overall presentation of the financial statements. We believe that our audits provide a reasonable basis for our opinion.
/s/ Ernst & Young LLP
We have served as the Company’s auditor since 1986.
New York, New York
February 22, 2019
F- 2
Nasdaq, Inc.
Consolidated Balance Sheets
(in millions, except share and par value amounts)
| December 31, 2018 | December 31, 2017 | ||||||
| Assets | |||||||
| Current assets: | |||||||
| Cash and cash equivalents | $ | 545 | $ | 377 | |||
| Restricted cash | 41 | 22 | |||||
| Financial investments, at fair value | 268 | 235 | |||||
| Receivables, net | 384 | 356 | |||||
| Default funds and margin deposits | 4,742 | 3,988 | |||||
| Other current assets | 390 | 532 | |||||
| Total current assets | 6,370 | 5,510 | |||||
| Property and equipment, net | 376 | 400 | |||||
| Goodwill | 6,363 | 6,586 | |||||
| Intangible assets, net | 2,300 | 2,468 | |||||
| Other non-current assets | 291 | 390 | |||||
| Total assets | $ | 15,700 | $ | 15,354 | |||
| Liabilities | |||||||
| Current liabilities: | |||||||
| Accounts payable and accrued expenses | $ | 198 | $ | 177 | |||
| Section 31 fees payable to SEC | 109 | 128 | |||||
| Accrued personnel costs | 199 | 170 | |||||
| Deferred revenue | 194 | 161 | |||||
| Other current liabilities | 253 | 130 | |||||
| Default funds and margin deposits | 4,742 | 3,988 | |||||
| Short-term debt | 875 | 480 | |||||
| Total current liabilities | 6,570 | 5,234 | |||||
| Long-term debt | 2,956 | 3,727 | |||||
| Deferred tax liabilities, net | 501 | 225 | |||||
| Non-current deferred revenue | 87 | 126 | |||||
| Other non-current liabilities | 137 | 162 | |||||
| Total liabilities | 10,251 | 9,474 | |||||
| Commitments and contingencies | |||||||
| Equity | |||||||
| Nasdaq stockholders’ equity: | |||||||
| Common stock, $0.01 par value, 300,000,000 shares authorized, shares issued: 170,709,425 at December 31, 2018 and 172,373,432 at December 31, 2017; shares outstand |
Showing the first 8K of 258K characters. Open the full section