 filings.tools
Nasdaq (NDAQ) 10-K risk factor changes: FY2018 vs FY2017
The 2018-12-31 10-K against the 2017-12-31 one, compared heading by heading and sentence by sentence. One of these filings carries no fiscal year tag, so its year is the calendar year of the period end.
Item 1A74 rewritten49 added36 removed485 unchanged
All filing items1,522 rewritten1,215 added1,099 removed2,714 unchanged
Summary
counted, not written
- Item 1A headings could not be compared: only 0 carried over between the two years, which usually means one filing was read wrongly, so none is reported as new or removed.
- Sentence by sentence, 1,215 added, 1,099 removed, 1,522 rewritten and 2,714 unchanged across 18 items that differ.
Sentences by item
22 items, with every count and a link to each item that changed
Underlined words on a shaded ground are new in FY2018; struck-through words were in FY2017. Sentences that are wholly new or wholly gone are labelled rather than marked.
Item 1A. Risk Factors
74 rewritten, 49 added, 36 removed, 485 unchanged
Read the full itemFY2018 item · filed February 22, 2019FY2017 item · filed February 28, 2018
To the extent that global or national economic conditions [removed: weaken,] [added: weaken and result in slower growth or recessions,] our business is likely to be negatively impacted.
Poor economic conditions may result in a [added: reduction in the demand for our products and services, including our market technology, data, index and corporate solutions, a] decline in trading volumes or [removed: values,] [added: values and] deterioration of the economic welfare of our listed [removed: companies and a reduction in the demand for our products, including our data, index, corporate solutions and market technology products.][added: companies.]
[removed: In addition,] our Market Services businesses receive revenues from a relatively small number of customers concentrated in the financial industry, so any event that impacts one or more customers or the financial industry in general could impact our revenues.
Information Services revenues [removed: also] may be significantly affected by global economic conditions.
[removed: Finally, there] [added: There] may be less demand for our Corporate Solutions or Market Technology products if global economic conditions are weak.
A reduction in trading volumes or values, market share of trading, the number of our listed companies, or demand for [added: Information Services, Market Technology or Corporate Services products and services due to economic conditions or other market factors could adversely affect our business, financial condition and operating results.]
[removed: In addition,] [added: We face significant competition in] our [removed: Data Products, Index Licensing] [added: Market Technology, Information Services] and [removed: Services,] Corporate [removed: Solutions and Market Technology] [added: Services] businesses [removed: face significant competition] from other market participants.
Competitors may [added: leverage data more effectively or] enter into strategic partnerships, mergers or acquisitions that could make their trading, listings, clearing, data or technology businesses more competitive than ours.
If we are unable to compete successfully in [removed: this environment,] [added: the industries in which we do business,] our business, financial condition and operating results will be adversely affected.
Additionally, we have also been, and may once again be, required to adjust pricing to respond to actions by [removed: competitors,] [added: competitors and new entrants,] which could adversely impact operating results.
[added: We also compete with] respect to the pricing of data products and with respect to products for pre-trade book data and for post-trade last sale data.
If we [removed: are unable to compete] [added: do not] successfully [removed: in respect to] [added: identify, assess, monitor or manage] the [removed: pricing of our services and products,] [added: risks to which we are exposed,] our business, [added: reputation,] financial condition and operating results [removed: may] [added: could] be [added: materially] adversely affected.
If [added: new systems fail to operate as intended or] our [added: existing] systems cannot expand to cope with increased demand or otherwise fail to perform, we could experience unanticipated disruptions in service, slower response times and delays in the introduction of new products and services.
While we have programs in place to identify and minimize our exposure to vulnerabilities and work in collaboration with the technology industry to share corrective measures with our business partners, we cannot guarantee that such events will not [removed: occur in the future.]
We may spend substantial time and money developing new [removed: products] [added: products, initiatives] and [removed: initiatives.][added: enhancements to existing products.]
In our technology operations, we have invested substantial amounts in the development of system platforms, the rollout of [added: our platforms and the adoption of new technologies, such as blockchain, machine intelligence and the cloud.]
[added: Foreign governments may] seek to [added: obtain a foothold in U.S. critical infrastructure, hacktivists may seek to] deploy denial of service attacks to bring attention to their cause, insiders may pose a risk by human error or malicious activity and criminal organizations may seek to profit from stolen data.
[removed: If we are unable to develop our platforms to include other] products and markets, or if our platforms do not have the required functionality, performance, capacity, reliability and speed required by our business and our regulators, as well as by our customers, we may not be able to compete successfully.
We must rationalize, coordinate and integrate the operations of our acquired businesses, including [removed: eVestment] [added: Quandl] and [removed: Sybenetix.][added: Cinnober.]
[added: This process involves complex technological, operational and] personnel-related challenges, which are time-consuming and expensive and may disrupt our business.
While we have policies and procedures to identify, monitor and manage our risks and regulatory obligations, we cannot assure you that our policies and procedures will always be effective or that we [added: will always be successful in monitoring or evaluating the risks to which we are or may be exposed.]
In the future, we could be subject to [removed: SEC or other] regulatory investigations or enforcement proceedings that could result in substantial sanctions, including revocation of our operating licenses.
[removed: In addition, favorable] [added: Favorable] SEC rulings and interpretations can be challenged in and reversed by federal courts of appeals, reducing or eliminating the value of such prior interpretations.
There is a risk that trading will shift to exchanges that charge lower [added: fees because, among other reasons, they spend significantly less on regulation.]
In 2016, the SEC approved a plan [added: for Nasdaq and other exchanges] to establish a market-wide consolidated audit [removed: trail (CAT)] [added: trail, or CAT,] to improve regulators’ ability to monitor trading activity.
In addition to increased regulatory obligations, implementation of a consolidated audit trail [removed: could result] [added: has resulted] in significant additional expenditures, including to implement [removed: any] [added: the] new technology to meet any plan’s requirements.
In recent years, there has been increased regulatory and governmental focus on issues affecting the securities markets, including market [removed: structure and] [added: structure,] technological [removed: oversight.][added: oversight and transaction fees.]
[added: The SEC, FINRA and the national] securities exchanges have introduced several initiatives to ensure the oversight, integrity and resilience of markets.
Industry responses to the MiFID II and MiFIR [removed: rules] [added: rules, EU Benchmark Regulation] or other applicable rules could affect our operations in Europe.
While we support regulatory efforts to review and improve the structure, resilience and integrity of the markets, [removed: the adoption of] these proposed regulatory changes and future reforms could impose significant [removed: costs] [added: costs, including litigation costs,] and [added: other] obligations on the operation of our exchanges and processor systems and have other impacts on our business.
If the results of [added: appeals, or further actions by] the [removed: full SEC review and any subsequent appeal] [added: SEC,] are detrimental to our U.S. exchanges’ ability to charge for data products, there could be a negative impact on our revenues.
The [removed: new] MiFID II/MiFIR rules entail that the price for regulated data such as pre- and post-trade data shall be based [added: on cost plus a reasonable margin.]
Nasdaq, as technology provider to the UTP Operating Committee, [removed: proposed, received approval for, and] implemented [added: in 2016] measures to enhance the resiliency of the existing processor system.
Additionally, the UTP Operating Committee approved Nasdaq’s proposal to transfer the processor technology from its current enhanced platform to [removed: Nasdaq’s] [added: our] INET platform.
[removed: If,] [added: However if,] despite these improvement measures, future outages occur or the processor systems fail to function properly while we are operating the systems, it could have an adverse effect on our business, reputation, financial condition or operating results.
These errors may result in negative customer experiences that could damage our reputation, thereby causing loss of customers, loss of revenues [added: and liability for damages, thereby adversely affecting our business and financial results.]
The European Union General Data Protection Regulation, or GDPR, which [removed: becomes] [added: became] effective in May 2018, extends the scope of the European Union data protection law and requires companies to meet new requirements regarding the handling of personal data.
In addition to directly applying to certain Nasdaq business activities, [removed: we expect that] this regulation [removed: may impact] [added: impacts] many of our customers, which may affect their requirements and decisions related to services that we offer.
Although we have [added: implemented] a program [removed: underway] to address GDPR requirements, our efforts to comply with GDPR and other privacy and data protection laws may entail substantial expenses, may divert resources from other initiatives and projects, and could impact the services that we offer.
A stagnation or decline in the number of new listings on The Nasdaq Stock Market and the Nasdaq Nordic and Nasdaq Baltic exchanges [removed: will impact our revenues.][added: could cause a decrease in revenues for future years.]
Over 73% of our revenues less transaction-based expenses in 2018 were recurring or subscription-based and if adverse conditions cause our customers to delay or cancel existing orders or subscriptions, our revenues will decline.
In addition,
The industries we operate in are highly competitive.
occur in the future.
If we are unable to develop our platforms to include other
We have appealed this decision and the final outcome is still pending.
Our clearinghouse operations expose us to risks, including credit or liquidity risks that may include defaults by clearing members, or insufficiencies in margins or default funds.
We are subject to risks relating to our operation of a clearinghouse, including counterparty and liquidity risks, risk of defaults by clearing members and risks associated with adequacy of the customer margin and of default funds.
Our clearinghouse operations expose us to counterparties with
differing risk profiles.
We may be adversely impacted by the financial distress or failure of a clearing member, which may cause us negative financial impact, reputational harm or regulatory consequences, including litigation or regulatory enforcement actions.
In September 2018, a member of the Nasdaq Clearing commodities market defaulted due to an inability to post sufficient collateral to cover increased margin requirements for the positions of the relevant member, which had experienced losses due to sharp adverse movements in the Nordic - German power market spread.
Nasdaq Clearing followed default procedures and offset the future market risk on the defaulting member’s positions.
The default resulted in a loss of $133 million which was allocated to Nasdaq Clearing and the members of the commodities default fund in accordance with the liability waterfall.
To the extent that our regulatory capital and risk management policies are not adequate to manage future financial and operational risks in our clearinghouse, we may experience adverse consequences to our operating results or ability to conduct our business.
Counterparty risk of clients exists for Execution Access between the trade date and settlement date of the
NFX, our futures exchange, is also regulated by the CFTC and subject to a requirement to self-certify changes to these rules by filing with the CFTC.
Creating CAT has required the development and implementation of complex and costly technology.
This development effort has been funded by the SROs (including Nasdaq) in exchange for promissory
notes that Nasdaq expects to be repaid at such time that the SEC approves the assessment of fees for the funding of CAT.
The SEC could determine not to approve the assessment of such fees in which case some or all of the promissory notes would not be repaid.
In addition, the ongoing failure to timely launch or properly operate such technology exposes Nasdaq and other exchanges to SEC fines.
With respect to our regulated businesses, our business model can be severely impacted by policy decisions.
For example, the SEC has recently proposed an exchange transaction fee pilot program that could result in future regulatory changes and we, along with other stock exchanges, have challenged the SEC's order adopting the program in a court action.
Our opponents in some market are larger and better funded and, if successful in influencing certain policies, may successfully advocate for positions that adversely impact our business.
In October 2018, the SEC determined that we had not established that a fee for one of our data products was fair and reasonable, and also directed us to establish a procedure for reviewing other challenged fees.
We have appealed both SEC actions to a federal appeals court.
In 2018, we further improved the systems resiliency by adding the UTP SnapShot service.
Uncertainty relating to the United Kingdom’s exit from the European Union could cause uncertainty and adversely impact our business.
We continue to evaluate the potential effect of the United Kingdom’s planned departure from the European Union (commonly referred to as Brexit) on our business operations and financial results.
If the United Kingdom's membership in the European Union terminates without an agreement for the United Kingdom's orderly departure from the European Union there could be unfavorable consequences including a deterioration of general economic conditions, increased costs from re-imposition of tariffs on trade between the United Kingdom and European Union, volatility of foreign exchange rates and legal uncertainty.
Brexit may also have adverse tax effects on movement of products or activities between the UK and EU.
Currently, we do not anticipate that Brexit will have a material impact on our operations or our financial results.
While we have operations in the UK, these operations are limited in scope and not material to our overall business.
However, we may be impacted if our customers in the UK are subject to additional costs or restrictions in accessing our products or services.
In addition, the overall impact of Brexit may create further global economic uncertainty, which may adversely impact the activities of our customers.
| • | the quality of our products, including the reliability of our transaction-based, Corporate Solutions and Market |
| • | any negative publicity surrounding the use of our products or\\and services by our customers, including in connection with emerging asset classes such as crypto assets; and |
expectations for future revenue.
property, anti-money laundering, technology export, foreign asset controls, foreign corrupt practices areas, employee labor and employment areas, including anti-discrimination and fair-pay laws and regulations.
Information Services, Corporate Solutions or Market Technology products due to economic conditions or other market factors could adversely affect our business, financial condition and operating results.
Our industry is highly competitive.
Increased competition may result in a decline in our share of trading activity, listings and demand for the products we offer, thereby adversely affecting our operating results.
Price competition has affected and could continue to affect our business.
We are also subject to potential price competition from new competitors and from new and existing competitors.
We also compete with
In the future, our competitors may offer rebates for quotes and trades on their systems.
our platforms and the adoption of new technologies, such as blockchain, machine intelligence and the cloud.
Foreign governments may seek to obtain a foothold in U.S. critical infrastructure, hacktivists may
This process involves complex technological, operational and
will always be successful in monitoring or evaluating the risks to which we are or may be exposed.
We have appealed the SFSA’s decision, including the amount of the fine.
The court has not yet reached a decision on our appeal.
fees because, among other reasons, they spend significantly less on regulation.
The SEC, FINRA and the national
We have defeated two challenges in federal appeals court and an additional challenge at the administrative level within the SEC.
The decision defeating the challenge was reaffirmed at the administrative level in early 2018.
However, the industry challengers have sought additional review of that administrative decision by the full SEC.
That SEC review remains pending and, when resolved, it may be appealed to a federal court of appeals.
on cost plus a reasonable margin.
In 2013, we experienced an outage in the exclusive processor system we maintain and operate on behalf of all exchanges that trade Nasdaq-listed stocks that resulted in a market-wide trading halt lasting approximately three hours.
Following this system outage, the SEC and others evaluated all infrastructure that is critical to the national market system, including the processor systems.
and liability for damages, thereby adversely affecting our business and financial results.
Through December 31, 2017, we recognized revenue from new listings on The Nasdaq Stock Market on a straight-line basis over an estimated six-year service period.
As of January 1, 2018, we adopted ASU 2014-09; see “Recent Accounting Pronouncements,” of Note 2 “Summary of Significant Accounting Policies,” for further discussion.
Both before and after the adoption of this new accounting standard, a stagnant market for listings could cause a decrease in revenues for future years.
Long-Lived Assets,” of Note 2, “Summary of Significant Accounting Policies,” and Note 6, “Goodwill and Acquired Intangible Assets,” to the consolidated financial statements.
This clearing agreement will end on July 31, 2018, and will be replaced by a clearing agreement with the Industrial and Commercial Bank of China Financial Services LLC, or ICBC.
All of Execution Access’ obligations under the clearing arrangement with Cantor Fitzgerald are guaranteed by Nasdaq.
incurred.
We also maintain copyright protection on our branded materials
It is not our current intent to change this position.
However, the majority of cash held outside the U.S. is available for repatriation, but under current law in certain jurisdictions, could subject us to additional income taxes, less applicable foreign tax credits.
However, these methods may not be fully effective.
evaluated.
If our methods are not effective or we are not successful in monitoring or evaluating the risks to which we are or may be exposed, our business, reputation, financial condition and operating results could be materially adversely affected.
An excerpt. Shown here: 40 of 74 rewritten, 40 of 49 added and all 36 removed. The counts are complete. For every sentence, read Item 1A. Risk Factors in the FY2018 filing and the FY2017 filing.
Item 7. Management’s Discussion and Analysis of Financial Condition and Results of Operations
373 rewritten, 267 added, 263 removed, 513 unchanged
Read the full itemFY2018 item · filed February 22, 2019FY2017 item · filed February 28, 2018
[removed: Business] Overview
Our global offerings are diverse and include trading and clearing across multiple asset classes, trade management services, [added: market] data products, financial indexes, [added: investment data and analytics,] capital formation solutions, corporate solutions, and market technology products and services.
[added: Risk Factors.”] For further discussion of our business, [added: including our growth strategy,] see “Item 1.
In broad terms, our business performance is impacted by a number of drivers including macroeconomic events affecting the risk and return of financial assets, investor sentiment, government and private sector demands for capital, the regulatory environment for capital markets, [removed: changing technology, particularly] [added: changes] in [removed: the financial services industry,] [added: technology,] and changes in investment patterns and priorities.
| • | the challenges created by the automation of market data consumption, including competition and the quickly evolving nature of the [added: market] data business; |
| • | trading volumes and values in equity [removed: derivative,] [added: derivatives,] cash [removed: equity] [added: equities] and FICC, which are driven primarily by overall macroeconomic conditions; |
| • | the demand for information about, or access to, our markets, which is dependent on the products we trade, our importance as a liquidity center, and the quality and pricing of our [added: market] data and trade management services; |
| • | the demand for [added: ETPs] licensed [removed: ETPs,] [added: to Nasdaq's indexes,] enhanced analytics and other financial products based on our indexes as well as changes to the underlying assets associated with existing licensed financial products; |
| • | continuing pressure in transaction fee pricing due to intense competition in the U.S. and Europe; [added: and] |
| • | competition related to pricing, product features and service [removed: offerings; and] [added: offerings.] |
| • | regulatory changes relating to market [removed: structure] [added: structure, including market data,] or affecting certain types of instruments, transactions, pricing structures or capital market [removed: participants.] [added: participants;] |
The [added: following chart presents the] current consensus forecast for gross domestic product [removed: growth for the U.S. is 2.3% in 2017 and 2.5% in 2018 and the Eurozone is 2.3% in 2017 and 2.1% in 2018.][added: growth:]
[removed: While growth is accelerating, there] [added: There] are a number of significant structural and political issues continuing to impact the global economy.
Additional impacts on our business drivers include the international enactment and implementation of [removed: new] legislative and regulatory [removed: initiatives, notably] [added: initiatives (notably] MiFID II in [removed: Europe,] [added: Europe),] the evolution of market participants’ trading and investment strategies, and the continued rapid progression and deployment of new technology in the financial services industry.
The business environment that [removed: influences] [added: we expect may influence] our financial performance in [removed: 2018] [added: 2019] may be characterized as follows:
| • | rapidly evolving technology for our [removed: non-transactional] businesses and their clients; |
| • | the expansion of the number of [removed: industries] [added: industries,] and emergence of new industries, seeking to use advanced market technology; |
The focus for both our [removed: non-transactional] [added: non-trading (which includes Market Technology, Information Services, Corporate Services] and [removed: transactional] [added: Trade Management Services) and trading (which includes all of Market Services except Trade Management Services)] businesses continues to include identifying organic growth and developing adjacent opportunities to our existing businesses.
In addition, our strategy includes identifying acquisitions that both complement our strengths and extend our capabilities, [removed: and] [added: as well as] offer opportunities for revenue and expense synergies and increased shareholder value.
[added: |] Market Services [added: | $ | 3,435 | |]
[added: |] Information [removed: Services][added: Services: | | | | | | | | | | | | | | | | | |]
[added: |] Corporate [removed: Services][added: Services: | | | | | | | | | | | | | | | | | |]
[removed: See “Definitive Agreement to Sell our] [added: | (1) | Includes the revenues from the] Public Relations Solutions and Digital Media Services [removed: Businesses,”] [added: businesses which were sold in April 2018. Prior to the sale date, these revenues were included in our Corporate Solutions business. See “2018 Divestiture,”] of Note [removed: 21, “Subsequent Events,”] [added: 3, “Acquisitions and Divestiture,”] to the consolidated financial statements for further discussion. [added: |]
Market Technology [added: Revenues]
See Note 1, “Organization and Nature of Operations,” and Note 20, “Business Segments,” to the consolidated financial statements for further discussion of our reportable [removed: segments,] [added: segments and geographic data,] as well as how management allocates resources, assesses performance and manages these businesses as four separate segments.
| | | [removed: 2017] [added: 2018] | | | | [removed: 2016] [added: 2017] | | | | [removed: 2015] [added: 2016] | | |
| Total industry average daily volume (in millions) | | [removed: 14.7] [added: 18.2] | | | | [removed: 14.4] [added: 14.7] | | | | [removed: 14.8] [added: 14.4] | | |
| Nasdaq PHLX matched market share | | [removed: 17.3] [added: 15.7] | | % | | [removed: 16.0] [added: 17.3] | | % | | [removed: 16.7] [added: 16.0] | | % |
| The Nasdaq Options Market matched market share | | [removed: 9.2] [added: 9.4] | | % | | [removed: 7.8] [added: 9.2] | | % | | [removed: 7.7] [added: 7.8] | | % |
| Nasdaq BX Options matched market share | | [removed: 0.7] [added: 0.4] | | % | | [removed: 0.8] [added: 0.7] | | % | | 0.8 | | % |
| Nasdaq ISE Options matched market [removed: share(1)] [added: share] | | [removed: 9.1] [added: 8.8] | | % | | [removed: 5.8] [added: 9.1] | | % | | [removed: —] [added: 5.8] | | % |
| Nasdaq GEMX Options matched market [removed: share(1)] [added: share] | | [removed: 5.2] [added: 4.5] | | % | | [removed: 1.1] [added: 5.2] | | % | | [removed: —] [added: 1.1] | | % |
| Nasdaq MRX Options matched market [removed: share(1)] [added: share] | | 0.1 | | % | | 0.1 | | % | | [removed: —] [added: 0.1] | | % |
| Total matched market share executed on Nasdaq’s exchanges | | [removed: 41.6] [added: 38.9] | | % | | [removed: 31.6] [added: 41.6] | | % | | [removed: 25.2] [added: 31.6] | | % |
| Total average daily volume of options and futures [removed: contracts(2)] [added: contracts(1)] | | [removed: 330,218] [added: 339,139] | | | | [removed: 376,730] [added: 330,218] | | | | [removed: 380,725] [added: 376,730] | | |
| Total industry average daily share volume (in billions) | | [removed: 6.53] [added: 7.32] | | | | [removed: 7.35] [added: 6.53] | | | | [removed: 6.91] [added: 7.35] | | |
| Matched share volume (in billions) | | [removed: 295.9] [added: 358.5] | | | | [removed: 321.6] [added: 295.9] | | | | [removed: 327.7] [added: 321.6] | | |
| The Nasdaq Stock Market matched market share | | [removed: 14.2] [added: 15.9] | | % | | [removed: 14.0] [added: 14.2] | | % | | [removed: 15.8] [added: 14.0] | | % |
| Nasdaq BX matched market share | | [removed: 3.1] [added: 2.8] | | % | | [removed: 2.4] [added: 3.1] | | % | | [removed: 2.0] [added: 2.4] | | % |
| Nasdaq PSX matched market share | | 0.8 | | % | | [removed: 1.0] [added: 0.8] | | % | | 1.0 | | % |
Our Company
Strategic Direction
Under the strategic direction that we have been implementing over the past two years, we have focused on maximizing the resources, people and capital allocated to our largest growth opportunities, particularly in our Market Technology and Information Services businesses.
Our investments include our organic initiatives, notably the Nasdaq Financial Framework and related initiatives to deliver our marketplace expertise to banks, brokers and market operators outside the financial industry, as well as to provide compliance capabilities to the buy-side, and our eVestment private markets solutions.
It also includes the recent acquisitions of Cinnober and Quandl.
The other pillar of our strategic direction is our continued investment and commitment to sustain our marketplace core.
These foundational businesses, comprising the Market Services and Corporate Services segments, have earned Nasdaq a strategic position at the center of the capital markets in the U.S. and Europe.
We have been able to create strategic relationships across broker-dealers, investment professionals, corporate clients, and other global market centers, which then provides the potential to expand those relationships with our technology and analytics capabilities.
Factors Affecting Our Business
Although employment and wage data in many regions seems robust, indicating that the underlying global economy is still quite strong, leading indicators in many regions are pointing to a slowdown.
Global gross domestic product growth forecasts have recently started to slow.
In the last quarter of 2018, consensus 2019 growth forecasts have declined 0.1 percentage points to 2.5% for the U.S. and 0.5 percentage points to 1.3% for the Eurozone.
Uncertainty surrounding the impact of China's economy, trade tariffs and Brexit contributed to an increase in market volatility in the last quarter of 2018 and continue to pose a risk to global growth.
| Order intake (in millions)(8) | | $ | 223 | | | $ | 249 | | | $ | 235 | |
The comparability of our results of operations between reported periods is impacted by the divestiture of the Public Relations Solutions and Digital Media Services businesses in April 2018 and the acquisition of eVestment in October 2017.
In addition, on January 1, 2018, we adopted Topic 606 using the full retrospective method which required restatement of 2017 and 2016 financial statements.
| Operating expenses | | 1,498 | | | | 1,420 | | | | 1,440 | | | | 5.5 | % | | (1.4 | )% |
| Operating income | | 1,028 | | | | 991 | | | | 836 | | | | 3.7 | % | | 18.5 | % |
| Gain on sale of investment security | | 118 | | | | — | | | | — | | | | N/M | | | — | % |
| Net gain on divestiture of businesses | | 33 | | | | — | | | | — | | | | N/M | | | — | % |
| Income before income taxes | | 1,064 | | | | 872 | | | | 133 | | | | 22.0 | % | | 555.6 | % |
| Income tax provision | | 606 | | | | 143 | | | | 27 | | | | 323.8 | % | | 429.6 | % |
| Net income attributable to Nasdaq | | $ | 458 | | | $ | 729 | | | $ | 106 | | | (37.2 | )% | | 587.7 | % |
| Diluted earnings per share | | $ | 2.73 | | | $ | 4.30 | | | $ | 0.63 | | | (36.5 | )% | | 582.5 | % |
| Corporate Services | | 528 | | | | 501 | | | | 477 | | | | 5.4 | % | | 5.0 | % |
| Market Technology | | 270 | | | | 247 | | | | 241 | | | | 9.3 | % | | 2.5 | % |
| Other revenues(1) | | 56 | | | | 194 | | | | $ | 191 | | | (71.1 | )% | | 1.6 | % |
| Total revenues less transaction-based expenses | | $ | 2,526 | | | $ | 2,411 | | | $ | 2,276 | | | 4.8 | % | | 5.9 | % |
Section 31 fees decreased slightly in 2018 compared with 2017 and increased in 2017 compared with 2016.
Further impacting the increase in cash equity trading revenues in 2018 was an increase in Section 31 pass-through fee revenue.
Section 31 fees increased in both 2018 compared with 2017 and 2017 compared with 2016.
The increase in 2018 was primarily due to higher dollar value traded on Nasdaq’s exchanges, partially offset by lower average SEC fee rates.
For The Nasdaq Stock
The increase in 2018 was primarily due to an increase in our overall U.S. matched market share executed on Nasdaq’s exchanges and higher U.S. industry trading volumes, partially offset by a decrease in the U.S. rebate capture rate.
The increases were primarily due to higher Section 31 pass-through fees, as discussed above.
FICC revenues decreased in 2018 compared with the same period in 2017 primarily due to a decline in revenues related to U.S. fixed income products.
Trade management services revenues increased slightly in 2018 compared with 2017 primarily due to an increase in co-location revenues, partially offset by a decline in port connectivity revenues.
| | | | | | | | | | | | | | | | | | |
| --- | --- | --- | --- | --- | --- | --- | --- | --- | --- | --- | --- | --- | --- | --- | --- | --- | --- |
| | | | | | | | | | | | | | | | | | |
Risk Factors.”
Business Environment
Our non-transactional businesses provide technology to exchanges, clearing organizations and central securities depositories around the world.
We also offer companies and other organizations access to innovative products, software solutions and services that increase transparency, mitigate risk, improve board efficiency and facilitate better corporate governance.
In our transactional business, we serve listed companies, market participants and investors by providing derivative, commodities, cash equity, and fixed income markets, as well as clearing services, thereby facilitating economic growth and corporate entrepreneurship.
U.S. growth forecasts for 2018 remained relatively consistent through the first half of 2017, but have been climbing upwards since then and are currently 0.2 percentage points higher than forecasted at the start of the year.
Growth forecasts for the Eurozone in 2018 have steadily risen since an estimate of 1.5% at the start of 2017.
Consequently, sustained instability could return at any time, resulting in an increased level of market volatility, oscillating trading volumes, and a more cautious outlook by the clients of our non-trading segments.
Volatility was low throughout 2017; however, in early February 2018, volatility levels have increased.
Following weakness in 2016 and early 2017, IPO activity has picked up somewhat over the past three quarters particularly in our Nordics market.
2018 Outlook
For key trends that may influence our business, see “Item 1.
Business—2017 Strategic Review.” Our strategy consists of leveraging our market technology and information analytics expertise across our global capital markets.
Our non-transactional businesses seek to provide increased transparency and analytics to the investment community and to expand our market technology offerings that power trading, post-trade and surveillance.
New competitors will arise from both startups and existing firms and some existing competitors will fade as continued rapid technological change dominates the competitive environment in 2018.
We expect regulation to also evolve as governments and regulators respond to emerging technologies.
The growth of a market place economy in financial services and beyond, the need for new analytic capabilities to process the data explosion, the evolution of the investment management industry, and our existing clients continued outsourcing of non-differentiating capabilities and processes create opportunities for our non-transactional businesses in 2018 and beyond.
During 2018, we expect changes in both the competitive and regulatory environments in our transactional businesses.
In the U.S., in 2017, CBOE completed its acquisition of BATS, trading commenced on Miami's second option exchange, NYSE announced plans to begin trading Tape B and Tape C stocks on its floor and to launch a fourth equities exchange, and CBOE and CME began trading bitcoin futures.
We expect intense competition among U.S. equity and options marketplaces to continue and new entrants may also become part of our competitive environment.
While the willingness of new entrants to commence operations can be taken as a positive sign of good health in the trading industry, as these organizations implement their strategies, they have the potential to affect the competitive environment we face.
European regulators are currently moving forward on a number of new policies affecting the operation and infrastructure of the financial markets.
The implementation of EMIR is changing the way we structure and operate the Nordic clearinghouse.
MiFID II, as well as the new regulations in MiFIR, will change the way our trading business operates and will create both challenges in our existing businesses, as well as new opportunities for growth.
Industry response to the implementation of MiFID II in early 2018 is still unfolding, particularly the anticipated increase in the number of Systematic Internalizer trading systems operated by large financial service firms and electronic markets.
Consequently, 2018 is an uncertain environment for our European transactional businesses.
The following summarizes our 2018 outlook for each of our segments:
Economic and political uncertainty continue to weigh on the global economy and the debate over future fiscal and monetary policy in the U.S. and Europe continues.
We believe that our diversified businesses position us well to compete in an uncertain market environment.
If the increased levels of market volatility seen in early February 2018 persist into the balance of 2018, then many of the asset classes within our Market Services segment and our Data Products business will continue to benefit.
NFX continues to expand its offering in its energy derivative products.
We enter 2018 with plans to increase the number of clients running on the NFX platform, and we continue to identify additional products to bring to market.
We expect global markets to be influenced by significant change in 2018, driven by economic factors and regulatory initiatives in the U.S. and Europe as recently adopted regulations and legislation continue to be implemented.
These changes could result in the continued fragmentation of U.S. equity derivative and cash equity markets, and trading could continue to migrate from exchanges to OTC systems, particularly in the U.S. We anticipate that trading volumes will move to new types of broker-operated systems in Europe and potentially from exchanges to broker-operated systems as the industry responds to European Union regulatory changes.
As we look toward the future, we continue to make progress in leveraging emerging technologies to expand the ways we serve clients, with our launch of the trading and analytics product suite, Analytics Hub, which leverages machine intelligence in its logic to serve investors.
We also continue to make strides in expanding our Index Licensing and Services business, in particular in our smart beta products, which make up a strong portion of our growing total assets under management.
The 2017 acquisition of eVestment added the strong network effects of a leading analytics provider to our product offerings.
The performance of our market data products offerings reflect overall market conditions as well as our ability to offer market participants superior performance and efficiency relative to our competitors’ products.
Our market data products also face pressure from our customers’ desire to minimize their costs and from regulatory changes in the regions where we operate.
In addition, we continue to look for opportunities to expand product sales through additional geographic expansion and new opportunities such as eVestment.
An excerpt. Shown here: 40 of 373 rewritten, 40 of 267 added and 40 of 263 removed. The counts are complete. For every sentence, read Item 7. Management’s Discussion and Analysis of Financial Condition and Results of Operations in the FY2018 filing and the FY2017 filing.
Item 7A. Quantitative and Qualitative Disclosures About Market Risk
1 rewritten, 0 added, 0 removed, 1 unchanged
Read the full itemFY2018 item · filed February 22, 2019FY2017 item · filed February 28, 2018
Management’s Discussion and Analysis of Financial Condition and Results of [removed: Operations—Quantitative] [added: Operations - Quantitative] and Qualitative Disclosures About Market Risk.”
Item 1. Business
125 rewritten, 118 added, 114 removed, 282 unchanged
Read the full itemFY2018 item · filed February 22, 2019FY2017 item · filed February 28, 2018
Since [removed: 2008,] [added: our transformative combination with OMX AB] in [removed: addition to growing organically,] [added: 2008,] we have [removed: executed multiple] [added: grown our business both organically and through] acquisitions that have expanded our operations globally and increasingly diversified our product and service offerings.
[removed: We examined key macroeconomic, regulatory and technology trends, consulted with our clients about] short- and long-term trends in their businesses and [removed: assessed] [added: (iii)] the competitive landscape.
[removed: | • |] Our Vision: [removed: Reimagining] [added: We reimagine] markets to realize the potential of tomorrow. [removed: |]
[removed: | • |] Our Mission: We bring together ingenuity, integrity and insights to deliver markets that accelerate economic progress and empower people to achieve their greatest ambitions. [removed: |]
[removed: | • | Our Strategy: Under our renewed strategic direction,] [added: In addition,] we [removed: plan to maximize the resources, people and capital allocated] [added: are committed] to [removed: our biggest growth opportunities, particularly in our Market Technology] [added: maintaining] and [removed: Information Services businesses. We also commit to sustaining] [added: enhancing] the [removed: special] marketplace platform businesses that are core to Nasdaq, and [removed: to reduce] [added: reducing] capital and resources in areas that [added: we believe] are not as strategic to our clients and [removed: do not] have [removed: significant] [added: less] growth potential within Nasdaq. [removed: |]
| [removed: ◦] [added: •] | Increasing Investment in Businesses Where We See the Highest Growth Opportunity. We [removed: intend to increase] [added: have increased] investment in areas that we believe [added: help] solve our clients’ biggest challenges and [added: are likely to] generate growth for our stockholders. [removed: These] [added: In 2018, these] businesses [removed: include:] [added: included: the data analytics business within] our [added: Information Services segment, NPM, within our Corporate Services segment, and our] Market Technology [removed: segment, including] [added: segment (including] our regulatory technology [removed: businesses; the data analytics business] [added: business).] |
We also are investing further in the Market Technology segment through the Nasdaq Financial Framework, the expansion of our SMARTS products and [removed: customers] [added: customers,] and our efforts to commercialize disruptive technologies, including blockchain, machine intelligence and the cloud.
| [removed: ◦] [added: •] | Optimizing Slower Growth Businesses. We [removed: intend to] [added: continually] review areas that are not critical to our core. In these areas, we expect to target resiliency and efficiency versus growth, and [removed: thus] free up resources [added: when possible] to redirect toward greater opportunities. [added: In furtherance of this strategy, in April 2018 we sold the public relations (Public Relations Solutions) and webcasting and webhosting (Digital Media Services) businesses within our Corporate Solutions business to West Corporation. In addition, in December 2018, we sold our 5.0% ownership interest in LCH.] |
These exchanges facilitate the trading of [removed: equity options, ETF options,] [added: equity, ETF,] index [removed: options] and foreign currency options.
Together, our combined [added: options] market share [added: in 2018] represented the largest share of the U.S. market for multiply-listed options on equities and ETFs.
[added: Our] options trading platforms provide trading opportunities to both retail investors, algorithmic trading firms and market makers, who tend to prefer electronic trading, and institutional investors, who typically pursue more complex trading strategies and often trade on the floor.
In addition, we operate [added: a Canadian exchange with] three [removed: markets] [added: independent markets, CXC, CX2 and CXD,] for the trading of Canadian-listed securities.
In addition, Nasdaq owns two central securities depositories that provide [added: notary, settlement, central maintenance and other] services in the Baltic countries and Iceland.
The electronic trading platform provides real-time institutional trading of benchmark [removed: U.S. Treasury securities.]
The European portion of Nasdaq Fixed Income provides a wide range of products and services, such as [removed: listing, trading,] [added: trading] and clearing, for fixed income products in Sweden, Denmark, [removed: Finland] [added: Finland, Iceland, Lithuania] and [removed: Iceland.][added: Latvia.]
Nasdaq Stockholm is the largest bond listing venue in the Nordics, with more than [removed: 8,000] [added: 7,000] listed retail and institutional bonds.
[added: In addition, Nasdaq Nordic facilitates] the trading and clearing of Nordic fixed income derivatives in a unique market structure.
Nasdaq Commodities is the brand name for Nasdaq’s [removed: worldwide suite of] [added: European] commodity-related products and services.
Nasdaq Commodities’ offerings include [added: derivatives in] oil, power, natural gas and carbon emission markets, tanker and dry cargo freight, [removed: seafood derivatives,] [added: seafood,] iron ore, electricity certificates and clearing services.
Nasdaq Oslo ASA, which is authorized by the Norwegian Ministry of Finance and supervised by the Norwegian Financial Supervisory Authority, is the commodity derivatives exchange for European [removed: products and freight.][added: products.]
NFX currently lists cash-settled [removed: energy] derivatives [removed: based on key] [added: in freight and] energy [removed: benchmarks including] [added: (including] oil, natural gas and U.S. [removed: power.][added: power).]
Our marketplaces may be accessed via a number of different protocols used for quoting, order entry, trade [removed: reporting, DROP functionality] [added: reporting] and connectivity to various data feeds.
We provide co-location services to market participants, whereby [added: we offer] firms [removed: may lease] cabinet space and power to house their own equipment and servers within our data centers.
Additionally, we offer a number of wireless connectivity routes between select data centers using millimeter wave and [removed: microwave technology.]
[added: Services primarily consist of flexible] back-office systems, which allow customers to entirely or partly outsource their company’s back-office functions.
We offer customer and account registration, business registration, clearing and settlement, [added: electronic Nordic mutual fund service,] corporate action handling for reconciliations and reporting to authorities.
[removed: We currently provide] [added: As of December 31, 2018, we provided] Corporate Solutions products and services in the following key areas:
| • | Board & Leadership. We [removed: offer secure collaboration platforms] [added: provide a global technology offering that streamlines the meeting process] for [removed: boards] [added: board] of directors [removed: or any team collaborating on confidential documents] and [removed: initiatives.] [added: executive leadership teams and helps them accelerate decision marking and strengthen governance.] Our solutions protect sensitive data and facilitate productive collaboration, so board members and teams can work faster and more effectively. |
As of December 31, [removed: 2017,] [added: 2018,] a total of [removed: 2,949] [added: 3,058] companies listed securities on The Nasdaq Stock Market, with [removed: 1,413] [added: 1,418] listings on The Nasdaq Global Select Market, [removed: 819] [added: 852] on The Nasdaq Global Market and [removed: 717] [added: 788] on The Nasdaq Capital Market.
In [removed: 2017,] [added: 2018,] The Nasdaq Stock Market attracted [removed: 268] [added: 303] new listings, including [removed: 136] [added: 186] IPOs, [removed: 63%] [added: representing 72%] of U.S. IPOs in [removed: 2017.][added: 2018.]
| Switches from the New York Stock Exchange LLC, or NYSE, and NYSE American LLC, or NYSE American | [removed: 11] [added: 18] | |
| ETPs and Other Listings | [removed: 78] [added: 56] | |
The [removed: 11 NYSE-] [added: 18 NYSE] or NYSE [removed: American-listed] [added: American listed] companies that switched to The Nasdaq Stock Market, represented approximately [removed: $217.8] [added: $111.3] billion in market capitalization.
[removed: For smaller companies and growth] companies, we offer access to the financial markets through the Nasdaq First North alternative marketplaces.
As of December 31, [removed: 2017,] [added: 2018,] a total of [removed: 984] [added: 1,019] companies listed securities on our Nordic and Baltic exchanges and Nasdaq First North.
[added: Customers issue securities in the form of cash] equities, depository receipts, warrants, ETPs, convertibles, rights, options, bonds or fixed-income related products.
In [removed: 2017,] [added: 2018,] a total of [removed: 108] [added: 73] new companies listed on our Nordic and Baltic exchanges and Nasdaq First North.
In addition, [removed: 10] [added: 13] companies upgraded their listings from Nasdaq First North to the Nordic and Baltic exchanges.
Our Listing Services business also includes NPM, which provides liquidity solutions for private [removed: companies.][added: companies and private funds.]
[removed: Our] [added: Prior to the second quarter, our] Information Services segment [removed: includes] [added: was comprised of] our Data Products and our Index Licensing and Services businesses.
Growth Strategy
This evolution was driven by our ability to create opportunities in areas adjacent to our core businesses, many of which are non-transaction based and rooted in innovative technology.
To keep pace with our understanding of future trends and to ensure our continued success in the evolving business environment, we have focused on refining our vision, mission and strategy:
Our Strategy: Our strategic direction is driven by our continuous examination of: (i) key macroeconomic, regulatory and technology trends, (ii) consultation with our clients about
Under the strategic direction that we have been implementing over the past two years, we have focused on maximizing the resources, people and capital allocated to our largest growth opportunities, particularly in our Market Technology and Information Services businesses.
Consistent with this objective, we recently acquired eVestment and Quandl, Inc., which are part of our Information Services segment, and Sybenetix and Cinnober Financial Technology AB, or Cinnober, which are now part of our Market Technology segment.
| • | Sustaining Our Foundation. As we strive to grow our business, we also have focused on enhancing our leadership position in the marketplaces in which we operate as we continue to innovate with new functionality and strong market share in our core markets. |
U.S. Treasury securities.
microwave technology.
Our Corporate Services businesses deliver critical capital market and governance solutions across the lifecycle of public and private companies.
We help organizations enhance their ability to understand and expand their global shareholder base, and improve corporate governance through our suite of advanced technology, analytics, and consultative services.
| • | Investor Relations Intelligence. We offer a global team of consultative experts that deliver advisory services including Strategic Capital Intelligence, Shareholder Identification and Perception Studies as well as an industry-leading software, Nasdaq IR Insight®, to investor relations professionals. These solutions allow investor relations officers to better manage their investor relations programs, understand their investor base, target new investors, manage meetings and consume key data elements such as equity research, consensus estimates and news. |
| • | Governance, Risk & Compliance. We offer a global suite of managed services and solutions for risk management, internal audit and regulatory compliance. |
In April 2018, we sold the Public Relations Solutions and Digital Media Services products and services that formerly
were part of our Corporate Solutions business to West Corporation.
In February 2019, we entered into an agreement with SAI Global to sell BWise, our internal audit, regulatory compliance management, and operational risk management software that comprises our governance, risk and compliance product offering.
Subject to regulatory approvals, works council and other representative body consultations and notifications in applicable jurisdictions, as well as other customary closing conditions, the transaction is expected to close in the first half of 2019.
| IPOs | 186 | |
| Total | 303 | |
Notable switches included Xcel Energy, Inc., United Continental Holdings, Inc., and Regency Centers Corporation.
For smaller companies and growth
In December 2018, we launched a Corporate Bond exchange for the listing and trading of corporate bonds.
The new exchange operates pursuant to The Nasdaq Stock Market exchange license and is powered by the Nasdaq Financial Framework, similar to the Nasdaq Fixed Income platform.
Surveillance is conducted by the Nasdaq regulatory team, assisted by our SMARTS surveillance solution.
Beginning in the second quarter of 2018, our Information Services segment was recategorized into the following businesses:
| • | Market Data; |
| • | Investment Data & Analytics. |
Market Data
proprietary products, including Nasdaq TotalView, our flagship market depth quote product.
Index
Nasdaq Dorsey Wright, or NDW, a market leader in data analytics, passive indexing, smart beta strategies, provides model-based strategies and analysis to support the financial advisor community, as well as Systematic Relative Strength strategies to manage separately and unified managed accounts.
Investment Data & Analytics
Our Investment Data & Analytics business is a leading content and analytics cloud-based solutions provider used by asset managers, investment consultants and asset owners to help facilitate better investment decisions.
Additionally the Nasdaq Fund Network gathers and distributes daily net asset values from over 35,000 funds and other investment vehicles across North America.
In November 2018, we acquired Quandl, Inc., a premier marketplace for unique, alpha-generating alternative datasets as well as for economic and financial datasets.
Our solutions can also be used in the creation of new asset classes, and in 2018, Nasdaq partnered with non-capital markets customers, including those in insurance liabilities securitization and digital advertising futures trading.
Nasdaq’s market technology is utilized by leading markets in the U.S., Europe and Asia as well as emerging markets in the Middle East, Latin America, and Africa.
Additionally, more than 160 market participants leverage our surveillance technology globally to manage their integrity obligations and assist them in complying with market rules, regulations and internal market surveillance policies.
In January 2019, we completed a public offer to acquire Cinnober, a major Swedish financial technology provider to brokers, exchanges and clearinghouses worldwide that provides technology solutions similar and complimentary to our Market Technology business.
We expect the integration of Cinnober into our business to strengthen our position as a leading market infrastructure technology provider.
Our most recent significant acquisitions include ISE in 2016 and eVestment in 2017.
2017 Strategic Review
In 2017, Nasdaq completed a review of its strategy for long-term growth.
We identified the following key trends that we believe will shape our future opportunities.
Key Trends
| • | Marketplace Economy. As technology evolves, market trends suggest that commerce will increasingly be transacted electronically. Auctions and mechanisms that allow two-sided price negotiations and require high-quality market oversight will be prevalent. This is already |
true today across many asset classes inside and outside the financial markets.
In addition, financial institutions are seeking to digitize many processes to gain efficiencies.
| • | Data Explosion. We have seen, and expect to continue to see, a proliferation of data from many new and non-traditional sources that impact our clients’ interactions with the capital markets. We expect that our clients will seek new analytical capabilities, including machine intelligence, to transform raw data into market insights. This, in turn, is expected to trigger opportunities for those who create data or harness its power. |
| • | Evolution of Investment Management. New competitive dynamics among all types of asset managers are increasing their need to differentiate in order to compete for assets. Alternative investment and financing options are becoming more accessible. We expect this evolution to translate to greater technology needs, increasing utilization of quantitative data and analytics to facilitate more advanced investing styles and a growing demand for compliance and surveillance solutions. |
| • | Banks Embrace Change as They Evolve. Before the credit crisis, global banks relied heavily on their own proprietary technology. Since then, these institutions have begun to embrace alternative operational constructs, including technology or outsourcing partnerships, especially in market and regulatory technology. |
Our Vision, Mission and Strategy
As a result of the strategic review, we restated our vision, mission and strategy, with the full review and approval of our board of directors.
Our vision, mission and strategy embrace our strengths to focus on our clients and their evolving needs.
within our Information Services segment; and NPM, within our Corporate Services segment.
We have already begun this effort through our 2017 acquisitions of eVestment and Sybenetix, which are part of our Information Services and Market Technology segments, respectively.
| ◦ | Maintaining Investment in our Core. We intend to maintain investments in our core businesses, notably our foundational trading and listings businesses and related market data business. |
We recently entered into a definitive agreement to sell the public relations (Public Relations Solutions) and webcasting and webhosting (Digital Media Services) products and services within our Corporate Solutions business to West Corporation.
The closing of this transaction, which is subject to regulatory approvals and customary closing conditions, is projected to occur in the second quarter of 2018.
Any additional future cash flow resulting from the implementation of the Tax Cuts and Jobs Act enacted in December 2017 will be considered when evaluating our capital allocation priorities described above.
See Note 1, “Organization and Nature of Operations,” and Note 20, “Business Segments,” to the consolidated financial statements for additional financial information about our reportable segments and geographic data.
Our
In addition, Nasdaq Nordic facilitates
These participants are charged monthly fees for cabinet space, connectivity and support.
Services primarily consist of flexible
We help organizations manage the two-way flow of information with their key constituents, including their board members and investors, and with clients and the public through our suite of advanced technology, analytics, and consultative services.
| • | Investor Relations. We offer investor relations content, analytics, advisory services and communications tools, including investor relations webcasting, press release services, and websites. Our solutions, including our Nasdaq IR Insight platform, allow investor relations officers to manage their investor relations programs using a variety of tools and information to understand their investor base, manage meetings and read research, consensus estimates and news while meeting corporate governance and disclosure requirements. |
| • | Public Relations Solutions. We offer solutions to help clients identify, reach, monitor and measure their public relations program. We provide traditional and social media contacts databases, backed by our internal research analysts. Our press release distribution network allows clients to reach global audiences cost-effectively. Our suite of technology solutions and expert analysts help clients monitor key news media for their brand, reputation, products, as well as industry competitors, and measure the success of their communications programs. |
| • | Digital Media Services. We offer a platform and services which enable our customers to produce webcasts for a wide range of applications, including investor relations, public relations, marketing and internal communications. We also provide webhosting services. |
In connection with our strategic direction and the decision to reorient the company, we have entered into a definitive
agreement to sell the public relations (Public Relations Solutions) and webcasting and webhosting (Digital Media Services) products and services within our Corporate Solutions business to West Corporation.
The closing of this transaction, which is subject to regulatory approvals and customary closing conditions, is projected to occur in the second quarter of 2018.
| IPOs | 136 | |
| Total | 268 | |
Notable switches included PepsiCo, Inc., Principal Financial Group, Inc., and Workday, Inc.
Customers issue securities in the form of cash
In addition, NPM now offers Alternatives, which addresses the challenges of liquidity in alternative investments funds.
Data Products
then provide the information to subscribers.
We also provide custom calculation services for third-party clients.
An excerpt. Shown here: 40 of 125 rewritten, 40 of 118 added and 40 of 114 removed. The counts are complete. For every sentence, read Item 1. Business in the FY2018 filing and the FY2017 filing.
Item 3. Legal Proceedings
1 rewritten, 0 added, 0 removed, 0 unchanged
Read the full itemFY2018 item · filed February 22, 2019FY2017 item · filed February 28, 2018
See “Legal and Regulatory [removed: Matters,”] [added: Matters - Litigation,”] of Note 19, “Commitments, Contingencies and Guarantees,” to the consolidated financial statements, which is incorporated herein by reference.
Cover and table of contents
37 rewritten, 6 added, 16 removed, 265 unchanged
Read the full itemFY2018 item · filed February 22, 2019FY2017 item · filed February 28, 2018
| | For the fiscal year ended December 31, [removed: 2017] [added: 2018] |
Indicate by check mark whether the registrant has submitted electronically [removed: and posted on its corporate Web site, if any,] every Interactive Data File required to be submitted [removed: and posted] pursuant to Rule 405 of Regulation S-T (§232.405 of this chapter) during the preceding 12 months (or for such shorter period that the registrant was required to submit [removed: and post] such files).
Indicate by check mark if disclosure of delinquent filers pursuant to Item 405 of Regulation S-K (§229.405 of this chapter) is not contained herein, and will [removed: not be contained, to the best of registrant’s knowledge, in definitive proxy or information statements incorporated by reference in Part III of this Form 10-K or any amendment to this Form 10-K.]
| Non-accelerated filer | ☐ [removed: (Do not check if a smaller reporting company)] | Smaller reporting company | ☐ |
As of June 30, [removed: 2017,] [added: 2018,] the aggregate market value of the registrant’s common stock held by non-affiliates of the registrant was approximately [removed: $8.3] [added: $10.5] billion (this amount represents approximately [removed: 116.7] [added: 114.8] million shares of Nasdaq, Inc.’s common stock based on the last reported sales price of [removed: $71.49] [added: $91.27] of the common stock on The Nasdaq Stock Market on such date).
| Class | | Outstanding at February [removed: 21, 2018] [added: 14, 2019] |
| Common Stock, $.01 par value per share | | [removed: 166,560,632] [added: 165,420,039] shares |
[added: |] DOCUMENTS INCORPORATED BY REFERENCE [added: | |]
| Certain portions of the Definitive Proxy Statement for the [removed: 2018] [added: 2019] Annual Meeting of Stockholders | Part III |
| Item 1. | [removed: [Business](#s76184d3d0aa349598bbfce315d5726f4)] [added: [Business](#s2d27c39c2ede455a81c5a979f65627cb)] | [removed: [2](#s76184d3d0aa349598bbfce315d5726f4)] [added: [2](#s2d27c39c2ede455a81c5a979f65627cb)] |
| Item 1A. | [Risk [removed: Factors](#s119d9525fd27495980897cd5b9f52e37)] [added: Factors](#s9B572EF873D157BEA0E0909965744F0B)] | [removed: [14](#s119d9525fd27495980897cd5b9f52e37)] [added: [13](#s9B572EF873D157BEA0E0909965744F0B)] |
| Item 1B. | [Unresolved Staff [removed: Comments](#s2b9ab60000a64fa58bcbfd5d6675c099)] [added: Comments](#s9a442e49adfb420d90a3bb2db22bcbb2)] | [removed: [26](#s2b9ab60000a64fa58bcbfd5d6675c099)] [added: [26](#s9a442e49adfb420d90a3bb2db22bcbb2)] |
| Item 2. | [removed: [Properties](#sd4e2e176f4704e6596cbef1fae399601)] [added: [Properties](#s678d1792589a409b92fc185936c10c18)] | [removed: [26](#sd4e2e176f4704e6596cbef1fae399601)] [added: [26](#s678d1792589a409b92fc185936c10c18)] |
| Item 3. | [Legal [removed: Proceedings](#s47fb4811b9464b2dac10d0076b3e842a)] [added: Proceedings](#s5DF5E80F81F15397AAF1FA0F54EB1CA3)] | [removed: [26](#s47fb4811b9464b2dac10d0076b3e842a)] [added: [26](#s5DF5E80F81F15397AAF1FA0F54EB1CA3)] |
| Item 4. | [Mine Safety [removed: Disclosures](#s7ce14dd027bf41dc8ed39996fff2ca9a)] [added: Disclosures](#s0486E89B55385505959984E963DE71F3)] | [removed: [26](#s7ce14dd027bf41dc8ed39996fff2ca9a)] [added: [26](#s0486E89B55385505959984E963DE71F3)] |
| Item 5. | [Market for Registrant’s Common Equity, Related Stockholder Matters and Issuer Purchases of Equity [removed: Securities](#sf38557f0953c4cb2b9ee2f84c68a45cd)] [added: Securities](#s69A5D0BF0D4E5328BCFE6FE4495F5BAD)] | [removed: [26](#sf38557f0953c4cb2b9ee2f84c68a45cd)] [added: [26](#s69A5D0BF0D4E5328BCFE6FE4495F5BAD)] |
| Item 6. | [Selected Financial [removed: Data](#sea39ea39ee7a4f21b75cbc3730fff75a)] [added: Data](#sd19571c1512d4d0dbe49ca7d72495293)] | [removed: [29](#sea39ea39ee7a4f21b75cbc3730fff75a)] [added: [29](#sd19571c1512d4d0dbe49ca7d72495293)] |
| Item 7. | [Management’s Discussion and Analysis of Financial Condition and Results of [removed: Operations](#sBB9B6D028523527AA56F7D5B0F3F052D)] [added: Operations](#s57AD388283D156408B792156081B0F00)] | [removed: [30](#sBB9B6D028523527AA56F7D5B0F3F052D)] [added: [30](#s57AD388283D156408B792156081B0F00)] |
| Item 7A. | [Quantitative and Qualitative Disclosures About Market [removed: Risk](#s59c82832e3874ab9a4e2378fae781777)] [added: Risk](#sac5883687c85459c81155cfdeb51ea17)] | [removed: [54](#s59c82832e3874ab9a4e2378fae781777)] [added: [55](#sac5883687c85459c81155cfdeb51ea17)] |
| Item 8. | [Financial Statements and Supplementary [removed: Data](#s0a395171c8244d4aa0465aba1fe05e9c)] [added: Data](#s2762dc6717204492b9f38bcb1c7ce400)] | [removed: [54](#s0a395171c8244d4aa0465aba1fe05e9c)] [added: [55](#s2762dc6717204492b9f38bcb1c7ce400)] |
| Item 9. | [Changes in and Disagreements with Accountants on Accounting and Financial [removed: Disclosure](#s5bf04be2444841ffaf0dd73ea89c7c46)] [added: Disclosure](#sa9ac3188cd8a4df3b0163c2ecc26a438)] | [removed: [55](#s5bf04be2444841ffaf0dd73ea89c7c46)] [added: [56](#sa9ac3188cd8a4df3b0163c2ecc26a438)] |
| Item 9A. | [Controls and [removed: Procedures](#s3348E31258BF5619BEBD2B7426286E2F)] [added: Procedures](#s31CDAA530467574B8C58AD16A3E4C753)] | [removed: [55](#s3348E31258BF5619BEBD2B7426286E2F)] [added: [56](#s31CDAA530467574B8C58AD16A3E4C753)] |
| Item 9B. | [Other [removed: Information](#sc48fdc75f3c64581ad841ffa080fe2f9)] [added: Information](#s968B54793E005FF69FAFE3047B1DEE5C)] | [removed: [58](#sc48fdc75f3c64581ad841ffa080fe2f9)] [added: [59](#s968B54793E005FF69FAFE3047B1DEE5C)] |
| Item 10. | [Directors, Executive Officers and Corporate [removed: Governance](#s65fa1a7cffd74ffeab0f9e83d7344391)] [added: Governance](#s08c94614084a4b73a2d743b1f425fd49)] | [removed: [58](#s65fa1a7cffd74ffeab0f9e83d7344391)] [added: [59](#s08c94614084a4b73a2d743b1f425fd49)] |
| Item 11. | [Executive [removed: Compensation](#s33d3cb26021c4dfd9798cf8d71e678e4)] [added: Compensation](#s41acc17ccbcb45458d3bca980faff131)] | [removed: [58](#s33d3cb26021c4dfd9798cf8d71e678e4)] [added: [59](#s41acc17ccbcb45458d3bca980faff131)] |
| Item 12. | [Security Ownership of Certain Beneficial Owners and Management and Related Stockholder [removed: Matters](#sc657b30f780146328a6ab261ade29117)] [added: Matters](#s2ac485c775d049e68d55b1bcdf6d2e1f)] | [removed: [58](#sc657b30f780146328a6ab261ade29117)] [added: [59](#s2ac485c775d049e68d55b1bcdf6d2e1f)] |
| Item 13. | [Certain Relationships and Related Transactions, and Director [removed: Independence](#s8239c4a71f3d4580acde99439bec748d)] [added: Independence](#s8f193d229e0f4b97acb808a2db6d6139)] | [removed: [58](#s8239c4a71f3d4580acde99439bec748d)] [added: [59](#s8f193d229e0f4b97acb808a2db6d6139)] |
| Item 14. | [Principal Accountant Fees and [removed: Services](#s517d753a7b954b949a55d9fcd65c1d00)] [added: Services](#s4578a0522446467594e107074b362bbf)] | [removed: [59](#s517d753a7b954b949a55d9fcd65c1d00)] [added: [60](#s4578a0522446467594e107074b362bbf)] |
| Item 15. | [Exhibits, Financial Statement [removed: Schedules](#sd6ce1c9d87be4d59b0b5430115f9db03)] [added: Schedules](#s6B5FCA4352C153FDBA8E8E79E8067270)] | [removed: [59](#sd6ce1c9d87be4d59b0b5430115f9db03)] [added: [60](#s6B5FCA4352C153FDBA8E8E79E8067270)] |
| Item 16. | [Form 10-K [removed: Summary](#s2118cef125d646379b8fa8a6e478ca60)] [added: Summary](#s11d3b34eb1494ada8588a6993163b833)] | [removed: [64](#s2118cef125d646379b8fa8a6e478ca60)] [added: [63](#s11d3b34eb1494ada8588a6993163b833)] |
Proxy Statement: Nasdaq’s Definitive Proxy Statement for the [removed: 2018] [added: 2019] Annual Meeting of Stockholders
[removed: FINRA®] [added: FINRA] and TRADE REPORTING [removed: FACILITY®] [added: FACILITY] are registered trademarks of FINRA.
| • | our strategy, growth forecasts and [removed: 2018] [added: 2019] outlook; |
| • | any litigation, or any regulatory or government investigation or action, to which we are or could become a [removed: party.] [added: party or which may affect us.] |
| • | our ability to successfully integrate acquired businesses or divest sold businesses or assets, including the fact that any integration [added: or transition] may be more difficult, time consuming or costly than expected, and we may be unable to realize synergies from business combinations, acquisitions, divestitures or other transactional activities; |
| • | loss of significant trading and clearing volumes or values, fees, market share, listed companies, [added: market] data products customers or other customers; |
| • | the performance and reliability of our technology and technology of third [removed: parties;] [added: parties on which we rely;] |
10-K 1 ndaq1231201810-k.htm 10-K
not be contained, to the best of registrant’s knowledge, in definitive proxy or information statements incorporated by reference in Part III of this Form 10-K or any
amendment to this Form 10-K.
_____________________________________
LCH: LCH Group Holdings Limited
NASDAQ, the NASDAQ logos, and other brand, service or product names or marks referred to in this report are trademarks or services marks, registered or otherwise, of Nasdaq, Inc. and/or its subsidiaries.
10-K 1 ndaq1231201710-k.htm 10-K
| | | |
____________________________________
eSpeed: Certain assets and certain liabilities of the eSpeed business that were acquired or assumed from BGC Partners, Inc. and certain of its affiliates
SecondMarket: SecondMarket Solutions, Inc.
VSOE: Vendor Specific Objective Evidence of Fair Value
The following is a non-exclusive list of registered trademarks, registered service marks, or trademarks or service marks of Nasdaq or its subsidiaries, in the United States and/or other countries or jurisdictions:
@TRADE®, ACES®, AT TRADE®, AT-TRADE®, AGGREGATION, TRANSPARENCY, CONTROL®, AUTO WORKUP®, AXE®, BOARDVANTAGE, BWISE®, BWISE BUSINESS IN CONTROL®, BWISE RAPID DEPLOYMENT SOLUTION®, BX VENTURE MARKET®, CANADIAN DIVIDEND ACHIEVERS®, CCBN®, CCN®, CCN NEWSNET DESIGN, CCNMATTHEWS®, CLICK XT®, CONDICO®, CYBER SECURITY®, D.A.L.I®, DEFENSE OF INTERNATIONAL MARKETS AND EXCHANGES SYMPOSIUM®, DIMES®, DIRECTORS DESK®, DIRECTORSDESK®, DIVIDEND ACHIEVERS®, DORSEY WRIGHT®, DREAM IT.
DO IT.®, DWA®, DWA MATRIX®, EQQQ, E (design), E-SPEED®, ESPEED®, ESPEEDOMETER®, EXACTEQUITY®, EXIGO, FINQLOUD®, FINQLOUD REGULATORY RECORDS RETENTION® FIRST NORTH®, FONDSBØRSEN®, FTEN®, GENIUM®, GIDS®, GLOBE NEWSWIRE®, GO!
POWERED BY MARKETWIRE®, HACK®, IGNITE YOUR AMBITION®, INET®, INTERNATIONAL SECURITIES EXCHANGE®, INVESTOR WORLD®, IPOWORLD®, ISE, ISE BIG DATA®, ISE FX OPTIONS®, ISE GEMINI®, ISE MOBILE PAYMENTS®, ISEE SELECT®, ISSUERWORLD®, ITCH®, KFXAKTIEINDEX®, LONGITUDE®, MARKET INTELLIGENCE DESK®, MARKET LINQUIDITY, MARKET MECHANICS®, MARKETSITE®, MARKETWIRE®, MARKETWIRE BEYOND WORDS®, MARKETWIRE RESONATE®, MARKETWIRE GO!
®, MARKETWIRED RESONATE®, MARKETWIRED®, MW®, MW MARKET WIRED®, MW MARKETWIRED THE POWER OF INFLUENCE®, MY CCBN®, MYMEDIAINFO®, NAREX®, NASDAQ®, NASDAQ 100 INDEX®, NASDAQ - FINANCIAL®, NASDAQ BIOTECHNOLOGY INDEX®, NASDAQ CANADA®, NASDAQ CANADA COMPOSITE INDEX®, NASDAQ CANADA INDEX®, NASDAQ CAPITAL MARKET®, NASDAQ COMPOSITE®, NASDAQ COMPOSITE INDEX®, NASDAQ COMPUTER INDEX®, NASDAQ DIVIDEND ACHIEVERS®, NASDAQ DUBAI®, NASDAQ DUBAI ACADEMY®, NASDAQ EUROPE®, NASDAQ EUROPE COMPOSITE INDEX®, NASDAQ FINANCIAL-100 INDEX®, NASDAQ FUTURES®, NASDAQ FX®, NASDAQ GLOBAL MARKET®, NASDAQ GLOBAL SELECT MARKET®, NASDAQ INDUSTRIAL INDEX®, NASDAQ INTERACT®, NASDAQ INTERNET INDEX®, NASDAQ IQ FUND®, NASDAQ IR INSIGHT®, NASDAQ JAPAN®, NASDAQ MARKET ANALYTIX®, NASDAQ MARKET CENTER®, NASDAQ MARKET FORCES®, NASDAQ MARKET VELOCITY®, NASDAQ MARKETSITE®, NASDAQ MAX®, NASDAQ MAX MARKET ANALYTIX®, NASDAQ OMX®, NASDAQ OMX GREEN ECONOMY
iii
INDEX®, NASDAQ OMX NORDIC®, NASDAQ PRIVATE MARKET®, NASDAQ Q-50 INDEX®, NASDAQ TELECOMMUNICATIONS INDEX®, NASDAQ TOTALVIEW®, NASDAQ TRADER®, NASDAQ TRANSPORTATION INDEX®, NASDAQ US ALL MARKET®, NASDAQ WORKSTATION®, NASDAQ WORKSTATION II®, NASDAQ WORLD®, NASDAQ-100®, NASDAQ-100 EUROPEAN FUND®, NASDAQ-100 EUROPEAN TRACKER®, NASDAQ-100 EUROPEAN TRACKER FUND®, NASDAQ-100 INDEX®, NASDAQ-100 INDEX EUROPEAN TRACKER FUND®, NASDAQ-100 INDEX TRACKING STOCK®, NDX®, NEWS RELEASE EXPRESS®, NFX®, NLX®, NOIS®, NORDIX®, NPM®, OMX®, OMX COPENHAGEN 20®, OMX HELSINKI 25®, OMX STIBOR FUTURE®, OMX STOCKHOLM 30®, OMX TECHNOLOGY®, OMXC25®, OMXH25®, OMXS30®, OMXS3FUT®, ON THE WIRE®, OTW®, PHILADELPHIA STOCK EXCHANGE®, PHLX®, PHLX XL®, PIXL®, PRECISE TRADE®, PRF®, Q THE NEXT GREAT THING®, QQQ®, QTARGET®, QVIEW®, R3®, RISKWAY®, RISKWRAPPER®, RISKXPOSURE®, RX®, S.A.X.E.S®, SECONDMARKET®, SIGNALXPRESS SX®, SMARTS®, SMARTSONLINE®, STINA®, STRUCTURED LIQUIDITY PROGRAM®, THE NASDAQ STOCK MARKET®, THE STOCK MARKET FOR THE NEXT 100 YEARS®, TOTAL EQUITY SOLUTION®, TRADEGUARD®, TX®, ULL®, ULTRA LOW LATENCY®, ULTRAFEED®, VX PROXY®, WIZER®, XDE®, XO DORSEY WRIGHT & ASSOCIATES®, YLIALLE®, ÖVERUNDER®
To the extent a name, logo or design does not appear on the above list, such lack of appearance does not constitute a waiver of any intellectual property rights that Nasdaq has established in its product or service names or logos, or in product configurations or designs, all of which rights are expressly reserved.
All other trademarks and service marks used herein are the property of their respective owners.
iv
Item 2. Properties
17 rewritten, 4 added, 6 removed, 5 unchanged
Read the full itemFY2018 item · filed February 22, 2019FY2017 item · filed February 28, 2018
The following is a description of our principal [removed: properties.][added: properties which are all leased.]
| Location | | Use | | Size (approximate, in square feet) | | [removed: |]
| Stockholm, Sweden | | European headquarters | | [removed: 294,000 |] [added: 264,000] | |
| New York, New York | | U.S. headquarters | | 113,000 | | [removed: |]
| Philadelphia, Pennsylvania | | General office space | | [removed: 75,000 |] [added: 74,000] | |
| Atlanta, Georgia | | General office space | | 68,000 | | [removed: |]
| New York, New York | | General office space | | [removed: 64,000 |] [added: 53,000] | |
| Bengaluru, India | | General office space | | 63,000 | | [removed: |]
| [removed: New York, New York] [added: Vilnius, Lithuania] | | General office space | | [removed: 53,000 |] [added: 51,000] | |
| [removed: Vilnius, Lithuania] [added: Rockville, Maryland] | | General office space | | [removed: 51,000 |] [added: 48,000] | |
| [removed: Rockville, Maryland] [added: Manila, Philippines] | | General office space | | [removed: 48,000 |] [added: 36,000] | |
| [removed: Manila, Philippines] [added: London, England] | | General office space | | [removed: 36,000 |] [added: 31,000] | |
| [removed: London, England] [added: Sydney, Australia] | | General office space | | [removed: 31,000 |] [added: 29,000] | |
| [removed: Shelton, Connecticut] [added: Toronto, Canada] | | General office space | | [removed: 29,000 |] [added: 26,000] | |
| New York, New York | | Location of MarketSite | | [removed: 25,000 |] [added: 66,000] | |
Outside the U.S., we also maintain leased locations in Belgium, China, Denmark, Estonia, Finland, France, Germany, Hong Kong, Iceland, Italy, Japan, Latvia, Netherlands, Norway, Singapore, South Korea, [removed: Spain, Turkey, Ukraine] [added: Spain] and [removed: the United Arab Emirates.][added: Ukraine.]
Within the U.S., we also maintain leased locations in California, Colorado, [added: Connecticut,] Illinois, Massachusetts, [removed: Missouri,] New Jersey, Oregon, [removed: Texas,] Virginia and Washington, DC.
| | | | | | |
| --- | --- | --- | --- | --- | --- |
| | | | | | |
In addition to the above, we also lease approximately 67,000 square feet of space used as data centers and disaster preparedness facilities in multiple locations.
| | | | | | | |
| --- | --- | --- | --- | --- | --- | --- |
| | | | | | | |
| Sydney, Australia | | General office space | | 29,000 | | |
| Toronto, Canada | | General office space | | 27,000 | | |
| Philadelphia, Pennsylvania | | General office space | | 26,000 | | |
Item 5. Market for Registrant’s Common Equity, Related Stockholder Matters and Issuer Purchases of Equity Securities
18 rewritten, 25 added, 53 removed, 7 unchanged
Read the full itemFY2018 item · filed February 22, 2019FY2017 item · filed February 28, 2018
Our common stock [removed: has been] [added: is] listed on The Nasdaq Stock Market [removed: since February 10, 2005,] under the ticker symbol “NDAQ.” [added: As of February 14, 2019, we had approximately 250 holders of record of our common stock.]
| [removed: |] December [removed: 31,] [added: 2018] | | | | | | | [added: | | | | | | | |]
See [removed: “Cash Dividends on Common Stock,”] [added: “Share Repurchase Program,”] of Note [removed: 14,] [added: 12,] “Nasdaq Stockholders’ Equity,” to the consolidated financial statements for further discussion of [removed: the dividends.][added: our share repurchase program.]
[added: |] Employee [removed: Transactions][added: transactions(1) | | 2,060 | | | 84.57 | | | | N/A | | | N/A | | |]
[removed: During the fiscal quarter ended December 31, 2017,] [added: | (1) | Represents shares] we purchased [removed: shares] from employees in connection with the settlement of employee tax withholding obligations arising from the vesting of restricted stock and PSUs. [added: |]
The [added: following] table [removed: below represents repurchases made by or on behalf of us or any “affiliated purchaser”] [added: summarizes the share repurchase activity] of our common stock during the fiscal quarter ended December 31, [removed: 2017:][added: 2018:]
| Period | | (a) Total Number of Shares Purchased | | | (b) Average Price Paid Per Share | | | | (c) Total Number of Shares Purchased as Part of Publicly Announced Plans or Programs | | [added: |] (d) Maximum Dollar Value of Shares that May Yet Be Purchased Under the Plans or Programs (in millions) | | |
| Share repurchase program | | [removed: 9,732] [added: —] | | | $ | [removed: 74.63] [added: —] | | | [removed: 9,732] [added: —] | | [added: |] $ | [removed: 226] [added: 332] | |
| Share repurchase program | | [removed: 1,100] [added: —] | | | $ | [removed: 74.97] [added: —] | | | [removed: 1,100] [added: —] | | [added: |] $ | [removed: 226] [added: 332] | |
| Total Quarter Ended December 31, [removed: 2017] [added: 2018] | | | | | | | | | | | | | | [added: |]
The following graph compares the total return of our common stock to the Nasdaq Composite [removed: Stock] Index, the S&P 500 and a selected peer group for the past five years.
Information for the indices and the peer group is provided from December 31, [removed: 2012] [added: 2013] through December 31, [removed: 2017.][added: 2018.]
The figures represented below assume an initial investment of $100 in the common stock or index at the closing price on December 31, [removed: 2012] [added: 2013] and the reinvestment of all dividends.
[removed: ][added: 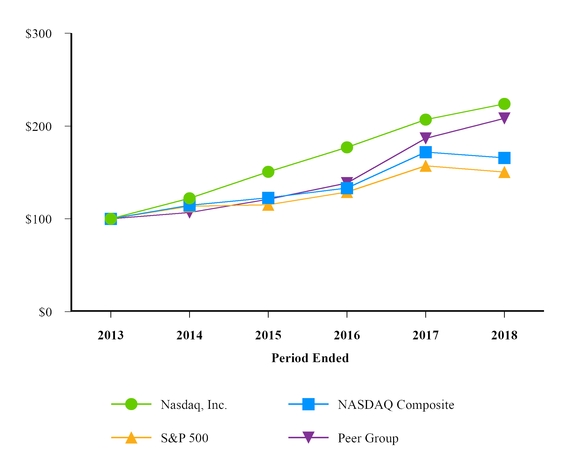]
[removed: *$100] [added: * $100] invested on [removed: 12/31/12] [added: 12/31/2013] in stock or index, including reinvestment of dividends.
[added: | |] Fiscal [removed: year ending] [added: Year Ended] December [removed: 31.][added: 31, | | | | | | | | | | | | | | | | | | | | |]
| | [removed: 2012 | | | |] 2013 | | [removed: | |] 2014 | | | | 2015 | | | | 2016 | | | | 2017 | | | [added: | 2018 | | |]
Copyright© [removed: 2018] [added: 2019] Standard & [removed: Poor’s,] [added: Poor's,] a division of S&P Global.
Purchases of Equity Securities by the Issuer and Affiliated Purchasers
| | | | | | | | | | | | | | | |
| --- | --- | --- | --- | --- | --- | --- | --- | --- | --- | --- | --- | --- | --- | --- |
| | | | | | | | | | | | | | | |
| October 2018 | | | | | | | | | | | | | | |
| | | | | | | | | | | | | | | |
| November 2018 | | | | | | | | | | | | | | |
| Employee transactions(1) | | 1,370 | | | 87.33 | | | | N/A | | | N/A | | |
| | | | | | | | | | | | | | | |
| Share repurchase program | | — | | | $ | — | | | — | | | $ | 332 | |
| Employee transactions(1) | | 66,133 | | | 82.11 | | | | N/A | | | N/A | | |
| | | | | | | | | | | | | | | |
| Share repurchase program | | — | | | $ | — | | | — | | | $ | 332 | |
| Employee transactions | | 69,563 | | | $ | 82.29 | | | N/A | | | N/A | | |
____________
| | |
| --- | --- |
Among Nasdaq, Inc., the Nasdaq Composite Index, the S&P 500, and a Peer Group
| | | | | | | | | | | | | | | | | | | | | | |
| --- | --- | --- | --- | --- | --- | --- | --- | --- | --- | --- | --- | --- | --- | --- | --- | --- | --- | --- | --- | --- | --- |
| | | | | | | | | | | | | | | | | | | | | | |
| Nasdaq, Inc. | $ 100 | | $ | 122 | | | $ | 151 | | | $ | 177 | | | $ | 207 | | | $ | 224 | |
| Nasdaq Composite | 100 | | 115 | | | | 123 | | | | 133 | | | | 172 | | | | 166 | | |
| S&P 500 | 100 | | 114 | | | | 115 | | | | 129 | | | | 157 | | | | 150 | | |
| Peer Group | 100 | | 107 | | | | 121 | | | | 139 | | | | 187 | | | | 208 | | |
The following chart lists the quarterly high and low sales prices for shares of our common stock for fiscal years 2017 and 2016.
These prices are between dealers and do not include retail markups, markdowns or other fees and commissions and may not represent actual transactions.
| | | | | | | | |
| --- | --- | --- | --- | --- | --- | --- | --- |
| | | | | | | | |
| | High | | | | Low | | |
| Fiscal 2017 | | | | | | | |
| Fourth quarter | $ | 78.88 | | | $ | 71.62 | |
| Third quarter | 77.25 | | | | 70.36 | | |
| Second quarter | 70.92 | | | | 65.72 | | |
| First quarter | 70.76 | | | | 65.37 | | |
| Fiscal 2016 | | | | | | | |
| Fourth quarter | $ | 68.94 | | | $ | 63.23 | |
| Third quarter | 71.01 | | | | 63.99 | | |
| Second quarter | 65.16 | | | | 60.84 | | |
| First quarter | 66.09 | | | | 54.73 | | |
As of February 21, 2018, we had approximately 276 holders of record of our common stock.
As of February 21, 2018, the closing price of our common stock was $79.12.
Cash Dividends on Common Stock
The following table shows quarterly cash dividends declared per common share on our outstanding common stock:
| | | | | | | | |
| --- | --- | --- | --- | --- | --- | --- | --- |
| | | | | | | | |
| | 2017 | | | | 2016 | | |
| First quarter | $ | 0.32 | | | $ | 0.25 | |
| Second quarter | 0.38 | | | | 0.32 | | |
| Third quarter | 0.38 | | | | 0.32 | | |
| Fourth quarter | 0.38 | | | | 0.32 | | |
| Total | $ | 1.46 | | | $ | 1.21 | |
See “Share Repurchase Program,” of Note 14, “Nasdaq Stockholders’ Equity,” to the consolidated financial statements for further discussion of our share repurchase program.
* * * * * *
| | | | | | | | | | | | | | |
| --- | --- | --- | --- | --- | --- | --- | --- | --- | --- | --- | --- | --- | --- |
| | | | | | | | | | | | | | |
| October 2017 | | | | | | | | | | | | | |
| Share repurchase program | | 377,516 | | | $ | 74.14 | | | 377,516 | | $ | 227 | |
| Employee transactions | | 1,850 | | | $ | 74.94 | | | N/A | | N/A | | |
| | | | | | | | | | | | | | |
| November 2017 | | | | | | | | | | | | | |
| Employee transactions | | 304 | | | $ | 72.40 | | | N/A | | N/A | | |
An excerpt. Shown here: all 18 rewritten, all 25 added and 40 of 53 removed. The counts are complete. For every sentence, read Item 5. Market for Registrant’s Common Equity, Related Stockholder Matters and Issuer Purchases of Equity Securities in the FY2018 filing and the FY2017 filing.
Item 6. Selected Financial Data.
17 rewritten, 6 added, 8 removed, 15 unchanged
Read the full itemFY2018 item · filed February 22, 2019FY2017 item · filed February 28, 2018
The following [removed: information] [added: tables present selected financial data and] should be read in conjunction with the consolidated financial statements and notes thereto of Nasdaq included elsewhere in this Form 10-K.
We completed [added: a divestiture in April 2018 and] several acquisitions during the years ended December 31, [added: 2018,] 2017, [removed: 2016, 2015] [added: 2016] and [removed: 2013] [added: 2015] and included the financial results of such acquisitions in our consolidated financial statements from the respective acquisition dates.
| | | [removed: 2017] [added: 2018] | | | | [removed: 2016] [added: 2017] | | | | [removed: 2015] [added: 2016] | | | | [removed: 2014] [added: 2015] | | | | [removed: 2013] [added: 2014] | | |
| Total revenues | | $ | [removed: 3,965] [added: 4,277] | | | $ | [removed: 3,705] [added: 3,948] | | | $ | [removed: 3,403] [added: 3,704] | | | $ | [removed: 3,500] [added: 3,403] | | | $ | [removed: 3,211] [added: 3,500] | |
| Transaction-based expenses | | [removed: (1,537] [added: (1,751] | | ) | | [removed: (1,428] [added: (1,537] | | ) | | [removed: (1,313] [added: (1,428] | | ) | | [removed: (1,433] [added: (1,313] | | ) | | [removed: (1,316] [added: (1,433] | | ) |
| Revenues less transaction-based expenses | | [removed: 2,428] [added: 2,526] | | | | [removed: 2,277] [added: 2,411] | | | | [removed: 2,090] [added: 2,276] | | | | [removed: 2,067] [added: 2,090] | | | | [removed: 1,895] [added: 2,067] | | |
| Total operating expenses | | [removed: 1,429] [added: 1,498] | | | | [removed: 1,438] [added: 1,420] | | | | [removed: 1,370] [added: 1,440] | | | | [removed: 1,313] [added: 1,370] | | | | [removed: 1,207] [added: 1,313] | | |
| Operating income | | [removed: 999] [added: 1,028] | | | | [removed: 839] [added: 991] | | | | [removed: 720] [added: 836] | | | | [removed: 754] [added: 720] | | | | [removed: 688] [added: 754] | | |
| Net income attributable to Nasdaq | | [removed: 734] [added: 458] | | | | [removed: 108] [added: 729] | | | | [removed: 428] [added: 106] | | | | [removed: 414] [added: 428] | | | | [removed: 385] [added: 414] | | |
| Basic earnings per share | | $ | [removed: 4.41] [added: 2.77] | | | $ | [removed: 0.65] [added: 4.38] | | | $ | [removed: 2.56] [added: 0.64] | | | $ | [removed: 2.45] [added: 2.56] | | | $ | [removed: 2.30] [added: 2.45] | |
| Diluted earnings per share | | $ | [removed: 4.33] [added: 2.73] | | | $ | [removed: 0.64] [added: 4.30] | | | $ | [removed: 2.50] [added: 0.63] | | | $ | [removed: 2.39] [added: 2.50] | | | $ | [removed: 2.25] [added: 2.39] | |
| Cash dividends declared per common share | | $ | [removed: 1.46] [added: 1.70] | | | $ | [removed: 1.21] [added: 1.46] | | | $ | [removed: 0.90] [added: 1.21] | | | $ | [removed: 0.58] [added: 0.90] | | | $ | [removed: 0.52] [added: 0.58] | |
| Basic | | [removed: 166,364,299] [added: 165,349,471] | | | | [removed: 165,182,290] [added: 166,364,299] | | | | [removed: 167,285,450] [added: 165,182,290] | | | | [removed: 168,926,733] [added: 167,285,450] | | | | [removed: 166,932,103] [added: 168,926,733] | | |
| Diluted | | [removed: 169,585,031] [added: 167,691,299] | | | | [removed: 168,800,997] [added: 169,585,031] | | | | [removed: 171,283,271] [added: 168,800,997] | | | | [removed: 173,018,849] [added: 171,283,271] | | | | [removed: 171,266,146] [added: 173,018,849] | | |
| | | [removed: 2017] [added: 2018] | | | | [removed: 2016] [added: 2017] | | | | [removed: 2015] [added: 2016] | | | | [removed: 2014] [added: 2015] | | | | [removed: 2013] [added: 2014] | | |
| Cash and cash equivalents and financial investments | | $ | [removed: 612] [added: 813] | | | $ | [removed: 648] [added: 612] | | | $ | [removed: 502] [added: 648] | | | $ | [removed: 601] [added: 502] | | | $ | [removed: 587] [added: 601] | |
| Total Nasdaq stockholders' equity | | [removed: 5,887] [added: 5,449] | | | | [removed: 5,430] [added: 5,880] | | | | [removed: 5,609] [added: 5,428] | | | | [removed: 5,794] [added: 5,609] | | | | [removed: 6,184] [added: 5,794] | | |
On January 1, 2018, we adopted Topic 606 using the full retrospective method which required restatement of 2017 and 2016 financial statements.
Earlier periods were not restated.
| Default funds and margin deposits | | 4,742 | | | | 3,988 | | | | 3,301 | | | | 2,228 | | | | 2,194 | | |
| Goodwill | | 6,363 | | | | 6,586 | | | | 6,027 | | | | 5,395 | | | | 5,538 | | |
| Total assets | | 15,700 | | | | 15,354 | | | | 13,411 | | | | 11,257 | | | | 11,542 | | |
| Long-term debt | | 2,956 | | | | 3,727 | | | | 3,603 | | | | 2,364 | | | | 2,297 | | |
The following table sets forth selected financial data on a historical basis for Nasdaq.
| Total assets | | 15,786 | | | | 14,150 | | | | 11,861 | | | | 12,071 | | | | 12,563 | | |
| Total long-term liabilities | | 4,637 | | | | 4,638 | | | | 3,332 | | | | 3,297 | | | | 3,579 | | |
Total assets increased $1.6 billion as of December 31, 2017 compared with December 31, 2016 primarily due to an increase in default funds and margin deposits (with a corresponding increase in current liabilities), reflecting an increase in cash margin deposits pledged by members of our Nasdaq Clearing business due to an increase in clearing volume.
Also contributing to the increase is an increase in goodwill and intangible assets associated with our 2017 acquisitions, partially offset by a decrease in deferred tax assets primarily due to the impact of the Tax Cuts and Jobs Act.
See Note 11, “Income Taxes,” to the consolidated financial statements for further discussion.
Total assets increased $2.3 billion as of December 31, 2016 compared with December 31, 2015 primarily due to an increase in default funds and margin deposits (with a corresponding increase in current liabilities) as new regulatory rules in 2016 required all collateral pledged by members of our Nasdaq Clearing business to be recorded on the balance sheet.
Also contributing to the increase was an increase in goodwill and intangible assets associated with our 2016 acquisitions, partially offset by a pre-tax, non-cash intangible asset impairment charge of $578 million to write off the full value of a trade name.
Item 8. Financial Statements and Supplementary Data.
10 rewritten, 11 added, 9 removed, 10 unchanged
Read the full itemFY2018 item · filed February 22, 2019FY2017 item · filed February 28, 2018
Nasdaq’s consolidated financial statements, including Consolidated Balance Sheets as of December 31, [removed: 2017] [added: 2018] and [removed: 2016,] [added: 2017,] Consolidated Statements of Income for the years ended December 31, [removed: 2017, 2016] [added: 2018, 2017] and [removed: 2015,] [added: 2016,] Consolidated Statements of Comprehensive Income (Loss) for the years ended December 31, [removed: 2017, 2016] [added: 2018, 2017] and [removed: 2015,] [added: 2016,] Consolidated Statements of Changes in Equity for the years ended December 31, [removed: 2017, 2016] [added: 2018, 2017] and [removed: 2015,] [added: 2016,] Consolidated Statements of Cash Flows for the years ended December 31, [removed: 2017, 2016] [added: 2018, 2017] and [removed: 2015] [added: 2016] and notes to our consolidated financial statements, together with a report thereon of Ernst & Young LLP, dated February [removed: 28, 2018,] [added: 22, 2019,] are attached hereto as pages F-1 through [removed: F-52] [added: F-51] and incorporated by reference herein.
| | | 1st Qtr [removed: 2017] | | | | 2nd Qtr [removed: 2017] | | | | 3rd Qtr [removed: 2017] | | | | 4th Qtr [removed: 2017] | | |
| Total operating expenses | | 335 | | | | [removed: 358] [added: 354] | | | | [removed: 343] [added: 341] | | | | [removed: 392] [added: 390] | | |
| Net income attributable to Nasdaq | | $ | [removed: 169] [added: 168] | | | $ | [removed: 147] [added: 146] | | | $ | [removed: 171] [added: 170] | | | $ | 246 | |
| Basic earnings per share | | $ | [removed: 1.02] [added: 1.01] | | | $ | [removed: 0.89] [added: 0.88] | | | $ | [removed: 1.03] [added: 1.02] | | | $ | 1.47 | |
| Diluted earnings per share | | $ | 0.99 | | | $ | 0.87 | | | $ | [removed: 1.01] [added: 1.00] | | | $ | 1.45 | |
| | | 1st Qtr [removed: 2016] | | | | 2nd Qtr [removed: 2016] | | | | 3rd Qtr [removed: 2016] | | | | 4th Qtr [removed: 2016] | | |
| Net income (loss) attributable to Nasdaq | | $ | [removed: 132] [added: 177] | | | $ | [removed: 70] [added: 162] | | | $ | [removed: 131] [added: 163] | | | $ | [removed: (224] [added: (44] | ) |
| Diluted earnings (loss) per share | | $ | [removed: 0.78] [added: 1.05] | | | $ | [removed: 0.42] [added: 0.97] | | | $ | [removed: 0.77] [added: 0.97] | | | $ | [removed: (1.35] [added: (0.27] | ) |
| Cash dividends declared per common share | | $ | [removed: 0.57] [added: 0.82] | | | $ | — | | | $ | [removed: 0.32] [added: 0.44] | | | $ | [removed: 0.32] [added: 0.44] | |
| | | 2018 | | | | 2018 | | | | 2018 | | | | 2018 | | |
| Total revenues | | $ | 1,151 | | | $ | 1,027 | | | $ | 964 | | | $ | 1,136 | |
| Transaction-based expenses | | (485 | | ) | | (412 | | ) | | (364 | | ) | | (491 | | ) |
| Revenues less transaction-based expenses | | 666 | | | | 615 | | | | 600 | | | | 645 | | |
| Total operating expenses | | 393 | | | | 346 | | | | 354 | | | | 404 | | |
| Operating income | | 273 | | | | 269 | | | | 246 | | | | 241 | | |
| Basic earnings (loss) per share | | $ | 1.06 | | | $ | 0.98 | | | $ | 0.99 | | | $ | (0.27 | ) |
| | | 2017 | | | | 2017 | | | | 2017 | | | | 2017 | | |
| Total revenues | | $ | 969 | | | $ | 994 | | | $ | 965 | | | $ | 1,019 | |
| Revenues less transaction-based expenses | | 581 | | | | 596 | | | | 603 | | | | 630 | | |
| Operating income | | 246 | | | | 242 | | | | 262 | | | | 240 | | |
| Total revenues | | $ | 971 | | | $ | 1,000 | | | $ | 969 | | | $ | 1,024 | |
| Revenues less transaction-based expenses | | 583 | | | | 602 | | | | 607 | | | | 635 | | |
| Operating income | | 248 | | | | 244 | | | | 264 | | | | 243 | | |
| Total revenues | | $ | 905 | | | $ | 897 | | | $ | 929 | | | $ | 973 | |
| Transaction-based expenses | | (371 | | ) | | (338 | | ) | | (344 | | ) | | (374 | | ) |
| Revenues less transaction-based expenses | | 534 | | | | 559 | | | | 585 | | | | 599 | | |
| Total operating expenses | | 315 | | | | 385 | | | | 352 | | | | 386 | | |
| Operating income | | 219 | | | | 174 | | | | 233 | | | | 213 | | |
| Basic earnings (loss) per share | | $ | 0.80 | | | $ | 0.42 | | | $ | 0.79 | | | $ | (1.35 | ) |
Item 9A. Controls and Procedures
9 rewritten, 1 added, 11 removed, 26 unchanged
Read the full itemFY2018 item · filed February 22, 2019FY2017 item · filed February 28, 2018
Nasdaq’s management, with the participation of Nasdaq’s President and Chief Executive Officer, and Executive Vice President, [added: Accounting and] Corporate Strategy and Chief Financial Officer, has evaluated the effectiveness of Nasdaq’s disclosure controls and procedures (as defined in Rule 13a-15(e) and Rule 15d-15(e) under the Exchange Act) as of the end of the period covered by this report.
Based upon that evaluation, Nasdaq’s President and Chief Executive Officer and Executive Vice President, [added: Accounting and] Corporate Strategy and Chief Financial Officer, have concluded that, as of the end of such period, Nasdaq’s disclosure controls and procedures are effective.
[added: (b)] Internal control over financial reporting.
There have been no [removed: other] changes in Nasdaq’s internal control over financial reporting (as defined in Rule 13a-15(f) and Rule 15d-15(f) under the Exchange Act) that occurred during the quarter ended December 31, [removed: 2017] [added: 2018] that have materially affected, or are reasonably likely to materially affect, Nasdaq’s internal control over financial reporting.
Our management assessed the effectiveness of our internal control over financial reporting as of December 31, [removed: 2017,] [added: 2018,] based on criteria established in Internal [removed: Control—Integrated] [added: Control - Integrated] Framework issued by the Committee of Sponsoring Organizations of the Treadway Commission (COSO) (2013 framework).
Based on its assessment, our management believes that, as of December 31, [removed: 2017,] [added: 2018,] our internal control over financial reporting is effective.
We have audited Nasdaq, Inc.’s internal control over financial reporting as of December 31, [removed: 2017,] [added: 2018,] based on criteria established in Internal [removed: Control-Integrated] [added: Control—Integrated] Framework issued by the Committee of Sponsoring Organizations of the Treadway Commission (2013 framework) (the COSO criteria).
In our opinion, Nasdaq, Inc. (the Company) maintained, in all material respects, effective internal control over financial reporting as of December 31, [removed: 2017,] [added: 2018,] based on the COSO criteria.
We also have audited, in accordance with the standards of the Public Company Accounting Oversight Board (United States) (PCAOB), the consolidated balance sheets of the Company as of December 31, [removed: 2017] [added: 2018] and [removed: 2016,] [added: 2017,] and the related consolidated statements of income, comprehensive income (loss), changes in equity and cash flows for each of the three years in the period ended December 31, [removed: 2017,] [added: 2018,] and the related notes and our report dated February [removed: 28, 2018] [added: 22, 2019] expressed an unqualified opinion thereon.
February 22, 2019
(b).
In October 2017, we acquired eVestment.
Management has considered this transaction material to the results of operations, cash flows and
financial position from the date of the acquisition through December 31, 2017, and believes that the internal controls and procedures of this acquisition have a material effect on internal control over financial reporting.
We are currently in the process of incorporating the internal controls and procedures of eVestment into the internal control over financial reporting for our assessment of and report on internal control over financial reporting for December 31, 2018.
However, in accordance with SEC guidance, management has elected to exclude eVestment from its December 31, 2017 assessment of and report on internal control over financial reporting.
We are currently in the process of incorporating the internal controls and procedures of eVestment into the internal control over financial reporting for our assessment of and report on internal control over financial reporting for December 31, 2018.
Management’s assessment of and conclusion on the effectiveness of internal control over financial reporting did not include, in accordance with SEC guidance, the internal controls of eVestment, Inc. and its subsidiaries which are included in the 2017 consolidated financial statements and in 2017 reflect total assets constituting 6% of consolidated total assets, which includes 9% of goodwill and intangible assets, net and 0.3% of the total revenues less transaction-based expenses, of consolidated results.
As indicated in the accompanying Management’s Report on Internal Control Over Financial Reporting, management’s assessment of and the conclusion on the effectiveness of internal control over financial reporting did not include the internal controls of eVestment Inc. and its subsidiaries which is included in the 2017 consolidated financial statements of the Company and constituted 6% of consolidated total assets as of December 31, 2017, which include 9% of goodwill and intangible assets, net and 0.3% of the total revenues less transaction-based expenses for the year then ended.
Our audit of internal control over financial reporting of the Company also did not include an evaluation of eVestment Inc. and its subsidiaries.
February 28, 2018
Item 10. Directors, Executive Officers and Corporate Governance
5 rewritten, 0 added, 0 removed, 0 unchanged
Read the full itemFY2018 item · filed February 22, 2019FY2017 item · filed February 28, 2018
Information about Nasdaq’s directors, as required by Item 401 of Regulation S-K, is incorporated by reference from the discussion under the caption “Board of [removed: Directors—Proposal] [added: Directors-Proposal] I: Election of Directors” in Nasdaq’s Proxy Statement.
Information about Nasdaq’s executive officers, as required by Item 401 of Regulation S-K, is incorporated by reference from the discussion under the caption “Other [removed: Items—Executive] [added: Items-Executive] Officers” in the Proxy Statement.
Information about Section 16 reports, as required by Item 405 of Regulation S-K, is incorporated by reference from the discussion under the caption [removed: “Section] [added: “Other Items-Section] 16(a) Beneficial Ownership Reporting Compliance” in the Proxy Statement.
Information about Nasdaq’s code of ethics, as required by Item 406 of Regulation S-K, is incorporated by reference from the discussion under the caption [removed: “Other Items—Corporate] [added: “Corporate] Governance” in the Proxy Statement.
Information about Nasdaq’s nomination procedures, audit committee and audit committee financial experts, as required by Items 407(c)(3), 407(d)(4) and 407(d)(5) of Regulation S-K, is incorporated by reference from the discussions under the headings “Board of [removed: Directors—Proposal] [added: Directors-Proposal] I: Election of Directors” and “Board of [removed: Directors—Board] [added: Directors-Board] Committees” in the Proxy Statement.
Item 11. Executive Compensation
1 rewritten, 0 added, 0 removed, 0 unchanged
Read the full itemFY2018 item · filed February 22, 2019FY2017 item · filed February 28, 2018
Information about Nasdaq’s director and executive compensation, as required by Items 402, 407(e)(4) and 407(e)(5) of Regulation S-K, is incorporated by reference from the discussions under the headings “Board of [removed: Directors—Director] [added: Directors-Director] Compensation” and “Named Executive Officer Compensation” in the Proxy Statement.
Item 12. Security Ownership of Certain Beneficial Owners and Management and Related Stockholder Matters
6 rewritten, 1 added, 1 removed, 13 unchanged
Read the full itemFY2018 item · filed February 22, 2019FY2017 item · filed February 28, 2018
Information about security ownership of certain beneficial owners and management, as required by Item 403 of Regulation S-K, is incorporated by reference from the discussion under the heading “Other [removed: Items—Security] [added: Items-Security] Ownership of Certain Beneficial Owners and Management” in the Proxy Statement.
The following table sets forth information regarding outstanding options and shares reserved for future issuance under all of Nasdaq’s compensation plans as of December 31, [removed: 2017.][added: 2018.]
| Equity compensation plans [added: not] approved by stockholders | | [removed: 571,380] [added: —] | | | [removed: $] [added: —] | [removed: 43.84] | | | [removed: 7,891,426] [added: —] | | [removed: (2)] |
| Equity compensation plans [removed: not] approved by stockholders | | [removed: —] [added: 447,716] | | | $ | [removed: —] [added: 49.19] | | | [removed: —] [added: 12,870,957] | | [added: (2)] |
| (1) | The amounts in this column include only the number of shares to be issued upon exercise of outstanding options, warrants and rights. As of December 31, [removed: 2017,] [added: 2018,] we also had [removed: 3,331,462] [added: 2,735,356] shares to be issued upon vesting of outstanding restricted stock and PSUs. |
| (2) | This amount includes [removed: 5,801,663] [added: 10,986,965] shares of common stock that may be awarded pursuant to the Equity Plan and [removed: 2,089,763] [added: 1,883,992] shares of common stock that may be issued pursuant to the ESPP. |
| Total | | 447,716 | | | $ | 49.19 | | | 12,870,957 | | (2) |
| Total | | 571,380 | | | $ | 43.84 | | | 7,891,426 | | (2) |
Item 13. Certain Relationships and Related Transactions, and Director Independence
2 rewritten, 0 added, 0 removed, 0 unchanged
Read the full itemFY2018 item · filed February 22, 2019FY2017 item · filed February 28, 2018
Information about certain relationships and related transactions, as required by Item 404 of Regulation S-K, is incorporated herein by reference from the discussion under the heading “Other [removed: Items—Certain] [added: Items-Certain] Relationships and Related Transactions” in the Proxy Statement.
Information about director independence, as required by Item 407(a) of Regulation S-K, is incorporated herein by reference from the discussion under the heading “Board of [removed: Directors—Proposal] [added: Directors-Proposal] I: Election of Directors” in the Proxy Statement.
Item 14. Principal Accountant Fees and Services
1 rewritten, 0 added, 0 removed, 1 unchanged
Read the full itemFY2018 item · filed February 22, 2019FY2017 item · filed February 28, 2018
Information about principal accountant fees and services, as required by Item 9(e) of Schedule 14A, is incorporated herein by reference from the discussion under the heading “Audit Committee [removed: Matters—Annual] [added: Matters-Annual] Evaluation and [removed: 2018] [added: 2019] Selection of Independent Auditors” in the Proxy Statement.
Item 15. Exhibits, Financial Statement Schedules.
26 rewritten, 0 added, 16 removed, 124 unchanged
Read the full itemFY2018 item · filed February 22, 2019FY2017 item · filed February 28, 2018
| [removed: [2.2](http://www.sec.gov/Archives/edgar/data/1120193/000119312516505375/d160286d8k.htm)] [added: [10.18](http://www.sec.gov/Archives/edgar/data/1120193/000119312516513487/d161390dex101.htm)] | | [removed: Stock Purchase] [added: Credit] Agreement, dated [removed: as of] March [removed: 9,] [added: 17,] 2016, [removed: by and] among [removed: Deutsche Börse AG and Eurex Frankfurt AG and] Nasdaq, [removed: Inc.] [added: Inc., the various lenders party thereto and Bank of America, N.A., as Administrative Agent] (incorporated herein by reference to the Current Report on Form 8-K filed on March [removed: 15,] [added: 22,] 2016). |
| [removed: [2.3](http://www.sec.gov/Archives/edgar/data/1120193/000119312517280755/d442224d8k.htm)] [added: [2.2](http://www.sec.gov/Archives/edgar/data/1120193/000119312517280755/d442224dex21.htm)] | | Agreement and Plan of Merger, dated as of September 4, 2017, by and among eVestment, Inc., Nasdaq, Inc., Echo Holding Company and Insight Venture Partners, LLC (solely in its capacity as representative for eVestment’s securityholders) (incorporated herein by reference to Exhibit 2.1 to the Current Report on Form 8-K filed on September 8, 2017).† |
| [removed: [3.1](http://www.sec.gov/Archives/edgar/data/1120193/000119312514024495/d665170d8k.htm)] [added: [3.1](http://www.sec.gov/Archives/edgar/data/1120193/000119312514024495/d665170dex31.htm)] | | Amended and Restated Certificate of Incorporation of Nasdaq (incorporated herein by reference to Exhibit 3.1 to the Current Report on Form 8-K filed on January 28, 2014). |
| [removed: [3.1.1](http://www.sec.gov/Archives/edgar/data/1120193/000119312514024495/d665170d8k.htm)] [added: [3.1.1](http://www.sec.gov/Archives/edgar/data/1120193/000119312514024495/d665170dex311.htm)] | | Certificate of Elimination of Nasdaq’s Series A Convertible Preferred Stock (incorporated herein by reference to Exhibit 3.1.1 to the Current Report on Form 8-K filed on January 28, 2014). |
| [removed: [3.1.2](http://www.sec.gov/Archives/edgar/data/1120193/000119312514418471/d823798d8k.htm)] [added: [3.1.2](http://www.sec.gov/Archives/edgar/data/1120193/000119312514418471/d823798dex31.htm)] | | Certificate of Amendment of Nasdaq’s Amended and Restated Certificate of Incorporation (incorporated herein by reference to Exhibit 3.1 to the Current Report on Form 8-K filed on November 19, 2014). |
| [removed: [3.1.3](http://www.sec.gov/Archives/edgar/data/1120193/000119312515314459/d48431d8k.htm)] [added: [3.1.3](http://www.sec.gov/Archives/edgar/data/1120193/000119312515314459/d48431dex31.htm)] | | Certificate of Amendment of Nasdaq’s Amended and Restated Certificate of Incorporation (incorporated herein by reference to Exhibit 3.1 to the Current Report on Form 8-K filed on September 8, 2015). |
| [removed: [3.2](http://www.sec.gov/Archives/edgar/data/1120193/000119312516773816/d294194d8k.htm)] [added: [3.2](http://www.sec.gov/Archives/edgar/data/1120193/000119312516773816/d294194dex32.htm)] | | Nasdaq’s By-Laws (incorporated herein by reference to Exhibit 3.2 to the Current Report on Form 8-K filed on November 21, 2016). |
| [removed: [4.2](http://www.sec.gov/Archives/edgar/data/1120193/000119312508045251/d8k.htm)] [added: [4.2](http://www.sec.gov/Archives/edgar/data/1120193/000119312508045251/dex102.htm)] | | Stockholders’ Agreement, dated as of February 27, 2008, between Nasdaq, Inc. (f/k/a The NASDAQ OMX Group, Inc.) and Borse Dubai Limited (incorporated herein by reference to Exhibit 10.2 to the Current Report on Form 8-K filed on March 3, 2008). |
| [removed: [4.3](http://www.sec.gov/Archives/edgar/data/1120193/000119312508045251/d8k.htm)] [added: [4.3](http://www.sec.gov/Archives/edgar/data/1120193/000119312508045251/dex103.htm)] | | Registration Rights Agreement, dated as of February 27, 2008, among Nasdaq, Inc. (f/k/a The NASDAQ OMX Group, Inc.), Borse Dubai Limited and Borse Dubai Nasdaq Share Trust (incorporated herein by reference to Exhibit 10.3 to the Current Report on Form 8-K filed on March 3, 2008). |
| [removed: [4.11](http://www.sec.gov/Archives/edgar/data/1120193/000119312516599270/d176138d8k.htm)] [added: [4.11](http://www.sec.gov/Archives/edgar/data/1120193/000119312516599270/d176138dex41.htm)] | | Third Supplemental Indenture, dated as of May 20, 2016, among Nasdaq, Inc., Wells Fargo Bank, National Association, as Trustee, and HSBC Bank USA, National Association, as paying agent and as registrar and transfer agent (incorporated herein by reference to the Current Report on Form 8-K filed on May 23, 2016). |
| [removed: [4.12](http://www.sec.gov/Archives/edgar/data/1120193/000119312516615297/d167131d8k.htm)] [added: [4.12](http://www.sec.gov/Archives/edgar/data/1120193/000119312516615297/d167131dex41.htm)] | | Fourth Supplemental Indenture, dated as of June 7, 2016, among Nasdaq, Inc. and Wells Fargo Bank, National Association, as Trustee (incorporated herein by reference to the Current Report on Form 8-K filed on June 7, 2016). |
| [removed: [10.1](http://www.sec.gov/Archives/edgar/data/1120193/000112019317000011/ndaq6302017ex-104.htm)] [added: [10.1](http://www.sec.gov/Archives/edgar/data/1120193/000112019318000010/ndaq6302018ex-101.htm)] | | Amended and Restated Board Compensation Policy, effective on [removed: May 10, 2017] [added: April 24, 2018] (incorporated herein by reference to Exhibit [removed: 10.4] [added: 10.1] to the Quarterly Report on Form 10-Q for the quarter ended June 30, [removed: 2017] [added: 2018] filed on August [removed: 2, 2017).*] [added: 1, 2018).*] |
| [removed: [10.4](http://www.sec.gov/Archives/edgar/data/1120193/000112019317000011/ndaq6302017ex-105.htm)] [added: [10.4](http://www.sec.gov/Archives/edgar/data/1120193/000112019318000010/ndaq6302018ex-102.htm)] | | Form of Nasdaq Restricted Stock Unit Award Certificate (employees) (incorporated herein by reference to Exhibit [removed: 10.5] [added: 10.2] to the Quarterly Report on Form 10-Q for the quarter ended June 30, [removed: 2017] [added: 2018] filed on August [removed: 2, 2017).*] [added: 1, 2018).*] |
| [removed: [10.5](http://www.sec.gov/Archives/edgar/data/1120193/000112019317000011/ndaq6302017ex-106.htm)] [added: [10.5](http://www.sec.gov/Archives/edgar/data/1120193/000112019318000010/ndaq6302018ex-103.htm)] | | Form of Nasdaq Restricted Stock Unit Award Certificate (directors) (incorporated herein by reference to Exhibit [removed: 10.6] [added: 10.3] to the Quarterly Report on Form 10-Q for the quarter ended June 30, [removed: 2017] [added: 2018] filed on August [removed: 2, 2017).*] [added: 1, 2018).*] |
| [removed: [10.6](http://www.sec.gov/Archives/edgar/data/1120193/000112019317000011/ndaq6302017ex-107.htm)] [added: [10.6](http://www.sec.gov/Archives/edgar/data/1120193/000112019318000010/ndaq6302018ex-104.htm)] | | Form of Nasdaq One-Year Performance Share Unit Agreement (incorporated herein by reference to Exhibit [removed: 10.7] [added: 10.4] to the Quarterly Report on Form 10-Q for the quarter ended June 30, [removed: 2017] [added: 2018] filed on August [removed: 2, 2017).*] [added: 1, 2018).*] |
| [removed: [10.7](http://www.sec.gov/Archives/edgar/data/1120193/000112019317000011/ndaq6302017ex-108.htm)] [added: [10.7](http://www.sec.gov/Archives/edgar/data/1120193/000112019318000010/ndaq6302018ex-105.htm)] | | Form of Nasdaq Three-Year Performance Share Unit Agreement (incorporated herein by reference to Exhibit [removed: 10.8] [added: 10.5] to the Quarterly Report on Form 10-Q for the quarter ended June 30, [removed: 2017] [added: 2018] filed on August [removed: 2, 2017).*] [added: 1, 2018).*] |
| [removed: [10.11](http://www.sec.gov/Archives/edgar/data/1120193/000119312513069357/d445717dex10101.htm)] [added: [10.11](http://www.sec.gov/Archives/edgar/data/1120193/000112019317000003/ndaq12312016ex-1010.htm)] | | Employment Agreement between Nasdaq and Adena Friedman, made and entered into on November 14, 2016 and effective as of January 1, 2017 (incorporated herein by reference to Exhibit [removed: 10.10.1] [added: 10.10] to the Annual Report on Form 10-K for the year ended December 31, [removed: 2012] [added: 2016] filed on [removed: February 21, 2013).*] [added: March 1, 2017).*] |
| [removed: [10.14](http://www.sec.gov/Archives/edgar/data/1120193/000104746903011291/a2106487zex-10_14.htm)] [added: [10.14](http://www.sec.gov/Archives/edgar/data/1120193/000112019318000012/ndaq9302018ex-101.htm)] | | Employment Agreement between Nasdaq and Edward Knight, effective as of [removed: December] [added: July] 29, [removed: 2000] [added: 2018] (incorporated herein by reference to Exhibit [removed: 10.14] [added: 10.1] to the [removed: Annual] [added: Quarterly] Report on Form [removed: 10-K] [added: 10-Q] for the [removed: year] [added: quarter] ended [removed: December 31, 2002] [added: September 30, 2018] filed on [removed: March 31, 2003).*] [added: November 6, 2018).*] |
| [removed: [11](#s2EF0F454FF05561DB1B0740F31B62C77)] [added: [11](#s3DD8D8A7D3705AEC96BE8293C5659D18)] | | Statement regarding computation of per share earnings (incorporated herein by reference from Note [removed: 15] [added: 13] to the consolidated financial statements under Part II, Item 8 of this Form 10-K). |
| [removed: [21.1](https://www.sec.gov/Archives/edgar/data/1120193/000112019318000003/ndaq12312017ex-211.htm)] [added: [21.1](https://www.sec.gov/Archives/edgar/data/1120193/000112019319000002/ndaq12312018ex-211.htm)] | | List of all subsidiaries. |
| [removed: [23.1](https://www.sec.gov/Archives/edgar/data/1120193/000112019318000003/ndaq12312017ex-231.htm)] [added: [23.1](https://www.sec.gov/Archives/edgar/data/1120193/000112019319000002/ndaq12312018ex-231.htm)] | | Consent of Ernst & Young LLP. |
| [removed: [24.1](https://www.sec.gov/Archives/edgar/data/1120193/000112019318000003/ndaq12312017ex-241.htm)] [added: [24.1](https://www.sec.gov/Archives/edgar/data/1120193/000112019319000002/ndaq12312018ex-241.htm)] | | Powers of Attorney. |
| [removed: [31.1](https://www.sec.gov/Archives/edgar/data/1120193/000112019318000003/ndaq12312017ex-311.htm)] [added: [31.1](https://www.sec.gov/Archives/edgar/data/1120193/000112019319000002/ndaq12312018ex-311.htm)] | | Certification of President and Chief Executive Officer pursuant to Section 302 of the Sarbanes-Oxley Act of 2002 (“Sarbanes-Oxley”). |
| [removed: [31.2](https://www.sec.gov/Archives/edgar/data/1120193/000112019318000003/ndaq12312017ex-312.htm)] [added: [31.2](https://www.sec.gov/Archives/edgar/data/1120193/000112019319000002/ndaq12312018ex-312.htm)] | | Certification of Executive Vice President, [added: Accounting and] Corporate Strategy and Chief Financial Officer pursuant to Section 302 of Sarbanes-Oxley. |
| [removed: [32.1](https://www.sec.gov/Archives/edgar/data/1120193/000112019318000003/ndaq12312017ex-321.htm)] [added: [32.1](https://www.sec.gov/Archives/edgar/data/1120193/000112019319000002/ndaq12312018ex-321.htm)] | | Certifications Pursuant to 18 U.S.C. Section 1350, as adopted pursuant to Section 906 of Sarbanes-Oxley. |
| | The following materials from the Nasdaq, Inc. Annual Report on Form 10-K for the year ended December 31, [removed: 2017,] [added: 2018,] formatted in XBRL (eXtensible Business Reporting Language): (i) Consolidated Balance Sheets as of December 31, [removed: 2017] [added: 2018] and December 31, [removed: 2016;] [added: 2017;] (ii) Consolidated Statements of Income for the years ended December 31, [removed: 2017, 2016] [added: 2018, 2017] and [removed: 2015;] [added: 2016;] (iii) Consolidated Statements of Comprehensive Income (Loss) for the years ended December 31, [removed: 2017, 2016] [added: 2018, 2017] and [removed: 2015;] [added: 2016;] (iv) Consolidated Statements of Changes in Equity for the years ended December 31, [removed: 2017, 2016] [added: 2018, 2017] and [removed: 2015;] [added: 2016;] (v) Consolidated Statements of Cash Flows for the years [removed: ended] December 31, [removed: 2017, 2016] [added: 2018, 2017] and [removed: 2015;] [added: 2016;] and (vi) notes to consolidated financial statements. |
| | | |
| --- | --- | --- |
| | | |
| | | |
| | | |
| | | |
| | | |
| | | |
| | | |
| | | |
| [10.14.1](http://www.sec.gov/Archives/edgar/data/1120193/000104746903011291/a2106487zex-10_141.htm) | | First Amendment to Employment Agreement between Nasdaq and Edward Knight, effective February 1, 2002 (incorporated herein by reference to Exhibit 10.14.1 to the Annual Report on Form 10-K for the year ended December 31, 2002 filed on March 31, 2003).* |
| [10.14.2](http://www.sec.gov/Archives/edgar/data/1120193/000119312509039333/dex10132.htm) | | Second Amendment to Employment Agreement between Nasdaq and Edward Knight, effective as of December 31, 2008 (incorporated herein by reference to Exhibit 10.13.2 to the Annual Report on Form 10-K for the year ended December 31, 2008 filed on February 27, 2009).* |
| [10.14.3](http://www.sec.gov/Archives/edgar/data/1120193/000119312512085658/d307731dex102.htm) | | Third Amendment to Employment Agreement between Nasdaq and Edward Knight, effective as of February 22, 2012 (incorporated herein by reference to Exhibit 10.2 to the Current Report on Form 8-K filed on February 28, 2012).* |
| [10.14.4](http://www.sec.gov/Archives/edgar/data/1120193/000112019317000003/ndaq12312016ex-10144.htm) | | Fourth Amendment to Employment Agreement between Nasdaq and Edward Knight, entered into and effective as of October 24, 2016 (incorporated herein by reference to Exhibit 10.14.4 to the Annual Report on Form 10-K for the year ended December 31, 2016 filed on March 1, 2017).* |
| [10.18](http://www.sec.gov/Archives/edgar/data/1120193/000119312516513487/d161390d8k.htm) | | Credit Agreement, dated March 17, 2016, among Nasdaq, Inc., the various lenders party thereto and Bank of America, N.A., as Administrative Agent (incorporated herein by reference to the Current Report on Form 8-K filed on March 22, 2016). |
| [12.1](https://www.sec.gov/Archives/edgar/data/1120193/000112019318000003/ndaq12312017ex-121.htm) | | Computation of Ratio of Earnings to Fixed Charges. |
Item 16. Form 10-K Summary
799 rewritten, 727 added, 566 removed, 961 unchanged
Read the full itemFY2018 item · filed February 22, 2019FY2017 item · filed February 28, 2018
Pursuant to the requirements of Section 13 or 15(d) of the Securities Exchange Act of 1934, the registrant has duly caused this report to be signed on its behalf by the undersigned, thereunto duly authorized, on February [removed: 28, 2018.][added: 22, 2019.]
Pursuant to the requirements of the Securities Exchange Act of 1934, this report has been signed below by the following persons on behalf of the registrant and in the capacities indicated as of February [removed: 28, 2018.][added: 22, 2019.]
| Name | | Title | [removed: |]
| /s/ Adena T. Friedman | | President and Chief Executive Officer and Director | [removed: |]
| Adena T. Friedman | | (Principal Executive Officer) | [removed: |]
| /s/ Michael Ptasznik | | Executive Vice President, [added: Accounting and] Corporate Strategy and Chief Financial Officer | [removed: |]
| Michael Ptasznik | | (Principal Financial Officer) | [removed: |]
| /s/ Ann M. Dennison | | Senior Vice President and Controller | [removed: |]
| Ann M. Dennison | | (Principal Accounting Officer) | [removed: |]
| * | | Chairman of the Board | [removed: |]
| Michael R. Splinter | | | [removed: |]
| * | | Director | [removed: |]
| Melissa M. Arnoldi | | | [removed: |]
| * | | Director | [removed: |]
| Charlene T. Begley | | | [removed: |]
| * | | Director | [removed: |]
| Steven D. Black | | | [removed: |]
| * | | Director | [removed: |]
| Essa Kazim | | | [removed: |]
| * | | Director | [removed: |]
| Thomas A. Kloet | | | [removed: |]
| * | | Director | [removed: |]
| John D. Rainey | | | [removed: |]
| * | | Director | [removed: |]
| Lars R. Wedenborn | | | [removed: |]
| * [removed: |] Pursuant to Power of Attorney | [added: | |]
| By: | [added: |] /s/ Edward S. Knight |
| | [added: |] Edward S. Knight |
| | [added: |] Attorney-in-Fact |
| [Report of Independent Registered Public Accounting [removed: Firm](#sfb413dd8f7a94fd98055dc6d67cdb761)] [added: Firm](#sef10b8b195314e2cb76afeb8770f4988)] | [removed: F-[2](#sfb413dd8f7a94fd98055dc6d67cdb761)] [added: F- [2](#sef10b8b195314e2cb76afeb8770f4988)] |
| [Consolidated Balance [removed: Sheets](#s306F2652D8535AD8AD0DE28AA5F6B205)] [added: Sheets](#s8E0FB6C6E2985A8BA640F4C21DC17713)] | [removed: F-[3](#s306F2652D8535AD8AD0DE28AA5F6B205)] [added: F- [3](#s8E0FB6C6E2985A8BA640F4C21DC17713)] |
| [Consolidated Statements of [removed: Income](#s9C38A6318D635BEE93BE40E7AB8D00C0)] [added: Income](#sEB02A843F45F578BA82A21237BAF4B87)] | [removed: F-[4](#s9C38A6318D635BEE93BE40E7AB8D00C0)] [added: F- [4](#sEB02A843F45F578BA82A21237BAF4B87)] |
| [Consolidated Statements of Comprehensive Income [removed: (Loss)](#s76E8A81CB99E5FD59DE5EF66BF6989DE)] [added: (Loss)](#s1B0D7E71565F5657B686EBEDB40446B0)] | [removed: F-[5](#s76E8A81CB99E5FD59DE5EF66BF6989DE)] [added: F- [5](#s1B0D7E71565F5657B686EBEDB40446B0)] |
| [Consolidated Statements of Changes in [removed: Equity](#s15b51ef276aa4ff6a3058cd23744e791)] [added: Equity](#s11f0a8d3dff44c1b8cb6b33c9a1f868d)] | [removed: F-[6](#s15b51ef276aa4ff6a3058cd23744e791)] [added: F- [6](#s11f0a8d3dff44c1b8cb6b33c9a1f868d)] |
| [Consolidated Statements of Cash [removed: Flows](#sA98D31383E035B85B7AC399811E26838)] [added: Flows](#sB0BD2A6849F95962BAD4BB55F0EA0BBC)] | [removed: F-[7](#sA98D31383E035B85B7AC399811E26838)] [added: F- [7](#sB0BD2A6849F95962BAD4BB55F0EA0BBC)] |
| [Notes to Consolidated Financial [removed: Statements](#sA4DEB4862A845A9691067B4320A984E0)] [added: Statements](#sCC11936CD7C05D66AF33193C59DD2A65)] | [removed: F-[8](#sA4DEB4862A845A9691067B4320A984E0)] [added: F- [8](#sCC11936CD7C05D66AF33193C59DD2A65)] |
We have audited the accompanying consolidated balance sheets of Nasdaq, Inc. (the Company) as of December 31, [removed: 2017 and 2016,] [added: 2018] and [added: 2017,] the related consolidated statements of income, comprehensive income (loss), changes in equity and cash flows for each of the three years in the period ended December 31, [removed: 2017] [added: 2018] and the related notes (collectively referred to as the “consolidated financial statements”).
In our opinion, the consolidated financial statements present fairly, in all material respects, the financial position of the Company at December 31, [removed: 2017] [added: 2018] and [removed: 2016,] [added: 2017,] and the results of its operations and its cash flows for each of the three years in the period ended December 31, [removed: 2017,] [added: 2018,] in conformity with U.S. generally accepted accounting principles.
We also have audited, in accordance with the standards of the Public Company Accounting Oversight Board (United States) (PCAOB), the Company's internal control over financial reporting as of December 31, [removed: 2017,] [added: 2018,] based on criteria established in Internal Control-Integrated Framework issued by the Committee of Sponsoring Organizations of the Treadway Commission (2013 framework), and our report dated February [removed: 28, 2018] [added: 22, 2019] expressed an unqualified opinion thereon.
| | [removed: December 31,] 2017 | | | | [removed: December 31,] 2016 | | | [added: | | | | | | | | | | | |]
| | (Registrant) | | | |
| | | |
| --- | --- | --- |
| | | |
| | | |
| | | |
| | | |
| | | |
| | | |
| | | |
| | | |
| | | |
| | | |
| | | |
| | | |
| | | |
| | | |
F- 1
F- 2
| Other current assets | 390 | | | | 532 | | |
| Total assets | $ | 15,700 | | | $ | 15,354 | |
| Total liabilities | 10,251 | | | | 9,474 | | |
F- 3
| | Years Ended December 31, | | | | | | | | | | |
| Corporate Services | 528 | | | | 501 | | | | 477 | | |
| Market Technology | 270 | | | | 247 | | | | 241 | | |
| Other revenues | 56 | | | | 194 | | | | 191 | | |
| Total revenues | 4,277 | | | | 3,948 | | | | 3,704 | | |
| Operating income | 1,028 | | | | 991 | | | | 836 | | |
| Gain on sale of investment security | 118 | | | | — | | | | — | | |
| Net gain on divestiture of businesses | 33 | | | | — | | | | | | |
F- 4
| | Years Ended December 31, | | | | | | | | | | |
| Net income | $ | 458 | | | $ | 729 | | | $ | 106 | |
| (1) | Excludes a reclassification impact of Tax Reform of $417 million. See “Tax Cuts and Jobs Act,” of Note 17, “Income Taxes,” for further discussion. |
F- 5
| | | | | | | | | | | | | | | | | | | | | | | | | | | |
| --- | --- | --- | --- | --- | --- | --- | --- | --- | --- | --- | --- | --- | --- | --- | --- | --- | --- | --- | --- | --- | --- | --- | --- | --- | --- | --- |
| | | | | | | | | | | | | | | | | | | | | | | | | | | |
| Other comprehensive income | — | | | — | | | | — | | | | — | | | | 117 | | | | — | | | | 117 | | |
| | | | | |
| | | | |
| | | | |
| | | | |
| | | | |
| | | | |
| | | | |
| | | | |
| | | | |
| | | | |
| | | | |
| | | | |
| | | | |
F-1
February 28, 2018
F-2
F-3
| | | | | | | | | | | | | |
| --- | --- | --- | --- | --- | --- | --- | --- | --- | --- | --- | --- | --- |
| | | | | | | | | | | | | |
| Total revenues | | 3,965 | | | | 3,705 | | | | 3,403 | | |
| Operating income | | 999 | | | | 839 | | | | 720 | | |
| Net income | | 734 | | | | 108 | | | | 427 | | |
| Net loss attributable to noncontrolling interests | | — | | | | — | | | | 1 | | |
F-4
| | | | | | | | | | | | | |
| --- | --- | --- | --- | --- | --- | --- | --- | --- | --- | --- | --- | --- |
| | | | | | | | | | | | | |
| Net income | | $ | 734 | | | $ | 108 | | | $ | 427 | |
| Net foreign currency translation gains (losses) | | 214 | | | | (183 | | ) | | (283 | | ) |
| Total | | 118 | | | | (115 | | ) | | (183 | | ) |
| Comprehensive income (loss) | | 851 | | | | (7 | | ) | | 245 | | |
| Comprehensive loss attributable to noncontrolling interests | | — | | | | — | | | | 1 | | |
F-5
| | | | | | | | | | | | | | | | | | | | | | | | | | | | | | | | |
| --- | --- | --- | --- | --- | --- | --- | --- | --- | --- | --- | --- | --- | --- | --- | --- | --- | --- | --- | --- | --- | --- | --- | --- | --- | --- | --- | --- | --- | --- | --- | --- |
| | | | | | | | | | | | | | | | | | | | | | | | | | | | | | | | |
| Balance at December 31, 2014 | 168,795,263 | | | $ | 2 | | | $ | 3,222 | | | | $ | (41 | ) | | $ | (682 | ) | | $ | 3,292 | | | $ | 1 | | | $ | 5,794 | |
| Net income (loss) | — | | | — | | | | — | | | — | | — | | | | — | | | | 428 | | | | (1 | | ) | | 427 | | |
| Share repurchase program | (7,191,685 | ) | | — | | | | (340 | | ) | | | (37 | | ) | | — | | | | — | | | | — | | | | (377 | | ) |
An excerpt. Shown here: 40 of 799 rewritten, 40 of 727 added and 40 of 566 removed. The counts are complete. For every sentence, read Item 16. Form 10-K Summary in the FY2018 filing and the FY2017 filing.