 filings.tools
Nasdaq (NDAQ) 10-K risk factor changes: FY2019 vs FY2018
The 2019-12-31 10-K against the 2018-12-31 one, compared heading by heading and sentence by sentence. One of these filings carries no fiscal year tag, so its year is the calendar year of the period end.
Item 1A135 rewritten47 added23 removed450 unchanged
All filing items1,852 rewritten924 added926 removed2,361 unchanged
Summary
counted, not written
- Item 1A headings could not be compared: only 0 carried over between the two years, which usually means one filing was read wrongly, so none is reported as new or removed.
- Sentence by sentence, 924 added, 926 removed, 1,852 rewritten and 2,361 unchanged across 16 items that differ.
Sentences by item
22 items, with every count and a link to each item that changed
Underlined words on a shaded ground are new in FY2019; struck-through words were in FY2018. Sentences that are wholly new or wholly gone are labelled rather than marked.
Item 1A. Risk Factors
135 rewritten, 47 added, 23 removed, 450 unchanged
[removed: The] [added: *The] risks and uncertainties described below are not the only ones facing us.
If any of the following risks actually occur, our business, financial condition, or operating results could be adversely [removed: affected.][added: affected.*]
[removed: Economic] [added: Economic] conditions and market factors, which are beyond our control, may adversely affect our business and financial [removed: condition.][added: condition.]
Our business performance is impacted by a number of factors, including general economic [removed: conditions in both the U.S. and Europe,] [added: conditions,] market volatility, changes in investment patterns and priorities, and other factors that are generally beyond our control.
Poor economic conditions may result in a reduction in the demand for our products and services, including our market technology, data, [removed: index] [added: indexes] and corporate solutions, a decline in trading volumes or values and deterioration of the economic welfare of our listed companies.
[added: In addition,] our Market Services businesses receive revenues from a relatively small number of customers concentrated in the financial industry, so any event that impacts one or more customers or the financial industry in general could impact our revenues.
Adverse conditions may jeopardize the ability of our listed companies to comply with the continued listing requirements of our [removed: exchanges.][added: exchanges, or reduce the number of issuers launching IPOs.]
Professional subscriptions to our data products are at risk if staff reductions occur in financial services [removed: companies,] [added: companies or if our customers consolidate,] which could result in significant reductions in our professional user [removed: revenue.][added: revenue or expose us to increased risks relating to dependence on a smaller number of customers.]
In addition, adverse market conditions may cause reductions in the number of non-professional investors with investments in the market and in ETP [removed: assets under management] [added: AUM] tracking Nasdaq indexes.
[removed: The] [added: The] industries we operate in are highly [removed: competitive.][added: competitive.]
In particular, the trading industry is characterized by [removed: intense] price competition.
In addition, pricing in our Corporate Services, [removed: Index Licensing and Services] [added: Indexes] and Market Technology businesses is subject to competitive pressures.
[removed: System] [added: System] limitations or [removed: failures could] [added: failures could] harm our [removed: business.][added: business.]
[removed: If new] systems [removed: fail to operate as intended or our existing systems] cannot expand to cope with increased demand or otherwise fail to perform, we could experience unanticipated disruptions in service, slower response times and delays in the introduction of new products and services.
While we have programs in place to identify and minimize our exposure to vulnerabilities and work in collaboration with the technology industry to share corrective measures with our business partners, we cannot guarantee that such events will not [added: occur in the future.]
[removed: We] [added: We] must continue to introduce new products, initiatives and enhancements to maintain our competitive [removed: position.][added: position.]
In our technology operations, we have invested substantial amounts in the development of system platforms, the rollout of our platforms and the adoption of new [removed: technologies, such as blockchain, machine intelligence and the cloud.][added: technologies.]
[removed: A] [added: A] decline in trading and clearing volumes or values or market share will decrease our trading and clearing [removed: revenues.][added: revenues.]
Finally, declines in market share of Nasdaq-listed [removed: securities] [added: securities, or new SEC rules and regulations,] could lower The Nasdaq Stock Market’s share of tape pool revenues under the consolidated data plans, thereby reducing the revenues of our [added: Market] Data [removed: Products] business.
[removed: Our] [added: Our] role in the global marketplace may place us at greater risk for a [removed: cyberattack.][added: cyberattack.]
[removed: The] [added: The] success of our business depends on our ability to keep up with rapid technological and other competitive changes affecting our industry.
Specifically, we must complete development of, successfully implement and maintain platforms that have the functionality, performance, capacity, reliability and speed required by our business and our regulators, as well as by our [removed: customers.][added: customers.]
[added: If we are unable to develop our platforms to include other] products and markets, or if our platforms do not have the required functionality, performance, capacity, reliability and speed required by our business and our regulators, as well as by our customers, we may not be able to compete successfully.
[removed: We] [added: We] may not be able to successfully integrate acquired businesses, which may result in an inability to realize the anticipated benefits of our [removed: acquisitions.][added: acquisitions.]
We must rationalize, coordinate and integrate the operations of our acquired [removed: businesses, including Quandl and Cinnober.][added: businesses.]
| • | difficulties, costs or complications in combining the companies’ operations, including technology platforms, which could lead to us not achieving the synergies we [removed: anticipate or customers not renewing their contracts with us as we migrate platforms;] |
For these reasons, we may not achieve the anticipated financial and strategic benefits from our acquisitions and [added: strategic] initiatives.
Any actual cost savings and synergies may be lower than we expect and may take a longer time to achieve than we [removed: anticipate, and we may fail to realize the anticipated benefits of acquisitions.]
[removed: We] [added: We] will need to invest in our operations to maintain and grow our business and to integrate acquisitions, and we may need additional funds, which may not be readily [removed: available.][added: available.]
[removed: This may include borrowing] additional funds to service debt payments, which may impair our ability to make investments in our business or to integrate acquired businesses.
[removed: We] [added: We] operate in a highly regulated industry and may be subject to censures, fines and enforcement proceedings if we fail to comply with regulatory obligations that can be ambiguous and can change [removed: unexpectedly.][added: unexpectedly.]
[removed: Our] [added: Our] clearinghouse operations expose us to risks, including credit or liquidity risks that may include defaults by clearing members, or insufficiencies in margins or default [removed: funds.][added: funds.]
Our clearinghouse operations expose us to counterparties with [added: differing risk profiles.]
[removed: We may be adversely impacted by the] financial distress or failure of a clearing member, which may cause us negative financial impact, reputational harm or regulatory consequences, including litigation or regulatory enforcement actions.
In September 2018, a member of the Nasdaq Clearing commodities market defaulted due to an inability to post sufficient collateral to cover increased margin requirements for the positions of the relevant [removed: member, which had experienced losses due to sharp adverse movements in the Nordic - German power market spread.][added: member.]
[removed: We] [added: We] are exposed to credit risk from third parties, including customers, counterparties and clearing [removed: agents.][added: agents.]
As of December 31, [removed: 2018,] [added: 2019,] we have contributed $15 million of clearing deposits to ICBC in connection with this clearing arrangement.
Counterparty risk of clients exists for Execution Access between the trade date and settlement date of the [added: individual transactions, which is at least one business day (or more, if specified by the U.S. Treasury issuance calendar).]
Counterparties that do not clear through the Fixed Income Clearing Corporation are subject to a credit due diligence process and may be required to post collateral, provide principal letters, or provide other forms of credit enhancement to Execution Access for the purpose of mitigating counterparty [removed: risk.]
[removed: The] [added: The] regulatory framework under which we operate and new regulatory requirements or new interpretations of existing regulatory requirements could require substantial time and resources for compliance, which could make it difficult and costly for us to operate our [removed: business.][added: business.]
RISKS RELATED TO OUR BUSINESS AND INDUSTRY
In addition, competitors recently have launched, or announced a plan to launch, new exchanges in the U.S., including an exchange established by a group of our customers.
If new systems fail to operate as intended or our existing
Additionally, it is also possible that we may allocate significant amounts of cash and other resources to product technologies or business models for which market demand is lower than anticipated.
In addition, the introduction of new products by competitors, the emergence of new industry
standards or the development of entirely new technologies to replace existing product offerings could render our existing or future products obsolete.
As cybersecurity threats continue to increase in frequency and sophistication, and as the domestic and international regulatory and compliance structure related to information security, data privacy and data usage becomes increasingly complex and exacting, we may be required to devote significant additional resources to strengthen our cybersecurity capabilities, and to identify and remediate any security vulnerabilities, which could adversely impact our business, financial condition and operating results.
We may be adversely impacted by the
For further discussion of the default, see Note 16, “Clearing Operations.” There are no assurances that similar defaults will not occur again, which could result in substantial expenses.
risk.
Nasdaq transferred the processor technology platform to our INET platform and this migration further enhanced the resiliency of the processor systems.
RISKS RELATED TO TRANSACTIONAL ACTIVITIES AND STRATEGIC RELATIONSHIPS
anticipate or customers not renewing their contracts with us as we migrate platforms;
Foreign acquisitions involve risks in addition to those mentioned above, including those related to integration of operations across different cultures and languages, our ability to enforce contracts in various jurisdictions, currency risks and the particular economic, political and regulatory risks associated with specific countries.
We may not be able to address these risks successfully, or at all, without incurring significant costs, delays or other operating problems that could disrupt our business and have a material adverse effect on our financial condition.
anticipate, and we may fail to realize the anticipated benefits of acquisitions.
| • | the inability to meet our target for return on invested capital; |
| • | increased debt obligations, which may adversely affect our targeted debt ratios; |
| • | risks to the continued achievement of our strategic direction; |
RISKS RELATED TO LEGAL AND REGULATORY MATTERS
There is a risk that trading will shift to exchanges that charge lower
Additionally, we are subject to the obligations under Regulation (EU) 2016/1011, compliance with which could be costly or cause a change in our business practices.
material adverse effect on our business, financial condition and operating results.
Permitted fee ranges are based on an interim domestic benchmark that is subject to change to an international benchmark, which could lower the permitted fees charged by marketplaces, which could adversely impact our revenues.
However, these terms are not clearly defined.
In recent years, there has been increased regulatory and governmental focus on issues
Similarly, the SEC has proposed possible changes to the governance of securities information processors as well as regulations to modify the infrastructure for the collection, consolidation and dissemination of market data for exchange-listed national market stocks, that if approved, may or may not adversely affect our revenues.
Although we carry insurance that may limit our risk of damages in some cases, we still may sustain
Although we have implemented a program to address privacy requirements, our efforts to comply with GDPR, CCPA
In addition, such changes may increase the cost of our offerings, which may cause our clients to reduce their use of our services.
RISKS RELATED TO LIQUIDITY AND CAPITAL RESOURCES
This may include borrowing
RISKS RELATED TO INTELLECTUAL PROPERTY AND BRAND REPUTATION
RISKS RELATED TO OUR OPERATIONS AND COMMON STOCK
fluctuations on our operating results.
Additionally, the likelihood of such errors or vulnerabilities is heightened as we acquire new products from third parties, whether as a result of acquisitions or otherwise.
its intended purpose.
Climate change may have a long-term adverse impact on our business.
While we seek to mitigate our business risks associated with climate change by establishing robust environmental and sustainability programs, there are inherent climate related risks wherever our business is conducted.
There is an increased focus from our investors, clients, employees, and other stakeholders concerning corporate citizenship and sustainability matters.
Over 73% of our revenues less transaction-based expenses in 2018 were recurring or subscription-based and if adverse conditions cause our customers to delay or cancel existing orders or subscriptions, our revenues will decline.
In addition,
occur in the future.
We also could incur significant expense in addressing any of these problems and in addressing related data security and privacy concerns.
If we are unable to develop our platforms to include other
| • | reliance on, or provision of, transition services; |
differing risk profiles.
Nasdaq Clearing followed default procedures and offset the future market risk on the defaulting member’s positions.
The default resulted in a loss of $133 million which was allocated to Nasdaq Clearing and the members of the commodities default fund in accordance with the liability waterfall.
individual transactions, which is at least one business day (or more, if specified by the U.S. Treasury issuance calendar).
notes that Nasdaq expects to be repaid at such time that the SEC approves the assessment of fees for the funding of CAT.
However, what constitutes “reasonable margin” is not clearly defined.
Additionally, the UTP Operating Committee approved Nasdaq’s proposal to transfer the processor technology from its current enhanced platform to our INET platform.
The migration, which was completed in late 2016, further enhanced the resiliency of the processor systems.
Technology products, the accuracy of the quote and trade information provided by our Data Products business and the accuracy of calculations used by our Index Licensing and Services business for indexes and unit investment trusts;
As discussed in “Goodwill and Indefinite-Lived Intangible Assets,” of Note 2, “Summary of Significant Accounting Policies,” to the consolidated financial statements, we recorded an indefinite-lived intangible asset impairment charge of $578 million in 2016.
expectations for future revenue.
property, anti-money laundering, technology export, foreign asset controls, foreign corrupt practices areas, employee labor and employment areas, including anti-discrimination and fair-pay laws and regulations.
However, the efforts we have
| • | the diversion of our management team from other operations; |
| • | problems with regulatory bodies; |
In April 2018, Nasdaq activated its disaster recovery and business continuity plans when its primary data center site in Vasby, Sweden became unavailable due to an errant fire suppression system.
Accordingly, there can be
An excerpt. Shown here: 40 of 135 rewritten, 40 of 47 added and all 23 removed. The counts are complete. For every sentence, read Item 1A. Risk Factors in the FY2019 filing and the FY2018 filing.
Item 7. Management’s Discussion and Analysis of Financial Condition and Results of Operations
413 rewritten, 182 added, 223 removed, 396 unchanged
Risk Factors.” For further discussion of our [removed: business, including our] growth strategy, [added: products and services, and competitive strengths,] see “Item 1.
[removed: 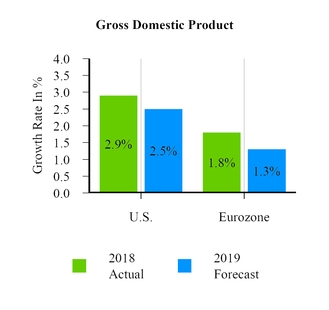][added: ]
[removed: Business Segments][added: Business Segments]
[removed: Sources] [added: Sources] of Revenues and Transaction-Based [removed: Expenses][added: Expenses]
[removed: Nasdaq’s] [added: Nasdaq’s] Operating [removed: Results][added: Results]
[removed: Key Drivers][added: Key Drivers]
| | | [removed: Year] [added: Year] Ended December [removed: 31,] [added: 31,] | | | | | | | | | | |
| | | [removed: 2018] [added: 2019] | | | | [removed: 2017] [added: 2018] | | | | [removed: 2016] [added: 2017] | | |
| [removed: Market Services] [added: Market Services] | | | | | | | | | | | | |
| [removed: Equity] [added: Equity] Derivative Trading and [removed: Clearing] [added: Clearing] | | | | | | | | | | | | |
| [removed: U.S.] [added: *U.S.] equity [removed: options] [added: options*] | | | | | | | | | | | | |
| Total industry average daily volume (in millions) | | [removed: 18.2] [added: 17.5] | | | | [removed: 14.7] [added: 18.2] | | | | [removed: 14.4] [added: 14.7] | | |
| Nasdaq PHLX matched market share | | [removed: 15.7] [added: 15.9] | | % | | [removed: 17.3] [added: 15.7] | | % | | [removed: 16.0] [added: 17.3] | | % |
| The Nasdaq Options Market matched market share | | [removed: 9.4] [added: 8.8] | | % | | [removed: 9.2] [added: 9.4] | | % | | [removed: 7.8] [added: 9.2] | | % |
| Nasdaq BX Options matched market share | | [removed: 0.4] [added: 0.2] | | % | | [removed: 0.7] [added: 0.4] | | % | | [removed: 0.8] [added: 0.7] | | % |
| Nasdaq ISE Options matched market share | | [removed: 8.8] [added: 9.0] | | % | | [removed: 9.1] [added: 8.8] | | % | | [removed: 5.8] [added: 9.1] | | % |
| Nasdaq GEMX Options matched market share | | [removed: 4.5] [added: 4.2] | | % | | [removed: 5.2] [added: 4.5] | | % | | [removed: 1.1] [added: 5.2] | | % |
| Nasdaq MRX Options matched market share | | [removed: 0.1] [added: 0.2] | | % | | 0.1 | | % | | 0.1 | | % |
| Total matched market share executed on Nasdaq’s exchanges | | [removed: 38.9] [added: 38.3] | | % | | [removed: 41.6] [added: 38.9] | | % | | [removed: 31.6] [added: 41.6] | | % |
| [removed: Nasdaq] [added: *Nasdaq] Nordic and Nasdaq Baltic options and [removed: futures] [added: futures*] | | | | | | | | | | | | |
| Total average daily volume of options and futures contracts(1) | | [removed: 339,139] [added: 366,289] | | | | [removed: 330,218] [added: 339,139] | | | | [removed: 376,730] [added: 330,218] | | |
| [removed: Cash] [added: Cash] Equity [removed: Trading] [added: Trading] | | | | | | | | | | | | |
| [removed: Total] [added: *Total] U.S.-listed [removed: securities] [added: securities*] | | | | | | | | | | | | |
| Total industry average daily share volume (in billions) | | [removed: 7.32] [added: 7.03] | | | | [removed: 6.53] [added: 7.32] | | | | [removed: 7.35] [added: 6.53] | | |
| Matched share volume (in billions) | | [removed: 358.5] [added: 348.1] | | | | [removed: 295.9] [added: 358.5] | | | | [removed: 321.6] [added: 295.9] | | |
| The Nasdaq Stock Market matched market share | | [removed: 15.9] [added: 17.2] | | % | | [removed: 14.2] [added: 15.9] | | % | | [removed: 14.0] [added: 14.2] | | % |
| Nasdaq BX matched market share | | [removed: 2.8] [added: 1.7] | | % | | [removed: 3.1] [added: 2.8] | | % | | [removed: 2.4] [added: 3.1] | | % |
| Nasdaq PSX matched market share | | [removed: 0.8] [added: 0.7] | | % | | 0.8 | | % | | [removed: 1.0] [added: 0.8] | | % |
| Total matched market share executed on Nasdaq’s exchanges | | [removed: 19.5] [added: 19.6] | | % | | [removed: 18.1] [added: 19.5] | | % | | [removed: 17.4] [added: 18.1] | | % |
| Market share reported to the FINRA/Nasdaq Trade Reporting Facility | | [removed: 31.3] [added: 29.8] | | % | | [removed: 34.5] [added: 31.3] | | % | | [removed: 33.1] [added: 34.5] | | % |
| Total market share(2) | | [removed: 50.8] [added: 49.4] | | % | | [removed: 52.6] [added: 50.8] | | % | | [removed: 50.5] [added: 52.6] | | % |
| [removed: Nasdaq] [added: *Nasdaq] Nordic and Nasdaq Baltic [removed: securities] [added: securities*] | | | | | | | | | | | | |
| Average daily number of equity trades executed on Nasdaq’s exchanges | | [removed: 618,579] [added: 590,705] | | | | [removed: 552,104] [added: 618,579] | | | | [removed: 472,428] [added: 552,104] | | |
| Total average daily value of shares traded (in billions) | | $ | [removed: 5.6] [added: 4.5] | | | $ | [removed: 5.3] [added: 5.6] | | | $ | [removed: 5.1] [added: 5.3] | |
| Total market share executed on Nasdaq’s exchanges | | [removed: 67.0] [added: 70.9] | | % | | [removed: 67.5] [added: 67.0] | | % | | [removed: 62.5] [added: 67.5] | | % |
| [removed: FICC] [added: FICC] | | | | | | | | | | | | |
| [removed: Fixed Income] [added: *Fixed Income*] | | | | | | | | | | | | |
| U.S. fixed income [removed: notional trading] volume [removed: (in billions)] [added: ($ billions traded)] | | $ | [removed: 15,983] [added: 10,465] | | | $ | [removed: 17,800] [added: 15,983] | | | $ | [removed: 21,504] [added: 17,800] | |
| Total average daily volume of Nasdaq Nordic and Nasdaq Baltic fixed income contracts | | [removed: 132,475] [added: 112,738] | | | | [removed: 116,357] [added: 132,475] | | | | [removed: 89,252] [added: 116,357] | | |
| [removed: Commodities] [added: *Commodities*] | | | | | | | | | | | | |
Business.” Unless stated otherwise, the comparisons presented in this discussion and analysis refer to the year-over-year comparison of changes in our financial condition and results of operations as of and for the fiscal years ended December 31, 2019 and December 31, 2018.
Discussion of fiscal year 2017 items and the year-over-year comparison of changes in our financial condition and results of operations as of and for the fiscal years ended December 31, 2018 and December 31, 2017 can be found in Part II, “Item 7.
Management’s Discussion and Analysis of Financial Condition and Results of Operations” of our Annual Report on Form 10-K for the fiscal year ended December 31, 2018, which was previously filed with the SEC on February 22, 2019.
| *IPOs* | | | | | | | | | | | | |
| Annualized recurring revenue, or ARR, (in millions)(9) | | $ | 260 | | | $ | 222 | | | $ | 205 | |
____________
| (9) | ARR is the annualized fourth quarter revenue of Market Technology support and SaaS subscription contracts. ARR is currently one of our key performance metrics to assess the health and trajectory of our business. ARR does not have any standardized definition and is therefore unlikely to be comparable to similarly titled measures presented by other companies. ARR should be viewed independently of revenue and deferred revenue and is not intended to be combined with or to replace either of those items. ARR is not a forecast and the active contracts during the reporting period used in calculating ARR may or may not be extended or renewed by our customers. |
_______
| Corporate Services | | 496 | | | | 487 | | | | 459 | | | | 1.8 | % | | 6.1 | % |
| Other revenues(1) | | 10 | | | | 97 | | | | 236 | | | | (89.7 | )% | | (58.9 | )% |
____________
| | | Year Ended December 31, | | | | | | | | | | | | Percentage Change | | | | |
____________
The decreases in equity derivative trading and clearing revenues and equity derivative
trading and clearing revenues less transaction-based expenses also included an unfavorable impact from foreign exchange of $3 million related to Nasdaq's Nordic exchanges.
Section 31 fees increased in 2019 compared with 2018 primarily due to higher average SEC fee rates, partially offset by lower dollar value traded on Nasdaq's exchanges.
Cash equity trading revenues and cash equity trading revenues less transaction-based expenses decreased in 2019 compared with 2018 reflecting in large part the lower volume and volatility market environment in the U.S. as compared to 2018 as mentioned above in “Equity Derivative Trading and Clearing Revenues.” The decrease in cash equity trading revenues in 2019 was primarily due to lower U.S. industry trading volumes and lower Section 31 pass-through fee revenue, partially offset by a higher U.S. gross capture rate.
The decrease in cash equity trading revenues less transaction-based expenses in 2019 primarily reflects lower U.S. and European industry trading volumes and a lower U.S. net capture rate due to a particularly strong 2018 period, partially offset by a higher European net capture rate.
The decreases in cash equity trading revenues and cash equity trading revenues less transaction-based expenses also included an unfavorable impact from foreign exchange of $7 million related to Nasdaq's Nordic exchanges.
to our customers in the form of incremental fees.
Brokerage, clearance and exchange fees decreased in 2019 compared with 2018 primarily due to lower Section 31 pass-through fees, as discussed above, and lower routing fees.
FICC revenues and FICC revenues less transaction-based expenses decreased in 2019 compared with 2018 primarily due to a decline in U.S. fixed income products revenues as well as a decrease in European commodities products revenues due to lower volumes and an unfavorable impact from foreign exchange of $4 million.
* * * * * *
| | | Year Ended December 31, | | | | | | | | | | | | Percentage Change | | | | |
| | | 2019 | | | | 2018 | | | | 2017 | | | | 2019 vs. 2018 | | | 2018 vs. 2017 | |
| Corporate Solutions | | 200 | | | | 197 | | | | 192 | | | | 1.5 | % | | 2.6 | % |
| Total Corporate Services | | $ | 496 | | | $ | 487 | | | $ | 459 | | | 1.8 | % | | 6.1 | % |
Listing services revenues increased in 2019 compared with 2018 primarily due to higher listings revenues resulting from an increase in the number of listed companies, partially offset by the run-off of fees earned from U.S. listing of additional shares and an unfavorable impact from foreign exchange of $5 million.
Corporate solutions revenues increased in 2019 compared with 2018 primarily due to an increase in both governance solutions revenues and investor relations intelligence revenues, partially offset by an unfavorable impact from foreign exchange of $2 million.
| | | | | | | | | | | | | | | | | | | |
| --- | --- | --- | --- | --- | --- | --- | --- | --- | --- | --- | --- | --- | --- | --- | --- | --- | --- | --- |
| | | | | | | | | | | | | | | | | | | |
| | | Year Ended December 31, | | | | | | | | | | | | Percentage Change | | | | |
| | | 2019 | | | | 2018 | | | | 2017 | | | | 2019 vs. 2018 | | | 2018 vs. 2017 | |
Investment data & analytics revenues increased in 2019 compared with 2018 primarily due to an increase in eVestment revenues resulting from a $23 million purchase price adjustment on deferred revenue in 2018, organic growth, and the impact of our acquisition of Quandl.
* * * * * *
| | | | | | | | | | | | | | | | | | | |
| --- | --- | --- | --- | --- | --- | --- | --- | --- | --- | --- | --- | --- | --- | --- | --- | --- | --- | --- |
| | | | | | | | | | | | | | | | | | | |
| | | Year Ended December 31, | | | | | | | | | | | | Percentage Change | | | | |
Business.”
Overview
Our Company
We are a leading provider of trading, clearing, marketplace technology, regulatory, securities listing, information and public and private company services.
Our global offerings are diverse and include trading and clearing across multiple asset classes, trade management services, market data products, financial indexes, investment data and analytics, capital formation solutions, corporate solutions, and market technology products and services.
Our technology powers markets across the globe, supporting equity derivative trading, clearing and settlement, cash equity trading, fixed income trading, trading surveillance and many other functions.
Strategic Direction
Under the strategic direction that we have been implementing over the past two years, we have focused on maximizing the resources, people and capital allocated to our largest growth opportunities, particularly in our Market Technology and Information Services businesses.
Our investments include our organic initiatives, notably the Nasdaq Financial Framework and related initiatives to deliver our marketplace expertise to banks, brokers and market operators outside the financial industry, as well as to provide compliance capabilities to the buy-side, and our eVestment private markets solutions.
It also includes the recent acquisitions of Cinnober and Quandl.
The other pillar of our strategic direction is our continued investment and commitment to sustain our marketplace core.
These foundational businesses, comprising the Market Services and Corporate Services segments, have earned Nasdaq a strategic position at the center of the capital markets in the U.S. and Europe.
We have been able to create strategic relationships across broker-dealers, investment professionals, corporate clients, and other global market centers, which then provides the potential to expand those relationships with our technology and analytics capabilities.
The focus for both our non-trading (which includes Market Technology, Information Services, Corporate Services and Trade Management Services) and trading (which includes all of Market Services except Trade Management Services) businesses continues to include identifying organic growth and developing adjacent opportunities to our existing businesses.
In addition, our strategy includes identifying acquisitions that both complement our strengths and extend our capabilities, as well as offer opportunities for revenue and expense synergies and increased shareholder value.
Factors Affecting Our Business
In broad terms, our business performance is impacted by a number of drivers including macroeconomic events affecting the risk and return of financial assets, investor sentiment, government and private sector demands for capital, the regulatory environment for capital markets, changes in technology, and changes in investment patterns and priorities.
Our future revenues and net income will continue to be influenced by a number of domestic and international economic trends including, among others:
| | |
| --- | --- |
| • | the challenges created by the automation of market data consumption, including competition and the quickly evolving nature of the market data business; |
| • | regulatory changes relating to market structure, including market data, or affecting certain types of instruments, transactions, pricing structures or capital market participants; |
| • | the demand for information about, or access to, our markets, which is dependent on the products we trade, our importance as a liquidity center, and the quality and pricing of our market data and trade management services; |
| • | the demand for ETPs licensed to Nasdaq's indexes, enhanced analytics and other financial products based on our indexes as well as changes to the underlying assets associated with existing licensed financial products; |
| • | the outlook of our technology customers for capital market activity; |
| • | technological advances and members’ and customers’ demand for speed, efficiency, and reliability; |
| • | the acceptance of cloud-based services and advanced analytics by our customers and global regulators; |
| • | trading volumes and values in equity derivatives, cash equities and FICC, which are driven primarily by overall macroeconomic conditions; |
| • | the number of companies seeking equity financing, which is affected by factors such as investor demand, the global economy, and availability of diverse sources of financing, as well as tax and regulatory policies; |
| • | the demand by companies and other organizations for the products sold by our Corporate Solutions business, which is largely driven by the overall state of the economy and the attractiveness of our offerings; |
| • | continuing pressure in transaction fee pricing due to intense competition in the U.S. and Europe; and |
| • | competition related to pricing, product features and service offerings. |
The following chart presents the current consensus forecast for gross domestic product growth:
Although employment and wage data in many regions seems robust, indicating that the underlying global economy is still quite strong, leading indicators in many regions are pointing to a slowdown.
Global gross domestic product growth forecasts have recently started to slow.
In the last quarter of 2018, consensus 2019 growth forecasts have declined 0.1 percentage points to 2.5% for the U.S. and 0.5 percentage points to 1.3% for the Eurozone.
There are a number of significant structural and political issues continuing to impact the global economy.
Uncertainty surrounding the impact of China's economy, trade tariffs and Brexit contributed to an increase in market volatility in the last quarter of 2018 and continue to pose a risk to global growth.
Additional impacts on our business drivers include the international enactment and implementation of legislative and regulatory initiatives (notably MiFID II in Europe), the evolution of market participants’ trading and investment strategies, and the continued rapid progression and deployment of new technology in the financial services industry.
The business environment that we expect may influence our financial performance in 2019 may be characterized as follows:
An excerpt. Shown here: 40 of 413 rewritten, 40 of 182 added and 40 of 223 removed. The counts are complete. For every sentence, read Item 7. Management’s Discussion and Analysis of Financial Condition and Results of Operations in the FY2019 filing and the FY2018 filing.
Item 1. Business
166 rewritten, 68 added, 69 removed, 286 unchanged
[removed: Overview][added: Overview]
[removed: History][added: History]
[removed: To keep] pace with our understanding of future trends and to ensure our continued success in the evolving business environment, we have focused on refining our vision, mission and strategy:
[removed: Our Vision:] [added: Our Vision:] We reimagine markets to realize the potential of tomorrow.
[removed: Our Mission:] [added: Our Mission:] We bring together ingenuity, integrity and insights to deliver markets that accelerate economic progress and empower people to achieve their greatest ambitions.
[removed: Our Strategy:] [added: Our Strategy:] Our strategic direction is driven by our continuous examination of: (i) key macroeconomic, regulatory and technology trends, (ii) consultation with our clients about [added: short- and long-term trends in their businesses and (iii) the competitive landscape.]
Under the strategic direction that we have been implementing over the past [removed: two] [added: three] years, we have focused on maximizing the resources, people and capital allocated to our largest growth opportunities, particularly in our Market Technology and Information Services [removed: businesses.][added: segments.]
| • | [removed: Increasing] [added: *Increasing] Investment in Businesses Where We See the Highest Growth [removed: Opportunity.] [added: Opportunity*.] We have increased investment in areas that we believe help solve our clients’ biggest challenges and are likely to generate growth for our stockholders. [removed: In 2018, these businesses included:] [added: These areas include:] the data analytics business within our Information Services [removed: segment,] [added: segment;] NPM, within our Corporate Services [removed: segment,] [added: segment;] and our Market Technology segment (including our regulatory technology business). |
Consistent with this objective, [added: in 2019] we [removed: recently] acquired [removed: eVestment and Quandl, Inc., which are part of our Information Services segment, and Sybenetix and] Cinnober Financial Technology AB, or Cinnober, which [removed: are] [added: is] now part of our Market Technology segment.
| • | [removed: Sustaining] [added: *Sustaining] Our [removed: Foundation.] [added: Foundation.*] As we strive to grow our business, we also have focused on enhancing our leadership position in the marketplaces in which we operate as we continue to innovate with new functionality and strong market share in our core markets. [added: For example, we expect the migration of Nasdaq BX Options to a new trading platform that leverages the NFF to be completed during the third quarter of this year. This updated technology will drive commonality across our internal derivatives markets.] |
| [removed: •] [added: *•*] | [removed: Optimizing] [added: *Optimizing] Slower Growth [removed: Businesses.] [added: Businesses*.] We continually review areas that are not critical to our core. In these areas, we expect to [added: continue to] target resiliency and efficiency versus growth, and free up resources when possible to redirect toward greater opportunities. [removed: In furtherance of this strategy,] [added: We completed several divestitures] in [removed: April 2018 we sold the public relations (Public Relations Solutions) and webcasting and webhosting (Digital Media Services) businesses within our Corporate Solutions business to West Corporation.] [added: 2019.] In [removed: addition, in December 2018,] [added: March 2019,] we [removed: sold our 5.0% ownership interest in LCH.] [added: completed] |
[removed: Products] [added: Products] and [removed: Services][added: Services]
[removed: Market Services][added: Market Services]
[removed: Equity] [added: Equity] Derivative Trading and [removed: Clearing][added: Clearing]
Together, our combined options market share in [removed: 2018] [added: 2019] represented the largest share of the U.S. market for multiply-listed options on equities and ETFs.
In Europe, Nasdaq offers trading in derivatives, such as stock options and [removed: futures, index options and] futures and [removed: fixed-income] [added: index] options and futures.
[removed: Cash] [added: Cash] Equity [removed: Trading][added: Trading]
In [removed: addition,] [added: Canada,] we operate [removed: a Canadian] [added: an] exchange with three independent markets, [added: Nasdaq Canada] CXC, [added: Nasdaq Canada] CX2 and [added: Nasdaq Canada] CXD, for the trading of Canadian-listed securities.
Collectively, the Nasdaq Nordic and Nasdaq Baltic exchanges offer trading in cash equities, depository receipts, warrants, convertibles, rights, fund units and [removed: ETFs.][added: ETFs, as well as trading and clearing of derivatives and clearing of resale and repurchase agreements.]
[removed: FICC][added: FICC]
Our FICC business includes the Nasdaq Fixed Income [removed: business, NFX] [added: business] and Nasdaq Commodities.
The electronic trading platform provides real-time institutional trading of benchmark [added: U.S. Treasury securities.]
Nasdaq [removed: Stockholm] is the largest bond listing venue in the Nordics, with more than [removed: 7,000] [added: 6,500] listed retail and institutional bonds.
Nasdaq Commodities’ offerings include derivatives in [removed: oil,] power, natural gas and carbon emission markets, [removed: tanker and dry cargo freight,] seafood, [removed: iron ore,] electricity certificates and clearing services.
[removed: Trade] [added: Trade] Management [removed: Services][added: Services]
[removed: We also offer the Nasdaq] Workstation, a browser-based, front-end interface that allows market participants to view data and enter orders, quotes and trade reports.
We provide [removed: co-location] [added: colocation] services to market participants, whereby we offer firms cabinet space and power to house their own equipment and servers within our data centers.
Additionally, we offer a number of wireless connectivity routes between select data centers using millimeter wave and [added: microwave technology.]
Our broker services operations [removed: offer] [added: business primarily offers] technology and customized securities administration solutions to financial participants in the Nordic market.
[removed: Corporate Services][added: Corporate Services]
[removed: Our Corporate Services] [added: These] businesses deliver critical capital market and governance solutions across the lifecycle of public and private companies.
[removed: Corporate Solutions][added: Corporate Solutions]
Our Corporate Solutions business serves [removed: corporate clients, including companies listed on our exchanges] [added: both public] and private [removed: companies.][added: companies and organizations.]
[removed: We help organizations enhance their ability to] understand and expand their global shareholder base, and improve corporate governance through our suite of advanced technology, analytics, and consultative services.
As of December 31, [removed: 2018,] [added: 2019,] we provided Corporate Solutions products and services in the following key areas:
| • | [removed: Investor] [added: *Investor] Relations [removed: Intelligence.] [added: Intelligence*.] We offer a global team of consultative experts that deliver advisory services including Strategic Capital Intelligence, Shareholder Identification and Perception Studies as well as an industry-leading [removed: software,] [added: platform,] Nasdaq IR Insight®, to investor relations professionals. These solutions allow investor relations officers to better manage their investor relations programs, understand their investor base, target new investors, manage meetings and consume key data elements such as equity research, consensus estimates and news. |
| • | [removed: Board & Leadership.] [added: *Governance Solutions.*] We provide a global technology offering that streamlines the meeting process for board of directors and executive leadership teams and helps them accelerate decision [removed: marking] [added: making] and strengthen governance. Our solutions protect sensitive data and facilitate productive collaboration, so board members and teams can work faster and more effectively. |
[removed: Listing Services][added: Listing Services]
As of December 31, [removed: 2018,] [added: 2019,] a total of [removed: 3,058] [added: 3,140] companies listed securities on The Nasdaq Stock Market, with [removed: 1,418] [added: 1,420] listings on The Nasdaq Global Select Market, [removed: 852] [added: 870] on The Nasdaq Global Market and [removed: 788] [added: 850] on The Nasdaq Capital Market.
We [removed: aggressively pursue] [added: seek] new [removed: listings from companies,] [added: listings,] including [removed: those undergoing] [added: from companies conducting] IPOs as well as companies [removed: seeking] [added: looking] to switch from alternative exchanges.
Nasdaq is a global technology company serving the capital markets and other industries.
Our diverse offerings of data, analytics, software and services enables clients to optimize and execute their business vision with confidence.
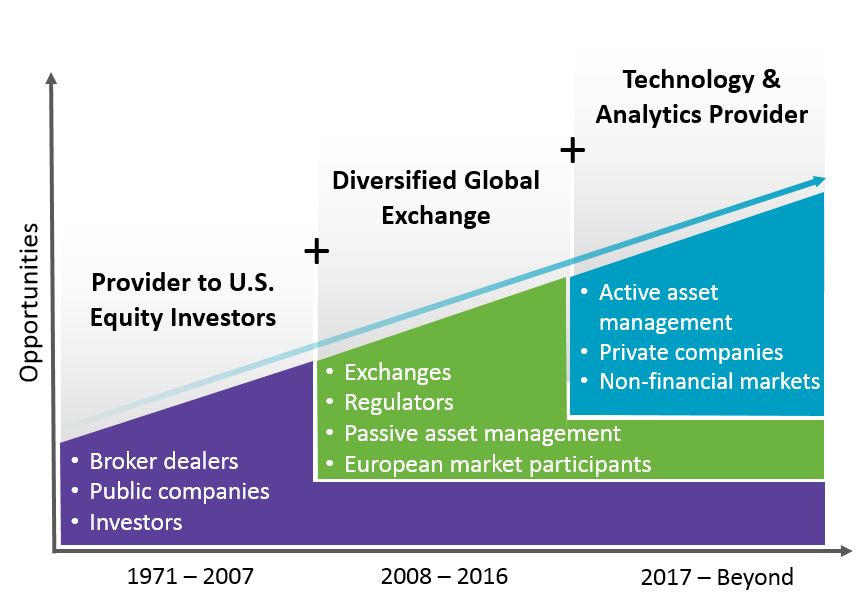
The chart below shows our historical evolution from 1971 through the present.
Growth Strategy
To keep
We also are continuing to invest in the Market Technology segment through the NFF and the expansion and enhancement of our Nasdaq Trade Surveillance offering, including the incorporation of machine intelligence capabilities.
the sale of our BWise enterprise governance, risk and compliance software platform.
In October 2019, we completed the divestiture of the Nordic Fund Market, an electronic mutual fund service that was a smaller unit of our Broker Services business, in November 2019, we sold the core assets of our NFX business and in January 2020, management commenced an orderly wind-down of our broker services operations business.
We manage, operate and provide our products and services in four business segments: Market Services, Corporate Services, Information Services and Market Technology.
These products are listed on Nasdaq Oslo ASA, except for seafood, which is listed on Fishpool, a third party platform.
We also offer the Nasdaq
Such services and solutions primarily consist of flexible back-office systems, which allow customers to efficiently manage safekeeping, settlement and corporate actions and reporting, and include connectivity to exchanges and central securities depositories.
In January 2020, we commenced an orderly wind-down of this broker services operations business.
We expect this wind-down to continue through the second quarter of 2021.
Our Corporate Services segment includes our Listing Services and Corporate Solutions businesses.
| IPOs | 188 | |
| Total | 313 | |
During 2019, we had 16 new listings resulting from new companies switching their listings from NYSE, NYSE American or IEX to join Nasdaq, and combined with companies that transferred additional securities to Nasdaq during 2019, an aggregate of $230 billion in global equity market capitalization switched to Nasdaq.
Our new U.S. corporate bond listing offering won 11 new issues and 37 existing bonds that transferred from NYSE.
Notable switches in 2019 included Exelon Corporation, ViacomCBS Inc., and Noble Energy Inc.
In 2019, NPM announced an agreement with a secondary fund advisor to provide enhanced execution capabilities for general partner, or GP, sponsored secondary transactions using our platform.
We believe that the combined offering can bring greater standardization and efficiency to this market while appealing to the broader ecosystem of GPs, limited partners and secondary investors.
As of December 31, 2019, 58 corporate bonds traded on the Corporate Bond exchange.
Our public company clients can be companies listed on our exchanges or other U.S. and global exchanges.
We help organizations enhance their ability to
In October 2019, Nasdaq acquired the Center for Board Excellence, or CBE, a provider of corporate governance and compliance solutions for boards of directors, CEOs, corporate secretaries and general counsels.
Our Information Services business provides the global investing community with access to the financial markets together with strong investment insights.
For both institutional and retail investors, our market and alternative data enhances transparency and access to the markets we operate, and we help guide investment decisions around the globe through our proprietary indexes and investment data and analytics.
We
futures on our indexes.
As of December 31, 2019, 332 ETPs listed in 20 countries and on 24 different exchanges tracked a Nasdaq index and accounted for $233 billion in AUM.
This includes approximately $100 billion in ETP AUM that tracked our smart beta indexes during this same time period, which accounted for approximately 43% of the total ETP AUM tracking Nasdaq's indexes.
NDW strengthens Nasdaq’s position as a leading smart beta index provider in the U.S.
Nasdaq Fund Network and Quandl are additional components in our suite of investment data and analytics offerings.
We have extended Nasdaq Fund Network to support the distribution of collective investment trusts, hedge funds, managed accounts, separate accounts and demand deposit accounts.
Quandl strengthens our position as a leading source for financial, economic, and alternative datasets.
For hedge funds, investment banks and other asset managers, we provide predictive insights to inform investment decisions from discovered data.
markets customers, including those in insurance liabilities securitization and digital advertising futures trading.
Market Technology currently offers its services to several digital assets exchanges, a commercial real estate market, the reinsurance market, an airline derivatives market, and several sports wagering operators.
We continue to expand the NFF offering to the global bank and broker community.
Nasdaq, Inc. is a leading provider of trading, clearing, marketplace technology, regulatory, securities listing, information and public and private company services.
Our global offerings are diverse and include trading and clearing across multiple asset classes, trade management services, data products, financial indexes, capital formation solutions, corporate solutions, and market technology products and services.
Our technology powers markets across the globe, supporting equity derivative trading, clearing and settlement, cash equity trading, fixed income trading, trading surveillance and many other functions.
Growth Strategy
short- and long-term trends in their businesses and (iii) the competitive landscape.
| | |
| --- | --- |
We also are investing further in the Market Technology segment through the Nasdaq Financial Framework, the expansion of our SMARTS products and customers, and our efforts to commercialize disruptive technologies, including blockchain, machine intelligence and the cloud.
U.S. Treasury securities.
These products are listed on two of Nasdaq’s derivatives exchanges.
We also operate NFX, which is a U.S. based designated contract market authorized by the CFTC.
NFX currently lists cash-settled derivatives in freight and energy (including oil, natural gas and U.S. power).
All trades with NFX are subject to clearing with OCC.
Shifting connectivity from proprietary networks to third-party networks has significantly reduced technology and network costs and increased our systems’ scalability while maintaining performance and reliability.
microwave technology.
We also earn revenues from annual and monthly exchange membership and registration fees.
Broker services provides services through a registered securities company that is regulated by the SFSA.
Services primarily consist of flexible back-office systems, which allow customers to entirely or partly outsource their company’s back-office functions.
We offer customer and account registration, business registration, clearing and settlement, electronic Nordic mutual fund service, corporate action handling for reconciliations and reporting to authorities.
Available services also include direct settlement with the Nordic central securities depositories, real-time updating and communication via the Society for Worldwide Interbank Financial Telecommunication (SWIFT) to deposit banks.
| • | Governance, Risk & Compliance. We offer a global suite of managed services and solutions for risk management, internal audit and regulatory compliance. |
In April 2018, we sold the Public Relations Solutions and Digital Media Services products and services that formerly
were part of our Corporate Solutions business to West Corporation.
In February 2019, we entered into an agreement with SAI Global to sell BWise, our internal audit, regulatory compliance management, and operational risk management software that comprises our governance, risk and compliance product offering.
Subject to regulatory approvals, works council and other representative body consultations and notifications in applicable jurisdictions, as well as other customary closing conditions, the transaction is expected to close in the first half of 2019.
| IPOs | 186 | |
| Total | 303 | |
The 18 NYSE or NYSE American listed companies that switched to The Nasdaq Stock Market, represented approximately $111.3 billion in market capitalization.
Notable switches included Xcel Energy, Inc., United Continental Holdings, Inc., and Regency Centers Corporation.
For smaller companies and growth
Prior to the second quarter, our Information Services segment was comprised of our Data Products and our Index Licensing and Services businesses.
proprietary products, including Nasdaq TotalView, our flagship market depth quote product.
As of December 31, 2018, we had 365 ETPs licensed to Nasdaq’s indexes which had $172 billion in assets under management.
We also operate the Nasdaq Global Index Family, which includes more than 40,000 indexes.
The family consists of global securities broken down by market segment, region, country, size and sector.
The Nasdaq Global Index Family covers 45 countries and approximately 9,000 securities.
NDW strengthens Nasdaq’s position as a leading smart beta index provider in the U.S. As of December 31, 2018, there were $7 billion in assets under management, or AUM, in ETPs that track Nasdaq smart beta indexes and $2 billion in AUM and assets under advisement tracking NDW investment strategies and research.
Through eVestment, we offer leading content and analytics used by asset managers, investment consultants and asset owners to help facilitate institutional investment decisions.
In November 2018, we acquired Quandl, Inc., a premier marketplace for unique, alpha-generating alternative datasets as well as for economic and financial datasets.
Market Technology currently offers its services to a loyalty points exchange, digital advertising exchange, reinsurance market and three horse racing operators.
An excerpt. Shown here: 40 of 166 rewritten, 40 of 68 added and 40 of 69 removed. The counts are complete. For every sentence, read Item 1. Business in the FY2019 filing and the FY2018 filing.
Cover and table of contents
81 rewritten, 34 added, 24 removed, 198 unchanged
[added: UNITED STATES] SECURITIES AND EXCHANGE [removed: COMMISSION][added: COMMISSION]
[removed: Washington,] [added: Washington,] D.C. [removed: 20549][added: 20549]
[removed: FORM 10-K][added: FORM 10-K]
| ☒ | [removed: ANNUAL] [added: ANNUAL] REPORT PURSUANT TO SECTION 13 OR 15(d) OF THE SECURITIES EXCHANGE ACT OF [removed: 1934] [added: 1934] | [added: |]
| | [removed: For] [added: For] the fiscal year [removed: ended December] [added: ended | December] 31, [removed: 2018] [added: 2019] |
| ☐ | [removed: TRANSITION] [added: TRANSITION] REPORT PURSUANT TO SECTION 13 OR 15(d) OF THE SECURITIES [removed: EXCHANGE ACT] [added: EXCHANGE ACT] OF [removed: 1934] [added: 1934] | [added: |]
| | [removed: For] [added: For] the transition [removed: period from] [added: period | from] ________ to [removed: ________] [added: ________] |
[removed: Commission] [added: Commission] file [removed: number: 000-32651][added: number: 001-38855]
[removed: Nasdaq, Inc.][added: Nasdaq, Inc.]
[removed: (Exact] [added: (Exact] name of registrant as specified in its [removed: charter)][added: charter)]
| [removed: Delaware (State] [added: (State] or Other Jurisdiction of Incorporation or [removed: Organization)] [added: Organization)] | [removed: 52-1165937 (I.R.S.] [added: | (I.R.S.] Employer Identification [removed: No.)] [added: No.)] | [added: |]
| [removed: One Liberty Plaza, New York, New York (Address] [added: (Address] of Principal Executive [removed: Offices)] [added: Offices)] | [removed: 10006 (Zip Code)] | [added: | (Zip Code) |]
[removed: Registrant’s] [added: Registrant’s] telephone number, including area code: [added: +1 212 401 8700]
| Title of each class | [added: | Trading Symbol(s) | |] Name of each exchange on which registered |
| [removed: Common] [added: Common] Stock, [removed: $.01] [added: $0.01] par value per [removed: share] [added: share] | [removed: The] [added: | NDAQ | | The] Nasdaq Stock [removed: Market] [added: Market] |
[removed: amendment to] [added: About] this Form [removed: 10-K.][added: 10-K]
As of June [removed: 30, 2018,] [added: 28, 2019,] the aggregate market value of the registrant’s common stock held by non-affiliates of the registrant was approximately [removed: $10.5] [added: $11.1] billion (this amount represents approximately [removed: 114.8] [added: 115.5] million shares of Nasdaq, Inc.’s common stock based on the last reported sales price of [removed: $91.27] [added: $96.17] of the common stock on The Nasdaq Stock Market on such date).
| [removed: Class] [added: Class] | | [removed: Outstanding] [added: Outstanding] at February [removed: 14, 2019] [added: 13, 2020] | [added: | |]
| Common Stock, [removed: $.01] [added: $0.01] par value per share | | [removed: 165,420,039] [added: 165,011,712 | |] shares |
| [added: Documents Incorporated by Reference:] Certain portions of the Definitive Proxy Statement for the [removed: 2019] [added: 2020] Annual Meeting of Stockholders [removed: |] [added: are incorporated by reference into] Part III [added: of this Form 10-K.] | [added: |]
| | | [removed: Page] [added: Page] |
[removed: | Part I. | | |][added: PART I]
| Item 1. | [removed: [Business](#s2d27c39c2ede455a81c5a979f65627cb)] [added: [Business](#s54c53305fc72479cb6dd537fb82b82d0)] | [removed: [2](#s2d27c39c2ede455a81c5a979f65627cb)] [added: [2](#s54c53305fc72479cb6dd537fb82b82d0)] |
| Item 1A. | [Risk [removed: Factors](#s9B572EF873D157BEA0E0909965744F0B)] [added: Factors](#s1b30ea93febc4e7ca3d24397cc9f022e)] | [removed: [13](#s9B572EF873D157BEA0E0909965744F0B)] [added: [13](#s1b30ea93febc4e7ca3d24397cc9f022e)] |
| Item 1B. | [Unresolved Staff [removed: Comments](#s9a442e49adfb420d90a3bb2db22bcbb2)] [added: Comments](#s7ae52a7112c5400bbf18c0675b2f599d)] | [removed: [26](#s9a442e49adfb420d90a3bb2db22bcbb2)] [added: [27](#s7ae52a7112c5400bbf18c0675b2f599d)] |
| Item 2. | [removed: [Properties](#s678d1792589a409b92fc185936c10c18)] [added: [Properties](#sf2a8a3e9672d4c3ba0cc0491ddec35c7)] | [removed: [26](#s678d1792589a409b92fc185936c10c18)] [added: [27](#sf2a8a3e9672d4c3ba0cc0491ddec35c7)] |
| Item 3. | [Legal [removed: Proceedings](#s5DF5E80F81F15397AAF1FA0F54EB1CA3)] [added: Proceedings](#s622ad52a3f034747808324786d7da9af)] | [removed: [26](#s5DF5E80F81F15397AAF1FA0F54EB1CA3)] [added: [27](#s622ad52a3f034747808324786d7da9af)] |
| Item 4. | [Mine Safety [removed: Disclosures](#s0486E89B55385505959984E963DE71F3)] [added: Disclosures](#s84d9ddfe2b4841afb51d0caeefba251c)] | [removed: [26](#s0486E89B55385505959984E963DE71F3)] [added: [27](#s84d9ddfe2b4841afb51d0caeefba251c)] |
| [removed: Part II.] [added: [Part II.](#sd31f35610c9f46fcb50ff0dd0597b604)] | | |
| Item 5. | [Market for Registrant’s Common Equity, Related Stockholder Matters and Issuer Purchases of Equity [removed: Securities](#s69A5D0BF0D4E5328BCFE6FE4495F5BAD)] [added: Securities](#sF84E1F6C222A534CBDFF6C9B13604536)] | [removed: [26](#s69A5D0BF0D4E5328BCFE6FE4495F5BAD)] [added: [27](#sF84E1F6C222A534CBDFF6C9B13604536)] |
| Item 6. | [Selected Financial [removed: Data](#sd19571c1512d4d0dbe49ca7d72495293)] [added: Data](#sb3107b90562042db960bd2c3b0057c87)] | [removed: [29](#sd19571c1512d4d0dbe49ca7d72495293)] [added: [29](#sb3107b90562042db960bd2c3b0057c87)] |
| Item 7. | [Management’s Discussion and Analysis of Financial Condition and Results of [removed: Operations](#s57AD388283D156408B792156081B0F00)] [added: Operations](#sAC1937E7B3965D3A948F61A6A41353A7)] | [removed: [30](#s57AD388283D156408B792156081B0F00)] [added: [30](#sAC1937E7B3965D3A948F61A6A41353A7)] |
| Item 7A. | [Quantitative and Qualitative Disclosures About Market [removed: Risk](#sac5883687c85459c81155cfdeb51ea17)] [added: Risk](#se50d1baf6a91461aaa49d5ba706620b7)] | [removed: [55](#sac5883687c85459c81155cfdeb51ea17)] [added: [53](#se50d1baf6a91461aaa49d5ba706620b7)] |
| Item 8. | [Financial Statements and Supplementary [removed: Data](#s2762dc6717204492b9f38bcb1c7ce400)] [added: Data](#sf8eb619bdb304952ad82fbfa35fea47c)] | [removed: [55](#s2762dc6717204492b9f38bcb1c7ce400)] [added: [53](#sf8eb619bdb304952ad82fbfa35fea47c)] |
| Item 9. | [Changes in and Disagreements with Accountants on Accounting and Financial [removed: Disclosure](#sa9ac3188cd8a4df3b0163c2ecc26a438)] [added: Disclosure](#s5963a179b7244e0f873dd24c83f2bc69)] | [removed: [56](#sa9ac3188cd8a4df3b0163c2ecc26a438)] [added: [54](#s5963a179b7244e0f873dd24c83f2bc69)] |
| Item 9A. | [Controls and [removed: Procedures](#s31CDAA530467574B8C58AD16A3E4C753)] [added: Procedures](#s5962077F59A55BECB3546A0970FD1945)] | [removed: [56](#s31CDAA530467574B8C58AD16A3E4C753)] [added: [54](#s5962077F59A55BECB3546A0970FD1945)] |
| Item 9B. | [Other [removed: Information](#s968B54793E005FF69FAFE3047B1DEE5C)] [added: Information](#s9CFB5453839C5F5A976586DE88F9B091)] | [removed: [59](#s968B54793E005FF69FAFE3047B1DEE5C)] [added: [56](#s9CFB5453839C5F5A976586DE88F9B091)] |
| [removed: Part III.] [added: [Part III.](#sDCCCF70057D85463B48552BD0E9D101B)] | | |
| Item 10. | [Directors, Executive Officers and Corporate [removed: Governance](#s08c94614084a4b73a2d743b1f425fd49)] [added: Governance](#sc1be729ca83c4ab4bd87f720d6008271)] | [removed: [59](#s08c94614084a4b73a2d743b1f425fd49)] [added: [56](#sc1be729ca83c4ab4bd87f720d6008271)] |
| Item 11. | [Executive [removed: Compensation](#s41acc17ccbcb45458d3bca980faff131)] [added: Compensation](#s80f5b415fcc6438d945e96e311b2b2a6)] | [removed: [59](#s41acc17ccbcb45458d3bca980faff131)] [added: [56](#s80f5b415fcc6438d945e96e311b2b2a6)] |
_______________________________
| OR | | |
___________________________________
| Delaware | | 52-1165937 | |
| | | | |
| --- | --- | --- | --- |
| | | | |
| 151 W. 42nd Street, | New York, | New York | 10036 |
| | | | | |
| --- | --- | --- | --- | --- |
| | | | | |
| 0.875% Senior Notes due 2030 | | NDAQ30 | | The Nasdaq Stock Market |
| 1.75% Senior Notes due 2029 | | NDAQ29 | | The Nasdaq Stock Market |
| 1.750% Senior Notes due 2023 | | NDAQ23 | | The Nasdaq Stock Market |
| 3.875% Senior Notes due 2021 | | NDAQ21 | | The Nasdaq Stock Market |
| | | | |
| --- | --- | --- | --- |
| | | | |
| | | | | |
| --- | --- | --- | --- | --- |
| | | | | |
Nasdaq, Inc.
| • | “Nasdaq First North” refers to our alternative marketplaces for smaller companies and growth companies in the Nordic and Baltic regions. |
2029 Notes: €600 million aggregate principal amount of 1.75% senior unsecured notes due March 28, 2029
2030 Notes: €600 million aggregate principal amount of 0.875% senior unsecured notes due February 13, 2030
AUM: Assets Under Management
CAT: A market-wide consolidated audit trail established by Nasdaq and other exchanges under an SEC approved plan
NFF: Nasdaq Financial Framework; Nasdaq's end-to-end technology solutions for market infrastructure operators, buy-side firms, sell-side firms and other non-financial markets
SaaS: Software as a Service
SI: Systematic Internalizer
* * * * * *
iii
| *•* | *our strategic direction;* |
| *•* | *our ability to develop and grow our non-trading businesses, including our technology and analytics offerings;* |
10-K 1 ndaq1231201810-k.htm 10-K
UNITED STATES
_______________________________
| | |
| --- | --- |
| OR | |
___________________________________
+1 212 401 8700
Indicate by check mark if disclosure of delinquent filers pursuant to Item 405 of Regulation S-K (§229.405 of this chapter) is not contained herein, and will
not be contained, to the best of registrant’s knowledge, in definitive proxy or information statements incorporated by reference in Part III of this Form 10-K or any
_____________________________________
| DOCUMENTS INCORPORATED BY REFERENCE | |
| Document | Parts Into Which Incorporated |
About This Form 10-K
BWise: BWise Beheer B.V. and its subsidiaries
DEA: Designated Examining Authority
DWA: Dorsey, Wright & Associates, LLC
eVestment: eVestment, Inc. and its subsidiaries
ISE: U.S. Exchange Holdings, Inc. and its subsidiaries
LCH: LCH Group Holdings Limited
SMARTS: SMARTS Group Holdings Pty
* * * * *
These disclosures will be included on Nasdaq’s website under “Investor Relations.”
| • | our strategy, growth forecasts and 2019 outlook; |
An excerpt. Shown here: 40 of 81 rewritten, all 34 added and all 24 removed. The counts are complete. For every sentence, read Cover and table of contents in the FY2019 filing and the FY2018 filing.
Item 2. Properties
2 rewritten, 4 added, 22 removed, 1 unchanged
Generally, our properties are not [removed: earmarked] [added: allocated] for use by a particular segment.
We believe the facilities [added: that] we occupy are adequate for the purposes for which they are currently used and are well-maintained.
We conduct our business operations in leased facilities.
We do not own any real property.
Our U.S. headquarters are located in New York, New York, and our European headquarters are located in Stockholm, Sweden.
We also lease space in multiple locations around the world, which are used for research and development, sales and support, and administrative activities, as well as for data centers and disaster preparedness facilities.
The following is a description of our principal properties which are all leased.
| | | | | | |
| --- | --- | --- | --- | --- | --- |
| Location | | Use | | Size (approximate, in square feet) | |
| Stockholm, Sweden | | European headquarters | | 264,000 | |
| New York, New York | | U.S. headquarters | | 113,000 | |
| Philadelphia, Pennsylvania | | General office space | | 74,000 | |
| Atlanta, Georgia | | General office space | | 68,000 | |
| New York, New York | | Location of MarketSite | | 66,000 | |
| Bengaluru, India | | General office space | | 63,000 | |
| New York, New York | | General office space | | 53,000 | |
| Vilnius, Lithuania | | General office space | | 51,000 | |
| Rockville, Maryland | | General office space | | 48,000 | |
| Manila, Philippines | | General office space | | 36,000 | |
| London, England | | General office space | | 31,000 | |
| Sydney, Australia | | General office space | | 29,000 | |
| Toronto, Canada | | General office space | | 26,000 | |
Outside the U.S., we also maintain leased locations in Belgium, China, Denmark, Estonia, Finland, France, Germany, Hong Kong, Iceland, Italy, Japan, Latvia, Netherlands, Norway, Singapore, South Korea, Spain and Ukraine.
In some countries, we maintain multiple locations.
Within the U.S., we also maintain leased locations in California, Colorado, Connecticut, Illinois, Massachusetts, New Jersey, Oregon, Virginia and Washington, DC.
In some states, we maintain multiple locations.
In addition to the above, we also lease approximately 67,000 square feet of space used as data centers and disaster preparedness facilities in multiple locations.
Item 4. Mine Safety Disclosures
1 rewritten, 0 added, 0 removed, 1 unchanged
[removed: PART II][added: PART II]
Item 5. Market for Registrant’s Common Equity, Related Stockholder Matters and Issuer Purchases of Equity Securities
20 rewritten, 42 added, 16 removed, 10 unchanged
[removed: Market Information][added: Market Information]
Our common stock is listed on The Nasdaq Stock Market under the ticker symbol “NDAQ.” As of February [removed: 14, 2019,] [added: 13, 2020,] we had approximately [removed: 250] [added: 235] holders of record of our common stock.
[removed: Issuer] [added: Issuer] Purchases of Equity [removed: Securities][added: Securities]
[removed: Share] [added: Share] Repurchase [removed: Program][added: Program]
See “Share Repurchase Program,” of Note [removed: 12,] [added: 13,] “Nasdaq Stockholders’ Equity,” to the consolidated financial statements for further discussion of our share repurchase program.
[removed: Purchases] [added: Purchases] of Equity Securities by the Issuer and Affiliated [removed: Purchasers][added: Purchasers]
The following table summarizes the share repurchase activity of our common stock during the fiscal quarter ended December 31, [removed: 2018:][added: 2019:]
| [removed: Period] [added: Period] | | [removed: (a)] [added: (a)] Total Number of Shares [removed: Purchased] [added: Purchased] | | | [removed: (b)] [added: (b)] Average Price Paid Per [removed: Share] [added: Share] | | | | [removed: (c)] [added: (c)] Total Number of Shares Purchased as Part of Publicly Announced Plans or [removed: Programs] [added: Programs] | | | [removed: (d)] [added: (d)] Maximum Dollar Value of Shares that May Yet Be Purchased Under the Plans or Programs (in [removed: millions)] [added: millions)] | | |
| Share repurchase program | | — | | | $ | — | | | — | | | $ | [removed: 332] [added: 632] | |
| [removed: Total] [added: Total] Quarter Ended December 31, [removed: 2018] [added: 2019] | | | | | | | | | | | | | | |
| (1) | Represents shares [removed: we purchased from employees in connection with the settlement of employee] [added: surrendered to us to satisfy] tax withholding obligations arising from the vesting of restricted stock and [removed: PSUs.] [added: PSUs issued to employees.] |
[removed: PERFORMANCE GRAPH][added: PERFORMANCE GRAPH]
The following graph compares the total return of our common stock to the Nasdaq Composite Index, the S&P 500 and a [removed: selected] peer group [added: selected by us] for the past five years.
The figures represented below assume an initial investment of $100 in the common stock or index at the closing price on December 31, [removed: 2013] [added: 2014] and the reinvestment of all dividends.
[removed: COMPARISON] [added: COMPARISON] OF 5 YEAR CUMULATIVE TOTAL [removed: RETURN*][added: RETURN*]
[removed: 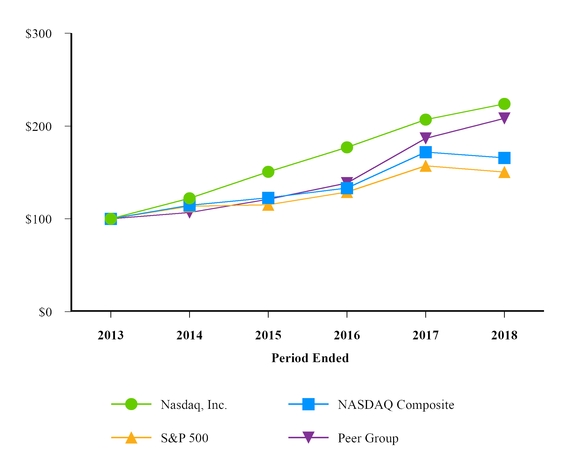][added: 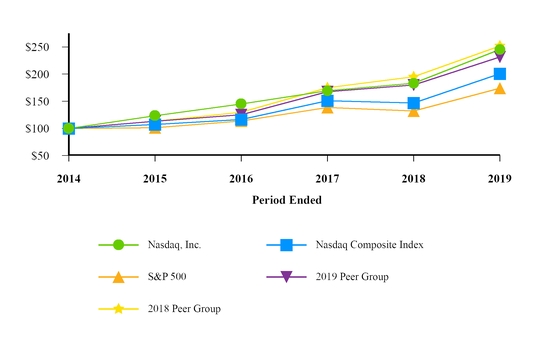]
* $100 invested on [removed: 12/31/2013] [added: 12/31/2014] in stock or index, including reinvestment of dividends.
| | [removed: Fiscal] [added: Fiscal] Year Ended December [removed: 31,] [added: 31,] | | | | | | | | | | | | | | | | | | | | | [added: | |]
| | [removed: 2013] [added: 2014] | | [removed: 2014] | | [added: 2015] | | [removed: 2015] | | [added: 2016] | | [removed: 2016] | | [added: 2017] | | [removed: 2017] | | [added: 2018] | | [removed: 2018] | | [added: 2019] | [added: | |]
Copyright© [removed: 2019] [added: 2020] Standard & Poor's, a division of S&P Global.
* * * * * *
| October 2019 | | | | | | | | | | | | | | |
| Employee transactions(1) | | 12,578 | | | $ | 98.24 | | | N/A | | | N/A | | |
| November 2019 | | | | | | | | | | | | | | |
| Share repurchase program | | — | | | $ | — | | | — | | | $ | 632 | |
| Employee transactions(1) | | 1,110 | | | $ | 99.23 | | | N/A | | | N/A | | |
| December 2019 | | | | | | | | | | | | | | |
| Share repurchase program | | — | | | $ | — | | | — | | | $ | 632 | |
| Employee transactions(1) | | 58,749 | | | $ | 106.72 | | | N/A | | | N/A | | |
| | | | | | | | | | | | | | | |
| Share repurchase program | | — | | | $ | — | | | — | | | $ | 632 | |
| Employee transactions(1) | | 72,437 | | | $ | 105.13 | | | N/A | | | N/A | | |
____________
N/A Not applicable.
We changed our peer group in 2019 to include a broader set of global exchanges with sizable market capitalization.
The new peer group, collectively referred to as the 2019 peer group, is comprised of the following companies:
| | | | | | |
| --- | --- | --- | --- | --- | --- |
| | | | | | |
| 2019 Peer Group | | | | | |
| • | ASX Limited | • | Deutsche Börse AG | • | LSE |
| • | B3 S.A.1 | • | Euronext N.V.1 | • | Singapore Exchange Limited1 |
| • | Bolsas Mexicana de Valores, S.A.B. de C.V.1 | • | Hong Kong Exchanges and Clearing Limited1 | • | TMX Group Limited |
| • | Cboe | • | ICE | | |
| • | CME Group Inc. | • | Japan Exchange Group, Inc1 | | |
1 Denotes company added to new peer group in 2019.
The old peer group, collectively referred to as the 2018 peer group, was comprised of the following companies:
| | | | | | |
| --- | --- | --- | --- | --- | --- |
| | | | | | |
| 2018 Peer Group | | | | | |
| • | ASX Limited | • | Deutsche Börse AG | • | TMX Group Limited |
| • | Cboe | • | ICE | | |
| • | CME Group Inc. | • | LSE | | |
| | | | | | | | | | | | | | | | | | | | | | | | |
| --- | --- | --- | --- | --- | --- | --- | --- | --- | --- | --- | --- | --- | --- | --- | --- | --- | --- | --- | --- | --- | --- | --- | --- |
| | | | | | | | | | | | | | | | | | | | | | | | |
| Nasdaq, Inc. | $ | 100 | | | $ | 123 | | | $ | 145 | | | $ | 169 | | | $ | 183 | | | $ | 245 | |
| Nasdaq Composite Index | 100 | | | | 107 | | | | 116 | | | | 151 | | | | 147 | | | | 200 | | |
| S&P 500 | 100 | | | | 101 | | | | 114 | | | | 138 | | | | 132 | | | | 174 | | |
| October 2018 | | | | | | | | | | | | | | |
| Employee transactions(1) | | 2,060 | | | 84.57 | | | | N/A | | | N/A | | |
| November 2018 | | | | | | | | | | | | | | |
| Employee transactions(1) | | 1,370 | | | 87.33 | | | | N/A | | | N/A | | |
| December 2018 | | | | | | | | | | | | | | |
| Employee transactions(1) | | 66,133 | | | 82.11 | | | | N/A | | | N/A | | |
| Employee transactions | | 69,563 | | | $ | 82.29 | | | N/A | | | N/A | | |
____________
The peer group includes ASX Limited, CBOE, CME Group Inc., Deutsche Börse A.G., ICE, LSE, and TMX Group Limited.
Information for the indices and the peer group is provided from December 31, 2013 through December 31, 2018.
| | | | | | | | | | | | | | | | | | | | | | |
| --- | --- | --- | --- | --- | --- | --- | --- | --- | --- | --- | --- | --- | --- | --- | --- | --- | --- | --- | --- | --- | --- |
| Nasdaq, Inc. | $ 100 | | $ | 122 | | | $ | 151 | | | $ | 177 | | | $ | 207 | | | $ | 224 | |
| Nasdaq Composite | 100 | | 115 | | | | 123 | | | | 133 | | | | 172 | | | | 166 | | |
| S&P 500 | 100 | | 114 | | | | 115 | | | | 129 | | | | 157 | | | | 150 | | |
| Peer Group | 100 | | 107 | | | | 121 | | | | 139 | | | | 187 | | | | 208 | | |
An excerpt. Shown here: all 20 rewritten, 40 of 42 added and all 16 removed. The counts are complete. For every sentence, read Item 5. Market for Registrant’s Common Equity, Related Stockholder Matters and Issuer Purchases of Equity Securities in the FY2019 filing and the FY2018 filing.
Item 6. Selected Financial Data
28 rewritten, 6 added, 1 removed, 8 unchanged
The following tables present selected financial data and should be read in conjunction with the consolidated financial statements and notes thereto of Nasdaq [added: and Management’s Discussion and Analysis of Financial Condition and Results of Operations] included elsewhere in this Form 10-K.
[removed: We completed a divestiture in April 2018 and several acquisitions during the years ended December 31, 2018, 2017, 2016 and 2015 and included the] [added: The] financial results of such acquisitions [added: are included] in our consolidated financial statements from the respective acquisition dates.
On January 1, 2018, we adopted [removed: Topic 606] [added: ASU 2014-09, “Revenue from Contracts with Customers (Topic 606),”] using the full retrospective method which required restatement of [added: our] 2017 and 2016 financial statements.
[removed: Selected] [added: Selected] Financial [removed: Data][added: Data]
| | | [removed: Year] [added: Year] Ended December [removed: 31,] [added: 31,] | | | | | | | | | | | | | | | | | | |
| | | [removed: 2018] [added: 2019] | | | | [removed: 2017] [added: 2018] | | | | [removed: 2016] [added: 2017] | | | | [removed: 2015] [added: 2016] | | | | [removed: 2014] [added: 2015] | | |
| | | [removed: (in] [added: (in] millions, except share and per share [removed: amounts)] [added: amounts)] | | | | | | | | | | | | | | | | | | |
| [removed: Statements] [added: Statements] of Income [removed: Data:] [added: Data:] | | | | | | | | | | | | | | | | | | | | |
| Total revenues | | $ | [removed: 4,277] [added: 4,262] | | | $ | [removed: 3,948] [added: 4,277] | | | $ | [removed: 3,704] [added: 3,948] | | | $ | [removed: 3,403] [added: 3,704] | | | $ | [removed: 3,500] [added: 3,403] | |
| Transaction-based expenses | | [removed: (1,751] [added: (1,727] | | ) | | [removed: (1,537] [added: (1,751] | | ) | | [removed: (1,428] [added: (1,537] | | ) | | [removed: (1,313] [added: (1,428] | | ) | | [removed: (1,433] [added: (1,313] | | ) |
| Revenues less transaction-based expenses | | [removed: 2,526] [added: 2,535] | | | | [removed: 2,411] [added: 2,526] | | | | [removed: 2,276] [added: 2,411] | | | | [removed: 2,090] [added: 2,276] | | | | [removed: 2,067] [added: 2,090] | | |
| Total operating expenses | | [removed: 1,498] [added: 1,518] | | | | [removed: 1,420] [added: 1,498] | | | | [removed: 1,440] [added: 1,420] | | | | [removed: 1,370] [added: 1,440] | | | | [removed: 1,313] [added: 1,370] | | |
| Operating income | | [removed: 1,028] [added: 1,017] | | | | [removed: 991] [added: 1,028] | | | | [removed: 836] [added: 991] | | | | [removed: 720] [added: 836] | | | | [removed: 754] [added: 720] | | |
| Net income attributable to Nasdaq | | [removed: 458] [added: 774] | | | | [removed: 729] [added: 458] | | | | [removed: 106] [added: 729] | | | | [removed: 428] [added: 106] | | | | [removed: 414] [added: 428] | | |
| Basic earnings per share | | $ | [removed: 2.77] [added: 4.69] | | | $ | [removed: 4.38] [added: 2.77] | | | $ | [removed: 0.64] [added: 4.38] | | | $ | [removed: 2.56] [added: 0.64] | | | $ | [removed: 2.45] [added: 2.56] | |
| Diluted earnings per share | | $ | [removed: 2.73] [added: 4.63] | | | $ | [removed: 4.30] [added: 2.73] | | | $ | [removed: 0.63] [added: 4.30] | | | $ | [removed: 2.50] [added: 0.63] | | | $ | [removed: 2.39] [added: 2.50] | |
| Cash dividends declared per common share | | $ | [removed: 1.70] [added: 1.85] | | | $ | [removed: 1.46] [added: 1.70] | | | $ | [removed: 1.21] [added: 1.46] | | | $ | [removed: 0.90] [added: 1.21] | | | $ | [removed: 0.58] [added: 0.90] | |
| Basic | | [removed: 165,349,471] [added: 164,931,628] | | | | [removed: 166,364,299] [added: 165,349,471] | | | | [removed: 165,182,290] [added: 166,364,299] | | | | [removed: 167,285,450] [added: 165,182,290] | | | | [removed: 168,926,733] [added: 167,285,450] | | |
| Diluted | | [removed: 167,691,299] [added: 166,970,161] | | | | [removed: 169,585,031] [added: 167,691,299] | | | | [removed: 168,800,997] [added: 169,585,031] | | | | [removed: 171,283,271] [added: 168,800,997] | | | | [removed: 173,018,849] [added: 171,283,271] | | |
| | | [removed: December 31,] [added: December 31,] | | | | | | | | | | | | | | | | | | |
| | | [removed: (in millions)] [added: (in millions)] | | | | | | | | | | | | | | | | | | |
| [removed: Balance] [added: Balance] Sheets [removed: Data:] [added: Data:] | | | | | | | | | | | | | | | | | | | | |
| Cash and cash equivalents and financial investments | | $ | [removed: 813] [added: 623] | | | $ | [removed: 612] [added: 813] | | | $ | [removed: 648] [added: 612] | | | $ | [removed: 502] [added: 648] | | | $ | [removed: 601] [added: 502] | |
| Default funds and margin deposits | | [removed: 4,742] [added: 2,996] | | | | [removed: 3,988] [added: 4,742] | | | | [removed: 3,301] [added: 3,988] | | | | [removed: 2,228] [added: 3,301] | | | | [removed: 2,194] [added: 2,228] | | |
| Goodwill | | [removed: 6,363] [added: 6,366] | | | | [removed: 6,586] [added: 6,363] | | | | [removed: 6,027] [added: 6,586] | | | | [removed: 5,395] [added: 6,027] | | | | [removed: 5,538] [added: 5,395] | | |
| Total assets | | [removed: 15,700] [added: 13,924] | | | | [removed: 15,354] [added: 15,700] | | | | [removed: 13,411] [added: 15,354] | | | | [removed: 11,257] [added: 13,411] | | | | [removed: 11,542] [added: 11,257] | | |
| Long-term debt | | [removed: 2,956] [added: 2,996] | | | | [removed: 3,727] [added: 2,956] | | | | [removed: 3,603] [added: 3,727] | | | | [removed: 2,364] [added: 3,603] | | | | [removed: 2,297] [added: 2,364] | | |
| Total Nasdaq stockholders' equity | | [removed: 5,449] [added: 5,639] | | | | [removed: 5,880] [added: 5,449] | | | | [removed: 5,428] [added: 5,880] | | | | [removed: 5,609] [added: 5,428] | | | | [removed: 5,794] [added: 5,609] | | |
We completed our acquisition of Cinnober in January 2019 and several acquisitions and divestitures during the years ended 2015 through 2019.
On January 1, 2019, we adopted ASU 2016-02, “Leases,” or ASU 2016-02, and elected the
optional transition method to initially apply the standard at the January 1, 2019 adoption date.
As a result, we applied the new lease standard prospectively to our leases existing or commencing on or after January 1, 2019.
Comparative periods presented were not restated upon adoption.
| | | 2019 | | | | 2018 | | | | 2017 | | | | 2016 | | | | 2015 | | |
Earlier periods were not restated.
Item 8. Financial Statements and Supplementary Data
6 rewritten, 12 added, 10 removed, 13 unchanged
Nasdaq’s consolidated financial statements, including Consolidated Balance Sheets as of December 31, [removed: 2018] [added: 2019] and [removed: 2017,] [added: 2018,] Consolidated Statements of Income for the years ended December 31, [removed: 2018, 2017] [added: 2019, 2018] and [removed: 2016,] [added: 2017,] Consolidated Statements of Comprehensive Income [removed: (Loss)] for the years ended December 31, [removed: 2018, 2017] [added: 2019, 2018] and [removed: 2016,] [added: 2017,] Consolidated Statements of Changes in [added: Stockholders'] Equity for the years ended December 31, [removed: 2018, 2017] [added: 2019, 2018] and [removed: 2016,] [added: 2017,] Consolidated Statements of Cash Flows for the years ended December 31, [removed: 2018, 2017] [added: 2019, 2018] and [removed: 2016] [added: 2017] and notes to our consolidated financial statements, together with a report thereon of Ernst & Young LLP, dated February [removed: 22, 2019,] [added: 25, 2020,] are attached hereto as pages F-1 through [removed: F-51] [added: F-49] and incorporated by reference herein.
[removed: Summarized] [added: Summarized] Quarterly Financial Data [removed: (Unaudited)][added: (Unaudited)]
| | | [removed: 1st Qtr] [added: 1st Qtr] | | | | [removed: 2nd Qtr] [added: 2nd Qtr] | | | | [removed: 3rd Qtr] [added: 3rd Qtr] | | | | [removed: 4th Qtr] [added: 4th Qtr] | | |
| | | [removed: 2018] [added: 2018] | | | | [removed: 2018] [added: 2018] | | | | [removed: 2018] [added: 2018] | | | | [removed: 2018] [added: 2018] | | |
| | | [removed: (in] [added: (in] millions, except per share [removed: amounts)] [added: amounts)] | | | | | | | | | | | | | | |
| Cash dividends declared per common share | | $ | [removed: 0.32] [added: 0.44] | | | $ | [removed: 0.38] [added: 0.47] | | | $ | [removed: 0.38] [added: 0.47] | | | $ | [removed: 0.38] [added: 0.47] | |
* * * * * *
| | | 2019 | | | | 2019 | | | | 2019 | | | | 2019 | | |
| Total revenues | | $ | 1,039 | | | $ | 1,061 | | | $ | 1,096 | | | $ | 1,065 | |
| Transaction-based expenses | | (405 | | ) | | (438 | | ) | | (464 | | ) | | (419 | | ) |
| Revenues less transaction-based expenses | | 634 | | | | 623 | | | | 632 | | | | 646 | | |
| Total operating expenses | | 359 | | | | 367 | | | | 406 | | | | 386 | | |
| Operating income | | 275 | | | | 256 | | | | 226 | | | | 260 | | |
| Net income attributable to Nasdaq | | $ | 247 | | | $ | 174 | | | $ | 150 | | | $ | 202 | |
| Basic earnings per share | | $ | 1.49 | | | $ | 1.05 | | | $ | 0.91 | | | $ | 1.23 | |
| Diluted earnings per share | | $ | 1.48 | | | $ | 1.04 | | | $ | 0.90 | | | $ | 1.21 | |
| | | 1st Qtr | | | | 2nd Qtr | | | | 3rd Qtr | | | | 4th Qtr | | |
| | | (in millions, except per share amounts) | | | | | | | | | | | | | | |
| | | | | | | | | | | | | | | | | |
| | | 2017 | | | | 2017 | | | | 2017 | | | | 2017 | | |
| Total revenues | | $ | 969 | | | $ | 994 | | | $ | 965 | | | $ | 1,019 | |
| Transaction-based expenses | | (388 | | ) | | (398 | | ) | | (362 | | ) | | (389 | | ) |
| Revenues less transaction-based expenses | | 581 | | | | 596 | | | | 603 | | | | 630 | | |
| Total operating expenses | | 335 | | | | 354 | | | | 341 | | | | 390 | | |
| Operating income | | 246 | | | | 242 | | | | 262 | | | | 240 | | |
| Net income attributable to Nasdaq | | $ | 168 | | | $ | 146 | | | $ | 170 | | | $ | 246 | |
| Basic earnings per share | | $ | 1.01 | | | $ | 0.88 | | | $ | 1.02 | | | $ | 1.47 | |
| Diluted earnings per share | | $ | 0.99 | | | $ | 0.87 | | | $ | 1.00 | | | $ | 1.45 | |
Item 9A. Controls and Procedures
15 rewritten, 3 added, 2 removed, 19 unchanged
[added: Disclosure controls and procedures.] Nasdaq’s management, with the participation of Nasdaq’s President and Chief Executive Officer, and Executive Vice President, [removed: Accounting and] Corporate Strategy and Chief Financial Officer, has evaluated the effectiveness of Nasdaq’s disclosure controls and procedures (as defined in Rule 13a-15(e) and Rule 15d-15(e) under the Exchange Act) as of the end of the period covered by this report.
Based upon that evaluation, Nasdaq’s President and Chief Executive Officer and Executive Vice President, [removed: Accounting and] Corporate Strategy and Chief Financial Officer, have concluded that, as of the end of such period, Nasdaq’s disclosure controls and procedures are effective.
[removed: (b) Internal] [added: Changes in internal] control over financial [removed: reporting.][added: reporting.]
There have been no changes in Nasdaq’s internal control over financial reporting (as defined in Rule 13a-15(f) and Rule 15d-15(f) under the Exchange Act) that occurred during the quarter ended December 31, [removed: 2018] [added: 2019] that have materially affected, or are reasonably likely to materially affect, Nasdaq’s internal control over financial reporting.
[removed: Management’s] [added: Management’s] Report on Internal Control Over Financial [removed: Reporting][added: Reporting]
Our management assessed the effectiveness of our internal control over financial reporting as of December 31, [removed: 2018,] [added: 2019,] based on criteria established in Internal Control - Integrated Framework issued by the Committee of Sponsoring Organizations of the Treadway Commission (COSO) (2013 framework).
Based on its assessment, our management believes that, as of December 31, [removed: 2018,] [added: 2019,] our internal control over financial reporting is effective.
[removed: Report] [added: Report] of Independent Registered Public Accounting [removed: Firm][added: Firm]
[removed: Opinion] [added: Opinion] on Internal Control over Financial [removed: Reporting][added: Reporting]
We have audited Nasdaq, Inc.’s internal control over financial reporting as of December 31, [removed: 2018,] [added: 2019,] based on criteria established in Internal [removed: Control—Integrated] [added: Control-Integrated] Framework issued by the Committee of Sponsoring Organizations of the Treadway Commission (2013 framework) (the COSO criteria).
In our opinion, Nasdaq, Inc. (the Company) maintained, in all material respects, effective internal control over financial reporting as of December 31, [removed: 2018,] [added: 2019,] based on the COSO criteria.
We also have audited, in accordance with the standards of the Public Company Accounting Oversight Board (United States) (PCAOB), the consolidated balance sheets of the Company as of December 31, [removed: 2018] [added: 2019] and [removed: 2017,] [added: 2018,] and the related consolidated statements of income, comprehensive [removed: income (loss),] [added: income,] changes in [added: stockholders’] equity and cash flows for each of the three years in the period ended December 31, [removed: 2018,] [added: 2019,] and the related notes and our report dated February [removed: 22, 2019] [added: 25, 2020] expressed an unqualified opinion thereon.
[removed: Basis] [added: Basis] for [removed: Opinion][added: Opinion]
[removed: Definition] [added: Definition] and Limitations of Internal Control Over Financial [removed: Reporting][added: Reporting]
/s/ [removed: Ernst] [added: *Ernst] & Young [removed: LLP][added: LLP*]
During the quarter ended June 30, 2019, we implemented a new enterprise resource planning, or ERP, system, by transitioning certain of our operations, including the general ledger, to the new ERP system.
We have modified our existing controls infrastructure, as well as added other processes and internal controls, to adapt to our new ERP system and to take advantage of the increased functionality of the new system.
February 25, 2020
(a) Disclosure controls and procedures.
February 22, 2019
Item 9B. Other Information
1 rewritten, 0 added, 0 removed, 1 unchanged
[removed: PART III][added: PART III]
Item 10. Directors, Executive Officers and Corporate Governance
2 rewritten, 0 added, 0 removed, 3 unchanged
Information about Section 16 reports, as required by Item 405 of Regulation S-K, is incorporated by reference from the discussion under the caption “Other [removed: Items-Section] [added: Items-Delinquent Section] 16(a) [removed: Beneficial Ownership Reporting Compliance”] [added: Reports”] in the Proxy Statement.
Information about Nasdaq’s code of ethics, as required by Item 406 of Regulation S-K, is incorporated by reference from the discussion under the caption [removed: “Corporate Governance”] [added: “Our Ethical Culture”] in the Proxy Statement.
Item 12. Security Ownership of Certain Beneficial Owners and Management and Related Stockholder Matters
6 rewritten, 4 added, 2 removed, 12 unchanged
[removed: Equity] [added: Equity] Compensation Plan [removed: Information][added: Information]
In addition, [removed: most] [added: nearly all] employees of Nasdaq and its subsidiaries are eligible to participate in the [removed: ESPP,] [added: ESPP] at 85.0% of the fair market value of our common stock on the price calculation date.
The following table sets forth information regarding outstanding options and shares reserved for future issuance under all of Nasdaq’s compensation plans as of December 31, [removed: 2018.][added: 2019.]
| [removed: Plan Category] [added: Plan Category] | | [removed: Number] [added: Number] of [removed: shares to] [added: shares to] be issued upon exercise of outstanding options, warrants and [removed: rights(a)(1)] [added: rights(a)(1)] | | | [removed: Weighted-average exercise] [added: Weighted-average exercise] price [removed: of outstanding] [added: of outstanding] options, warrants and [removed: rights(b)] [added: rights(b)] | | | | [removed: Number] [added: Number] of shares remaining [removed: available for] [added: available for] future issuance under equity compensation plans (excluding shares reflected in [removed: column(a))(c)] [added: column(a))(c)] | | |
| (1) | The amounts in this column include only the number of shares to be issued upon exercise of outstanding options, warrants and rights. As of December 31, [removed: 2018,] [added: 2019,] we also had [removed: 2,735,356] [added: 2,601,458] shares to be issued upon vesting of outstanding restricted stock and PSUs. |
| (2) | This amount includes [removed: 10,986,965] [added: 10,427,582] shares of common stock that may be awarded pursuant to the Equity Plan and [removed: 1,883,992] [added: 1,654,820] shares of common stock that may be issued pursuant to the ESPP. |
Employees in certain of our locations are ineligible due to local securities laws and regulations.
In jurisdictions where participation in the ESPP is permitted, all of our employees may participate.
| Equity compensation plans approved by stockholders | | 379,102 | | | $ | 54.32 | | | 12,082,402 | | (2) |
| Total | | 379,102 | | | $ | 54.32 | | | 12,082,402 | | (2) |
| Equity compensation plans approved by stockholders | | 447,716 | | | $ | 49.19 | | | 12,870,957 | | (2) |
| Total | | 447,716 | | | $ | 49.19 | | | 12,870,957 | | (2) |
Item 14. Principal Accounting Fees and Services
2 rewritten, 0 added, 0 removed, 0 unchanged
Information about principal [removed: accountant] [added: accounting] fees and services, as required by Item 9(e) of Schedule 14A, is incorporated herein by reference from the discussion under the heading “Audit Committee Matters-Annual Evaluation and [removed: 2019] [added: 2020] Selection of Independent Auditors” in the Proxy Statement.
[removed: PART IV][added: PART IV]
Item 15. Exhibits, Financial Statement Schedules
35 rewritten, 3 added, 16 removed, 90 unchanged
[removed: Exhibit Index][added: Exhibit Index]
| [removed: Exhibit Number] [added: Exhibit Number] | | |
| [removed: [4.4](http://www.sec.gov/Archives/edgar/data/1120193/000119312510008213/dex41.htm)] [added: [4.5](http://www.sec.gov/Archives/edgar/data/1120193/000119312513253519/d551100dex41.htm)] | | Indenture, dated as of [removed: January 15, 2010,] [added: June 7, 2013,] between [removed: Nasdaq] [added: Nasdaq, Inc.] (f/k/a The NASDAQ OMX Group, Inc.) and Wells Fargo Bank, National Association, as Trustee (incorporated herein by reference to Exhibit 4.1 to the Current Report on Form 8-K filed on [removed: January 19, 2010).] [added: June 10, 2013).] |
| [removed: [4.5](http://www.sec.gov/Archives/edgar/data/1120193/000119312510008213/dex42.htm)] [added: [4.7](http://www.sec.gov/Archives/edgar/data/1120193/000119312514217628/d734049dex41.htm)] | | [removed: First] [added: Second] Supplemental Indenture, dated as of [removed: January 15, 2010,] [added: May 29, 2014,] among [removed: Nasdaq] [added: Nasdaq, Inc.] (f/k/a The NASDAQ OMX Group, Inc.) and Wells Fargo Bank, National Association, as Trustee (incorporated herein by reference to Exhibit [removed: 4.2] [added: 4.1] to the Current Report on Form 8-K filed on [removed: January 19, 2010).] [added: May 30, 2014).] |
| [removed: [4.6](http://www.sec.gov/Archives/edgar/data/1120193/000119312510285688/dex41.htm)] [added: [4.9](http://www.sec.gov/Archives/edgar/data/1120193/000119312517291412/d445171dex41.htm)] | | [removed: Second] [added: Fifth] Supplemental Indenture, dated as of [removed: December 21, 2010,] [added: September 22, 2017,] among [removed: Nasdaq (f/k/a The NASDAQ OMX Group, Inc.)] [added: Nasdaq, Inc.] and Wells Fargo Bank, National Association, as Trustee (incorporated herein by reference to Exhibit 4.1 to the Current Report on Form 8-K filed on [removed: December 21, 2010).] [added: September 22, 2017).] |
| [removed: [4.7](http://www.sec.gov/Archives/edgar/data/1120193/000119312511045348/dex412.htm)] [added: [4.4](http://www.sec.gov/Archives/edgar/data/1120193/000119312511045348/dex412.htm)] | | Stockholders’ Agreement, dated as of December 16, 2010, between Nasdaq, Inc. (f/k/a The NASDAQ OMX Group, Inc.) and Investor AB (incorporated herein by reference to Exhibit 4.12 to the Annual Report on Form 10-K for the year ended December 31, 2010 filed on February 24, 2011). |
| [removed: [4.8](http://www.sec.gov/Archives/edgar/data/1120193/000119312513253519/d551100dex41.htm)] [added: [4.6](http://www.sec.gov/Archives/edgar/data/1120193/000119312513253519/d551100dex42.htm)] | | [added: First Supplemental] Indenture, dated as of June 7, 2013, [removed: between] [added: among] Nasdaq, Inc. (f/k/a The NASDAQ OMX Group, [removed: Inc.) and] [added: Inc.),] Wells Fargo Bank, National Association, as [removed: Trustee] [added: Trustee, Deutsche Bank AG, London Branch, as paying agent, and Deutsche Bank Luxembourg S.A., as registrar and transfer agent] (incorporated herein by reference to Exhibit [removed: 4.1] [added: 4.2] to the Current Report on Form 8-K filed on June 10, 2013). |
| [removed: [4.9](http://www.sec.gov/Archives/edgar/data/1120193/000119312513253519/d551100dex42.htm)] [added: [4.8](http://www.sec.gov/Archives/edgar/data/1120193/000119312516599270/d176138dex41.htm)] | | [removed: First] [added: Third] Supplemental Indenture, dated as of [removed: June 7, 2013,] [added: May 20, 2016,] among Nasdaq, [removed: Inc. (f/k/a The NASDAQ OMX Group, Inc.),] [added: Inc.,] Wells Fargo Bank, National Association, as Trustee, [removed: Deutsche] [added: and HSBC] Bank [removed: AG, London Branch,] [added: USA, National Association,] as paying [removed: agent,] [added: agent] and [removed: Deutsche Bank Luxembourg S.A.,] as registrar and transfer agent (incorporated herein by reference to [removed: Exhibit 4.2 to] the Current Report on Form 8-K filed on [removed: June 10, 2013).] [added: May 23, 2016).] |
| [removed: [4.10](http://www.sec.gov/Archives/edgar/data/1120193/000119312514217628/d734049dex41.htm)] [added: [4.10](http://www.sec.gov/Archives/edgar/data/1120193/000119312519094591/d724290dex42.htm)] | | [removed: Second] [added: Sixth] Supplemental Indenture, dated as of [removed: May 29, 2014,] [added: April 1, 2019,] among Nasdaq, [removed: Inc. (f/k/a The NASDAQ OMX Group, Inc.) and] [added: Inc.,] Wells Fargo Bank, National Association, as [removed: Trustee] [added: Trustee, and HSBC Bank USA, National Association, as paying agent and as registrar and transfer agent] (incorporated [removed: herein] by reference to Exhibit [removed: 4.1] [added: 4.2] to the [removed: Current Report on] Form [removed: 8-K] [added: 8-A] filed on [removed: May 30, 2014).] [added: April 1, 2019).] |
| [removed: [4.12](http://www.sec.gov/Archives/edgar/data/1120193/000119312516615297/d167131dex41.htm)] [added: [4.11](http://www.sec.gov/Archives/edgar/data/1120193/000119312513279639/d562243dex101.htm)] | | [removed: Fourth Supplemental Indenture,] [added: Registration Rights Agreement,] dated as of June [removed: 7, 2016,] [added: 28, 2013, by and] among Nasdaq, Inc. [added: (f/k/a The NASDAQ OMX Group, Inc.), BGC Partners, Inc., BGC Holdings, L.P.] and [removed: Wells Fargo Bank, National Association, as Trustee] [added: BGC Partners, L.P.] (incorporated herein by reference to [added: Exhibit 10.1 to] the Current Report on Form 8-K filed on [removed: June 7, 2016).] [added: July 1, 2013).] |
| [10.1](http://www.sec.gov/Archives/edgar/data/1120193/000112019318000010/ndaq6302018ex-101.htm) | | Amended and Restated Board Compensation Policy, effective on April [removed: 24, 2018] [added: 23, 2019] (incorporated herein by reference to Exhibit 10.1 to the Quarterly Report on Form 10-Q for the quarter ended June 30, [removed: 2018] [added: 2019] filed on August [removed: 1, 2018).*] [added: 5, 2019).*] |
| [removed: [10.3](http://www.sec.gov/Archives/edgar/data/1120193/000119312511045348/dex103.htm)] [added: [10.4](http://www.sec.gov/Archives/edgar/data/1120193/000119312511045348/dex103.htm)] | | Form of Nasdaq Non-Qualified Stock Option Award Certificate (incorporated herein by reference to Exhibit 10.3 to the Annual Report on Form 10-K for the year ended December 31, 2010 filed on February 24, 2011).* |
| [removed: [10.4](http://www.sec.gov/Archives/edgar/data/1120193/000112019318000010/ndaq6302018ex-102.htm)] [added: [10.5](http://www.sec.gov/Archives/edgar/data/1120193/000112019318000010/ndaq6302018ex-102.htm)] | | Form of Nasdaq Restricted Stock Unit Award Certificate (employees) (incorporated herein by reference to Exhibit 10.2 to the Quarterly Report on Form 10-Q for the quarter ended June 30, [removed: 2018] [added: 2019] filed on August [removed: 1, 2018).*] [added: 5, 2019).*] |
| [removed: [10.5](http://www.sec.gov/Archives/edgar/data/1120193/000112019318000010/ndaq6302018ex-103.htm)] [added: [10.6](http://www.sec.gov/Archives/edgar/data/1120193/000112019318000010/ndaq6302018ex-103.htm)] | | Form of Nasdaq Restricted Stock Unit Award Certificate (directors) (incorporated herein by reference to Exhibit 10.3 to the Quarterly Report on Form 10-Q for the quarter ended June 30, [removed: 2018] [added: 2019] filed on August [removed: 1, 2018).*] [added: 5, 2019).*] |
| [removed: [10.6](http://www.sec.gov/Archives/edgar/data/1120193/000112019318000010/ndaq6302018ex-104.htm)] [added: [10.7](http://www.sec.gov/Archives/edgar/data/1120193/000112019318000010/ndaq6302018ex-104.htm)] | | Form of Nasdaq One-Year Performance Share Unit Agreement (incorporated herein by reference to Exhibit 10.4 to the Quarterly Report on Form 10-Q for the quarter ended June 30, [removed: 2018] [added: 2019] filed on August [removed: 1, 2018).*] [added: 5, 2019).*] |
| [removed: [10.7](http://www.sec.gov/Archives/edgar/data/1120193/000112019318000010/ndaq6302018ex-105.htm)] [added: [10.8](http://www.sec.gov/Archives/edgar/data/1120193/000112019318000010/ndaq6302018ex-105.htm)] | | Form of Nasdaq Three-Year Performance Share Unit Agreement (incorporated herein by reference to Exhibit 10.5 to the Quarterly Report on Form 10-Q for the quarter ended June 30, [removed: 2018] [added: 2019] filed on August [removed: 1, 2018).*] [added: 5, 2019).*] |
| [removed: [10.8](http://www.sec.gov/Archives/edgar/data/1120193/000112019317000006/ndaq3312017ex-101.htm)] [added: [10.9](http://www.sec.gov/Archives/edgar/data/1120193/000112019317000006/ndaq3312017ex-101.htm)] | | Form of Nasdaq Continuing Obligations Agreement (incorporated herein by reference to Exhibit 10.1 to the Quarterly Report on Form 10-Q for the quarter ended March 31, 2017 filed on May 10, 2017).* |
| [removed: [10.9](http://www.sec.gov/Archives/edgar/data/1120193/000119312509039333/dex106.htm)] [added: [10.10](http://www.sec.gov/Archives/edgar/data/1120193/000119312509039333/dex106.htm)] | | Amended and Restated Supplemental Executive Retirement Plan, dated as of December 17, 2008 (incorporated herein by reference to Exhibit 10.6 to the Annual Report on Form 10-K for the year ended December 31, 2008 filed on February 27, 2009).* |
| [removed: [10.9.1](http://www.sec.gov/Archives/edgar/data/1120193/000119312509039333/dex1061.htm)] [added: [10.10.1](http://www.sec.gov/Archives/edgar/data/1120193/000119312509039333/dex1061.htm)] | | Amendment No. 1 to Amended and Restated Supplemental Executive Retirement Plan, effective as of December 31, 2008 (incorporated herein by reference to Exhibit 10.6.1 to the Annual Report on Form 10-K for the year ended December 31, 2008 filed on February 27, 2009).* |
| [removed: [10.10](http://www.sec.gov/Archives/edgar/data/1120193/000119312509039333/dex107.htm)] [added: [10.11](http://www.sec.gov/Archives/edgar/data/1120193/000119312509039333/dex107.htm)] | | Nasdaq Supplemental Employer Retirement Contribution Plan, dated as of December 17, 2008 (incorporated herein by reference to Exhibit 10.7 to the Annual Report on Form 10-K for the year ended December 31, 2008 filed on February 27, 2009).* |
| [removed: [10.11](http://www.sec.gov/Archives/edgar/data/1120193/000112019317000003/ndaq12312016ex-1010.htm)] [added: [10.12](http://www.sec.gov/Archives/edgar/data/1120193/000112019317000003/ndaq12312016ex-1010.htm)] | | Employment Agreement between Nasdaq and Adena Friedman, made and entered into on November 14, 2016 and effective as of January 1, 2017 (incorporated herein by reference to Exhibit 10.10 to the Annual Report on Form 10-K for the year ended December 31, 2016 filed on March 1, 2017).* |
| [removed: [10.12](http://www.sec.gov/Archives/edgar/data/1120193/000112019317000014/ndaq9302017ex-101.htm)] [added: [10.13](http://www.sec.gov/Archives/edgar/data/1120193/000112019317000014/ndaq9302017ex-101.htm)] | | Nonqualified Stock Option Award Certificate to Adena T. Friedman from Nasdaq, Inc. in connection with grant made on January 3, 2017 (incorporated herein by reference to Exhibit 10.1 to the Quarterly Report on Form 10-Q for the quarter ended September 30, 2017 filed on November 7, 2017).* |
| [removed: [10.13](http://www.sec.gov/Archives/edgar/data/1120193/000112019317000006/ndaq3312017ex-102.htm)] [added: [10.14](http://www.sec.gov/Archives/edgar/data/1120193/000112019317000006/ndaq3312017ex-102.htm)] | | Employment Offer Letter, dated as of May 10, 2016, between Nasdaq, Inc. and Michael Ptasznik (incorporated herein by reference to Exhibit 10.2 to the Quarterly Report on Form 10-Q for the quarter ended March 31, 2017 filed on May 10, 2017).* |
| [removed: [10.14](http://www.sec.gov/Archives/edgar/data/1120193/000112019318000012/ndaq9302018ex-101.htm)] [added: [10.16](http://www.sec.gov/Archives/edgar/data/1120193/000112019319000010/ndaq6302019ex-106.htm)] | | Employment [removed: Agreement between Nasdaq and Edward Knight, effective] [added: Offer Letter, dated] as of [removed: July 29, 2018] [added: April 30, 2019, between Nasdaq, Inc. and Lauren B. Dillard] (incorporated herein by reference to Exhibit [removed: 10.1] [added: 10.6] to the Quarterly Report on Form 10-Q for the quarter ended [removed: September] [added: June] 30, [removed: 2018] [added: 2019] filed on [removed: November 6, 2018).*] [added: August 5, 2019).*] |
| [removed: [10.16](http://www.sec.gov/Archives/edgar/data/1120193/000119312513457974/d635806dex101.htm)] [added: [10.17](http://www.sec.gov/Archives/edgar/data/1120193/000119312513457974/d635806dex101.htm)] | | Nasdaq Change in Control Severance Plan for Executive Vice Presidents and Senior Vice Presidents, effective November 26, 2013 (incorporated herein by reference to Exhibit 10.1 to the Current Report on Form 8-K filed on November 29, 2013).* |
| [removed: [10.17](http://www.sec.gov/Archives/edgar/data/1120193/000119312517137842/d382987dex101.htm)] [added: [10.18](http://www.sec.gov/Archives/edgar/data/1120193/000119312517137842/d382987dex101.htm)] | | Credit Agreement, dated as of April 25, 2017, among Nasdaq, Inc., the various lenders from time to time party thereto, Bank of America, N.A., as administrative agent and an issuing bank, and the other financial institutions party thereto (incorporated herein by reference to Exhibit 10.1 to the Current Report on Form 8-K filed on April 26, 2017). |
| [removed: [11](#s3DD8D8A7D3705AEC96BE8293C5659D18)] [added: [11](#sA81EA857E27B552B9133FFCAE0E85C12)] | | Statement regarding computation of per share earnings (incorporated herein by reference from Note [removed: 13] [added: 14] to the consolidated financial statements under Part II, Item 8 of this Form 10-K). |
| [removed: [21.1](https://www.sec.gov/Archives/edgar/data/1120193/000112019319000002/ndaq12312018ex-211.htm)] [added: [21.1](https://www.sec.gov/Archives/edgar/data/1120193/000112019320000004/ndaq12312019ex-211.htm)] | | List of all subsidiaries. |
| [removed: [23.1](https://www.sec.gov/Archives/edgar/data/1120193/000112019319000002/ndaq12312018ex-231.htm)] [added: [23.1](https://www.sec.gov/Archives/edgar/data/1120193/000112019320000004/ndaq12312019ex-231.htm)] | | Consent of Ernst & Young LLP. |
| [removed: [24.1](https://www.sec.gov/Archives/edgar/data/1120193/000112019319000002/ndaq12312018ex-241.htm)] [added: [24.1](https://www.sec.gov/Archives/edgar/data/1120193/000112019320000004/ndaq12312019ex-241.htm)] | | Powers of Attorney. |
| [removed: [31.1](https://www.sec.gov/Archives/edgar/data/1120193/000112019319000002/ndaq12312018ex-311.htm)] [added: [31.1](https://www.sec.gov/Archives/edgar/data/1120193/000112019320000004/ndaq12312019ex-311.htm)] | | Certification of President and Chief Executive Officer pursuant to Section 302 of the Sarbanes-Oxley Act of 2002 (“Sarbanes-Oxley”). |
| [removed: [31.2](https://www.sec.gov/Archives/edgar/data/1120193/000112019319000002/ndaq12312018ex-312.htm)] [added: [31.2](https://www.sec.gov/Archives/edgar/data/1120193/000112019320000004/ndaq12312019ex-312.htm)] | | Certification of Executive Vice President, [removed: Accounting and] Corporate Strategy and Chief Financial Officer pursuant to Section 302 of Sarbanes-Oxley. |
| [removed: [32.1](https://www.sec.gov/Archives/edgar/data/1120193/000112019319000002/ndaq12312018ex-321.htm)] [added: [32.1](https://www.sec.gov/Archives/edgar/data/1120193/000112019320000004/ndaq12312019ex-321.htm)] | | Certifications Pursuant to 18 U.S.C. Section 1350, as adopted pursuant to Section 906 of Sarbanes-Oxley. |
| [added: 101] | [added: |] The following materials from the Nasdaq, Inc. Annual Report on Form 10-K for the year ended December 31, [removed: 2018,] [added: 2019,] formatted in [removed: XBRL (eXtensible] [added: iXBRL (Inline eXtensible] Business Reporting Language): (i) Consolidated Balance Sheets as of December 31, [removed: 2018] [added: 2019] and December 31, [removed: 2017;] [added: 2018;] (ii) Consolidated Statements of Income for the years ended December 31, [removed: 2018, 2017] [added: 2019, 2018] and [removed: 2016;] [added: 2017;] (iii) Consolidated Statements of Comprehensive Income [removed: (Loss)] for the years ended December 31, [removed: 2018, 2017] [added: 2019, 2018] and [removed: 2016;] [added: 2017;] (iv) Consolidated Statements of Changes in [added: Stockholders'] Equity for the years ended December 31, [removed: 2018, 2017] [added: 2019, 2018] and [removed: 2016;] [added: 2017;] (v) Consolidated Statements of Cash Flows for the years [added: ended] December 31, [removed: 2018, 2017] [added: 2019, 2018] and [removed: 2016;] [added: 2017;] and (vi) notes to consolidated financial statements. |
| † | Schedules have been omitted pursuant to Item 601(b)(2) of Regulation S-K. [removed: Nasdaq hereby undertakes to furnish supplementally copies of any of the omitted schedules upon request by the SEC.] |
| [4.12](https://www.sec.gov/Archives/edgar/data/1120193/000112019320000004/ndaq12312019ex-412.htm) | | Description of Securities. |
| [10.3](http://www.sec.gov/Archives/edgar/data/1120193/000119312518175257/d583425dex101.htm) | | Nasdaq, Inc. Equity Incentive Plan (as amended and restated as of April 24, 2018) (incorporated herein by reference to Exhibit 10.1 to the Form S-8 filed on May 25, 2018).* |
| 104 | | Cover Page Interactive Data File, formatted in iXBRL and contained in Exhibit 101. |
| | | |
| --- | --- | --- |
| [2.2](http://www.sec.gov/Archives/edgar/data/1120193/000119312517280755/d442224dex21.htm) | | Agreement and Plan of Merger, dated as of September 4, 2017, by and among eVestment, Inc., Nasdaq, Inc., Echo Holding Company and Insight Venture Partners, LLC (solely in its capacity as representative for eVestment’s securityholders) (incorporated herein by reference to Exhibit 2.1 to the Current Report on Form 8-K filed on September 8, 2017).† |
| [4.11](http://www.sec.gov/Archives/edgar/data/1120193/000119312516599270/d176138dex41.htm) | | Third Supplemental Indenture, dated as of May 20, 2016, among Nasdaq, Inc., Wells Fargo Bank, National Association, as Trustee, and HSBC Bank USA, National Association, as paying agent and as registrar and transfer agent (incorporated herein by reference to the Current Report on Form 8-K filed on May 23, 2016). |
| [4.13](http://www.sec.gov/Archives/edgar/data/1120193/000119312517291412/d445171dex41.htm) | | Fifth Supplemental Indenture, dated as of September 22, 2017, among Nasdaq, Inc. and Wells Fargo Bank, National Association, as Trustee (incorporated herein by reference to Exhibit 4.1 to the Current Report on Form 8-K filed on September 22, 2017). |
| [4.14](http://www.sec.gov/Archives/edgar/data/1120193/000119312513279639/d562243dex101.htm) | | Registration Rights Agreement, dated as of June 28, 2013, by and among Nasdaq, Inc. (f/k/a The NASDAQ OMX Group, Inc.), BGC Partners, Inc., BGC Holdings, L.P. and BGC Partners, L.P. (incorporated herein by reference to Exhibit 10.1 to the Current Report on Form 8-K filed on July 1, 2013). |
| [10.18](http://www.sec.gov/Archives/edgar/data/1120193/000119312516513487/d161390dex101.htm) | | Credit Agreement, dated March 17, 2016, among Nasdaq, Inc., the various lenders party thereto and Bank of America, N.A., as Administrative Agent (incorporated herein by reference to the Current Report on Form 8-K filed on March 22, 2016). |
| [10.18.1](http://www.sec.gov/Archives/edgar/data/1120193/000119312517137842/d382987dex102.htm) | | Amendment No. 1 to Credit Agreement, dated as of April 25, 2017, among Nasdaq, Inc., the lenders party thereto and Bank of America, N.A., as administrative agent (incorporated herein by reference to Exhibit 10.2 to the Current Report on Form 8-K filed on April 26, 2017). |
| 101.INS | | XBRL Instance Document. |
| 101.SCH | | XBRL Taxonomy Extension Schema. |
| 101.CAL | | XBRL Taxonomy Extension Calculation Linkbase. |
| 101.DEF | | Taxonomy Extension Definition Linkbase. |
| 101.LAB | | XBRL Taxonomy Extension Label Linkbase. |
| 101.PRE | | XBRL Taxonomy Extension Presentation Linkbase. |
| | |
| --- | --- |
Item 16. Form 10-K Summary
939 rewritten, 519 added, 518 removed, 865 unchanged
[removed: SIGNATURES][added: SIGNATURES]
Pursuant to the requirements of Section 13 or 15(d) of the Securities Exchange Act of 1934, the registrant has duly caused this report to be signed on its behalf by the undersigned, thereunto duly authorized, on February [removed: 22, 2019.][added: 25, 2020.]
| | [removed: By:] [added: By:] | /s/ Adena T. Friedman | | |
| | [removed: Name:] [added: Name:] | [removed: Adena] [added: Adena] T. [removed: Friedman] [added: Friedman] | | |
| | [removed: Title:] [added: Title:] | [removed: President] [added: President] and Chief Executive [removed: Officer] [added: Officer] | | |
Pursuant to the requirements of the Securities Exchange Act of 1934, this report has been signed below by the following persons on behalf of the registrant and in the capacities indicated as of February [removed: 22, 2019.][added: 25, 2020.]
| [removed: Name] [added: Name] | | [removed: Title] [added: Title] |
| [removed: Adena] [added: Adena] T. [removed: Friedman] [added: Friedman] | | (Principal Executive Officer) |
| /s/ Michael Ptasznik | | Executive Vice President, [removed: Accounting and] Corporate Strategy and Chief Financial Officer |
| [removed: Michael Ptasznik] [added: Michael Ptasznik] | | (Principal Financial Officer) |
| [removed: Ann] [added: Ann] M. [removed: Dennison] [added: Dennison] | | (Principal Accounting Officer) |
| [removed: Michael] [added: Michael] R. [removed: Splinter] [added: Splinter] | | |
| [removed: Melissa] [added: Melissa] M. [removed: Arnoldi] [added: Arnoldi] | | |
| [removed: Charlene] [added: Charlene] T. [removed: Begley] [added: Begley] | | |
| [removed: Steven] [added: Steven] D. [removed: Black] [added: Black] | | |
| [removed: Essa Kazim] [added: Essa Kazim] | | |
| [removed: Thomas] [added: Thomas] A. [removed: Kloet] [added: Kloet] | | |
| [removed: John] [added: John] D. [removed: Rainey] [added: Rainey] | | |
| [removed: Lars] [added: Lars] R. [removed: Wedenborn] [added: Wedenborn] | | |
| | | [removed: Attorney-in-Fact] [added: Attorney-in-Fact] |
[removed: Nasdaq, Inc.][added: Nasdaq, Inc.]
[removed: INDEX] [added: INDEX] TO CONSOLIDATED FINANCIAL [removed: STATEMENTS][added: STATEMENTS]
[removed: | [Report] [added: Report] of Independent Registered Public Accounting [removed: Firm](#sef10b8b195314e2cb76afeb8770f4988) | F- [2](#sef10b8b195314e2cb76afeb8770f4988) |][added: Firm]
[removed: | [Consolidated] [added: Consolidated] Balance [removed: Sheets](#s8E0FB6C6E2985A8BA640F4C21DC17713) | F- [3](#s8E0FB6C6E2985A8BA640F4C21DC17713) |][added: Sheets]
[removed: | [Consolidated] [added: Consolidated] Statements of [removed: Income](#sEB02A843F45F578BA82A21237BAF4B87) | F- [4](#sEB02A843F45F578BA82A21237BAF4B87) |][added: Income]
[removed: | [Consolidated] [added: Consolidated] Statements of Comprehensive [removed: Income (Loss)](#s1B0D7E71565F5657B686EBEDB40446B0) | F- [5](#s1B0D7E71565F5657B686EBEDB40446B0) |][added: Income]
[removed: | [Consolidated] [added: Consolidated] Statements of Changes in [removed: Equity](#s11f0a8d3dff44c1b8cb6b33c9a1f868d) | F- [6](#s11f0a8d3dff44c1b8cb6b33c9a1f868d) |][added: Stockholders' Equity]
[removed: | [Consolidated] [added: Consolidated] Statements of Cash [removed: Flows](#sB0BD2A6849F95962BAD4BB55F0EA0BBC) | F- [7](#sB0BD2A6849F95962BAD4BB55F0EA0BBC) |][added: Flows]
[removed: | [Notes] [added: Notes] to Consolidated Financial [removed: Statements](#sCC11936CD7C05D66AF33193C59DD2A65) | F- [8](#sCC11936CD7C05D66AF33193C59DD2A65) |][added: Statements]
[removed: Report] [added: | [Report] of Independent Registered Public Accounting [removed: Firm][added: Firm](#s9ea711897b1143beb181832ba778bc22) | F- [2](#s9ea711897b1143beb181832ba778bc22) |]
[removed: Opinion] [added: Opinion] on the Financial [removed: Statements][added: Statements]
We have audited the accompanying consolidated balance sheets of Nasdaq, Inc. (the Company) as of December 31, [removed: 2018] [added: 2019] and [removed: 2017,] [added: 2018,] the related consolidated statements of income, comprehensive [removed: income (loss),] [added: income,] changes in [added: stockholders’] equity and cash flows for each of the three years in the period ended December 31, [removed: 2018] [added: 2019] and the related notes (collectively referred to as the “consolidated financial statements”).
In our opinion, the consolidated financial statements present fairly, in all material respects, the financial position of the Company at December 31, [removed: 2018] [added: 2019] and [removed: 2017,] [added: 2018,] and the results of its operations and its cash flows for each of the three years in the period ended December 31, [removed: 2018,] [added: 2019,] in conformity with U.S. generally accepted accounting principles.
We also have audited, in accordance with the standards of the Public Company Accounting Oversight Board (United States) (PCAOB), the Company's internal control over financial reporting as of December 31, [removed: 2018,] [added: 2019,] based on criteria established in Internal Control-Integrated Framework issued by the Committee of Sponsoring Organizations of the Treadway Commission (2013 framework), and our report dated February [removed: 22, 2019] [added: 25, 2020] expressed an unqualified opinion thereon.
[removed: Basis] [added: Basis] for [removed: Opinion][added: Opinion]
[removed: Consolidated] [added: | [Consolidated] Balance [removed: Sheets][added: Sheets](#s7AD1B8A8AA1F53DC8BB5E19314FBD0D4) | F- [4](#s7AD1B8A8AA1F53DC8BB5E19314FBD0D4) |]
[removed: (in] [added: (in] millions, except share and par value [removed: amounts)][added: amounts)]
| | [removed: December 31, 2018 | | | | December] [added: December] 31, [removed: 2017] [added: 2018] | | |
| [removed: Assets] [added: Assets] | | | | | | | |
| Cash and cash equivalents | $ | [removed: 545] [added: 332] | | | $ | [removed: 377] [added: 545] | |
| Jacob Wallenberg | | |
| * | | Director |
| * | | Director |
| Alfred W. Zollar | | |
| | | |
| By: | | /s/ John A. Zecca |
| | | John A. Zecca |
Adoption of ASU No. 2016-02
As discussed in Note 2 to the consolidated financial statements, the Company changed its method of accounting for Leases in 2019 due to the adoption of ASU No. 2016-02, Leases (Topic 842).
Critical Audit Matter
The critical audit matter communicated below is a matter arising from the current period audit of the financial statements that was communicated or required to be communicated to the audit committee and that: (1) relates to accounts or disclosures that are material to the financial statements and (2) involved our especially challenging, subjective or complex judgments.
The communication of the critical audit matter does not alter in any way our opinion on the consolidated financial statements, taken as a whole, and we are not, by communicating the critical audit matter below, providing a separate opinion on the critical audit matter or on the accounts or disclosures to which it relates.
| | | |
| | | |
| | | Market Technology Revenue Recognition |
| *Description of the Matter* | | As described in Notes 3 and 9 to the consolidated financial statements, the Company enters into long-term market technology contracts with customers to develop customized technology solutions, license the right to use software, and provide support and other services which results in these contracts containing multiple performance obligations. The Company recorded market technology deferred revenue of $66 million as of December 31, 2019 and recognized $338 million in revenue for the year ended December 31, 2019. The Company allocates the contract transaction price to each performance obligation using their best estimate of the standalone selling price of each distinct good or service in the respective market technology contract. In instances where standalone selling price is not directly observable, such as when a product or service is not sold separately, the Company determines the standalone selling price predominantly through an expected cost plus a margin approach. The Company recognizes revenue over time using costs incurred to date relative to total estimated costs at completion to measure progress toward satisfying the performance obligation. Auditing the Company’s calculation of the standalone selling price and timing of revenue recognition was complex and involved a high degree of subjective auditor judgment because of the significant management judgment required to develop the estimates. The standalone selling price is based on an estimate of total project costs, ongoing monitoring of completion of performance obligations and establishing margins for goods or services where a standalone selling price is not directly observable. |
| | | |
| --- | --- | --- |
| | | |
| *How We Addressed the Matter in Our Audit* | | We obtained an understanding, evaluated the design and tested the operating effectiveness of controls over the Company's processes with respect to estimates that impact the timing and measurement of revenue recognition. For example, we tested controls over the allocation of contract transaction price to performance obligations, including management’s review of the estimated margin used when applying the cost plus an estimated margin to determine the standalone selling price. We also evaluated the design and tested the operating effectiveness of controls over the completeness and accuracy of the data utilized to measure the estimate and recognize the revenue in the appropriate period. We performed substantive audit procedures that included, among other things, evaluating the significant assumptions and the accuracy and completeness of the underlying data used in management’s calculation. Specifically, we inspected certain customer contracts, including contract modifications, and tested management’s determination of the standalone selling price and its allocation to performance obligations in accordance with the cost plus a margin approach, including comparing the margin assumptions to actual margins earned on completed contracts. We also tested the accuracy of the revenue recognized in the current period by inspecting reports relating to the hours recorded on a project. We evaluated the adequacy of the Company’s disclosures in notes 3 and 9 to the consolidated financial statements related to market technology revenue recognition. |
| Operating lease assets | 346 | | | | — | | |
| Default funds and margin deposits | 2,996 | | | | 4,742 | | |
| Operating lease liabilities | 331 | | | | — | | |
Nasdaq, Inc.
| Corporate Services | 496 | | | | 487 | | | | 459 | | |
Nasdaq, Inc.
____________
| (1) | Primarily relates to the tax effect of unrealized gains on Euro denominated notes. |
Nasdaq, Inc.
| | | | | | | | | | | | | | | | | | | | | |
| --- | --- | --- | --- | --- | --- | --- | --- | --- | --- | --- | --- | --- | --- | --- | --- | --- | --- | --- | --- | --- |
| | | | | | | | | | | | | | | | | | | | | |
| | Shares | | | $ | | | | Shares | | | $ | | | | Shares | | | $ | | |
| Common stock | 165 | | | 2 | | | | 167 | | | 2 | | | | 167 | | | 2 | | |
| | | | | | | | | | | | | | | | | | | | | |
| Additional paid-in capital | | | | | | | | | | | | | | | | | | | | |
| Beginning balance | | | | 2,716 | | | | | | | 3,024 | | | | | | | 3,104 | | |
| Ending balance | | | | 2,632 | | | | | | | 2,716 | | | | | | | 3,024 | | |
| | | | | | | | | | | | | | | | | | | | | |
| Beginning balance | | | | (297 | | ) | | | | | (247 | | ) | | | | | (176 | | ) |
| By: | | /s/ Edward S. Knight |
| | | Edward S. Knight |
| | |
| --- | --- |
/s/ Ernst & Young LLP
February 22, 2019
| | | | | | | | |
| --- | --- | --- | --- | --- | --- | --- | --- |
| | | | | | | | | | | | |
| --- | --- | --- | --- | --- | --- | --- | --- | --- | --- | --- | --- |
| Asset impairment charge | — | | | | — | | | | (578 | | ) |
____________
| | | | | | | | | | | | | | | | | | | | | | | | | | | |
| --- | --- | --- | --- | --- | --- | --- | --- | --- | --- | --- | --- | --- | --- | --- | --- | --- | --- | --- | --- | --- | --- | --- | --- | --- | --- | --- |
| | Number of Common Shares Outstanding | | | Common Stock at Par Value | | | | Additional Paid-in Capital | | | | Common Stock In Treasury, at Cost | | | | Accumulated Other Comprehensive Loss | | | | Retained Earnings | | | | Total Equity | | |
| Balance at December 31, 2015 | 164,324,270 | | | $ | 2 | | | $ | 3,011 | | | $ | (111 | ) | | $ | (864 | ) | | $ | 3,571 | | | $ | 5,609 | |
| Net income | — | | | — | | | | — | | | | — | | | | — | | | | 106 | | | | 106 | | |
| Balance at December 31, 2016 | 166,579,468 | | | $ | 2 | | | $ | 3,104 | | | $ | (176 | ) | | $ | (979 | ) | | $ | 3,477 | | | $ | 5,428 | |
| Cash dividends declared per common share | — | | | — | | | | — | | | | — | | | | — | | | | (243 | | ) | | (243 | | ) |
| Stock option exercises, net | 1,102,830 | | | — | | | | 24 | | | | — | | | | — | | | | — | | | | 24 | | |
| Other issuances of common stock, net | (774,817 | ) | | — | | | | 29 | | | | (71 | | ) | | — | | | | — | | | | (42 | | ) |
| Balance at December 31, 2017 | 167,441,030 | | | $ | 2 | | | $ | 3,024 | | | $ | (247 | ) | | $ | (862 | ) | | $ | 3,963 | | | $ | 5,880 | |
| Cash dividends declared per common share | — | | | — | | | | — | | | | — | | | | — | | | | (280 | | ) | | (280 | | ) |
| Share repurchase program | (4,508,426 | ) | | — | | | | (394 | | ) | | — | | | | — | | | | — | | | | (394 | | ) |
| Stock option exercises, net | 118,094 | | | — | | | | 3 | | | | — | | | | — | | | | — | | | | 3 | | |
| Other issuances of common stock, net | (406,134 | ) | | — | | | | 14 | | | | (50 | | ) | | — | | | | — | | | | (36 | | ) |
| Balance at December 31, 2018 | 165,165,104 | | | $ | 2 | | | $ | 2,716 | | | $ | (297 | ) | | $ | (1,530 | ) | | $ | 4,558 | | | $ | 5,449 | |
| Asset impairment charge | — | | | | — | | | | 578 | | |
| Proceeds of customer funds | — | | | | — | | | | (38 | | ) |
1.
Nasdaq, Inc. is a leading provider of trading, clearing, marketplace technology, regulatory, securities listing, information and public and private company services.
Our global offerings are diverse and include trading and clearing across multiple asset classes, trade management services, market data products, financial indexes, investment data and analytics, capital formation solutions, corporate solutions, and market technology products and services.
Our technology powers markets across the globe, supporting equity derivative trading, clearing and settlement, cash equity trading, fixed income trading, trading surveillance and many other functions.
In the U.S., we operate six electronic options exchanges and three cash equity exchanges.
The Nasdaq Stock Market, the largest of our cash equities exchanges, is the largest single venue of liquidity for trading U.S.-listed cash equities.
We also operate an electronic platform for trading of U.S. Treasuries and NFX, a U.S. based designated contract market which lists cash-settled energy derivatives based on key energy benchmarks including oil, natural gas and U.S. power.
In addition, we also operate a Canadian exchange for the trading of Canadian-listed securities.
In Europe, we operate exchanges in Stockholm (Sweden), Copenhagen (Denmark), Helsinki (Finland), and Reykjavik (Iceland), as well as the clearing operations of Nasdaq Clearing, as Nasdaq Nordic.
We also operate exchanges in Tallinn (Estonia), Riga (Latvia) and Vilnius (Lithuania) as Nasdaq Baltic.
Collectively, Nasdaq Nordic and Nasdaq Baltic offer trading in cash equities, depository receipts, warrants, convertibles, rights, fund units and ETFs, as well as trading and clearing of derivatives and clearing of resale and repurchase agreements.
An excerpt. Shown here: 40 of 939 rewritten, 40 of 519 added and 40 of 518 removed. The counts are complete. For every sentence, read Item 16. Form 10-K Summary in the FY2019 filing and the FY2018 filing.