 filings.tools
Item 5. Market for Registrant’s Common Equity, Related Stockholder Matters and Issuer Purchases of Equity Securities
5K characters. Original on sec.gov · Markdown
Item 5. Market for Registrant’s Common Equity, Related Stockholder Matters and Issuer Purchases of Equity Securities
The shares of common stock of the Company are listed on the stock market of Nasdaq in New York under the ticker symbol “NXPI”. On February 20, 2020 there were 12 shareholders of record and 393,191 beneficial shareholders of our common stock.
Dividends Per Common Share
The following table presents the quarterly dividends on our common stock for the periods indicated:
| 2019 | 2018 | ||||
| First Quarter | 0.250 | - | |||
| Second Quarter | 0.250 | - | |||
| Third Quarter | 0.375 | 0.250 | |||
| Fourth Quarter | 0.375 | 0.250 |
Equity Compensation Plan Information
Information regarding our equity compensation plans, including both stockholder approved plans and non-stockholder approved plans, will be contained in our Proxy Statement for our 2020 Annual Meeting of Stockholders under the caption “Equity Compensation Plan Information” and is incorporated by reference into this report.
Issuer Purchases of Equity Securities
Effective July 26, 2018, the board of directors of NXP (the “Board”), as authorized by the 2018 annual general meeting of shareholders, authorized the repurchase of $5 billion of the Company’s ordinary shares over a period of 18 months (the “2018 Share Repurchase Program”). In October 2018, the board of directors of NXP increased the repurchase authorization under the 2018 Share Repurchase Program up to a maximum of 20% of issued share capital (approximately 69 million shares). The 2018 Share Repurchase Program was completed in July 2019, and a total of 69 million shares were repurchased under this program. In November 2019, the Board, as authorized by the 2019 annual general meeting of shareholders, authorized the repurchase of $2 billion of shares (the “2019 Share Repurchase Program”). In addition, the Board approved the purchase of shares from participants in the Company's equity programs who trade shares as trade for tax. This authorization will remain in effect until terminated by the Board. During the fiscal year-ended December 31, 2019, NXP repurchased no shares under the 2019 Share Repurchase Program. Under Dutch tax law, the repurchase of a company’s shares by an entity domiciled in the Netherlands results in a taxable event. The tax on the repurchased shares is attributed to the shareholders, with NXP making the payment on the shareholders’ behalf. As such, the tax on the repurchased shares is accounted for within stockholders’ equity. The following table provides a summary of shares repurchased by the Company in 2019:
| Period | Total Number of Shares Purchased | Average Price Paid per Share | Number of Shares Purchased as Part of Publicly Announced Plans or Programs | Maximum Number of Shares That May Yet Be Purchased Under the Plans or Program | Number of Shares Purchased as Trade for Tax (1) | |||||||||
| January 1, 2019 – February 3, 2019 | 5,323,164 | $80.18 | 5,254,300 | 9,776,779 | 68,864 | |||||||||
| February 4, 2019 – March 3, 2019 | 3,158,779 | $91.28 | 3,134,759 | 6,618,000 | 24,020 | |||||||||
| March 4, 2019 – March 31, 2019 | 454 | $93.30 | — | 6,617,546 | 454 | |||||||||
| April 1, 2019 – May 5, 2019 | 3,099,582 | $100.35 | 3,096,600 | 3,517,964 | 2,982 | |||||||||
| May 6, 2019 – June 2, 2019 | 3,516,432 | $94.98 | 3,500,000 | 1,532 | 16,432 | |||||||||
| June 3, 2019 – June 30, 2019 | — | $0.00 | — | 1,532 | — | |||||||||
| July 1, 2019 – August 4, 2019 | 84,865 | $101.81 | — | — | 84,865 | |||||||||
| August 5, 2019 – September 1, 2019 | 3,829 | $100.78 | — | — | 3,829 | |||||||||
| September 2, 2019 – September 29, 2019 | 200 | $106.00 | — | — | 200 | |||||||||
| September 30, 2019 – November 3, 2019 | 678,473 | $108.56 | — | — | 678,473 | |||||||||
| November 4, 2019 – December 1, 2019 | (60 | ) | $108.27 | — | 17,304,032 | (60 | ) | |||||||
| December 2, 2019 – December 31, 2019 | — | $0.00 | — | 15,715,857 | — | |||||||||
| Total | 15,865,718 | 14,985,659 | 880,059 |
| (1) | Reflects shares surrendered by participants to satisfy tax withholding obligations in connection with the Company's equity programs. |
Company Performance
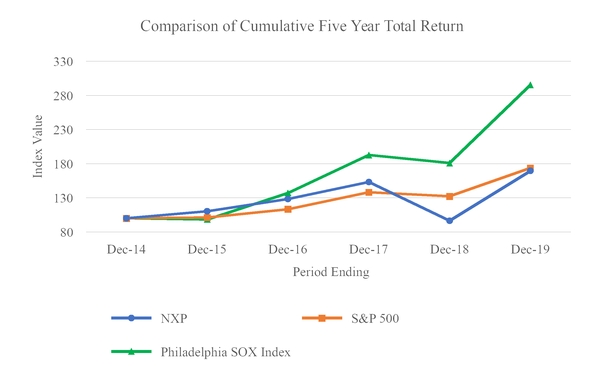
The following graph shows a comparison, since December 31, 2014 of cumulative total return for NXP, the Standard & Poor's 500 Index, and the Philadelphia Stock Exchange Semiconductor Index. The graph assumes $100 (not in millions) invested on December 31, 2014 in our common stock and each of the indices.
Previous: Item 4. Mine Safety Disclosures · Next: Item 6. Selected Financial Data