 filings.tools
Westinghouse Air Brake Technologies 10-K 2018-12-31
Filed 2019-02-27. 17 sections, 449K characters. Original on sec.gov · Markdown · JSON
Cover and table of contents
10-K 1 wab1231201810k.htm 10-K
UNITED STATES
SECURITIES AND EXCHANGE COMMISSION
WASHINGTON, D.C. 20549
FORM 10-K
| ý | Annual Report Pursuant to Section 13 or 15(d) of the Securities Exchange Act of 1934 |
For the fiscal year ended December 31, 2018
OR
| ¨ | Transition Report Pursuant to Section 13 or 15(d) of the Securities Exchange Act of 1934 |
For the transition period from to
Commission file number 033-90866
WESTINGHOUSE AIR BRAKE TECHNOLOGIES CORPORATION
(Exact name of registrant as specified in its charter)
| Delaware | 25-1615902 |
| (State or other jurisdiction of incorporation or organization) | (IRS Employer Identification No.) |
| 1001 Air Brake Avenue Wilmerding, Pennsylvania 15148 | (412) 825-1000 |
| (Address of principal executive offices, including zip code) | (Registrant’s telephone number) |
Securities registered pursuant to Section 12(b) of the Act:
| Title of Class | Name of Exchange on which registered |
| Common Stock, par value $.01 per share | New York Stock Exchange |
Securities registered pursuant to Section 12(g) of the Act: None
Indicate by check mark if the registrant is a well-known seasoned issuer, as defined in Rule 405 of the Securities Act. Yes ý No ¨.
Indicate by check mark if the registrant is not required to file reports pursuant to Section 13 or 15(d) of the Act. Yes ¨ No ý.
Indicate by check mark whether the registrant (1) has filed all reports required to be filed by Section 13 or 15(d) of the Securities Exchange Act of 1934 during the preceding 12 months (or for such shorter period that the registrant was required to file such reports) and (2) has been subject to such filing requirements for the past 90 days. Yes ý No ¨.
Indicate by check mark whether the registrant has submitted electronically and posted on its corporate Web site, if any, every Interactive Data File required to be submitted and posted pursuant to Rule 405 of Regulation S-T during the preceding 12 months (or for such shorter period that the registrant was required to submit and post such files) Yes ý No ¨.
Indicate by check mark if disclosure of delinquent filers pursuant to Item 405 of Regulation S-K is not contained herein, and will not be contained, to the best of registrant’s knowledge, in definitive proxy or information statements incorporated by reference in Part III of this Form 10-K or any amendment to this Form 10-K. ý.
Indicate by check mark whether the registrant is a large accelerated filer, an accelerated filer, a non-accelerated filer, or a smaller reporting company. See the definitions of “large accelerated filer,” “accelerated filer” and “smaller reporting company” in Rule 12b-2 of the Exchange Act. (Check one):
| Large accelerated filer | x | Accelerated filer | ¨ | Non-accelerated filer | ¨ | ||
| Emerging growth company | ¨ | Smaller reporting company | ¨ |
If an emerging growth company, indicate by check mark if the registrant has elected not to use the extended transition period for complying with any new or revised financial accounting standards provided pursuant to Section 13(a) of the Exchange Act. ¨
Indicate by check mark whether the registrant is a shell company (as defined in Rule 12b-2 of the Exchange Act. Yes ¨ No ý.
The registrant estimates that as of June 30, 2018, the aggregate market value of the voting shares held by non-affiliates of the registrant was approximately $8.5 billion based on the closing price on the New York Stock Exchange for such stock.
As of February 20, 2019, 96,613,310 shares of Common Stock of the registrant were issued and outstanding.
DOCUMENTS INCORPORATED BY REFERENCE:
Portions of the Proxy Statement for the registrant’s Annual Meeting of Stockholders to be held on May 17, 2019 are incorporated by reference into Part III of this Form 10-K.
TABLE OF CONTENTS
PART I
Item 1. BUSINESS
General
Westinghouse Air Brake Technologies Corporation, doing business as Wabtec Corporation, is a Delaware corporation with headquarters at 1001 Air Brake Avenue in Wilmerding, Pennsylvania. Our telephone number is 412-825-1000, and our website is located at www.wabtec.com. All references to “we”, “our”, “us”, the “Company” and “Wabtec” refer to Westinghouse Air Brake Technologies Corporation and its consolidated subsidiaries. George Westinghouse founded the original Westinghouse Air Brake Co. in 1869 when he invented the air brake. Westinghouse Air Brake Company (“WABCO”) was formed in 1990 when it acquired certain assets and operations from American Standard, Inc., now known as Trane (“Trane”). The company went public on the New York Stock Exchange in 1995. In 1999, WABCO merged with MotivePower Industries, Inc. and adopted the name Wabtec.
On May 20, 2018, the Company entered into a transaction that resulted in the merger of Wabtec and GE Transportation, a business unit of General Electric Company. The merger of Wabtec and GE Transportation was completed on February 25, 2019. To effect the transaction, the Company entered into an Agreement and Plan of Merger (the “Merger Agreement”) with General Electric Company (“GE”), Transportation Systems Holdings Inc. (“SpinCo”), which was a newly formed wholly owned subsidiary of GE, and Wabtec US Rail Holdings, Inc. (“Merger Sub”), which is a newly formed wholly owned subsidiary of the Company. In addition, on May 20, 2018, GE, SpinCo, the Company and Wabtec US Rail Holdings, Inc. (“Direct Sale Purchaser”), entered into the Separation, Distribution and Sale Agreement (the “Separation Agreement”). Together, the Merger Agreement and the Separation Agreement provided for the combination of the Company and GE’s realigned transportation business (“GE Transportation”). GE Transportation (www.getransportation.com) is a global technology leader and supplier of locomotives, equipment, services and digital solutions to the rail, mining, marine, stationary power and drilling industries. GE Transportation employs approximately 9,000 employees worldwide and had 2018 sales of about $3.9 billion. Wabtec expects the transactions to have the following strategic benefits:
| • | Increased Scale and Diversification of Wabtec’s Product Portfolio. As a result of the Transactions, Wabtec expects the combined business to be one of the world’s largest providers of technology-enabled equipment, systems and services for the locomotive, freight and passenger rail industries with approximately $8.0 billion in revenue and 25,000 employees in 52 countries. |
| • | Complementary Digital Technologies. GE Transportation will contribute a comprehensive digital portfolio and leading engineering and technical intellectual property to Wabtec, providing electronics and digital technologies that position the combined company to meet growing demand for train intelligence and network optimization. |
| • | Enhanced Aftermarket and Services Opportunities. The combined entity will have an installed base of more than 23,000 locomotives and content on virtually all North American locomotives and freight cars, which enables significant opportunities in the high-margin aftermarket parts and services business and mitigates the combined company’s exposure to cycles. |
| • | Significant Operating Synergies. The consummation of the transactions is expected to generate $250 million annual run-rate operating synergies, driven by cost and revenue opportunities, within four years after closing. |
| • | Improved Financial Profile. The consummation of the transactions will enhance Wabtec’s margins and revenue growth opportunities with strong free cash flow generation to enable strategic deleveraging through debt reduction and earnings growth. |
In 2017, Wabtec completed the acquisition of Faiveley Transport, S.A. (“Faiveley Transport”), a leading provider of value-added, integrated systems and services, primarily for the global transit rail market, for a purchase price of approximately $1.5 billion. Based in France, Faiveley Transport has roots to 1919 and became a leader in manufacturing pantographs, automatic door mechanisms and air conditioning systems. Faiveley Transport was listed on the Paris Stock Exchange in 1994 and during the next 20 years acquired a number of rail industry leaders including Sab Wabco, a specialist in railway braking systems and couplers. Wabtec believes that the acquisition of Faiveley Transport provided the following strategic benefits:
| • | Increased diversity of revenues by product, geography and market. A majority of Faiveley Transport’s revenues are outside the U.S. and in the transit market, which helps to balance the cyclicality of our North American freight business. |
| • | Broadened product line. Faiveley Transport provides many products that we did not previously offer, including braking and door systems for high-speed trains and air conditioning systems. |
| • | Expanded international presence in the transit market. A majority of Faiveley Transport’s revenues come from transit markets outside the U.S., where we previously did not have a strong presence. |
| • | Increased technical and engineering expertise. Faiveley Transport strengthens Wabtec's technical capabilities and product development efforts. |
Today, we are one of the world’s largest providers of value-added, technology-based equipment, systems and services for the global passenger transit and freight rail industries. We believe we hold a leading market share for many of our core product lines globally. Our highly engineered products, which are intended to enhance safety, improve productivity and reduce maintenance costs for customers, can be found on most locomotives, freight cars, passenger transit cars and buses around the world. In 2018, the Company had sales of approximately $4.4 billion and net income attributable to our shareholders of about $294.9 million. In 2018, sales of aftermarket parts and services represented about 57% of total sales, while sales to customers outside of the U.S. accounted for about 67% of total sales.
Industry Overview
The Company primarily serves the global passenger transit and freight rail industries. As such, our operating results are largely dependent on the level of activity, financial condition and capital spending plans of passenger transit agencies and freight railroads around the world, and transportation equipment manufacturers who serve those markets. Many factors influence these industries, including general economic conditions; traffic volumes, as measured by freight carloadings and passenger ridership; government spending on public transportation; and investment in new technologies. In general, trends such as increasing urbanization and growth in developing markets, a focus on sustainability and environmental awareness, increasing investment in technology solutions, an aging equipment fleet, and growth in global trade are expected to drive continued investment in passenger transit and freight rail.
According to the 2018 bi-annual edition of a market study by UNIFE, the Association of the European Rail Industry, the accessible global market for railway products and services was more than $100 billion and was expected to grow at a compounded annual growth rate of 2.6% through 2023. The three largest geographic markets, which represented about 80% of the total accessible market, were Europe, North America and Asia Pacific. UNIFE projected above-average growth rates in North America, Latin America and Africa/Middle East, with Asia Pacific and Europe growing at about the industry average. UNIFE said trends such as urbanization and increasing mobility, deregulation, investments in new technologies, energy and environmental issues, and increasing government support continue to drive investment. The largest product segments of the market were rolling stock, services and infrastructure, which represent almost 90% of the accessible market. UNIFE projected spending on turnkey management projects and infrastructure to grow at above-average rates. UNIFE estimated that the global installed base of locomotives was about 114,000 units, with about 33% in Asia Pacific, about 26% in North America and about 18% in Russia-CIS (Commonwealth of Independent States). Wabtec estimates that about 2,500 new locomotives were delivered worldwide in 2018, and we expect deliveries of about 2,900 in 2019. UNIFE estimated the global installed base of freight cars was about 5.1 million, with about 33% in North America, about 26% in Asia Pacific and about 24% in Russia-CIS. Wabtec estimates that about 175,000 new freight cars were delivered worldwide in 2018, and we expect deliveries of about 174,000 in 2019. UNIFE estimated the global installed base of passenger transit vehicles to be about 600,000 units, with about 45% in Asia Pacific, about 33% in Europe and about 12% in Russia-CIS. Wabtec estimates that about 30,000 new passenger transit vehicles were ordered worldwide in 2018, and we expect orders of about the same number in 2019.
In Europe, the majority of the rail system serves the passenger transit market, which is expected to continue growing as energy and environmental factors encourage continued investment in public mass transit. According to UNIFE, France, Germany and the United Kingdom were the largest Western European transit markets, representing almost two-thirds of industry spending in the European Union. UNIFE projected the accessible Western European rail market to grow at about 2.3% annually, led by investments in new rolling stock in France and Germany. About 75% of freight traffic in Europe is hauled by truck, while rail accounts for about 20%. The largest freight markets in Europe are Germany, Poland and the United Kingdom. In recent years, the European Commission has adopted a series of measures designed to increase the efficiency of the European rail network by standardizing operating rules and certification requirements. UNIFE believes that adoption of these measures should have a positive effect on ridership and investment in public transportation over time.
In North America, railroads carry about 40% of intercity freight, as measured by ton-miles, which is more than any other mode of transportation. Through direct ownership and operating partnerships, U.S. railroads are part of an integrated network that includes railroads in Canada and Mexico, forming what is regarded as the world’s most-efficient and lowest-cost freight rail service. There are more than 500 railroads operating in North America, with the largest railroads, referred to as “Class I,” accounting for more than 90% of the industry’s revenues. The railroads carry a wide variety of commodities and goods, including coal, metals, minerals, chemicals, grain, and petroleum. These commodities represent about 50% of total rail carloadings, with intermodal carloads accounting for the rest. Railroads operate in a competitive environment, especially with the trucking industry, and are always seeking ways to improve safety, cost and reliability. New technologies offered by Wabtec and others in the industry can provide some of these benefits. Demand for our freight related products and services in North America is driven by a number of factors, including rail traffic, and production of new locomotives and new freight cars. In the U.S., the passenger transit industry is dependent largely on funding from federal, state and local governments, and from fare
box revenues. Demand for North American passenger transit products is driven by a number of factors, including government funding, deliveries of new subway cars and buses, and ridership. The U.S. federal government provides money to local transit authorities, primarily to fund the purchase of new equipment and infrastructure for their transit systems.
Growth in the Asia Pacific market has been driven mainly by the continued urbanization of China and India, and by investments in freight rail rolling stock and infrastructure in Australia to serve its mining and natural resources markets. India is making significant investments in rolling stock and infrastructure to modernize its rail system; for example, the country has awarded a 1,000-unit locomotive order to GE Transportation
Other key geographic markets include Russia-CIS and Africa-Middle East. With about 1.2 million freight cars and about 20,000 locomotives, Russia-CIS is among the largest freight rail markets in the world, and it’s expected to invest in both freight and transit rolling stock. PRASA, the Passenger Rail Agency of South Africa, is expected to continue to invest in new transit cars and new locomotives. According to UNIFE, emerging markets were expected to grow at above-average rates as global trade led to increased freight volumes and urbanization led to increased demand for efficient mass-transportation systems. As this growth occurs, Wabtec expects to have additional opportunities to provide products and services in these markets.
In its study, UNIFE also said it expected increased investment in digital tools for data and asset management, and in rail control technologies, both of which would improve efficiency in the global rail industry. UNIFE said data-driven asset management tools have the potential to reduce equipment maintenance costs and improve asset utilization, while rail control technologies have been focused on increasing track capacity, improving operational efficiency and ensuring safer railway traffic. Wabtec offers products and services to help customers make ongoing investments in these initiatives.
Business Segments and Products
We provide our products and services through two principal business segments, the Transit Segment and the Freight Segment, both of which have different market characteristics and business drivers. The acquisition of Faiveley Transport significantly strengthened our capabilities and presence in the worldwide transit market.
The Transit Segment primarily manufactures and services components for new and existing passenger transit vehicles, typically regional trains, high speed trains, subway cars, light-rail vehicles and buses; supplies rail control and infrastructure products including electronics, positive train control equipment, and signal design and engineering services; builds new commuter locomotives; and refurbishes passenger transit vehicles. Customers include public transit authorities and municipalities, leasing companies, and manufacturers of passenger transit vehicles and buses around the world. Demand in the transit market is primarily driven by general economic conditions, passenger ridership levels, government spending on public transportation, and investment in new rolling stock. In 2018, the Transit Segment accounted for 64% of our total sales, with about 22% of its sales in the U.S. Approximately two-thirds of the Transit Segment’s sales are in the aftermarket with the remainder in the original equipment market. The addition of Faiveley Transport’s key products strengthened Wabtec's presence in the following areas: high-speed braking and door systems; heating, ventilation and air conditioning systems; pantographs and power collection; information systems; platform screen doors and gates; couplers; and aftermarket services, maintenance and spare parts. Geographically, Faiveley Transport significantly strengthened Wabtec’s presence in the European and Asia Pacific transit markets.
The Freight Segment primarily manufactures and services components for new and existing locomotives and freight cars; supplies rail control and infrastructure products including electronics, positive train control equipment, and signal design and engineering services; overhauls locomotives; and provides heat exchangers and cooling systems for rail and other industrial markets. Customers include large, publicly traded railroads, leasing companies, manufacturers of original equipment such as locomotives and freight cars, and utilities. Demand is primarily driven by general economic conditions and industrial activity; traffic volumes, as measured by freight carloadings; investment in new technologies; and deliveries of new locomotives and freight cars. In 2018, the Freight Segment accounted for 36% of our total sales, with about 54% of its sales in the U.S. In 2018, slightly more than half of the Freight Segment’s sales were in the aftermarket.
Following is a summary of our leading product lines in both aftermarket and original equipment across both of our business segments in 2018:
Specialty Products & Electronics:
| • | Positive Train Control equipment and electronically controlled pneumatic braking products |
| • | Railway electronics, including event recorders, monitoring equipment and end of train devices |
| • | Signal design and engineering services |
| • | Freight car trucks and couplers |
| • | Draft gears, couplers and slack adjusters |
| • | Air compressors and dryers |
| • | Heat exchangers and cooling products for locomotives and power generation equipment |
| • | Track and switch products |
Brake Products:
| • | Railway braking equipment and related components for Freight and Transit applications, including high-speed passenger transit vehicles |
| • | Friction products, including brake shoes, discs and pads |
Remanufacturing, Overhaul and Build:
| • | New commuter and switcher locomotives |
| • | Transit car and locomotive overhaul and refurbishment |
Transit Products:
| • | Heating, ventilation and air conditioning equipment |
| • | Doors for buses and subway cars |
| • | Platform screen doors |
| • | Pantographs |
| • | Window assemblies |
| • | Couplers |
| • | Accessibility lifts and ramps for buses and subway cars |
| • | Traction motors |
We believe we have become a leader in the passenger transit and freight rail industries by capitalizing on the strength of our existing products, technological capabilities and new product innovations, and by our ability to harden products to protect them from severe conditions, including extreme temperatures and high-vibration environments. Supported by our technical staff of more than 2,500 engineers and specialists, we have extensive experience in a broad range of product lines, which enables us to provide comprehensive, systems-based solutions for our customers.
In recent years, we have introduced a number of significant new products, including Positive Train Control (“PTC”) equipment that encompasses onboard digital data and global positioning communication protocols. We are making additional investments in this technology which we believe will provide customers with opportunities to improve safety and efficiency, in part through data analytics solutions. Other new products include HVAC inverter integrated solutions, brake discs and brake controls, platform doors and gates, and door controllers.
For additional information on our business segments, see Note 22 of “Notes to Consolidated Financial Statements” included in Part IV, Item 15 of this report.
Competitive Strengths
Our key strengths include:
| • | Leading market positions in core products. Dating back to 1869 and George Westinghouse’s invention of the air brake, we are an established leader in the development and manufacture of pneumatic braking equipment for freight and passenger transit vehicles. Faiveley Transport, founded 100 years ago, has a long history and is a market leader for its core products, including pantographs, automatic door mechanisms and air conditioning systems. We have leveraged our leading positions by focusing on research and engineering to expand beyond pneumatic braking components to supplying integrated parts and assemblies for the locomotive through the end of the train. We are a recognized leader in the development and production of electronic recording, measuring and communications systems, positive train control equipment, highly engineered compressors and heat exchangers for locomotives, and a leading manufacturer of freight car components, including electronic braking equipment, draft gears, trucks, brake shoes and electronic end-of-train devices. We are also a leading provider of braking equipment; heating, ventilation and air conditioning equipment; door assemblies and platform screen doors; lifts and ramps; couplers and current collection equipment, such as pantographs, for passenger transit vehicles. |
| • | Breadth of product offering with a stable mix of original equipment market (OEM) and aftermarket business. Our product portfolio is one of the broadest in the rail industry, as we offer a wide selection of quality parts, components and assemblies across the entire train and worldwide. We provide our products in both the original equipment market and the aftermarket. Our substantial installed base of products with end-users such as the railroads and the passenger transit authorities is a significant competitive advantage for providing products and services to the aftermarket because these customers often look to purchase safety- and performance-related replacement parts from the original equipment components supplier. In addition, as OEMs and railroad operators attempt to modernize fleets with new products designed to improve and maintain safety and efficiency, these products must be designed to be interoperable with existing equipment. On average, over the last several years, about 58% of our total net sales have come from our aftermarket products and services business. |
| • | Leading design and engineering capabilities. We believe a hallmark of our relationship with our customers has been our leading design and engineering practice, which has assisted in the improvement and modernization of global railway equipment. We believe both our customers and the government authorities value our technological capabilities and commitment to innovation, as we seek not only to enhance the efficiency and profitability of our customers, but also to improve the overall safety of the railways through continuous improvement of product performance. The Company has an established record of product improvements and new product development. We have assembled a wide range of patented products, which we believe provides us with a competitive advantage. Wabtec currently owns 3,333 active patents worldwide. During the last three years, we have filed for approximately 443 patents worldwide in support of our new and evolving product lines. |
| • | Experience with industry regulatory requirements. The freight rail and passenger transit industries are governed by various government agencies and regulators in each country and region. These groups mandate rigorous manufacturer certification, new product testing and approval processes that we believe are difficult for new entrants to meet cost-effectively and efficiently without the scale and extensive experience we possess. Certification processes are lengthy, and often require local presence and expertise. In addition, each transit agency places a high degree of importance on vehicle customization, which requires experience and technical expertise to meet ever-evolving specifications. |
| • | Experienced management team and the Wabtec Excellence Program (WEP) Wabtec’s lean manufacturing and continuous improvement initiatives, known as the Wabtec Excellence Program, have been a part of the Company’s culture for more than 25 years and have enabled Wabtec to manage successfully through cycles in the rail supply market. We believe that, over time, the application of WEP initiatives has resulted in a reduced cost structure and standardized excellence in all processes. We believe that using WEP as our operational foundation will foster state-of-the-art processes and continuous improvement, promote a constant pursuit of quality, and drive practical innovations and best-in-class, modern manufacturing. |
Business strategy
Using WEP, we strive to generate sufficient cash to invest in our growth strategies and to build on what we consider to be a leading position as a low-cost producer in the industry while maintaining world-class product quality, technology and customer responsiveness. Through WEP and employee-directed initiatives such as Kaizen, a Japanese-developed team concept, we continuously strive to improve quality, delivery and productivity, and to reduce costs utilizing global sourcing and supply chain management. These practices enable us to streamline processes, improve product reliability and customer satisfaction, reduce product cycle times and respond more rapidly to market developments. We also rely on functional experts within the Company across various disciplines to train, coach and share best practices throughout the corporation, while benchmarking against best-in-class competitors and peers. Over time, we believe the principles of WEP will enable us to continue to increase operating margins, improve cash flow and strengthen our ability to invest in the following growth strategies:
| • | Product innovation and new technologies. We continue to emphasize innovation and development funding to create new products and capabilities, such as vehicle monitoring and data analytics. WabtecONE is a multi-year initiative to build on our existing expertise and technologies in electronics. In addition, we invest in developing enhancements and new features to existing products, such as brake discs and heat exchangers. We are focusing on technological advances, especially in the areas of electronics, braking products and other on-board equipment, as a means to deliver new product growth. We seek to provide customers with incremental technological advances that offer immediate benefits with cost-effective investments. |
| • | Global and market expansion. We believe that international markets represent a significant opportunity for future growth. In 2018, sales to non-U.S. customers were approximately $2.9 billion. We intend to increase international sales through direct sales of existing products to current and new customers, by developing specific new products for application in new geographic markets, by making strategic acquisitions, and through joint ventures with railway suppliers which have a strong presence in their local markets. In transit, we are focused on mature markets such as Europe and emerging markets such as India. In freight, we are targeting markets that operate significant fleets of U.S.- |
style locomotives and freight cars, including Australia, Brazil, China, India, Russia, South Africa, and other select areas within Europe and South America. In addition, we have opportunities to increase the sale of certain products that we currently manufacture for the rail industry into other industrial markets, such as mining, off-highway and energy. These products include heat exchangers and friction materials.
| • | Aftermarket products and services. Historically, aftermarket sales are less cyclical than OEM sales because a certain level of aftermarket maintenance and service work must be performed, even during an industry slowdown. In 2018, Wabtec’s aftermarket sales and services represented approximately 57% of the Company’s total sales across both of our business segments. As a long time supplier of original equipment, we have an extensive installed base of equipment in the field, which generates recurring aftermarket sales. Wabtec provides aftermarket parts and services for its components, and we seek to expand this business with customers who currently perform the work in-house. In this way, we expect to benefit as transit authorities and railroads outsource certain maintenance and overhaul functions. |
| • | Acquisitions, joint ventures and alliances. We continue to invest in acquisitions, joint ventures and alliances using a disciplined, selective approach and rigorous financial criteria. These transactions are expected to meet our financial criteria and contribute to growth strategies of product innovation and new technologies, global expansion, and aftermarket products and services. We believe these expansion strategies will help Wabtec to grow profitably, expand geographically, and dampen the impact from potential cycles in the North American freight rail industry. |
Recent Acquisitions and Joint Ventures
See Note 3 of the Notes to Consolidated Financial Statements
Backlog
The Company’s backlog was about $4.5 billion at December 31, 2018. For 2018, about 57% of total sales came from aftermarket orders, which typically carry lead times of less than 30 days and are not recorded in backlog for a significant period of time.
The Company’s contracts are subject to standard industry cancellation provisions, including cancellations on short notice or upon completion of designated stages. Generally, if a customer were to cancel a contract we would have an enforceable right to payment for work completed up to the date of cancellation which would include a reasonable profit margin. Substantial scope-of-work adjustments are common. For these and other reasons, completion of the Company’s backlog may be delayed or canceled. The railroad industry, in general, has historically been subject to fluctuations due to overall economic conditions and the level of use of alternative modes of transportation.
The backlog of firm customer orders as of December 31, 2018 and December 31, 2017, and the expected year of completion are as follows:
| Total | Expected Delivery | Total | Expected Delivery | |||||||||||||||||||||
| Backlog | Other | Backlog | Other | |||||||||||||||||||||
| In thousands | 12/31/2018 | 2019 | Years | 12/31/2017 | 2018 | Years | ||||||||||||||||||
| Freight Segment | $ | 664,657 | $ | 503,528 | $ | 161,129 | $ | 549,188 | $ | 423,805 | $ | 125,383 | ||||||||||||
| Transit Segment | 3,816,925 | 1,954,573 | 1,862,352 | 4,050,460 | 1,891,079 | 2,159,381 | ||||||||||||||||||
| Total | $ | 4,481,582 | $ | 2,458,101 | $ | 2,023,481 | $ | 4,599,648 | $ | 2,314,884 | $ | 2,284,764 |
Engineering and Development
To execute our strategy to develop new products, we invest in a variety of engineering and development activities. For the fiscal years ended December 31, 2018, 2017 and 2016, we invested about $87.5 million, $95.2 million and $71.4 million, respectively, on product development and improvement activities. The engineering resources of the Company are allocated between research and development activities and the execution of original equipment customer contracts. Across the corporation we have established multiple Centers of Competence, which have specialized, technical expertise in various disciplines and product areas.
Our engineering and development program includes investments in data analytics, train control and other new technologies, with an emphasis on developing products that enhance safety, productivity and efficiency for our customers. For example, we have developed advanced cooling systems that enable lower emissions from diesel engines used in rail and other industrial markets. Sometimes we conduct specific research projects in conjunction with universities, customers and other industry suppliers.
We use our Product Development System to develop and monitor new product programs. The system requires the product development team to follow consistent steps throughout the development process, from concept to launch, to ensure the product will meet customer expectations and internal profitability targets.
Positive Train Control ("PTC")
PTC is a collision-avoidance system that uses GPS to monitor and control the movement of passenger and freight trains. In 2008, the U.S. mandated the use of PTC on a majority of the locomotives and track in the U.S. The Federal Railroad Administration (the "FRA") eventually approved the use of Wabtec’s Electronic Train Management System® as the on-board locomotive standard for the deployment of this technology. Our system includes an on-board locomotive computer and related software. The deadline to implement this technology was December 31, 2018, and we worked with the U.S. Class I railroads, commuter rail authorities and other industry suppliers to meet this deadline. Under certain conditions, the deadline could be extended through 2019 and 2020. In 2018, Wabtec recorded about $395 million of revenue from freight and transit train control and signaling projects, which includes PTC.
Intellectual Property
We have 3,333 active patents worldwide and on average file for approximately 150 new patents each year. We also rely on a combination of trade secrets and other intellectual property laws, nondisclosure agreements and other protective measures to establish and protect our proprietary rights in our intellectual property. We also follow the product development practices of our competitors to monitor any possible patent infringement by them, and to evaluate their strategies and plans.
Certain trademarks, among them the name WABCO®, were acquired or licensed from American Standard Inc., now known as Trane, in 1990 at the time of our acquisition of the North American operations of the Railway Products Group of Trane. Other trademarks have been developed through the normal course of business or acquired as a part of our ongoing merger and acquisition program.
We have entered into a variety of license agreements as licensor and licensee. We do not believe that any single license agreement is of material importance to our business or either of our business segments as a whole.
We have issued licenses to the two sole suppliers of railway air brakes and related products in Japan, Nabtesco and Mitsubishi Electric Company. The licensees pay annual license fees to us and also assist us by acting as liaisons with key Japanese passenger transit vehicle builders for projects in North America. We believe that our relationships with these licensees are beneficial to our core transit business and customer relationships in North America.
Customers
We provide products and services for more than 500 customers worldwide. Our customers include passenger transit authorities and railroads throughout North America, Europe, Asia Pacific, South Africa and South America; manufacturers of transportation equipment, such as locomotives, freight cars, passenger transit vehicles and buses; and companies that lease and maintain such equipment.
Top customers can change from year to year. For the fiscal year ended December 31, 2018, our top five customers accounted for approximately 15% of net sales: Bombardier, Inc., Alstom, the Greenbrier Companies, Indian Railways and Trinity Industries. No one customer represents 10% or more of consolidated sales. We believe that we have strong relationships with all of our key customers.
Competition
We believe we hold a leading market share for many of our core product lines globally, although market shares vary by product lines and geographies. We operate in a highly competitive marketplace. Price competition is strong because we have a relatively small number of customers and they are very cost-conscious. In addition to price, competition is based on product performance and technological leadership, quality, reliability of delivery, and customer service and support.
Our principal competitors vary across product lines and geographies. Within North America, New York Air Brake Company, a subsidiary of the German air brake producer Knorr-Bremse AG (“Knorr”) and Amsted Rail Company, Inc., a subsidiary of Amsted Industries Corporation, are our principal overall OEM competitors. Our competition for locomotive, freight and passenger transit service and repair is mostly from the railroads’ and passenger transit authorities’ in-house operations, Electro-Motive Diesel, a division of Caterpillar, and New York Air Brake/Knorr. We believe our key strengths, which include leading market positions in core products, breadth of product offering with a stable mix of OEM and aftermarket business, leading design and engineering capabilities, significant barriers to entry and an experienced management team, enable us to compete effectively in this marketplace. Outside of North America, Knorr is our main competitor, although not in every product line or geography. In addition, our competitors often include smaller, local suppliers in most international markets. Depending on the product line and geography, we can also compete with our customers, such as CRRC Corporation Limited, a China-based manufacturer of rolling stock.
Employees
At December 31, 2018, we employed approximately 18,000 full-time employees around the world. This figure includes employees subject to collective bargaining agreements, most of which are outside of North America. We consider our relations with employees and union representatives to be good but cannot assure that future contract negotiations and labor relations will be so.
Regulation
In the course of our operations, we are subject to various regulations and standards of governments and other agencies in the U.S. and around the world. These entities typically govern equipment, safety and interoperability standards for passenger transit and freight rail rolling stock, oversee a wide variety of rules and regulations governing safety and design of equipment, and evaluate certification and qualification requirements for suppliers. New products generally must undergo testing and approval processes that are rigorous and lengthy. As a result of these regulations and requirements, we must usually obtain and maintain certifications in a variety of jurisdictions and countries. The governing bodies include the FRA and the Association of American Railroads ("AAR") in the U.S., and the International Union of Railways (“UIC”) and the European Railway Agencies in Europe. Also, in Europe, the European Committees for Standardization continually draft new European standards which cover, for example, the Reliability, Availability, Maintainability and Safety of railways systems. To guarantee interoperability in Europe, the European Union for Railway Agencies is responsible for defining and implementing Technical Standards of Interoperability, which covers areas such as infrastructure, energy, rolling stock, telematic applications, traffic operation and management subsystems, noise pollution and waste generation, protection against fire and smoke, and system safety.
Most countries and regions in which Wabtec does business have similar rule-making bodies. In Russia, a GOST-R certificate of conformity is mandatory for all products related to the safety of individuals in Russian territory. In China, any product or system sold on the Chinese market must have been certified in accordance with national standards. In the local Indian market, most products are covered by regulations patterned after AAR and UIC standards.
Effects of Seasonality
Our business is not typically seasonal. The third quarter results may be affected by vacation and scheduled plant shutdowns at several of our major customers and fourth quarter results may be affected by the timing of spare parts and service orders placed by transit agencies worldwide. Quarterly results can also be affected by the timing of projects in backlog and by project delays.
Environmental Matters
Additional information on environmental matters is included in Note 21 of “Notes to Consolidated Financial Statements” included in Part IV, Item 15 of this report.
Available Information
We maintain a website at www.wabtec.com. Our annual reports on Form 10-K, quarterly reports on Form 10-Q, current reports on Form 8-K and amendments to such reports filed or furnished pursuant to Section 13(a) or 15(d) of the Securities Exchange Act of 1934, as well as the annual report to stockholders and other information, are available free of charge on this site. The Internet site and the information contained therein or connected thereto are not incorporated by reference into this Form 10-K. The following are also available free of charge on this site and are available in print to any shareholder who requests them: Our Corporate Governance Guidelines, the charters of our Audit, Compensation and Nominating and Corporate Governance Committees, our Code of Conduct, which is applicable to all employees, our Code of Ethics for Senior Officers, which is applicable to our executive officers, our Policies on Related Party Transactions and Conflict Minerals, and our Sustainability Report.
Item 1A. RISK FACTORS
Prolonged unfavorable economic and market conditions could adversely affect our business.
Unfavorable general economic and market conditions in the United States and internationally, particularly in our key end markets, could have a negative impact on our sales and operations. To the extent that these factors result in continued instability of capital markets, shortages of raw materials or component parts, longer sales cycles, deferral or delay of customer orders or an inability to market our products effectively, our business and results of operations could be materially adversely affected.
We are dependent upon key customers.
We rely on several key customers who represent a significant portion of our business. While we believe our relationships with our customers are generally good, our top customers could choose to reduce or terminate their relationships with us. In addition, many of our customers place orders for products on an as-needed basis and operate in cyclical industries. As a result, customer order levels have varied from period to period in the past and may vary significantly in the future. Such customer orders are dependent upon their markets and customers and may be subject to delays and cancellations. Furthermore, the average service life of certain products in our end markets has increased in recent years due to innovations in technologies and manufacturing processes, which has also allowed end users to replace parts less often. As a result of our dependence on our key customers, we could experience a material adverse effect on our business, results of operations and financial condition if we lost any one or more of our key customers or if there is a reduction in their demand for our products.
Our business operates in a highly competitive industry.
We operate in a global, competitive marketplace and face substantial competition from a limited number of established competitors, some of which may have greater financial resources than we do, may have a more extensive low-cost sourcing strategy and presence in low-cost regions than we do or may receive significant governmental support. Price competition is strong and, coupled with the existence of a number of cost conscious customers with significant negotiating power, has historically limited our ability to increase prices. In addition to price, competition is based on product performance and technological leadership, quality, reliability of delivery and customer service and support. If our competitors invest heavily in innovation and develop products that are more efficient or effective than our products, we may not be able to compete effectively. There can be no assurance that competition in one or more of our markets will not adversely affect us and our results of operations.
We intend to pursue acquisitions, joint ventures and alliances that involve a number of inherent risks, any of which may cause us not to realize anticipated benefits.
One aspect of our business strategy is to selectively pursue acquisitions, joint ventures and alliances that we believe will improve our market position and provide opportunities to realize operating synergies. These transactions involve inherent risks and uncertainties, any one of which could have a material adverse effect on our business, results of operations and financial condition including:
| • | difficulties in achieving identified financial and operating synergies, including the integration of operations, services and products; |
| • | diversion of management’s attention from other business concerns; |
| • | the assumption of unknown liabilities; and |
| • | unanticipated changes in the market conditions, business and economic factors affecting such an acquisition, joint venture or alliance. |
We cannot assure that we will be able to consummate any future acquisitions, joint ventures or other business combinations. If we are unable to identify or consummate suitable acquisitions, joint ventures or alliances, we may be unable to fully implement our business strategy, and our business and results of operations may be adversely affected as a result. In addition, our ability to engage in such strategic transactions will be dependent on our ability to raise substantial capital, and we may not be able to raise the funds necessary to implement this strategy on terms satisfactory to us, if at all.
A failure to predict and react to customer demand could adversely affect our business.
If we are unable to accurately forecast demand for our existing products or to react appropriately to changes in demand, we may experience delayed product shipments and customer dissatisfaction. If demand increases significantly from current levels, both we and our suppliers may have difficulty meeting such demand, particularly if such demand increases occur rapidly. Alternatively, we may carry excess inventory if demand for our products decreases below projected levels.
Additionally, we have dedicated significant resources to the development, manufacturing and marketing of new products. Decisions to develop and market new transportation products are typically made without firm indications of customer
acceptance. Moreover, by their nature, new products may require alteration of existing business methods or threaten to displace existing equipment in which our customers may have a substantial capital investment. There can be no assurance that any new products that we develop will gain widespread acceptance in the marketplace or that such products will be able to compete successfully with other new products or services that may be introduced by competitors. Furthermore, we may incur additional warranty or other costs as new products are tested and used by customers.
Failure to accurately predict and react to customer demand could have a material adverse effect on our business, results of operations and financial condition.
We may fail to respond adequately or in a timely manner to innovative changes in new technology.
In recent years, the global transportation landscape has been characterized by rapid changes in technology, leading to innovative transportation and logistics concepts that could change the way the railway industry does business. There may be additional innovations impacting the railway industry that we cannot yet foresee. Any failure by us to quickly adapt to and adopt new innovations in products and processes desired by our customers may result in a significant loss of demand for our product and service offerings. In addition, advances in technology may require us to increase investments in order to remain competitive, and our customers may not be willing to accept higher prices to cover the cost of these investments.
A portion of our sales are related to delivering products and services to help our U.S. railroad and transit customers meet the Positive Train Control ("PTC") mandate from the U.S. federal government, which requires the use of on-board locomotive computers and software by the end of 2018.
For the fiscal year ended December 31, 2018, we had sales of about $395 million related to train control and signaling, which includes PTC. In 2015, the industry's PTC deadline was extended by three years through December 31, 2018, which also included the ability of railroads to request an additional two years for compliance with the approval of the Department of Transportation if certain parameters are met. This could change the timing of our revenues and could cause us to reassess the staffing, resources and assets deployed in delivering PTC services.
Our revenues are subject to cyclical variations in the railway and passenger transit markets and changes in government spending.
The railway industry historically has been subject to significant fluctuations due to overall economic conditions, the use of alternate methods of transportation and the levels of government spending on railway projects. In economic downturns, railroads have deferred, and may defer, certain expenditures in order to conserve cash in the short term. Reductions in freight traffic may reduce demand for our replacement products.
The passenger transit railroad industry is also cyclical and is influenced by a variety of factors. New passenger transit car orders vary from year to year and are influenced by a variety of factors, including major replacement programs, the construction or expansion of transit systems by transit authorities and the quality and cost of alternative modes of transportation. To the extent that future funding for proposed public projects is curtailed or withdrawn altogether as a result of changes in political, economic, fiscal or other conditions beyond our control, such projects may be delayed or cancelled, resulting in a potential loss of business for us, including transit aftermarket and new transit car orders. There can be no assurance that economic conditions will be favorable or that there will not be significant fluctuations adversely affecting the industry as a whole and, as a result, us.
Our backlog is not necessarily indicative of the level of our future revenues.
Our backlog represents future production and estimated potential revenue attributable to firm contracts with, or written orders from, our customers for delivery in various periods. Instability in the global economy, negative conditions in the global credit markets, volatility in the industries that our products serve, changes in legislative policy, adverse changes in the financial condition of our customers, adverse changes in the availability of raw materials and supplies, or un-remedied contract breaches could possibly lead to contract termination or cancellations of orders in our backlog or request for deferred deliveries of our backlog orders, each of which could adversely affect our cash flows and results of operations.
A growing portion of our sales may be derived from our international operations, which exposes us to certain risks inherent in doing business on an international level.
For the fiscal year ended December 31, 2018, approximately 67% of our consolidated net sales were to customers outside of the United States. We intend to continue to expand our international operations, including in emerging markets, in the future. Our global headquarters for the Transit group is located in France, and we conduct other international operations through a variety of wholly and majority-owned subsidiaries and joint ventures, including in Australia, Austria, Brazil, Canada,
China, Czech Republic, France, Germany, India, Italy, Macedonia, Mexico, the Netherlands, Poland, Russia, Spain, South Africa, Turkey, and the United Kingdom. As a result, we are subject to various risks, any one of which could have a material adverse effect on those operations and on our business as a whole, including:
| • | lack of complete operating control; |
| • | lack of local business experience; |
| • | currency exchange fluctuations and devaluations; |
| • | restrictions on currency conversion or the transfer of funds or limitations on our ability to repatriate income or capital; |
| • | the complexities of operating within multiple tax jurisdictions; |
| • | foreign trade restrictions and exchange controls; |
| • | adverse impacts of international trade policies, such as import quotas, capital controls or tariffs; |
| • | difficulty enforcing agreements and intellectual property rights; |
| • | the challenges of complying with complex and changing laws, regulations, and policies of foreign governments; |
| • | the difficulties involved in staffing and managing widespread operations; |
| • | the potential for nationalization of enterprises; |
| • | economic, political and social instability; and |
| • | possible terrorist attacks, conflicts and wars, including those against American interests. |
Our exposure to the risks associated with international operations may intensify if our international operations expand in the future.
We may have liability arising from asbestos litigation.
Claims have been filed against us and certain of our affiliates in various jurisdictions across the United States by persons alleging bodily injury as a result of exposure to asbestos-containing products. Most of these claims have been made against our wholly owned subsidiary, Railroad Friction Products Corporation ("RFPC"), and are based on a product sold by RFPC prior to the time that we acquired any interest in RFPC.
Most of these claims, including all of the RFPC claims, are submitted to insurance carriers for defense and indemnity or to non-affiliated companies that have retained the liabilities for the asbestos-containing products at issue. We cannot, however, assure that all these claims will be fully covered by insurance or that the indemnitors or insurers will remain financially viable. Our ultimate legal and financial liability with respect to these claims, as is the case with most other pending litigation, cannot be estimated.
We are subject to a variety of laws and regulations, including anti-corruption laws, in various jurisdictions.
We are subject to various laws, rules and regulations administered by authorities in jurisdictions in which we do business, such as the anti-corruption laws of the U.S. Foreign Corrupt Practices Act, the French Law n° 2016-1691 (Sapin II) and the U.K. Bribery Act, relating to our business and our employees. We are also subject to other laws and regulations governing our international operations, including regulations administered by the U.S. Department of Commerce’s Bureau of Industry and Security, the U.S. Department of Treasury’s Office of Foreign Assets Control, and various non-U.S. government entities, including applicable export control regulations, economic sanctions on countries and persons, customs requirements, currency exchange regulations, and transfer pricing regulations. Despite our policies, procedures and compliance programs, our internal controls and compliance systems may not be able to protect us from prohibited acts willfully committed by our employees, agents or business partners that would violate such applicable laws and regulations. Any such improper acts could damage our reputation, subject us to civil or criminal judgments, fines or penalties, and could otherwise disrupt our business, and as a result, could materially adversely impact our business, results of operations and financial condition.
In addition, our manufacturing operations are subject to safety, operations, maintenance and mechanical standards, rules and regulations enforced by various federal and state agencies and industry organizations both domestically and internationally. Our business may be adversely impacted by new rules and regulations or changes to existing rules or regulations, which could require additional maintenance or substantial modification or refurbishment of certain of our products or could make such products obsolete or require them to be phased out prior to their useful lives. We are unable to predict what impact these or other regulatory changes may have, if any, on our business or the industry as a whole. We cannot assure that costs incurred to comply with any new standards or regulations will not be material to our business, results of operations and financial condition.
We are subject to a variety of environmental laws and regulations.
We are subject to a variety of increasingly stringent environmental laws and regulations governing discharges to air and water, substances in products, the handling, storage and disposal of hazardous or solid waste materials and the remediation of contamination associated with releases of hazardous substances. We have incurred, and will continue to incur, both operating and capital costs to comply with environmental laws and regulations, including costs associated with the clean-up and
investigation of some of our current and former properties and offsite disposal locations. We believe our operations currently comply in all material respects with all of the various environmental laws and regulations applicable to our business; however, there can be no assurance that environmental requirements will not change in the future or that we will not incur significant costs to comply with such requirements. Failure to comply with environmental laws and regulations could have significant consequences on our business and results of operations, including the imposition of substantial fines and sanctions for violations, injunctive relief (including requirements that we limit or cease operations at affected facilities), and reputational risk.
In addition, certain of our products are subject to extensive, and increasingly stringent, statutory and regulatory requirements governing, e.g., emissions and noise, including standards imposed by the U.S. Environmental Protection Agency, the European Union and other regulatory agencies around the world. We have made, and will continue to make, significant capital and research expenditures relating to compliance with these standards. The successful development and introduction of new and enhanced products in order to comply with new regulatory requirements are subject to other risks, such as delays in product development, cost over-runs and unanticipated technical and manufacturing difficulties. In addition to these risks, the nature and timing of government implementation and enforcement of these standards-particularly in emerging markets-are unpredictable and subject to change.
Future climate change regulation could result in increased operating costs, affect the demand for our products or affect the ability of our critical suppliers to meet our needs.
We have followed the current debate over climate change and the related policy discussion and prospective legislation. We have reviewed the potential challenges for us that climate change policy and legislation may pose. Any such challenges are heavily dependent on the nature and degree of climate change legislation and the extent to which it applies to our industry. At this time, we cannot predict the ultimate impact of climate change and climate change legislation on our operations. Further, when or if these impacts may occur cannot be assessed until scientific analysis and legislative policy are more developed and specific legislative proposals begin to take shape. Any laws or regulations that may be adopted to restrict or reduce emissions of greenhouse gas could require us to incur increased operating costs and could have an adverse effect on demand for our products. In addition, the price and availability of certain of the raw materials that we use could vary in the future as a result of environmental laws and regulations affecting our suppliers. An increase in the price of our raw materials or a decline in their availability could adversely affect our operating margins or result in reduced demand for our products.
The occurrence of litigation in which we could be named as a defendant is unpredictable.
From time to time, we are subject to litigation or other commercial disputes and other legal and regulatory proceedings with respect to our business, customers, suppliers, creditors, stockholders, product liability, intellectual property infringement, warranty claims or environmental-related matters. Due to the inherent uncertainties of any litigation, commercial disputes or other legal or regulatory proceedings, we cannot accurately predict their ultimate outcome, including the outcome of any related appeals. We may incur significant expense to defend or otherwise address current or future claims. Any litigation, even a claim without merit, could result in substantial costs and diversion of resources and could have a material adverse effect on our business and results of operations. Although we maintain insurance policies for certain risks, we cannot make assurances that this insurance will be adequate to protect us from all material judgments and expenses related to potential future claims or that these levels of insurance will be available in the future at economical prices or at all.
If we are not able to protect our intellectual property and other proprietary rights, we may be adversely affected.
Our success can be impacted by our ability to protect our intellectual property and other proprietary rights. We rely primarily on patents, trademarks, copyrights, trade secrets and unfair competition laws, as well as license agreements and other contractual provisions, to protect our intellectual property and other proprietary rights. However, filing, prosecuting and defending patents on our products in all countries and jurisdictions throughout the world would be prohibitively expensive. Moreover, existing U.S. legal standards relating to the validity, enforceability and scope of protection of intellectual property rights offer only limited protection, may not provide us with any competitive advantages and may be challenged by third parties. The laws of countries other than the United States may be even less protective of intellectual property rights. As a result, a significant portion of our technology is not patented, and we may be unable or may not seek to obtain patent protection for this technology. Further, although we routinely conduct anti-counterfeiting activities in multiple jurisdictions, we have encountered counterfeit reproductions of our products or products that otherwise infringe on our intellectual property rights. Counterfeit components of low quality may negatively impact our brand value. Accordingly, despite our efforts, we may be unable to prevent third parties from infringing upon, counterfeiting or misappropriating our intellectual property or otherwise gaining access to our technology. If we fail to protect our intellectual property and other proprietary rights, then our business, results of operations and financial condition could be negatively impacted.
In addition, we operate in industries in which there are many third-party owners of intellectual property rights. Owners of intellectual property that we need to conduct our business as it evolves may be unwilling to license such intellectual property rights to us on terms we consider reasonable. Third party intellectual property owners may assert infringement claims against us based on their intellectual property portfolios. If we are sued for intellectual property infringement, we may incur significant expenses investigating and defending such claims, even if we prevail.
We face risks relating to cybersecurity attacks that could cause loss of confidential information and other business disruptions.
Threats to information technology systems associated with cybersecurity risks and cyber incidents or attacks continue to grow and our business is at risk from and may be impacted by cybersecurity attacks. We rely extensively on computer systems to process transactions and manage our business. In addition, we collect, process, and retain sensitive and confidential customer information in the normal course of business. Cybersecurity attacks could include attempts to gain unauthorized access to our data and computer systems. Attacks can be both individual and/or highly organized attempts by very sophisticated hacking organizations. We employ a number of measures to prevent, detect and mitigate these threats, which include employee education, password encryption, frequent password change events, firewall detection systems, anti-virus software in-place and frequent backups; however, there is no guarantee such efforts will be successful in preventing a cyber-attack. A cybersecurity attack could compromise the confidential information of our employees, customers and suppliers, and potentially violate certain domestic and international privacy laws. Furthermore, a cybersecurity attack on our customers and suppliers could compromise our confidential information in the possession of our customers and suppliers. A successful attack could disrupt and otherwise adversely affect our business operations, including through lawsuits by third-parties. In addition, the regulatory environment related to information security and privacy is constantly changing, and compliance with those requirements could result in additional costs.
Our manufacturer’s warranties or product liability may expose us to potentially significant claims.
We warrant the workmanship and materials of many of our products. Accordingly, we are subject to a risk of product liability or warranty claims in the event that the failure of any of our products results in personal injury or death or does not conform to our customers’ specifications. In addition, in recent years, we have introduced a number of new products for which we do not have a history of warranty experience. Although we currently maintain liability insurance coverage, we cannot assure that product liability claims, if made, would not exceed our insurance coverage limits or that insurance will continue to be available on commercially acceptable terms, if at all. The possibility exists for these types of warranty claims to result in costly product recalls, significant repair costs and damage to our reputation.
Labor shortages and labor disputes may have a material adverse effect on our operations and profitability.
We depend on skilled labor in our manufacturing and other businesses. Due to the competitive nature of the labor markets in which we operate, we may not be able to retain, recruit and train the personnel we require, particularly when the economy expands, production rates are high or competition for such skilled labor increases.
We collectively bargain with labor unions at some of our operations throughout the world. Failure to reach an agreement could result in strikes or other labor protests which could disrupt our operations. Furthermore, non-union employees in certain countries have the right to strike. If we were to experience a strike or work stoppage, it would be difficult for us to find a sufficient number of employees with the necessary skills to replace these employees. We cannot assure that we will reach any such agreement or that we will not encounter strikes or other types of conflicts with the labor unions of our personnel.
Any such labor shortages or labor disputes could have an adverse effect on our business, results of operations and financial condition, could cause us to lose revenues and customers and might have permanent effects on our business.
Equipment failures, interruptions, delays in deliveries or extensive damage to our facilities, supply chains, distribution systems or information technology systems, could adversely affect our business.
All of our facilities, equipment, supply chains, distribution systems and information technology systems are subject to the risk of catastrophic loss due to unanticipated events, such as fires, earthquakes, explosions, floods, tornados, hurricanes or weather conditions. An interruption in our manufacturing capabilities, supply chains, distribution systems or information technology systems, whether as a result of such catastrophic loss or any other reason, could reduce, prevent or delay our production and shipment of our product offerings, result in defective products or services, damage customer relationships and our reputation and result in legal exposure and large repair or replacement expenses. This could result in the delay or termination of orders, the loss of future sales and a negative impact to our reputation with our customers.
Third-party insurance coverage that we maintain with respect to such matters will vary from time to time in both type and amount depending on cost, availability and our decisions regarding risk retention, and may be unavailable or insufficient to
protect us against losses. Any of these risks coming to fruition could materially adversely affect our business, results of operations and financial condition.
We may be exposed to raw material shortages, supply shortages and fluctuations in raw material, energy and commodity prices.
We purchase energy, steel, aluminum, copper, rubber and rubber-based materials, chemicals, polymers and other key manufacturing inputs from outside sources, and traditionally have not had long-term pricing contracts with our pure raw material suppliers. The costs of these raw materials have been volatile historically and are influenced by factors that are outside our control. If we are unable to pass increases in the costs of our raw materials on to our customers, experience a lag in our ability to pass increases to our customers, or operational efficiencies are not achieved, our operating margins and results of operations may be materially adversely affected.
Our businesses compete globally for key production inputs. In addition, we rely upon third-party suppliers, including certain single-sourced suppliers, for various components for our products. In the event of a shortage or discontinuation of certain raw materials or key inputs, we may experience challenges sourcing certain of our components to meet our production requirements and may not be able to arrange for alternative sources of certain raw materials or key inputs. Any such shortage may materially adversely affect our competitive position versus companies that are able to better or more cheaply source such raw materials or key inputs.
We may incur increased costs due to fluctuations in interest rates and foreign currency exchange rates
In the ordinary course of business, we are exposed to increases in interest rates that may adversely affect funding costs associated with variable-rate debt and changes in foreign currency exchange rates. We are subject to currency exchange rate risk to the extent that our costs may be denominated in currencies other than those in which we earn and report revenues and vice versa. In addition, a decrease in the value of any of these currencies relative to the U.S. dollar could reduce our profits from non-U.S. operations and the translated value of the net assets of our non-U.S. operations when reported in U.S. dollars in our consolidated financial statements. We may seek to minimize these risks through the use of interest rate swap contracts and currency hedging agreements. There can be no assurance that any of these measures will be effective. Material changes in interest or exchange rates could result in material losses to us.
If we lose our senior management or key personnel, our business may be materially and adversely affected.
The success of our business is largely dependent on our senior management team, as well as on our ability to attract and retain other qualified key personnel. It cannot be assured that we will be able to retain all of our current senior management personnel and attract and retain other key personnel necessary for the development of our business. The loss of the services of senior management and other key personnel or the failure to attract additional personnel as required could have a material adverse effect on our business, results of operations and financial condition.
Following the consummation of the acquisition of GE Transportation, we will have substantial operations located in India, and will be subject to regulatory, economic, social and political uncertainties in India.
Although we currently have operations in India, following the consummation of our acquisition of GE Transportation, these operations will be substantially more significant, including a large-scale project involving the construction of a factory in the state of Bihar, which includes a township to house employees. The project also includes construction of two service sheds, in the states of Uttar Pradesh and Gujarat. Operations in India are inherently risky due to a number of regulatory, economic, social and political uncertainties. For example, in September 2017, several media outlets reported that the Indian government expressed a desire to switch the country's rail system from diesel to electric locomotives, which would threaten to interfere with the completion of the project and curtail the viability of our ongoing operations in India. While no such actions have been taken to date, any change in policy with respect to India’s rail system could have a material adverse effect on the business of the combined company.
In addition, the Indian government has exercised and continues to exercise significant influence over many aspects of the Indian economy. Since 1991, successive Indian governments have generally pursued policies of economic liberalization and financial sector reforms, including by significantly relaxing restrictions on the private sector. Nevertheless, the role of the Indian central and state governments in the Indian economy as producers, consumers and regulators has remained significant and we cannot assure you that such liberalization policies will continue. The rate of economic liberalization could change, and specific laws and policies affecting foreign investments in India could change as well, including exposure to possible expropriation, nationalization or other governmental actions.
Further, protests against privatizations and government corruption scandals, which have occurred in the past, could slow the pace of liberalization and deregulation. A significant change in India’s policy of economic liberalization and deregulation or
any social or political uncertainties could significantly harm business and economic conditions in India generally and our business and prospects.
India’s physical infrastructure is less developed than that of many developed nations. Any congestion or disruption with respect to communication systems or any public facility, including transportation infrastructure, could disrupt our normal business activity. Any deterioration of India’s physical infrastructure would harm the national economy, disrupt the transportation of people, goods and supplies, and add costs to doing business in India. These disruptions could interrupt our business operations and significantly harm our results of operations, financial condition and cash flows.
Our indebtedness could adversely affect our financial health.
At December 31, 2018, we had total debt of $3,856.9 million. We entered into a Credit Agreement, as amended, dated June 8, 2018, by and among us, Wabtec Netherlands B.V, the other borrowing subsidiaries party thereto from time to time, PNC Bank, National Association, as administrative agent, and the other parties thereto, which includes (i) a $1.2 billion Revolving Credit Facility, (ii) a $350.0 million Refinancing Term Loan and (iii) a $400.0 million Delayed Draw Term Loan. Being indebted could have important consequences to us. For example, our indebtedness could:
| • | increase our vulnerability to general adverse economic and industry conditions; |
| • | require us to dedicate a substantial portion of our cash flow from operations to payments on our indebtedness, thereby reducing the availability of our cash flow to fund working capital, capital expenditures, acquisitions and other general corporate purposes; |
| • | limit our flexibility in planning for, or reacting to, changes in our business and the industries in which we operate; |
| • | place us at a disadvantage compared to competitors that have less debt; and |
| • | limit our ability to borrow additional funds. |
The indenture for our $500.0 million floating rate senior notes due in 2021, our $744.4 million 4.375% senior notes due in 2023, our $499.1 million 4.150% senior notes due in 2024, our $750.0 million 3.450% senior notes due in 2026, our $1.25 billion 4.700% senior notes due in 2028 and our Credit Agreement contain various covenants that limit our management’s discretion in the operation of our businesses.
Our Credit Agreement contains customary representations and warranties by us and our subsidiaries, including customary use of materiality, material adverse effect, and knowledge qualifiers. We and our subsidiaries are also subject to (i) customary affirmative covenants that impose certain reporting obligations on us and our subsidiaries and (ii) customary negative covenants, including limitations on: indebtedness; liens; restricted payments; fundamental changes; business activities; transactions with affiliates; restrictive agreements; changes in fiscal year; and use of proceeds. In addition, we are required to maintain (i) a ratio of EBITDA to interest expense of at least 3.00 to 1.00 over each period of four consecutive fiscal quarters ending on the last day of a fiscal quarter and (ii) a Leverage Ratio, calculated as of the last day of a fiscal quarter for a period of four consecutive fiscal quarters, of 3.25 to 1.00 or less; provided that, any material acquisition in which the cash consideration paid exceeds $500.0 million, the maximum Leverage Ratio permitted will be (x) 3.75 to 1.00 at the end of the fiscal quarter in which such acquisition is consummated and each of the three fiscal quarters immediately following such fiscal quarter and (y) 3.50 to 1.00 at the end of each of the fourth and fifth full fiscal quarters after the consummation of such acquisition.
The indenture under which our senior notes were issued contain covenants and restrictions which limit among other things, the following: sale and leaseback transactions, sale of assets, change in control, mergers and consolidations and the incurrence of liens.
The integration of our recently completed acquisitions may not result in anticipated improvements in market position or the realization of anticipated operating synergies or may take longer to realize than expected.
Although we believe that our recent acquisitions will improve our market position and realize positive operating results, including operating synergies, operating expense reductions and overhead cost savings, we cannot be assured that these improvements will be obtained or the timing of such improvements. The management and acquisition of businesses involves substantial risks, any of which may result in a material adverse effect on our business and results of operations, including:
| • | the uncertainty that an acquired business will achieve anticipated operating results; |
| • | significant expenses to integrate; |
| • | diversion of management’s attention; |
| • | departure of key personnel from the acquired business; |
| • | effectively managing entrepreneurial spirit and decision-making; |
| • | integration of different information systems; |
| • | unanticipated costs and exposure to unforeseen liabilities; and |
| • | impairment of assets. |
Item 1B. UNRESOLVED STAFF COMMENTS
None.
Item 2. PROPERTIES
Facilities
The following table provides certain summary information about the principal facilities owned or leased by the Company as of December 31, 2018. The Company believes that its facilities and equipment are generally in good condition and that, together with scheduled capital improvements, they are adequate for its present and immediately projected needs. Leases on the facilities are long-term and generally include options to renew. The Company’s corporate headquarters are located at the Wilmerding, PA site.
| Location | Primary Use | Segment | Own/Lease | Approximate Square Feet | ||||||||
| Domestic | ||||||||||||
| Rothbury, MI | Manufacturing/Warehouse/Office | Freight | Own | 500,000 | ||||||||
| Wilmerding, PA | Manufacturing/Service | Freight | Own | 365,000 | (1 | ) | ||||||
| Lexington, TN | Manufacturing | Freight | Own | 170,000 | ||||||||
| Jackson, TN | Manufacturing | Freight | Own | 150,000 | ||||||||
| Berwick, PA | Manufacturing/Warehouse | Freight | Own | 150,000 | ||||||||
| Chicago, IL | Manufacturing/Service | Freight | Own | 123,000 | ||||||||
| Greensburg, PA | Manufacturing | Freight | Own | 113,000 | ||||||||
| Warren, OH | Manufacturing | Freight | Own | 103,000 | ||||||||
| Boise, ID | Manufacturing | Freight/Transit | Own | 326,000 | ||||||||
| Maxton, NC | Manufacturing | Freight/Transit | Own | 105,000 | ||||||||
| Salem, VA | Manufacturing | Transit | Own | 320,000 | ||||||||
| Greenville, SC | Manufacturing | Transit | Own | 154,000 | ||||||||
| Brenham, TX | Manufacturing/Office | Transit | Own | 145,000 | ||||||||
| Spartanburg, SC | Manufacturing/Service | Transit | Lease | 184,000 | ||||||||
| Buffalo Grove, IL | Manufacturing | Transit | Lease | 116,000 | ||||||||
| International | ||||||||||||
| Sao Paulo, Brazil | Manufacturing/Office | Freight | Own | 177,000 | ||||||||
| Wallaceburg (Ontario), Canada | Manufacturing | Freight | Own | 126,000 | ||||||||
| Northampton, UK | Manufacturing | Freight | Lease | 300,000 | ||||||||
| Shenyang City, Liaoning Province, China | Manufacturing | Freight | Lease | 291,000 | ||||||||
| Lincolnshire, UK | Manufacturing/Office | Freight | Lease | 149,000 | ||||||||
| London (Ontario), Canada | Manufacturing | Freight | Lease | 104,000 | ||||||||
| Doncaster, UK | Manufacturing/Service | Freight/Transit | Own | 330,000 | ||||||||
| Kilmarnock, UK | Manufacturing | Freight/Transit | Own | 108,000 | ||||||||
| Loughborough, UK | Manufacturing | Freight/Transit | Lease | 245,000 | ||||||||
| Kempton Park, South Africa | Manufacturing | Freight/Transit | Lease | 156,000 | ||||||||
| Piossasco, Italy | Manufacturing | Transit | Own | 301,000 | ||||||||
| Monte Alto, Brazil | Manufacturing/Office | Transit | Own | 244,000 | ||||||||
| Tamil Nadu, India | Manufacturing | Transit | Own | 220,000 | ||||||||
| Schkeuditz, Germany | Manufacturing | Transit | Own | 219,000 | ||||||||
| Schuttorf, Germany | Manufacturing/Office | Transit | Own | 189,000 | ||||||||
| Amiens, France | Manufacturing | Transit | Own | 142,000 | ||||||||
| Chard, UK | Manufacturing/Office | Transit | Own | 142,000 | ||||||||
| St Pierre Des Corps, France | Manufacturing | Transit | Own | 133,000 | ||||||||
| Avellino, Italy | Manufacturing/Office | Transit | Own | 132,000 |
| Location | Primary Use | Segment | Own/Lease | Approximate Square Feet | ||||||||
| Burton on Trent, UK | Manufacturing/Office | Transit | Lease | 253,000 | ||||||||
| Blovice, Czech Republic | Manufacturing | Transit | Lease | 235,000 | ||||||||
| Nyrany, Czech Republic | Manufacturing/Office | Transit | Lease | 223,000 | ||||||||
| Witten, Germany | Manufacturing | Transit | Lease | 209,000 | ||||||||
| Verviers, Belgium | Manufacturing/Office | Transit | Lease | 137,000 | ||||||||
| Camisano, Italy | Manufacturing/Office | Transit | Lease | 136,000 | ||||||||
| San Luis Potosi, Mexico | Manufacturing/Office | Transit | Lease | 113,000 | ||||||||
| Birkenhead, UK | Overhaul/Manufacturing | Transit | Lease | 109,000 | ||||||||
| Shanghai, China | Manufacturing | Transit | Lease | 104,000 |
| (1) | Approximately 250,000 square feet are currently used in connection with the Company’s corporate and manufacturing operations. The remainder is leased to a third party. |
Item 3. LEGAL PROCEEDINGS
Additional information with respect to legal proceedings is included in Note 21 of “Notes to Consolidated Financial Statements” included in Part IV, Item 15 of this report and incorporate by reference herein.
Item 4. MINE SAFETY DISCLOSURES
Not applicable.
EXECUTIVE OFFICERS OF THE REGISTRANT
The following table provides information on our executive officers as of February 25, 2019. They are elected periodically by our Board of Directors and serve at its discretion.
| Officers | Age | Position | ||
| Albert J. Neupaver | 68 | Executive Chairman of the Board | ||
| Raymond T. Betler | 63 | President and Chief Executive Officer | ||
| Rafael Santana | 47 | Executive Vice President, President and Chief Executive Officer, Freight Segment | ||
| David L. DeNinno | 63 | Executive Vice President, General Counsel and Secretary | ||
| Patrick D. Dugan | 52 | Executive Vice President Finance, and Chief Financial Officer | ||
| Scott E. Wahlstrom | 55 | Executive Vice President, Human Resources | ||
| Dominique Malefant | 57 | Senior Vice President and Global Technology Officer | ||
| John A. Mastalerz | 52 | Senior Vice President of Finance, Corporate Controller and Principal Accounting Officer | ||
| Greg Sbrocco | 50 | Senior Vice President, Wabtec Excellence Program | ||
| Timothy R. Wesley | 57 | Vice President, Investor Relations and Corporate Communications |
Albert J. Neupaver was re-named Executive Chairman of the Board of Directors in May 2018, having previously served as Executive Chairman from May 2014 to May 2017. Prior to that, Mr. Neupaver served as Executive Chairman of the Company since May 2014. Previously, he served as Chairman from May 2017 to May 2018, and Chairman and CEO from May 2013 to May 2014 and as the Company’s President and CEO from February 2006 to May 2013. Prior to joining Wabtec, Mr. Neupaver served in various positions at AMETEK, Inc., a leading global manufacturer of electronic instruments and electric motors. Most recently he served as President of its Electromechanical Group for nine years.
Raymond T. Betler was named President and Chief Executive Officer in May 2014. Previously, Mr. Betler was President and Chief Operating Officer since May 2013 and the Company’s Chief Operating Officer since December 2010. Prior to that, he served as Vice President, Group Executive of the Company since August 2008. Prior to joining Wabtec, Mr. Betler served in various positions of increasing responsibility at Bombardier Transportation since 1979. Most recently, Mr. Betler served as President, Total Transit Systems from 2004 until 2008 and before that as President, London Underground Projects from 2002 to 2004.
Rafael Santana was named Executive Vice President, President and Chief Executive Officer of Wabtec's Freight Segment effective February 25, 2019. Previously Mr. Santana was President and Chief Executive Officer of GE Transportation since November 2017. Mr. Santana has held several global leadership positions since joining GE in 2000, including roles in the Transportation, Power and Oil and Gas businesses. Prior to being named President and Chief Executive Officer of GE Transportation, Mr. Santana was President and Chief Executive Officer of GE in Latin America. He also served as President and Chief Executive Officer of GE Oil and Gas Turbomachinery Solutions and had roles as Chief Executive Officer for GE Gas Engines and Chief Executive Officer for GE Energy in Latin America.
David L. DeNinno was named Executive Vice President, General Counsel and Secretary of the Company effective December 2016. Previously, Mr. DeNinno served as Sr. Vice President, General Counsel and Secretary since February 2012. Previously, Mr. DeNinno served as a partner at K&L Gates LLP since May 2011 and prior to that with Reed Smith LLP.
Patrick D. Dugan was named Executive Vice President and Chief Financial Officer effective December 2016. Previously Mr. Dugan served as Senior Vice President and Chief Financial Officer since January 2014. Previously, Mr. Dugan was Senior Vice President, Finance and Corporate Controller from January 2012 until November 2013. He originally joined Wabtec in 2003 as Vice President, Corporate Controller. Prior to joining Wabtec, Mr. Dugan served as Vice President and Chief Financial Officer of CWI International, Inc. from December 1996 to November 2003. Prior to 1996, Mr. Dugan was a Manager with PricewaterhouseCoopers.
Scott E. Wahlstrom was named Executive Vice President, Human Resources effective December 2016. Previously, Mr. Wahlstrom served as Senior Vice President, Human Resources since January 2012. Prior to that, Mr. Wahlstrom has been Vice President, Human Resources, since November 1999. Previously, Mr. Wahlstrom was Vice President, Human Resources & Administration of MotivePower Industries, Inc. from August 1996 until November 1999.
Dominique Malefant was named Senior Vice President, Global Technology effective February 25, 2019. Previously, Mr. Malefant was the Vice President of Global Technology of GE Transportation. Prior to that, Mr. Malefant served as Vice President of product and engineering for the Transport and Propulsion and Control business at Bombardier Transport.
John A. Mastalerz was named Senior Vice President of Finance, Corporate Controller and Principal Accounting Officer in July 2017. Previously, Mr. Mastalerz served as Vice President and Corporate Controller from January 2014 to July 2017. Prior to joining Wabtec, Mr. Mastalerz served in various executive management roles with the H.J. Heinz Company from January 2001 to December 2013, most recently as Corporate Controller and Principal Accounting Officer. Prior to 2001, Mr. Mastalerz was a Senior Manager with PricewaterhouseCoopers.
Greg Sbrocco was named Senior Vice President, Wabtec Excellence Program, effective February 25, 2019. Prior to this, Mr. Sbrocco was Global Supply Chain Leader for GE Transportation. Mr. Sbrocco has been with GE for 27 years as he joined in 1992 as an Environmental Engineer for the GE Energy business. During his tenure with GE, Mr. Sbrocco has held several leadership roles in GE Energy, GE Oil and Gas, and GE Transportation.
Timothy R. Wesley was named Vice President, Investor Relations and Corporate Communications in November 1999. Previously, Mr. Wesley was Vice President, Investor and Public Relations of MotivePower Industries, Inc. from August 1996 until November 1999.
PART II
Item 5. MARKET FOR REGISTRANT’S COMMON EQUITY, RELATED STOCKHOLDER MATTERS AND ISSUER PURCHASES OF EQUITY SECURITIES
The Common Stock of the Company is listed on the New York Stock Exchange under the symbol “WAB”. As of February 20, 2019, there were 96,613,310 shares of Common Stock outstanding held by 452 holders of record.
The following performance graph and related information shall not be deemed “soliciting material” or to be “filed” with the Securities and Exchange Commission, nor shall such information be incorporated by reference to any future filings under the Securities Act of 1933 and the Securities Exchange Act of 1934, each as amended, except to the extent that Wabtec specifically incorporates it by reference into such filing. The graph below compares the total stockholder return through December 31, 2018, of Wabtec’s common stock to (i) the S&P 500 and (ii) our peer group of manufacturing companies which consists of the following publicly traded companies: AGCO, AMETEK, Colfax, Dana, Dover, Flowserve, The Greenbrier Companies, Navistar, Oshkosh, Regal Beloit, Rockwell Automation, Rockwell Collins, Terex, Trinity Industries, Snap-On, WABCO and Xylem.
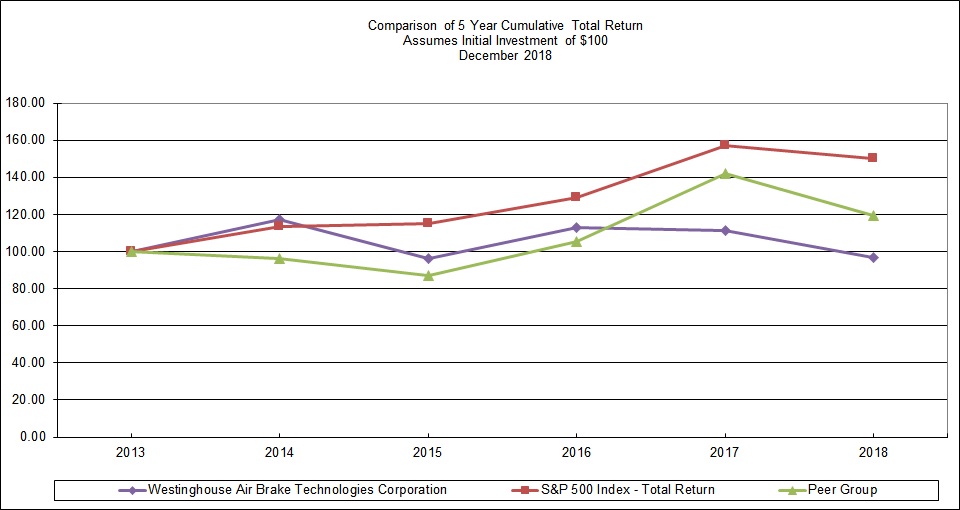
| Month | Total Number of Shares Purchased | Average Price Paid per Share | Total Number of Shares Purchased as Part of Publicly Announced Programs (1) | Maximum Dollar Value of Shares That May Yet Be Purchased Under the Programs (1) | ||||||||||
| October 2018 | — | — | — | $ | 137,824,347 | |||||||||
| November 2018 | — | $ | — | — | $ | 137,824,347 | ||||||||
| December 2018 | — | $ | — | — | $ | 137,824,347 | ||||||||
| Total quarter ended December 31, 2018 | — | $ | — | — | $ | 137,824,347 |
| (1) | On February 9, 2016, the Board of Directors amended its stock repurchase authorization to $350 million of the Company’s outstanding shares. During 2018, the Company did not repurchase any shares, leaving $137.8 million remaining under the authorization. The Company intends to purchase shares on the open market or in negotiated block trades from time to time depending on market conditions. No time limit was set for the completion of the programs which conforms to the requirements under the 2016 and 2018 Refinancing Credit Agreements, as well as the senior notes currently outstanding. |
Item 6. SELECTED FINANCIAL DATA
The following table shows selected consolidated financial information of the Company and has been derived from audited financial statements. This financial information should be read in conjunction with, and is qualified by reference to, “Management’s Discussion and Analysis of Financial Condition and Results of Operations” and the Consolidated Financial Statements of the Company and the Notes thereto included elsewhere in this Form 10-K.
| Year Ended December 31, | ||||||||||||||||||||
| In thousands, except per share amounts | 2018 | 2017 | 2016 | 2015 | 2014 | |||||||||||||||
| Income Statement Data | ||||||||||||||||||||
| Net sales | $ | 4,363,547 | $ | 3,881,756 | $ | 2,931,188 | $ | 3,307,998 | $ | 3,044,454 | ||||||||||
| Gross profit | 1,233,885 | 1,065,313 | 924,239 | 1,047,816 | 935,982 | |||||||||||||||
| Operating expenses | (760,448 | ) | (644,234 | ) | (467,632 | ) | (438,962 | ) | (406,198 | ) | ||||||||||
| Income from operations | $ | 473,437 | $ | 421,079 | $ | 456,607 | $ | 608,854 | $ | 529,784 | ||||||||||
| Interest expense, net | $ | (112,235 | ) | $ | (77,884 | ) | $ | (50,298 | ) | $ | (27,254 | ) | $ | (29,074 | ) | |||||
| Other income, net | 6,380 | 8,868 | 6,528 | 3,768 | 7,145 | |||||||||||||||
| Net income attributable to Wabtec shareholders | $ | 294,944 | $ | 262,261 | $ | 304,887 | $ | 398,628 | $ | 351,680 | ||||||||||
| Diluted Earnings per Common Share | ||||||||||||||||||||
| Net income attributable to Wabtec shareholders | $ | 3.05 | $ | 2.72 | $ | 3.34 | $ | 4.10 | $ | 3.62 | ||||||||||
| Cash dividends declared per share | $ | 0.48 | $ | 0.44 | $ | 0.36 | $ | 0.28 | $ | 0.20 | ||||||||||
| Fully diluted shares outstanding | 96,464 | 96,125 | 91,141 | 97,006 | 96,885 | |||||||||||||||
| Balance Sheet Data | ||||||||||||||||||||
| Total assets | $ | 8,649,234 | $ | 6,579,980 | $ | 6,581,018 | $ | 3,229,513 | $ | 3,303,841 | ||||||||||
| Cash, cash equivalents, and restricted cash | 2,342,354 | 233,401 | 398,484 | 226,191 | 425,849 | |||||||||||||||
| Total debt | 3,856,873 | 1,870,528 | 1,892,776 | 692,238 | 521,195 | |||||||||||||||
| Total equity | 2,869,075 | 2,828,532 | 2,976,825 | 1,701,339 | 1,808,298 |
Item 7. MANAGEMENT’S DISCUSSION AND ANALYSIS OF FINANCIAL CONDITION AND RESULTS OF OPERATIONS
OVERVIEW
Wabtec is one of the world’s largest providers of value-added, technology-based products and services for the global rail industry. Our products are found on virtually all U.S. locomotives, freight cars and passenger transit vehicles, as well as in more than 100 countries throughout the world. Our products enhance safety, improve productivity and reduce maintenance costs for customers, and many of our core products and services are essential in the safe and efficient operation of freight rail and passenger transit vehicles. Wabtec is a global company with operations in 30 countries. In 2018, about 67% of the Company’s revenues came from customers outside the U.S.
Management Review and Future Outlook
Wabtec’s long-term financial goals are to generate cash flow from operations in excess of net income, maintain a strong credit profile while minimizing our overall cost of capital, increase margins through strict attention to cost controls and implementation of the Wabtec Excellence Program, and increase revenues through a focused growth strategy, including product innovation and new technologies, global and market expansion, aftermarket products and services, and acquisitions. In addition, Management evaluates the Company’s current operational performance through measures such as quality and on-time delivery.
The Company primarily serves the worldwide freight and transit rail industries. As such, our operating results are largely dependent on the level of activity, financial condition and capital spending plans of railroads and passenger transit agencies around the world, and transportation equipment manufacturers who serve those markets. Many factors influence these industries, including general economic conditions; traffic volumes, as measured by freight carloadings and passenger ridership; government spending on public transportation; and investment in new technologies. In general, trends such as increasing urbanization, a focus on sustainability and environmental awareness, an aging equipment fleet, and growth in global trade are expected to drive continued investment in freight and transit rail.
The Company monitors a variety of factors and statistics to gauge market activity. Freight rail markets around the world are driven primarily by overall economic conditions and activity, while Transit markets are driven primarily by government funding and passenger ridership. Changes in these market drivers can cause fluctuations in demand for Wabtec's products and services.
According to the 2018 bi-annual edition of a market study by UNIFE, the Association of the European Rail Industry, the accessible global market for railway products and services was more than $100 billion and was expected to grow at a compounded annual growth rate of 2.6% through 2023. The three largest geographic markets, which represented about 80% of the total accessible market, were Europe, North America and Asia Pacific. UNIFE projected above-average growth rates in North America, Latin America and Africa/Middle East, with Asia Pacific and Europe growing at about the industry average. UNIFE said trends such as urbanization and increasing mobility, deregulation, investments in new technologies, energy and environmental issues, and increasing government support continue to drive investment. The largest product segments of the market were rolling stock, services and infrastructure, which represent almost 90% of the accessible market. UNIFE projected spending on turnkey management projects and infrastructure to grow at above-average rates. UNIFE estimated that the global installed base of locomotives was about 114,000 units, with about 33% in Asia Pacific, about 26% in North America and about 18% in Russia-CIS (Commonwealth of Independent States). Wabtec estimates that about 2,500 new locomotives were delivered worldwide in 2018, and we expect deliveries of about 2,900 in 2019. UNIFE estimated the global installed base of freight cars was about 5.1 million, with about 33% in North America, about 26% in Asia Pacific and about 24% in Russia-CIS. Wabtec estimates that about 175,000 new freight cars were delivered worldwide in 2018, and we expect deliveries of about 174,000 in 2019. UNIFE estimated the global installed base of passenger transit vehicles to be about 600,000 units, with about 45% in Asia Pacific, about 33% in Europe and about 12% in Russia-CIS. Wabtec estimates that about 30,000 new passenger transit vehicles were ordered worldwide in 2018, and we expect orders of about the same number in 2019.
In Europe, the majority of the rail system serves the passenger transit market, which is expected to continue growing as energy and environmental factors encourage continued investment in public mass transit. According to UNIFE, France, Germany and the United Kingdom were the largest Western European transit markets, representing almost two-thirds of industry spending in the European Union. UNIFE projected the accessible Western European rail market to grow at about 2.3% annually, led by investments in new rolling stock in France and Germany. About 75% of freight traffic in Europe is hauled by truck, while rail accounts for about 20%. The largest freight markets in Europe are Germany, Poland and the United Kingdom. In recent years, the European Commission has adopted a series of measures designed to increase the efficiency of the European rail network by standardizing operating rules and certification requirements. UNIFE believes that adoption of these measures should have a positive effect on ridership and investment in public transportation over time.
In North America, railroads carry about 40% of intercity freight, as measured by ton-miles, which is more than any other mode of transportation. Through direct ownership and operating partnerships, U.S. railroads are part of an integrated network that includes railroads in Canada and Mexico, forming what is regarded as the world’s most-efficient and lowest-cost freight rail service. There are more than 500 railroads operating in North America, with the largest railroads, referred to as “Class I,” accounting for more than 90% of the industry’s revenues. The railroads carry a wide variety of commodities and goods, including coal, metals, minerals, chemicals, grain, and petroleum. These commodities represent about 50% of total rail carloadings, with intermodal carloads accounting for the rest. Railroads operate in a competitive environment, especially with the trucking industry, and are always seeking ways to improve safety, cost and reliability. New technologies offered by Wabtec and others in the industry can provide some of these benefits. Demand for our freight related products and services in North America is driven by a number of factors, including rail traffic, and production of new locomotives and new freight cars. In the U.S., the passenger transit industry is dependent largely on funding from federal, state and local governments, and from fare box revenues. Demand for North American passenger transit products is driven by a number of factors, including government funding, deliveries of new subway cars and buses, and ridership. The U.S. federal government provides money to local transit authorities, primarily to fund the purchase of new equipment and infrastructure for their transit systems.
Growth in the Asia Pacific market has been driven mainly by the continued urbanization of China and India, and by investments in freight rail rolling stock and infrastructure in Australia to serve its mining and natural resources markets. India is making significant investments in rolling stock and infrastructure to modernize its rail system; for example, the country has awarded a 1,000-unit locomotive order to GE Transportation.
Other key geographic markets include Russia-CIS and Africa-Middle East. With about 1.2 million freight cars and about 20,000 locomotives, Russia-CIS is among the largest freight rail markets in th
Showing the first 8K of 95K characters. Open the full section
Item 7A. QUANTITATIVE AND QUALITATIVE DISCLOSURES ABOUT MARKET RISK
Interest Rate Risk
In the ordinary course of business, Wabtec is exposed to risks that increases in interest rates may adversely affect funding costs associated with its variable-rate debt. The Company’s variable rate debt represents 22% and 38% of total long-term debt at December 31, 2018 and 2017, respectively.
To reduce the impact of interest rate changes on a portion of this variable-rate debt, the Company entered into interest rate swap agreements which effectively converted a portion of the debt from a variable to a fixed-rate borrowing during the term of the swap contracts. Refer to “Financial Derivatives and Hedging Activities” in Note 2 of “Notes to Consolidated Financial Statements” included in Part IV, Item 15 of this report for additional information regarding interest rate risk.
Foreign Currency Exchange Rate Risk
The Company is subject to certain risks associated with changes in foreign currency exchange rates to the extent our operations are conducted in currencies other than the U.S. dollar. For the year ended December 31, 2018, approximately 33% of Wabtec’s net sales were in the United States, 9% in the United Kingdom, 7% in Germany, 6% in Canada, 6% in France, 5% in Mexico, 4% in China, 4% in Australia, 4% in India, 4% in Italy, 2% in Brazil, and 16% in other international locations. (See Note 22 of “Notes in Consolidated Financial Statements” included in Part IV, Item 15 of this report). To reduce the impact of changes in currency exchange rates, the Company has periodically entered into foreign currency forward contracts. Refer to “Financial Derivatives and Hedging Activities” in Note 2 of “Notes to Consolidated Financial Statements” included in Part IV, Item 15 of this report for more information regarding foreign currency exchange risk.
Our market risk exposure is not substantially different from our exposure at December 31, 2018.
Item 8. FINANCIAL STATEMENTS AND SUPPLEMENTARY DATA
Financial statements and supplementary data are set forth in Item 15 of Part IV hereof.
Item 9. CHANGES IN AND DISAGREEMENTS WITH ACCOUNTANTS ON ACCOUNTING AND FINANCIAL DISCLOSURE
There have been no disagreements with our independent registered public accountants.
Item 9A. CONTROLS AND PROCEDURES
Evaluation of Disclosure Controls and Procedures
Wabtec’s principal executive officer and its principal financial officer have evaluated the effectiveness of Wabtec’s “disclosure controls and procedures,” (as defined in Exchange Act Rule 13a-15(e)) as of December 31, 2018. Based upon their evaluation, the principal executive officer and principal financial officer concluded that Wabtec’s disclosure controls and procedures are effective to provide reasonable assurance that information required to be disclosed by Wabtec in the reports filed or submitted by it under the Exchange Act is recorded, processed, summarized and reported within the time periods specified in the SEC’s rules and forms, and to provide reasonable assurance that information required to be disclosed by Wabtec in such reports is accumulated and communicated to Wabtec’s Management, including its principal executive officer and principal finance officer, as appropriate to allow timely decisions regarding required disclosure.
Changes in Internal Control over Financial Reporting
There was no change in Wabtec’s “internal control over financial reporting” (as defined in Rule 13a-15(f) under the Exchange Act) that occurred during the quarter ended December 31, 2018, that has materially affected, or is reasonably likely to materially affect, Wabtec’s internal control over financial reporting. Management’s annual report on internal control over financial reporting and the attestation report of the registered public accounting firm are included in Part IV, Item 15 of this report.
Management’s Report on Internal Control over Financial Reporting
Management’s Report on Internal Control Over Financial Reporting appears on page 52 and is incorporated herein by reference.
Report of Independent Registered Public Accounting Firm on Internal Control over Financial Reporting
Ernst & Young LLP's attestation report on internal control over financial reporting appears on page 55 and is incorporated herein by reference.
Item 9B. OTHER INFORMATION
None.
PART III
Items 10 through 14.
In accordance with the provisions of General Instruction G(3) to Form 10-K, the information required by Item 10 (Directors, Executive Officers and Corporate Governance), Item 11 (Executive Compensation), Item 12 (Security Ownership of Certain Beneficial Owners and Management and Related Stockholder Matters), Item 13 (Certain Relationships and Related Transactions, and Director Independence) and Item 14 (Principal Accounting Fees and Services) is incorporated herein by reference from the Company’s definitive Proxy Statement for its Annual Meeting of Stockholders to be held on May 17, 2019, except for the Equity Compensation Plan Information required by Item 12, which is set forth in the table below. The definitive Proxy Statement will be filed with the Securities and Exchange Commission not later than 120 days after December 31, 2018. Information relating to the executive officers of the Company is set forth in Part I.
Wabtec has adopted a Code of Ethics for Senior Officers which is applicable to our executive officers. As described in Item 1 of this report the Code of Ethics for Senior Officers is posted on our website at www.wabtec.com. In the event that we make any amendments to or waivers from this code, we will disclose the amendment or waiver and the reasons for such on our website.
This table provides aggregate information as of December 31, 2018 concerning equity awards under Wabtec’s compensation plans and arrangements.
| (a) Number of securities to be issued upon exercise of outstanding options, | (b) Weighted-average exercise price of outstanding options warrants | (c) Number of securities remaining available for future issuance under equity compensation plans (excluding securities | ||||||||
| Plan Category | warrants and rights | and rights | reflected in column (a)) | |||||||
| Equity compensation plans approved by shareholders | 466,677 | $ | 61.04 | 2,800,836 | ||||||
| Equity compensation plans not approved by shareholders | — | — | — | |||||||
| Total | 466,677 | $ | 61.04 | 2,800,836 |
PART IV
Item 15. EXHIBITS AND FINANCIAL STATEMENT SCHEDULES
The financial statements, financial statement schedules and exhibits listed below are filed as part of this annual report:
Showing the first 8K of 238K characters. Open the full section
Item 16. FORM 10-K SUMMARY
Not applicable.
SIGNATURES
Pursuant to the requirements of Section 13 or 15(d) of the Securities Exchange Act of 1934, the Company has duly caused this report to be signed on its behalf by the undersigned, thereunto duly authorized.
| WESTINGHOUSE AIR BRAKE TECHNOLOGIES CORPORATION | |||
| Date: | February 27, 2019 | By: | /S/ RAYMOND T. BETLER |
| Raymond T. Betler, | |||
| President and Chief Executive Officer, and Director |
Pursuant to the requirements of the Securities Exchange Act of 1934, this report has been signed below by the following persons on behalf of the Company and in the capacities and on the dates indicated.
| Signature and Title | Date | |
| By | /S/ ALBERT J. NEUPAVER | February 27, 2019 |
| Albert J. Neupaver, Executive Chairman of the Board | ||
| By | /S/ RAYMOND T. BETLER | February 27, 2019 |
| Raymond T. Betler, President and Chief Executive Officer and Director (Principal Executive Officer) | ||
| By | /S/ PATRICK D. DUGAN | February 27, 2019 |
| Patrick D. Dugan, Executive Vice President Finance and Chief Financial Officer (Principal Financial Officer) | ||
| By | /S/ JOHN A. MASTALERZ | February 27, 2019 |
| John A. Mastalerz, Senior Vice President and Principal Accounting Officer | ||
| By | /S/ WILLIAM E. KASSLING | February 27, 2019 |
| William E. Kassling, Lead Director | ||
| By | /S/ PHILIPPE ALFROID | February 27, 2019 |
| Philippe Alfroid, Director | ||
| By | /S/ ROBERT J. BROOKS | February 27, 2019 |
| Robert J. Brooks, Director | ||
| By | /S/ ERWAN FAIVELEY | February 27, 2019 |
| Erwan Faiveley, Director | ||
| By | /S/ EMILIO A. FERNANDEZ | February 27, 2019 |
| Emilio A. Fernandez, Director | ||
| By | /S/ LEE B. FOSTER, II | February 27, 2019 |
| Lee B. Foster, II, Director | ||
| By | /S/ LINDA S. HARTY | February 27, 2019 |
| Linda S. Harty, Director | ||
| By | /S/ BRIAN P. HEHIR | February 27, 2019 |
| Brian P. Hehir, Director | ||
| By | /S/ MICHAEL W. D. HOWELL | February 27, 2019 |
| Michael W. D. Howell, Director | ||