 filings.tools
Xylem (XYL) 10-K risk factor changes: FY2016 vs FY2015
The 2016-12-31 10-K against the 2015-12-31 one, compared heading by heading and sentence by sentence. One of these filings carries no fiscal year tag, so its year is the calendar year of the period end.
Item 1A69 rewritten42 added13 removed209 unchanged
All filing items1,417 rewritten781 added520 removed1,539 unchanged
Summary
counted, not written
- Item 1A headings could not be compared: only 0 carried over between the two years, which usually means one filing was read wrongly, so none is reported as new or removed.
- Sentence by sentence, 781 added, 520 removed, 1,417 rewritten and 1,539 unchanged across 20 items that differ.
- New this year: Item 16. FORM 10-K SUMMARY.
Sentences by item
22 items, with every count and a link to each item that changed
Underlined words on a shaded ground are new in FY2016; struck-through words were in FY2015. Sentences that are wholly new or wholly gone are labelled rather than marked.
Item 1A. RISK FACTORS
69 rewritten, 42 added, 13 removed, 209 unchanged
[removed: In] [added: *In] evaluating our business, each of the following risks should be carefully considered, along with all of the other information in this Report and in our other filings with the SEC.
Should any of these risks and uncertainties develop into actual events, our business, financial condition or results of operations could be materially and adversely [removed: affected.][added: affected.*]
[removed: Risks] [added: Risks] Related to Operational and External [removed: Factors][added: Factors]
[removed: Failure] [added: Failure] to compete successfully in our markets could adversely affect our [removed: business.][added: business.]
Our competitors may develop [added: disruptive technologies or] products that are superior to our products, or may develop more efficient or effective methods of providing products and services or may adapt more quickly than we do to new technologies or evolving customer requirements.
[removed: Our] [added: Our] results of operations and financial condition may be adversely affected by global economic and financial market [removed: conditions.][added: conditions.]
In [removed: 2015, 41%, 32%] [added: 2016, 42%, 31%] and 21% of our total revenue was from customers located in the United States, Europe and emerging markets, respectively.
Important factors impacting our businesses include the overall strength of these economies and our customers’ confidence in both local and global macro-economic conditions; industrial and federal, state, local and municipal governmental [removed: spending;] [added: fiscal and trade policies;] the strength of the residential and commercial real estate markets; interest rates; availability of commercial financing for our customers and end-users; and unemployment rates.
A slowdown or prolonged downturn in [removed: financial or macro-economic conditions in these areas or in the United States] [added: our markets] could have a material adverse effect on our business, financial condition and results of operations.
[removed: Economic] [added: Economic] and other risks associated with international sales and operations could adversely affect our [removed: business.][added: business.]
In [removed: 2015, 59%] [added: 2016, 58%] of our total revenue was from customers outside the United States, with 21% of total revenue generated in emerging markets.
We expect our [added: sales from] international operations [removed: sales] and export sales to continue to be a significant portion of our revenue.
| • | changes in [added: trade protection measures, including] tariff and trade barriers and import and export licensing requirements; |
In addition to the general risks that we face outside the United States, [removed: we now conduct more of] our operations in emerging markets [removed: than we have in the past, which] could involve additional uncertainties for us, including risks that governments may impose limitations on our ability to repatriate funds; governments may impose withholding or other taxes on [added: remittances and other payments to us, or the amount of any such taxes may increase; an outbreak or escalation of any insurrection or armed conflict may occur; governments may seek to nationalize our assets; or governments may impose or increase investment barriers or other restrictions affecting our business.]
We cannot predict the impact such [removed: future, largely unforeseeable] events might have on our business, financial condition and results of operations.
[removed: Failure] [added: Failure] to comply with laws, regulations and policies, including the U.S. Foreign Corrupt Practices Act or other applicable anti-corruption legislation could result in fines, criminal penalties and an adverse effect on our [removed: business.][added: business.]
We are subject to regulation under a wide variety of U.S. federal and state and non-U.S. laws, regulations and policies, including laws related to anti-corruption, [added: trade regulations, including] export and import compliance, anti-trust and money laundering, due to our global operations.
[removed: Our] [added: Our] business could be adversely affected by the inability of suppliers to meet delivery [removed: requirements.][added: requirements.]
We are exposed to the availability of these materials, which may be subject to curtailment or change due to, among other things, interruptions in production by suppliers, labor disputes, the impaired financial condition of a particular supplier, suppliers’ allocations to other purchasers, changes in [added: tariff regimes,] exchange rates and prevailing price levels, ability to meet regulatory requirements, weather emergencies or acts of war or terrorism.
[removed: Our] [added: Our] business could be adversely affected by significant movements in foreign currency exchange [removed: rates.][added: rates.]
We conduct approximately [removed: 59%] [added: 58%] of our business in various locations outside the United States.
[removed: Weather] [added: Weather] conditions and climate changes may adversely affect, or cause volatility [removed: to/in,] [added: in,] our financial [removed: results.][added: results.]
Weather conditions, including heavy flooding, droughts and fluctuations in temperatures or [removed: shifting conditions] [added: weather patterns, including] as a result of climate change, can positively or negatively impact portions of our business.
Within the dewatering space, [removed: our] pumps provided through our Godwin and Flygt brands are used to remove excess or unwanted water.
[removed: Our] [added: Our] financial results can be difficult to [removed: predict.][added: predict.]
[removed: Our] [added: Our] strategy includes acquisitions, and we may not be able to make acquisitions of suitable candidates or integrate acquisitions [removed: successfully.][added: successfully.]
We [removed: cannot make assurances, however, that we will] [added: may not] be able to identify suitable candidates successfully, negotiate appropriate acquisition terms, obtain financing that may be needed to consummate those acquisitions, complete proposed acquisitions, successfully integrate acquired businesses into our existing operations or expand into new markets.
[removed: We] [added: We] may incur impairment charges for our goodwill and other indefinite-lived intangible assets which would negatively impact our operating [removed: results.][added: results.]
As of December 31, [removed: 2015,] [added: 2016,] the net carrying value of our goodwill and other indefinite-lived intangible assets totaled approximately [removed: $2 billion.][added: $3 billion The carrying value of goodwill represents the fair value of an acquired business in excess of identifiable assets and liabilities as of the acquisition date.]
Any charges relating to such impairments could adversely affect our results of operations and financial [removed: condition in the periods recognized.][added: condition.]
[removed: We] [added: We] may not achieve some or all of the expected benefits of our restructuring plans and our restructuring may adversely affect our [removed: business.][added: business.]
[removed: We] [added: In recent fiscal years, we] have [removed: announced] [added: initiated] restructuring plans in an effort to [removed: reposition our European and North American businesses to] optimize our cost structure and improve our operational efficiency and effectiveness.
[added: Additionally, as a] result of our restructuring, we may experience a loss of continuity, loss of accumulated knowledge or inefficiency during transitional periods.
Factors that may impede a successful implementation [removed: is] [added: include the] retention of key employees, the impact of regulatory matters, and adverse economic market conditions.
If [removed: the] [added: our] restructuring [removed: and realignment] actions are not executed successfully, it could have a material adverse effect on our competitive position, business, financial condition and results of operations.
[removed: Changes] [added: Changes] in our effective tax rates may adversely affect our financial [removed: results.][added: results.]
We sell our products in more than 150 countries and [removed: 59%] [added: 58%] of our revenue was generated outside the United States in [removed: 2015.][added: 2016.]
[removed: Our] [added: Our] business could be adversely affected by inflation and other manufacturing and operating cost [removed: increases.][added: increases.]
[removed: Product] [added: Product] defects and unanticipated use or inadequate disclosure with respect to our products could adversely affect our business, reputation and financial [removed: statements.][added: statements.]
Manufacturing or design defects in (including in products or components that we source from third parties), unanticipated use of, or inadequate disclosure of risks relating to the use of [removed: products there can be no assurance that we or] our [removed: customers or other third parties will not experience operational process failures or other problems that] [added: products] could [removed: result in potential] [added: create] product safety, regulatory or environmental [removed: risk which can lead to] [added: risks, including] personal injury, death or property damage.
Our future growth rate depends upon a number of factors, including our ability to (i) identify emerging technological trends in our target end-markets, (ii) develop and maintain competitive products and defend our market share against an ever-expanding number of competitors including many new and non-traditional competitors, (iii) enhance our products by adding innovative features that differentiate our products from those of our competitors and prevent commoditization of our products, (iv) develop, manufacture and bring compelling new products to market quickly and cost-effectively, and (v) attract, develop and retain individuals with the requisite technical expertise and understanding of customers’ needs to develop new technologies and introduce new products.
The failure of our technologies or products to gain market acceptance due to more attractive offerings by our competitors could significantly reduce our revenues and adversely affect our competitive standing and prospects.
| • | unanticipated changes in other laws and regulations or in how such provisions are interpreted or administered; |
| • | potential disruptions in our global supply chain; |
| • | regional safety and security considerations; |
Failure to successfully execute our acquisition strategy could adversely affect our business, financial condition or results of operations.
In addition, we have designed products and services that connect to and are part of the “Internet of Things.” While we attempt to provide adequate security measures to safeguard our products from cyber threats, the potential for an attack remains.
A successful attack may result in inappropriate access to our or our customer's information or an inability for our products to function properly.
For instance, our 2016 revenue decreased by
2.0% due to unfavorable foreign currency impacts.
As of December 31, 2016, our total outstanding indebtedness was $2,368 million as described under “Liquidity and Capital Resources." Our indebtedness could:
contractual disputes.
Our acquisition of Sensus has increased our exposure to intellectual property litigation and we expect that this risk will continue to increase as we execute on our innovation and technology priorities.
It is not possible to predict with certainty the outcome of claims, investigations, and lawsuits, and we could in the future incur judgments, fines or penalties or enter into settlements of lawsuits and claims that could have an adverse effect on our business, results of operations and financial condition in any particular period.
The global and diverse nature of our operations means that legal and compliance risks will continue to exist and additional legal proceedings and other contingencies, the outcome of which cannot be predicted with certainty, will arise from time to time.
In addition, subsequent developments in legal proceedings may affect our assessments and estimates of loss contingencies recorded as a reserve and require us to make payments in excess of our reserves, which could have an adverse effect on our results of operations and financial condition.
A significant number of our products in our Sensus segment are affected by the availability and regulation of radio spectrum and could be affected by interference with the radio spectrum that we use.
A significant number of the products in our Sensus segment use radio spectrum, which is subject to government regulation.
To the extent we introduce new products designed for use in the United States or another country into a new market, such products may require significant modification or redesign in order to meet frequency requirements and other regulatory specifications.
In some countries, limitations on frequency availability or the cost of making necessary modifications may preclude us from selling our products in those countries.
The regulations that govern our use of the radio spectrum may change and that the changes may require us to modify our products, either directly or due to interference caused by new consumer products allowed under the regulations.
The inability to modify our products to meet such requirements, the possible delays in completing such modifications, and the cost of such modifications all could have a material adverse effect on our business, financial condition, and results of operations.
In the United States, our products are primarily designed to use licensed spectrum in the 900MHz range.
If the Federal Communications Commission (“FCC”) did not renew our existing spectrum licenses, our business could be adversely affected.
In addition, there may be insufficient available frequencies in some markets to sustain or develop our planned operations at a commercially feasible price or at all.
Outside of the United States, certain of our products require the use of radio frequency and are subject to regulations.
In some jurisdictions, radio station licenses may be granted for a fixed term and must be periodically renewed.
Our advanced and smart metering systems typically transmit to (and receive information from, if applicable) handheld, mobile, or fixed network reading devices in licensed bands made available to us through strategic partnerships and are reliant to some extent on the licensed spectrum continuing to be available through our partners or our customers.
We may be unable to find partners or customers that have access to sufficient frequencies in some markets to sustain or develop our planned operations or to find partners or customers that have access to sufficient frequencies in the relevant markets at a commercially feasible price or at all.
any such developments, or financial insolvency of other responsible parties could in the future have a material adverse effect on our financial position and results of operations.
| • | stock repurchases; |
| • | acquisitions and divestitures; |
| | |
| --- | --- |
| | |
| --- | --- |
| | |
| --- | --- |
| | |
| --- | --- |
remittances and other payments to us, or the amount of any such taxes may increase; an outbreak or escalation of any insurrection or armed conflict may occur; governments may seek to nationalize our assets; or governments may impose or increase investment barriers or other restrictions affecting our business.
There has been an increase in anti-bribery law enforcement activity in recent years, with more frequent and aggressive investigations and enforcement proceedings by both the Department of Justice ("DOJ") and the SEC, increased enforcement activity by non-U.S. regulators, and increases in criminal and civil proceedings brought against companies and individuals.
For instance, our 2015 revenue decreased by 8.0% due to unfavorable foreign currency impacts.
Our historical growth has included acquisitions.
The carrying value of goodwill represents the fair value of an acquired business in excess of identifiable assets and liabilities as of the acquisition date.
Additionally, as a
As of December 31, 2015, our total outstanding indebtedness was $1,274 million, including our 3.55% Senior Notes of $600 million aggregate principal amount due September 2016 and 4.875% Senior Notes of $600 million aggregate principal amount due October 2021.
We have an existing Five-Year Competitive Advance and Revolving Credit Facility (the “Credit Facility”), which provides for an aggregate principal amount of up to $600 million.
We have a Risk Sharing Finance Facility Agreement (the "R&D Facility Agreement") with The European Investment Bank ("EIB") in an aggregate principal amount of up to €120 million (approximately $132 million).
Our indebtedness could:
We are subject to laws, regulations and potential liability relating to claims, complaints and proceedings, including those related to antitrust, environmental, product, and other matters.
We may become subject to significant claims of which we are currently unaware, or the claims of which we are aware may result in our incurring a significantly greater liability than we anticipate or can estimate.
Risks Related to our 2011 Spin-off from ITT Corporation
An excerpt. Shown here: 40 of 69 rewritten, 40 of 42 added and all 13 removed. The counts are complete. For every sentence, read Item 1A. RISK FACTORS in the FY2016 filing and the FY2015 filing.
Item 7. MANAGEMENT’S DISCUSSION AND ANALYSIS OF FINANCIAL CONDITION AND RESULTS OF OPERATIONS
264 rewritten, 198 added, 157 removed, 271 unchanged
[removed: The] [added: *The] following discussion should be read in conjunction with our consolidated financial statements and the notes thereto.
This discussion summarizes the significant factors affecting our results of operations and the financial condition of our business during each of the fiscal years in the three-year period [removed: ended December] [added: ended* *December] 31, [removed: 2015.][added: 2016.]
Except as otherwise indicated or unless the context otherwise requires, “Xylem,” “we,” “us,” “our” and “the Company” refer to Xylem Inc. and its [removed: subsidiaries.][added: subsidiaries.*]
[removed: Overview][added: Overview]
Our product and service offerings are organized into [removed: two] [added: three] reportable [removed: segments:] [added: segments that are aligned around the critical market applications they provide:] Water [removed: Infrastructure and] [added: Infrastructure,] Applied [removed: Water.][added: Water and Sensus.]
| • | [removed: Water Infrastructure] [added: *Water Infrastructure*] serves the water infrastructure sector with pump systems that transport water from aquifers, lakes, rivers and seas; with filtration, ultraviolet and ozone systems that provide treatment, making the water fit to use; and pumping solutions that move the wastewater to treatment facilities where our mixers, biological treatment, monitoring and control systems provide the primary functions in the treatment process. We provide analytical instrumentation used to measure water quality, flow and level in wastewater, surface water and coastal environments. In the Water Infrastructure segment, we provide the majority of our sales directly to customers with strong application expertise, while the remaining amount is through distribution partners. |
| • | [removed: Applied Water] [added: *Applied Water*] serves the usage applications sector with water pressure boosting systems for heating, ventilation and air conditioning and for fire protection systems to the residential and commercial building services markets. In addition, our pumps, heat exchangers, valves and controls provide cooling to power plants and manufacturing facilities, as well as circulation for food and beverage processing. We also provide boosting systems for farming irrigation, pumps for dairy operations and rainwater reuse systems for small scale crop and turf irrigation. In the Applied Water segment, we provide the majority of our sales through long-standing relationships with [added: many of] the [removed: world’s] leading [removed: distributors,] [added: independent distributors in the markets we serve,] with the remainder going directly to customers. |
[removed: Key] [added: Key] Performance Indicators and Non-GAAP [removed: Measures][added: Measures]
Management reviews key performance indicators including revenue, gross margin, segment operating income and margins, earnings per share, orders growth, working [removed: capital, free cash flow] [added: capital] and backlog, among others.
In addition, we consider certain [added: non-GAAP (or "adjusted")] measures to be useful to management and investors evaluating our operating performance for the periods presented, and [added: to] provide a tool for evaluating our ongoing operations, liquidity and management of assets.
These metrics, however, are not measures of financial performance under GAAP and should not be considered a substitute for revenue, operating income, net income, earnings per share (basic and diluted) or net cash from [removed: operations] [added: operating activities] as determined in accordance with GAAP.
[removed: We consider the following non-GAAP] measures, which may not be comparable to similarly titled measures reported by other companies, to be key performance indicators:
| • | "organic revenue" and "organic orders" defined as revenue and orders, respectively, excluding the impact of fluctuations in foreign currency [removed: translation, intercompany transactions] [added: translation] and contributions from acquisitions and divestitures. Divestitures include sales of insignificant portions of our business that did not meet the criteria for classification as a discontinued operation. The period-over-period change resulting from foreign currency translation [removed: assumes no change in exchange rates from the] [added: impacts is determined by translating current period and] prior [removed: period.] [added: period activity using the same currency conversion rate.] |
[removed: -] [added: | • |] "adjusted net income" and "adjusted earnings per share" defined as net income and earnings per share, respectively, adjusted to exclude restructuring and realignment costs, [added: Sensus acquisition related costs,] special charges, [removed: tax-related special items and] gain from sale of [removed: businesses.][added: business and tax-related special items, as applicable. A reconciliation of adjusted net income is provided below. |]
| (in millions, except per share data) | | [removed: 2015] [added: 2016] | | | | [removed: 2014] [added: 2015] | | | | [removed: 2013] [added: 2014] | | |
| [removed: Net income] [added: Net income] | | [removed: $] [added: $] | [removed: 340] [added: 260] | | | $ | [removed: 337] [added: 340] | | | $ | [removed: 228] [added: 337] | |
| Restructuring and realignment, net of tax benefit of [removed: $5, $12] [added: $13, $5] and [removed: $18,] [added: $12,] respectively | | [removed: 15] [added: 34] | | | | [removed: 31] [added: 15] | | | | [removed: 46] [added: 31] | | |
| Special charges, net of tax benefit of [removed: $0] [added: $7] and [removed: $9,] [added: $0,] respectively | | [removed: 5] [added: 11] | | | | [removed: —] [added: 5] | | | | [removed: 23] [added: —] | | |
| Tax-related special items | | [removed: (15] [added: 21] | | [removed: )] | | [removed: 5] [added: (15] | | [added: )] | | [removed: 14] [added: 5] | | |
| Gain [removed: on] [added: from] sale of business, net of $0 tax in both years | | [removed: (9] [added: —] | | [removed: )] | | [removed: (11] [added: (9] | | ) | | [removed: —] [added: (11] | | [added: )] |
| [removed: Adjusted] [added: Adjusted] net [removed: income] [added: income] | | [removed: $] [added: $] | [removed: 336] [added: 364] | | | $ | [removed: 362] [added: 336] | | | $ | [removed: 311] [added: 362] | |
| Weighted average number of shares - Diluted | | [removed: 181.7] [added: 180.0] | | | | [removed: 184.2] [added: 181.7] | | | | [removed: 186.0] [added: 184.2] | | |
| [removed: Adjusted] [added: Adjusted] earnings per [removed: share] [added: share] | | [removed: $] [added: $] | [removed: 1.85] [added: 2.03] | | | $ | [removed: 1.97] [added: 1.85] | | | $ | [removed: 1.67] [added: 1.97] | |
| • | "operating expenses excluding restructuring and realignment [added: costs, Sensus acquisition related] costs and special charges" defined as operating expenses, adjusted to exclude restructuring and realignment [added: costs, Sensus acquisition related] costs and special charges. |
| • | "adjusted operating income (loss)" defined as operating income (loss), adjusted to exclude restructuring and realignment [added: costs, Sensus acquisition related] costs and special charges, and "adjusted operating margin" defined as adjusted operating income divided by total revenue. |
| • | "tax-related special items" defined as tax items, such as tax return versus tax provision adjustments, tax exam impacts, tax law change [removed: impacts] [added: impacts, significant reserves for cash repatriation, excess tax benefits/losses] and other discrete tax adjustments. |
[removed: -] [added: | • |] "free cash flow" defined as net cash from operating activities, as reported in the [removed: Statement] [added: statement] of [removed: Cash Flow,] [added: cash flow,] less capital expenditures, as well as adjustments for other significant items that impact current results [removed: that] [added: which] management believes are not related to our ongoing operations and performance. [added: Our definition of free cash |]
[removed: Our definition of free cash] flow does not consider certain non-discretionary cash payments, such as debt.
| (in millions) | | [removed: 2015] [added: 2016] | | | | [removed: 2014] [added: 2015] | | | | [removed: 2013] [added: 2014] | | |
| [removed: Net] [added: Net] cash provided by operating [removed: activities] [added: activities] | | [removed: $] [added: $] | [removed: 464] [added: 497] | | | $ | [removed: 416] [added: 464] | | | $ | [removed: 324] [added: 416] | |
| Capital expenditures | | [removed: (117] [added: (124] | | [removed: )] [added: )] | | [removed: (119] [added: (117] | | ) | | [removed: (126] [added: (119] | | ) |
| [removed: Free] [added: Free] cash [removed: flow] [added: flow] | | [removed: $] [added: $] | [removed: 347] [added: 373] | | | $ | [removed: 297] [added: 347] | | | $ | [removed: 198] [added: 297] | |
[removed: Executive Summary][added: Executive Summary]
[removed: Revenue increased 1.3% on a constant currency basis] [added: The increase in organic revenue was] due to [removed: strong organic growth] [added: strength] in the [removed: public utility, commercial] [added: commercial, industrial water] and residential [added: end] markets, partially offset by declines in [removed: industrial in] the [removed: oil and gas] [added: agriculture end] market.
Operating income for [removed: 2015] [added: 2016] was [removed: $449] [added: $406] million, reflecting a decrease of [removed: $14] [added: $43] million or [removed: 3.0%] [added: 9.6%] compared to [removed: $463] [added: $449] million in [removed: 2014.][added: 2015.]
Operating income as a percentage of revenue was 12.3% for 2015 versus 11.8% for 2014, an increase of 50 basis [removed: points.]
Additional financial highlights for [removed: 2015] [added: 2016] include the following:
| • | Net income of [removed: $340] [added: $260] million, or [removed: $1.87] [added: $1.45] per diluted share [removed: ($336] [added: ($364] million or [removed: $1.85] [added: $2.03] per diluted share on an adjusted basis) |
| • | [removed: Free cash flow] [added: Cash from operating activities] of [removed: $347] [added: $497] million, and [removed: net] [added: free] cash [removed: from operating activities] [added: flow, excluding Sensus acquisition related costs,] of [removed: $464] [added: $386] million |
| • | Orders of [added: $3,824 million, up 3.0% from] $3,711 million [removed: (a 0.5% increase from 2014] [added: in 2015 (up 0.3%] on an organic basis) |
Xylem is a leading global water technology company.
We design, manufacture and service highly engineered solutions ranging across a wide variety of critical applications.
Our broad portfolio of solutions addresses customer needs across the water cycle, from the delivery and use of drinking water to the collection and treatment of wastewater to the return of water to the environment.
| • | *Sensus*, which we acquired on October 31, 2016, serves the utility infrastructure solutions and services sector by delivering communications, smart metering, measurement and control technologies and services that allow customers to more effectively use their distribution networks for the delivery of critical resources such as water, electricity and natural gas. Additionally, we sell software and services including cloud-based analytics, remote monitoring and data management, and also sell smart lighting products and solutions that improve efficiency and public safety efforts across communities. In the Sensus segment we generate the majority of our sales in the U.S. through long-standing relationships with leading distributors and dedicated channel partners, while we use a combination of direct sales and distribution channels internationally, depending on the regional availability of distribution channels. The Sensus segment has approximately 3,300 employees across 28 locations on six continents. |
Excluding revenue, Xylem provides guidance only on a non-GAAP basis due to the inherent difficulty in forecasting certain amounts that would be included in GAAP earnings, such as discrete tax items, without unreasonable effort.
These adjusted metrics are consistent with how management views our business and are used to make financial, operating and planning decisions.
We consider the following non-GAAP
| Sensus acquisition related costs, net of tax benefit of $15 | | 38 | | | | — | | | | — | | |
| Earnings per share | | $ | 1.45 | | | $ | 1.87 | | | $ | 1.83 | |
| • | "Sensus acquisition related costs" defined as costs incurred by the Company associated with the acquisition of Sensus that are being reported within operating income. These costs include transaction costs, integration costs, costs related to the recognition of inventory step-up and amortization of the backlog intangible asset recorded in purchase accounting. |
| • | “special charges" defined as costs incurred by the Company, such as interest expense related to the early extinguishment of debt during Q2 2016, financing costs related to the bridge loan entered into in Q3 2016 for the Sensus acquisition, initial acquisition costs not related to Sensus, costs incurred for the contractual indemnification of tax obligations to ITT and other special non-operating items. |
| Cash paid for Sensus related acquisition costs | | 13 | | | | — | | | | — | | |
| Free cash flow, excluding Sensus acquisition related costs | | $ | 386 | | | $ | 347 | | | $ | 297 | |
| • | “EBITDA” defined as earnings before interest, taxes, depreciation, amortization expense, and share-based compensation and “Adjusted EBITDA” reflects the adjustment to EBITDA to exclude restructuring and realignment costs, Sensus acquisition related costs, gain from sale of business and special charges. |
| | | | | | | | | | | | | |
| --- | --- | --- | --- | --- | --- | --- | --- | --- | --- | --- | --- | --- |
| | | | | | | | | | | | | |
| Net Income | | $ | 260 | | | $ | 340 | | | $ | 337 | |
| Interest expense (Income), net | | 68 | | | | 53 | | | | 52 | | |
| Depreciation | | 87 | | | | 88 | | | | 95 | | |
| Amortization | | 64 | | | | 45 | | | | 47 | | |
| Stock compensation | | 18 | | | | 15 | | | | 18 | | |
| EBITDA | | $ | 577 | | | $ | 604 | | | $ | 633 | |
| Restructuring and realignment | | 47 | | | | 20 | | | | 43 | | |
| Sensus acquisition related costs | | 46 | | | | — | | | | — | | |
| Gain from sale of business | | — | | | | (9 | | ) | | (11 | | ) |
| Adjusted EBITDA | | $ | 675 | | | $ | 620 | | | $ | 665 | |
Xylem reported revenue of $3,771 million for 2016, an increase of $118 million or 3.2% from $3,653 million reported in 2015.
Revenue increased 5.3% on a constant currency basis due to increased revenue of $163 million from acquisitions and organic revenue growth of $29 million driven primarily by a robust public utility end market and a relatively stable commercial business.
Operating margin was 10.8% for 2016 versus 12.3% for 2015, a decrease of 150 basis points.
This decrease in operating income was primarily due to Sensus acquisition related costs of $53 million, increases in restructuring and realignment costs of $27 million and increases in special charges of $4 million.
Excluding these costs, adjusted operating income was $511 million, with an adjusted operating margin of 13.6%, reflecting an increase of $41 million or 8.7% and 70 basis points, respectively, as compared with 2015 adjusted operating income of $470 million (adjusted operating margin of 12.9%).
This increase in adjusted operating income was driven by strong progress in our productivity initiatives and cost reductions, which more than offset cost inflation, spending on strategic investments and unfavorable mix.
We anticipate total revenue growth in the range of 20% to 22% in 2017 with organic revenue growth in the low-single-digits and Sensus contributing the additional revenue growth.
| • | Industrial was down 4% for 2016, including agriculture which will be included within industrial going forward, as general industrial strength was more than offset by oil and gas declines in Canada and the United States. For 2017, we expect growth to be flat to up in the low-single-digits. We believe the soft market conditions in general industrial that occurred in the U.S. during 2016 will carry into at least the first half of 2017, with modest growth returning over the second half. We continue to expect that the oil and gas markets will be down year-over-year, despite some pockets of higher activity. We expect Emerging Market performance to continue to be mixed with some strength in China and Latin America, offset by continued weakness in the Middle East. |
| • | Public utilities increased 8% for 2016 driven by the United States recovery and continued emerging markets investments. We expect growth to be moderate but still increase low to mid-single-digits. In the U.S., which represents approximately one-quarter of our public utility base, we anticipate solid repair and replacement, or opex, activity coupled with some acceleration of project activity later in the year. In Emerging Markets, we expect large project activities to drive growth particularly in China and India. We also anticipate continued growth in Europe, particularly in the United Kingdom with the third year of positive impacts from the AMP 6 cycle. Additionally, we anticipate Sensus public utility revenue to continue to grow at mid-to-high single digits over their historical performance driven by expected growth in the United States within smart metering applications. |
| • | Commercial experienced growth of 2% for 2016 driven by strength in the European market which was partially offset by weakness in the United States. We expect continued growth in the low-single-digit range for 2017. Market data suggests a low-growth environment in the U.S. where we have a leading market position and more than half of our total Commercial exposure. Beyond the U.S., the global outlook is mixed. We believe Europe will be closer to flat with lower construction activity and funding uncertainty in certain countries. Also, our business in Europe will face a tough prior year comparison to this year's 10% growth. China appears to be stabilizing and we expect the market to grow over a weak 2016 performance. |
| • | Residential markets were down 3% in 2016 with weakness across most regions. For 2017 we expect low- single-digit growth. In the U.S. we expect relatively flat year over year volumes given the competitive landscape and replacement nature of the sector we serve. The European market looks to be modestly stronger as residential building permitting, which is an indicator of sales, increased during the fourth quarter. |
Additionally, with the acquisition of Sensus, we anticipate increased spending on research and development as a percentage of revenue as Sensus brings a higher profile of R&D given the investment required to support growth and new product launches.
| Sensus acquisition related charges | | 53 | | | | — | | | | — | | | | | | | | |
Xylem is a leading equipment and service provider for water and wastewater applications with a broad portfolio of products and services addressing the full cycle of water, from collection, distribution and use to the return of water to the environment.
Our business focuses on providing technology-intensive equipment and services.
Our segments are aligned with each of the sectors in the cycle of water, water infrastructure and usage applications.
We sell our equipment and services through direct and indirect channels that serve the needs of each customer type.
In the Water Infrastructure segment, we provide the majority of our sales direct to customers with strong application expertise, while the remaining amount is through distribution partners.
In the Applied Water segment, we provide the majority of our sales through long-standing relationships with the world’s leading distributors, with the remainder going direct to customers.
A reconciliation of adjusted net income is provided below.
| • | “special charges" defined as costs incurred by the Company, such as legal and professional fees, associated with the Korea matters, costs incurred for the contractual indemnification of tax obligations to ITT, certain costs incurred during the third quarter of 2013 for the settlement of legal proceedings with Xylem Group LLC, as well as the change in chief executive officer and other special non-operating items. |
Xylem reported revenue of $3,653 million for 2015, a decrease of 6.7% from $3,916 million reported in 2014.
This increase in operating margin was primarily due to reduced restructuring and realignment costs as well as incremental cost savings from continuous improvement initiatives and restructuring actions.
Partially offsetting these actions were cost inflation, unfavorable mix and unfavorable foreign exchange translation impacts.
| • | We repurchased a total of $175 million in shares under our share repurchase programs approved by our Board of Directors as part of our strategy to enhance shareholder return |
We continue to anticipate organic revenue growth in the low-to-mid single digits in 2016.
| • | Industrial was down 1% for 2015 as general industrial strength was more than offset by oil and gas declines in Canada and the United States. For 2016, we expect growth to be flat to up in the low-single-digits. This projection assumes low-single-digit growth in light industrial applications, and double-digit declines in oil and gas, and mining applications. |
| • | Public utilities increased 4% for 2015 driven by the United States recovery and continued emerging markets investments. We expect growth in mid-single-digits for 2016 as we anticipate continued growth in the United States and continued investments across emerging markets. We also anticipate that market conditions in Europe will remain stable. |
| • | Commercial experienced growth of 4% for 2015 driven by a recovering institutional building sector in the United States. We expect continued growth in the mid-single-digit range for 2016. Our expectation is that growth in the U.S. institutional building market will continue through the year, urbanization will continue to drive growth in most emerging markets and that conditions in Europe will modestly improve. |
| • | Residential markets grew 4% in 2015 with the strongest growth in the U.S. For 2016 we expect low-to-mid-single digit growth driven by continued strength in the U.S. We also expect continued low-single-digit growth in Europe. |
| • | Our agriculture markets, which is our smallest end market, declined 8% in 2015 driven by unfavorable U.S. weather conditions. We expect 2016 to grow low-single-digits as we will likely see a modest recovery from the significant weather events in 2015. |
We expect to realize approximately $8 million of savings from our 2016 actions.
| | | | | | | |
| --- | --- | --- | --- | --- | --- | --- |
The following table summarizes revenue by segment for 2015 and 2014:
| | | | | | | | | | | | | | |
| --- | --- | --- | --- | --- | --- | --- | --- | --- | --- | --- | --- | --- | --- |
| Water Infrastructure | $ | 2,231 | | | $ | 2,442 | | | (8.6 | )% | | 0.9 | % |
| Applied Water | 1,422 | | | | 1,474 | | | | (3.5 | )% | | 1.8 | % |
| Total | $ | 3,653 | | | $ | 3,916 | | | (6.7 | )% | | 1.3 | % |
The growth on a constant currency basis is driven primarily by organic revenue growth of $38 million or 2.6% due to strength in the commercial, industrial water and residential end markets, partially offset by declines in the agriculture end market.
| | | | | | | | | | | |
| --- | --- | --- | --- | --- | --- | --- | --- | --- | --- | --- |
On an adjusted basis the operating margin decreased from 14.3% to 14.2%.
On an adjusted basis the operating margin decreased from 14.0% to 13.9%.
2014 versus 2013
Revenue generated for 2014 was $3,916 million, an increase of $79 million, or 2.1%, compared to $3,837 million in 2013.
| 2013 Revenue | $ | 3,837 | | | | |
| Organic Growth | 134 | | | | 3.5 | % |
| Acquisitions/(Divestitures) | (6 | | ) | | (0.2 | )% |
| Constant Currency | 128 | | | | 3.3 | % |
| Total change in revenue | 79 | | | | 2.1 | % |
The following table summarizes revenue by segment for 2014 and 2013:
An excerpt. Shown here: 40 of 264 rewritten, 40 of 198 added and 40 of 157 removed. The counts are complete. For every sentence, read Item 7. MANAGEMENT’S DISCUSSION AND ANALYSIS OF FINANCIAL CONDITION AND RESULTS OF OPERATIONS in the FY2016 filing and the FY2015 filing.
Item 7A. . QUANTITATIVE AND QUALITATIVE DISCLOSURES ABOUT MARKET RISK
8 rewritten, 0 added, 1 removed, 22 unchanged
[removed: Foreign] [added: Foreign] Currency Exchange Rate [removed: Risk][added: Risk]
We conduct approximately [removed: 59%] [added: 58%] of our business in various locations outside the United States.
Our principal foreign currency transaction exposures primarily relate to the [removed: Euro,] Swedish Krona, [added: Polish Zloty,] Canadian Dollar, British Pound, [removed: Polish Zloty] and Australian Dollar.
We estimate that a hypothetical 10% movement of the U.S. Dollar to the various foreign currency exchange rates we translate from, in the aggregate, could have approximately a [removed: 7%] [added: 5% and 8%] impact on Xylem's consolidated revenue and [removed: income] [added: income, respectively,] as reported in U.S. Dollars.
[removed: Interest] [added: Interest] Rate [removed: Risk][added: Risk]
As of December 31, [removed: 2015,] [added: 2016,] our [added: long term] debt portfolio is primarily comprised of [removed: two] [added: four series of] fixed-rate senior notes that total [removed: $1.2] [added: $2.0] billion.
The [removed: $600 million] senior [removed: note due 2021 is] [added: notes are] not exposed to interest rate risk as the [removed: bond is] [added: bonds are] at a fixed-rate until maturity.
[removed: Commodity] [added: Commodity] Price [removed: Exposures][added: Exposures]
The other $600 million senior note will mature on September 20th, 2016, and the company intends to refinance the debt with new debt instruments.
Item 1. BUSINESS
94 rewritten, 67 added, 117 removed, 97 unchanged
[removed: Business Overview][added: Business Overview]
We have [removed: leading] [added: differentiated] market positions [removed: among equipment and service providers] in [removed: the] core application areas [removed: of the water equipment industry:] [added: including] transport, treatment, test, [added: smart metering,] building services, industrial processing and irrigation.
[removed: Our Industry][added: Our Industry]
Our planet faces [removed: a] serious water [removed: challenge.][added: challenges.]
Less than 1% of the total water available on earth is fresh water, and [removed: this percentage is declining] [added: these supplies are under threat] due to factors such as the draining of aquifers, increased pollution and [added: the effects of] climate change.
[removed: In addition, demand] [added: Demand] for fresh water is rising rapidly due to population growth, industrial expansion, and increased agricultural development, with consumption estimated to double every 20 years.
These challenges [removed: are driving] [added: create] opportunities for growth in the global water industry, which we estimate to have a total market size of approximately $550 billion.
We estimate our total served market size to be approximately [removed: $37] [added: $54] billion.
The Company’s customers often face all three of these challenges, ranging from inefficient [added: and] aging water distribution networks (which require increases in “water productivity”); energy-intensive or unreliable wastewater management systems (which require increases in “water quality”); or exposure to natural disasters such as floods or droughts (which require increases in “resilience”).
[removed: The] Utilities and EPC customers are looking for technology and application expertise from their Equipment and Services providers to address trends such as rising pollution, stricter regulations, and the increased outsourcing of process knowledge.
[removed: The end users of water consist of] [added: In addition to utilities and EPC customers, Equipment and Service providers also provide distinct technologies to] a wide array of entities, including farms, mines, power plants, industrial facilities and residential [removed: homes.][added: buildings.]
[removed: Figure 1: Water] [added: *Water] Industry Supply [removed: Chain][added: Chain*]
[removed: ][added: ]
[removed: In the Water Infrastructure sector,] [added: The customer base consists of] two primary end [removed: markets exist:] [added: markets:] public utility and industrial.
The public utility market [removed: comprises] [added: includes] public, private and public-private [removed: institutions] [added: entities] that [removed: handle] [added: support] water and wastewater [removed: for mostly residential and commercial purposes.][added: networks.]
[removed: Owners] [added: Residential consumers represent the end users in the residential market, while owners] and managers of properties such as apartment buildings, retail stores, institutional buildings, restaurants, schools, hospitals and hotels are examples of end users in the commercial market.
The industrial market [removed: is wide ranging, involving] [added: includes] OEMs, exploration and production firms, and developers and managers of [removed: facilities operated by] [added: industrial facilities, such as] electrical power generators, chemical manufacturers, machine shops, clothing manufacturers, beverage dispensing and food processing firms, and car washes.
[removed: The agricultural market] [added: Agricultural] end users [removed: are] [added: include] owners and operators of [removed: businesses such as] crop and livestock farms, aquaculture, golf courses, and other turf applications.
[removed: We believe population] [added: Population] growth, urbanization and regulatory requirements are [removed: the primary] macro [added: growth] drivers of these markets, [removed: as these trends drive] [added: driving] the need for housing, food, community services and retail goods within growing city centers.
[removed: Business Strategy][added: Business Strategy]
| [removed: •] [added: •] | [removed: Emerging Markets \-] [added: Emerging Markets *\-*] We seek to accelerate our growth in priority emerging markets through increased focus on product localization and channel development. |
| [removed: ▪] [added: ▪] | [removed: Innovation] [added: Innovation] & [removed: Technology] [added: Technology] \- We seek to enhance the Company’s innovation efforts with increased focus on technologies and innovation that can significantly improve customers’ [removed: water] productivity, quality and resilience. |
| [removed: •] [added: •] | [removed: Commercial Leadership -] [added: Commercial Leadership \-] We are strengthening our capabilities by [removed: focusing on] simplifying our commercial processes [removed: along with the] [added: and] supporting [removed: backend] information technology systems. |
| • | [removed: Mergers] [added: Mergers] and [removed: acquisitions] [added: Acquisitions] - We continue to evaluate and, where appropriate, will act upon attractive acquisition candidates to accelerate our growth, including into [removed: new] [added: adjacent] markets. |
| [removed: •] [added: •] | [removed: Drive] [added: Drive] Continuous [removed: Improvement.] [added: Improvement.] We seek to embed continuous improvement into our culture and simplify our [removed: organizational structure] [added: organization] to make the Company more agile, more [removed: profitable,] [added: profitable] and create room to [removed: re-invest] [added: reinvest] in growth. To accomplish this, we will continue to strengthen our lean six sigma and global procurement [removed: capabilities,] [added: capabilities] and continue to optimize our cost structure through business [removed: simplification by] [added: simplification,] eliminating structural, process and product complexity. |
| • | [removed: Leadership] [added: Leadership] and Talent [removed: Development.] [added: Development.] We seek to continue to invest in attracting, developing and retaining world-class talent with an increased focus on leadership and talent development programs. We will continue to align individual performance [removed: to] [added: with] the objectives of the Company and its shareholders. |
| [removed: •] [added: •] | [removed: Focus] [added: Focus] on Execution and [removed: Accountability.] [added: Accountability.] We seek to ensure the impact of these strategic focus areas by holding our people accountable and streamlining our performance management and goal deployment systems. |
We have [removed: two] [added: three] reportable business segments that are aligned [removed: with the cycle of water and] [added: around] the [removed: key strategic] [added: critical] market applications they provide: Water [removed: Infrastructure (collection, distribution, return) and] [added: Infrastructure,] Applied Water [removed: (usage).][added: and Sensus.]
| | | [removed: Market Applications] [added: Market Applications] | | [removed: 2015 Revenue (in millions)] [added: 2016 Revenue (in millions)] | | | | [removed: % Revenue] [added: % Revenue] | | | [removed: Major Products] [added: Major Products] | | [removed: Primary Brands] [added: Primary Brands] |
| [removed: Water Infrastructure] [added: Water Infrastructure] | | Transport | | $ | [removed: 1,624] [added: 1,599] | | | [removed: 73] [added: 71] | % | | • Water and wastewater pumps • Filtration, disinfection and biological treatment equipment • Test equipment • Controls | | • Flygt • Wedeco • Godwin • WTW • Sanitaire • YSI • Leopold |
| [removed: Applied Water] [added: Applied Water] | | Building Services | | $ | [removed: 774] [added: 764] | | | [removed: 54] [added: 55] | % | | • Pumps • Valves • Heat exchangers • Controls • Dispensing equipment systems | | • Goulds Water Technology • Bell & Gossett • A-C Fire Pump • Standard Xchange • Lowara • Jabsco • Flojet • Flowtronex |
| | Industrial Water | | [removed: 562] [added: 540] | | | | [removed: 40] [added: 39] | % | | | | | |
| | Irrigation | | [removed: 86] [added: 89] | | | | 6 | % | | | | | |
[removed: Water Infrastructure][added: Water Infrastructure]
[added: Our] Water Infrastructure [removed: involves] [added: segment supports] the process that collects water from a source and distributes it to users, and then returns the wastewater responsibly to the [removed: environment.][added: environment through three closely linked applications: *Transport*, *Treatment* and *Test*.]
We estimate our served market size in this sector to be approximately [removed: $21] [added: $23] billion.
[removed: Finally, the Transport] [added: The *Transport*] application also includes [added: sales and rental of specialty] dewatering [removed: pumps,] [added: pumps and related] equipment and [removed: services] [added: services,] which provide the safe removal or draining of groundwater and surface water from a riverbed, construction site or mine shaft and bypass pumping for the repair of aging public utility infrastructure, as well as emergency water removal during severe weather events.
[added: | |] Treatment [added: | | 333 | | | | 15 | % | | | | | |]
[added: | |] Test [added: | | 314 | | | | 14 | % | | | | | |]
[removed: Applied Water][added: Applied Water]
Xylem, with 2016 revenue of $3.8 billion and approximately 16,000 employees, is a leading global water technology company.
We design, manufacture and service highly engineered solutions ranging across a wide variety of critical applications.
For example, our broad portfolio of solutions addresses customer needs across the water cycle, from the delivery and use of drinking water to the collection and treatment of wastewater to the return of water to the environment.
Setting us apart is a unique set of global assets which include:
| • | Fortress brands with leading market positions, some of which have been operating for more than 100 years |
| • | Far-reaching global distribution networks consisting of direct sales forces and independent channel partners that collectively serve a diverse customer base in more than 150 countries |
| • | A substantial installed base that provides for steady recurring revenue |
| • | A strong financial position and cash generation profile that enable us to fund strategic organic and inorganic growth initiatives, and consistently return capital to shareholders |
Key tenets of our long-term strategy include (1) accelerate profitable growth; (2) increase profitability by driving continuous improvement initiatives; (3) leadership and talent development; and (4) focus on execution and accountability.
On October 31, 2016, Xylem Inc. completed the acquisition of all of the direct and indirect subsidiaries of Sensus Worldwide Limited (other than Sensus Industries) (“Sensus”), pursuant to the terms of the Share Purchase Agreement dated as of August 15, 2016, and the first Amendment to the Share Purchase Agreement dated as of October 31, 2016 (together, the “Purchase Agreement”).
The aggregate consideration paid for the acquisition was approximately $1.7 billion in cash, subject to certain adjustments as provided in the Purchase Agreement.
The consideration was funded with a combination of cash on hand, proceeds from issuances under the Company’s existing commercial paper program, borrowings under a new euro-denominated term loan and the issuance of $500 million aggregate principal amount of 3.250% Senior Notes due 2026 and $400 million aggregate principal amount of 4.375% Senior Notes due 2046.
In the United States, deteriorating pipe systems lose approximately one out of every six gallons of water between the treatment plant and the end customer part of a national (and global) problem of ‘non-revenue water’ that is a major financial challenge of many utilities.
We compete in areas that are pivotal to improving water productivity, water quality and resilience.
Additionally, through the recent acquisition of Sensus, we now also provide solutions to enhance efficiency, improve safety and conserve resources to customers in the electric and gas sectors.
*The Global Water Industry Value Chain*
The water industry value chain is comprised of Equipment and Services companies, like Xylem, which address the unique challenges and demands of a diverse customer base.
This customer base includes utilities that supply water through an infrastructure network, and engineering, procurement and construction or "EPC" firms, which work with utilities to design and build water and wastewater infrastructure networks, as depicted below.
| • | Accelerate Profitable Growth. To accelerate growth, we are focusing on several priorities: |
| | |
| --- | --- |
| | |
| --- | --- |
| | |
| --- | --- |
| | |
| --- | --- |
Business Segments, Distribution and Competitive Landscape
| | | | | $ | 2,246 | | | 100 | % | | | | |
| | | | | $ | 1,393 | | | 100 | % | | | | |
| | | | | | | | | | | | | | |
| Sensus | | Water | | $ | 74 | | | 56 | % | | • Smart meters • Networked communications software • Base stations • Regulators • Data analytics | | • Sensus • Smith Blair |
| | Electric | | 27 | | | | 20 | % | | | | | |
| | Gas | | 16 | | | | 12 | % | | | | | |
| | | Software and Services/Other | | 15 | | | | 11 | % | | | | |
| | | (a) | | $ | 132 | | | 100 | % | | | | |
| | | | | | | | | | | | | | |
| (a) | | Includes revenue from November 1, 2016 through December 31, 2016 | | | | | | | | | | | |
The industrial market includes customers who require similar water and wastewater infrastructure networks to support various industrial operations.
emerging markets.
Xylem, with 2015 revenue of $3.7 billion and approximately 12,700 employees, is a world leader in the design, manufacturing, and application of highly engineered technologies for the water industry.
We are a leading equipment and service provider for water and wastewater applications with a broad portfolio of products and services addressing the full cycle of water, from collection, distribution and use to the return of water to the environment.
Our Company’s brands, such as Bell & Gossett and Flygt, are well known throughout the industry and have served the water market for many years.
We serve a global customer base across diverse end markets while offering localized expertise.
We sell our products in approximately 150 countries through a balanced distribution network consisting of our direct sales force and independent channel partners.
In 2015, 59% of our revenue was generated outside the United States, with 21% of revenue generated in emerging markets.
In the United States, degrading pipe systems leak one out of every six gallons of water, on average, on its way from a treatment plant to the customer.
We view these challenges through the lens of water productivity, water quality and resilience.
The water industry supply chain is comprised of Equipment and Services companies, Design and Build service providers, and Utilities.
Equipment and Service providers serve distinct customer types.
The Utilities supply water through an infrastructure network.
Supply chain companies provide single, or sometimes combined, functions from equipment manufacturing and services to facility design (engineering, procurement and construction, or “EPC” firms) to plant operations (Utilities), as depicted below in Figure 1.
These customers are predominately served through specialized distributors and original equipment manufacturers (“OEMs”).
Our business focuses on the beginning of the supply chain by providing technology-intensive equipment and services.
We sell our equipment and services via direct and indirect channels that serve the needs of each customer type.
On the utility side, we provide the majority of our sales direct to customers with strong application expertise, with the remaining amount going through distribution partners.
To end users of water, we provide the majority of our sales through long-standing relationships with the world’s leading distributors, with the remainder going direct to customers.
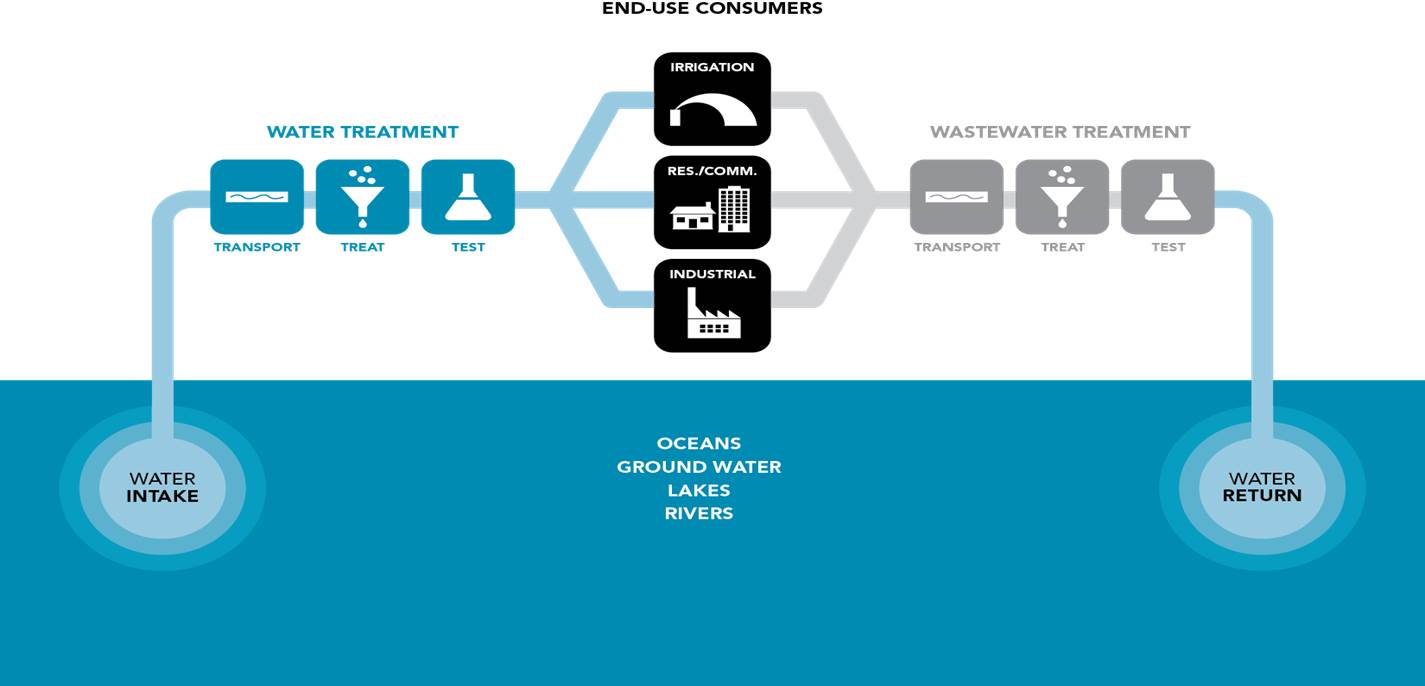
The Equipment and Services market addresses the key processes of the water industry, which are best illustrated through the cycle of water, as depicted in Figure 2, below.
We believe this industry has two distinct sectors within the cycle of water: Water Infrastructure and Usage Applications.
The key processes of this cycle begin when raw water is extracted by pumps, which provide the necessary pressure and flow, to move or transport, this water from natural sources, such as oceans, groundwater, lakes and rivers, through pipes to treatment facilities.
Treatment facilities can provide many forms of treatment, such as filtration, disinfection and desalination, to remove solids, bacteria, and salt, respectively.
Throughout each of these stages, analytical instruments test the water to ensure regulatory requirements are met so that it can be utilized by end-use customers.
A network of pipes and pumps again transports this clean water to where it is needed, such as to crops for irrigation, to power plants to provide cooling in industrial water, or to an apartment building as drinking water in residential and commercial buildings.
After usage, the wastewater is collected by a separate network of pipes and pumps and transported to a wastewater treatment facility, where processes such as digestion deactivate and reduce the volume of solids, and disinfection purifies effluent water.
Once treated, analytical instruments test the water to ensure regulatory requirements are met so that it can be discharged back to the environment, thereby completing the cycle.
Figure 2: Cycle of Water
The industrial market involves the supply of water and removal of wastewater for industrial facilities.
We view the main macro drivers of this sector to be water quality, the desire for energy-efficient products, water scarcity, regulatory requirements and infrastructure needs, for both the repair of aging systems in developed countries as well as new installations in emerging markets.
In the Usage Applications sector, end-use customers fall into four main markets: residential, commercial, industrial and agricultural.
Homeowners represent the end users in the residential market.
Water reuse and conservation are driving the need for new technologies.
| • | Accelerate Profitable Growth. To achieve our goal of accelerating growth, we have identified the following five priorities: |
Business Segments
| | Treatment | | 316 | | | | 14 | % | | | | | |
| | Test | | 291 | | | | 13 | % | | | | | |
| | | | | $ | 2,231 | | | 100 | % | | | | |
| | | | | $ | 1,422 | | | 100 | % | | | | |
Within the Water Infrastructure segment, our pump systems transport water from oceans, groundwater, aquifers, lakes, rivers and seas.
From there, our filtration, ultraviolet ("UV") and ozone systems provide treatment, making the water fit for use.
An excerpt. Shown here: 40 of 94 rewritten, 40 of 67 added and 40 of 117 removed. The counts are complete. For every sentence, read Item 1. BUSINESS in the FY2016 filing and the FY2015 filing.
Item 3. LEGAL PROCEEDINGS
3 rewritten, 0 added, 0 removed, 0 unchanged
From time to [removed: time,] [added: time] we are involved in legal proceedings that are incidental to the operation of our businesses.
[removed: Some of these] [added: These] proceedings [added: may] seek remedies relating to environmental matters, intellectual property matters, [added: acquisitions or divestitures,] personal injury claims, employment and pension matters, government contract issues and commercial or contractual [removed: disputes, sometimes related to acquisitions or divestitures.][added: disputes.]
See Note 18, "Commitments and Contingencies", of the consolidated financial statements included in Item 8 of Part II of this 10-K for information regarding certain legal proceedings [removed: in which] we are [removed: involved.][added: involved in.]
Cover and table of contents
60 rewritten, 8 added, 6 removed, 50 unchanged
[removed: UNITED] [added: UNITED] STATES SECURITIES AND EXCHANGE [removed: COMMISSION][added: COMMISSION]
[removed: WASHINGTON,] [added: WASHINGTON,] D.C. [removed: 20549][added: 20549]
[removed: FORM 10-K][added: FORM 10-K]
| þ | | [removed: ANNUAL] [added: ANNUAL] REPORT PURSUANT TO SECTION 13 OR 15(d) OF [removed: THE SECURITIES] [added: THE SECURITIES] EXCHANGE ACT OF [removed: 1934] [added: 1934] | | |
| | | [removed: For] [added: For] the fiscal year ended December 31, [removed: 2015] [added: 2016] | | |
| ¨ | | [removed: TRANSITION] [added: TRANSITION] REPORT PURSUANT TO SECTION 13 OR 15(d) OF [removed: THE SECURITIES] [added: THE SECURITIES] EXCHANGE ACT OF [removed: 1934] [added: 1934] | | |
[removed: For] [added: For] the transition period from [removed: to][added: to]
[removed: Commission] [added: Commission] file number: [removed: 1-35229][added: 1-35229]
[removed: Xylem Inc.][added: Xylem Inc.]
[removed: (Exact] [added: *(Exact] name of registrant as specified in its [removed: charter)][added: charter)*]
| [removed: Indiana] [added: Indiana] | | [removed: 45-2080495] [added: 45-2080495] |
| [removed: (State] [added: *(State] or other jurisdiction of incorporation [removed: or organization)] [added: or* *organization)*] | | [removed: (I.R.S.] [added: *(I.R.S.] Employer Identification [removed: No.)] [added: No.)*] |
| [removed: 1] [added: 1] International Drive, Rye Brook, NY [removed: 10573] [added: 10573] | | |
| [removed: (address] [added: *(address] of principal executive offices and zip [removed: code)] [added: code)*] | | |
| [removed: (914) 323-5700] [added: (914) 323-5700] | | |
| [removed: (Registrant's] [added: *(Registrant's] telephone number, including area [removed: code)] [added: code)*] | | |
| [removed: Securities] [added: Securities] registered pursuant to Section 12(b) of the [removed: Act:] [added: Act:] | | |
| [removed: Title] [added: Title] of each [removed: class] [added: class] | | [removed: Name] [added: Name] of each exchange on which [removed: registered] [added: registered] |
| [removed: Securities] [added: Securities] registered pursuant to Section 12(g) of the Act: [removed: None] [added: None] | | |
The aggregate market value of the common stock of the registrant held by non-affiliates of the registrant as of June 30, [removed: 2015] [added: 2016] was approximately [removed: $6.7] [added: $8.0] billion.
As of [removed: January 29, 2016,] [added: February 17, 2017,] there were [removed: 178,485,808] [added: 179,471,405] outstanding shares of the registrant’s common stock, par value $0.01 per share.
[removed: DOCUMENTS] [added: DOCUMENTS] INCORPORATED BY [removed: REFERENCE][added: REFERENCE]
Portions of the registrant’s definitive proxy statement for its [removed: 2016] [added: 2017] Annual Meeting of Shareowners, to be held in May [removed: 2016,] [added: 2017,] are incorporated by reference into Part II and Part III of this Report.
[removed: ANNUAL] [added: ANNUAL] REPORT ON FORM [removed: 10-K][added: 10-K]
[removed: For] [added: For] the fiscal year [removed: ended December] [added: ended December] 31, [removed: 2015][added: 2016]
[removed: Table] [added: Table] of [removed: Contents][added: Contents]
| [removed: ITEM] [added: ITEM] | | [removed: PAGE] [added: PAGE] |
| [removed: PART I] [added: PART I] | | |
| 1A. | [Risk [removed: Factors](#s9A5090DBF01F5A1B858A2562DA528236)] [added: Factors](#s0725F590AFBD50E5A4323B411E9E50D8)] | [removed: [13](#s9A5090DBF01F5A1B858A2562DA528236)] [added: [11](#s0725F590AFBD50E5A4323B411E9E50D8)] |
| 1B. | [Unresolved Staff [removed: Comments](#s0A0D3FFB017753ACAC33CE042A3C908C)] [added: Comments](#s5BE846C5F6F855DCBB21B00E3AEB23C2)] | [removed: [20](#s0A0D3FFB017753ACAC33CE042A3C908C)] [added: [19](#s5BE846C5F6F855DCBB21B00E3AEB23C2)] |
| 3 | [Legal [removed: Proceedings](#s6BAA6655C4D759A1B089D1F757904C03)] [added: Proceedings](#s8AAC03A68C225B149C322BF2C4205F4E)] | [removed: [21](#s6BAA6655C4D759A1B089D1F757904C03)] [added: [20](#s8AAC03A68C225B149C322BF2C4205F4E)] |
| 4 | [Mine Safety [removed: Disclosures](#sB0503465DA9E5817B6FDC004D9CF84D6)] [added: Disclosures](#s585A48DA7C685D27AF8A12D3150BA17E)] | [removed: [21](#sB0503465DA9E5817B6FDC004D9CF84D6)] [added: [20](#s585A48DA7C685D27AF8A12D3150BA17E)] |
| * | [Executive Officers of the [removed: Registrant](#s0400244AFAFF5A409E5EE3D5645F7A44)] [added: Registrant](#sD93CA615A75E52A1997F31445F3FEEA0)] | [removed: [22](#s0400244AFAFF5A409E5EE3D5645F7A44)] [added: [21](#sD93CA615A75E52A1997F31445F3FEEA0)] |
| | [Board of [removed: Directors](#s8E463A9769235A439305ACF6A1D7D5DB)] [added: Directors](#s35583B92E0315C6C87CA0264E87388F8)] | [removed: [23](#s8E463A9769235A439305ACF6A1D7D5DB)] [added: [22](#s35583B92E0315C6C87CA0264E87388F8)] |
| [removed: PART II] [added: PART II] | | |
| 5 | [Market for the Registrant’s Common Equity, Related Stockholder Matters and Issuer Purchases of Equity [removed: Securities](#s140D489EFC7B51209EE0AEC3C8992ED0)] [added: Securities](#s6C7725A5E6F850F2B46BBAEC3E7D2780)] | [removed: [24](#s140D489EFC7B51209EE0AEC3C8992ED0)] [added: [23](#s6C7725A5E6F850F2B46BBAEC3E7D2780)] |
| 6 | [Selected Financial [removed: Data](#sF98D2B8F98045F09B6E541853051F349)] [added: Data](#s110AAE32701C58F49AF8A70318CC466D)] | [removed: [27](#sF98D2B8F98045F09B6E541853051F349)] [added: [26](#s110AAE32701C58F49AF8A70318CC466D)] |
| 7 | [Management’s Discussion and Analysis of Financial Condition and Results of [removed: Operations](#sD0FCEB34A08E5E0997C40E60743D4798)] [added: Operations](#s6B62D338A4DB569BA80520AB1C8018B3)] | [removed: [28](#sD0FCEB34A08E5E0997C40E60743D4798)] [added: [27](#s6B62D338A4DB569BA80520AB1C8018B3)] |
| 7A. | [Quantitative and Qualitative Disclosures About Market [removed: Risk](#s5B19077265A35F60992FEFA593805C1B)] [added: Risk](#s23E731F7852A5155BE0788F7305C62D0)] | [removed: [48](#s5B19077265A35F60992FEFA593805C1B)] [added: [47](#s23E731F7852A5155BE0788F7305C62D0)] |
| 8 | [Financial Statements and Supplementary [removed: Data](#sFDB9FFBDE13C5E0EB4F7F791EDE67460)] [added: Data](#s90EA7243E5D7583EA0D31B4DE1E2AF1C)] | [removed: [49](#sFDB9FFBDE13C5E0EB4F7F791EDE67460)] [added: [48](#s90EA7243E5D7583EA0D31B4DE1E2AF1C)] |
| | | or | | |
| 2.250% Senior Notes due 2023 | | New York Stock Exchange |
Xylem Inc.
| 1 | [Business](#s4FD81B86532353F19E25835E87165D36) | [3](#s4FD81B86532353F19E25835E87165D36) |
| 2 | [Properties](#s3C7627A725D55B849E7EAA57A34CD9A2) | [20](#s3C7627A725D55B849E7EAA57A34CD9A2) |
| 16 | [Form 10-K Summary](#s2a5c0d89d4bc4fc999dfd303d0f5de62) | [99](#s2a5c0d89d4bc4fc999dfd303d0f5de62) |
| | [Signatures](#s7A832C6CA56C586B8A41F50765771F61) | [100](#s7A832C6CA56C586B8A41F50765771F61) |
| | [Exhibit Index](#s87149CD36DA0522AA67926931D58FB2D) | [101](#s87149CD36DA0522AA67926931D58FB2D) |
10-K 1 xyl1231201510k.htm 10-K
| | | or | | |
| 1 | [Business](#s12AC2E34DBD95292BF475BAFFFD83D76) | [3](#s12AC2E34DBD95292BF475BAFFFD83D76) |
| 2 | [Properties](#sEFA78EDD170651BC946E47F3B98FA6FB) | [21](#sEFA78EDD170651BC946E47F3B98FA6FB) |
| [Signatures](#sC5D829A4A7535B269A1728B9F431CEF4) | | [99](#sC5D829A4A7535B269A1728B9F431CEF4) |
| [Exhibit Index](#s6B7EEC3169E15DCB8CD6DFE21417AFEA) | | [100](#s6B7EEC3169E15DCB8CD6DFE21417AFEA) |
An excerpt. Shown here: 40 of 60 rewritten, all 8 added and all 6 removed. The counts are complete. For every sentence, read Cover and table of contents in the FY2016 filing and the FY2015 filing.
Item 2. PROPERTIES
12 rewritten, 12 added, 0 removed, 12 unchanged
We have approximately [removed: 350] [added: 380] locations in more than [removed: 40] [added: 48] countries.
These properties total approximately [removed: 10.2] [added: 12.7] million square feet, of which more than 300 locations, or approximately [removed: 5.5] [added: 6.6] million square feet, are leased.
The following table shows [removed: the] [added: our] significant locations by segment:
| [removed: Location] [added: Location] | | [removed: State or Country] [added: State or Country] | | [removed: Principal] [added: Principal] Business [removed: Activity] [added: Activity] | | [removed: Approx. Square Feet] [added: Approx. Square Feet] | | | [removed: Owned or Expiration Date of Lease] [added: Owned or Expiration Date of Lease] |
| [removed: Water Infrastructure] [added: Water Infrastructure] | | | | | | | | | |
| Emmaboda | | Sweden | | Administration and Manufacturing | | [removed: 1,194,000] [added: 1,197,000] | | | Owned |
| Stockholm | | Sweden | | Administration and Research & Development | | 172,000 | | | [removed: 2019] [added: Leased] |
| Bridgeport | | NJ | | Administration and Manufacturing | | 136,000 | | | [removed: 2020] [added: Leased] |
| Quenington | | UK | | Manufacturing | | 86,000 | | | [removed: 2020] [added: Leased] |
| [removed: Applied Water] [added: Applied Water] | | | | | | | | | |
| [removed: Corporate Headquarters] [added: Corporate Headquarters] | | | | | | | | | |
| Rye Brook | | NY | | Administration | | 67,000 | | | [removed: 2023] [added: Leased] |
| Sensus | | | | | | | | | |
| Ludwigshafen | | Germany | | Manufacturing | | 318,000 | | | Owned |
| Jiangdu City | | China | | Manufacturing | | 316,000 | | | Owned |
| Texarkana | | AR | | Manufacturing | | 254,000 | | | Owned |
| Uniontown | | PA | | Manufacturing | | 240,000 | | | Leased |
| DuBois | | PA | | Manufacturing | | 197,000 | | | Owned |
| DuBois | | PA | | Manufacturing | | 137,000 | | | Leased |
| Regional Selling Locations | | | | | | | | | |
| Dubai | | United Arab Emirates | | Manufacturing | | 144,000 | | | Owned |
| Nottinghamshire | | United Kingdom | | Sales Office | | 139,000 | | | Leased |
| Nanterre | | France | | Sales Office | | 139,000 | | | Leased |
| Langenhagen | | Germany | | Sales Office | | 134,000 | | | Leased |
Item 4. MINE SAFETY DISCLOSURES
15 rewritten, 5 added, 2 removed, 37 unchanged
[removed: EXECUTIVE] [added: EXECUTIVE] OFFICERS OF THE [removed: REGISTRANT][added: REGISTRANT]
The following information is provided regarding the executive officers of Xylem as of February 1, [removed: 2016:][added: 2017:]
| [removed: NAME] [added: NAME] | | [removed: AGE] [added: AGE] | | [removed: CURRENT TITLE] [added: CURRENT TITLE] | | [removed: OTHER] [added: OTHER] BUSINESS EXPERIENCE DURING PAST 5 [removed: YEARS] [added: YEARS] |
| Patrick K. Decker | | [removed: 51] [added: 52] | | President and Chief Executive Officer (2014) | | • President and Chief Executive Officer, Harsco Corp. (diversified, worldwide industrial company) (2012) • President, Flow Control Segment, Tyco International Ltd. (industrial products and services company) (2003) |
| Tomas Brannemo | | [removed: 46] [added: 45] | | Senior VP and President, Transport (2014) | | • VP, Transport (2013) • VP and Director of Business Unit Aftermarket and Service (2010) |
| David Flinton | | [removed: 45] [added: 46] | | Senior VP and President, Dewatering (2015) | | • VP, Engineering and Marketing, Applied Water Systems (2013) • VP, Global Product Management, Applied Water Systems (2012) • VP, Strategy and Integrated Management System (former Water Solutions division) (2010) |
| Pak Steven Leung | | [removed: 55] [added: 60] | | Senior VP and President, Emerging Markets (2015) | | • VP, Global Sales, Valves and Controls, Pentair Plc (diversified, worldwide industrial manufacturing company) (2013) • VP and General Manager, Global Process, Tyco International Ltd. (industrial products and services company) (2010) |
| Kenneth Napolitano | | [removed: 53] [added: 54] | | Senior VP and President, Applied Water Systems (2012) | | • Senior VP and President, Residential and Commercial Water (2011) [removed: • President, Residential and Commercial Water (2009)] |
| Colin R. Sabol | | [removed: 48] [added: 49] | | Senior VP and President, Analytics and Treatment (2015) | | • Senior VP and President, Dewatering (2013) • Senior VP and Chief Strategy and Growth Officer (2011) |
| Kairus Tarapore | | [removed: 54] [added: 55] | | Senior VP and Chief Human Resources Officer (2015) | | • Senior VP and Chief Administrative Officer, Babcock & Wilcox Company [added: (energy and environmental technologies and services)] (2013) • Executive VP, Human Resources, Ceridian Corporation (2006) |
| Claudia S. Toussaint | | [removed: 52] [added: 53] | | Senior VP, General Counsel and Corporate Secretary (2014) | | • Senior VP, General Counsel and Secretary, Barnes Group Inc. (international industrial and aerospace manufacturing) (2012) • General Counsel, Flow Control Segment, Tyco International Ltd. (industrial products and services company) (2012) • Senior VP, General Counsel and Secretary, Barnes Group Inc. (international industrial and aerospace manufacturing) (2010) |
[removed: BOARD] [added: BOARD] OF [removed: DIRECTORS][added: DIRECTORS]
The following information is provided regarding the Board of Directors of [removed: Xylem:][added: Xylem as of February 1, 2017:]
| [removed: NAME] [added: NAME] | | [removed: TITLE] [added: TITLE] |
[removed: PART II][added: PART II]
Not applicable.
| E. Mark Rajkowski | | 58 | | Senior VP and Chief Financial Office (2016) | | • Senior VP and Chief Financial Officer, MeadWestvaco Corp. (worldwide packaging company) (2004) |
| D. Randall Bays | | 61 | | Senior VP and President, Sensus (2016) | | • President, Sensus (worldwide smart meter company) (2013) • President and Chief Executive Officer, Kinetek Inc. (diversified, worldwide industrial company) (2004) |
| NAME | | AGE | | CURRENT TITLE | | OTHER BUSINESS EXPERIENCE DURING PAST 5 YEARS |
| | | | | | | |
None.
| Shashank Patel | | 55 | | Interim Chief Financial Officer (2015) | | • VP, Finance, Applied Water Systems (2010) |
Item 5. MARKET FOR THE REGISTRANT’S COMMON EQUITY, RELATED STOCKHOLDER MATTERS AND ISSUER PURCHASES OF EQUITY SECURITIES
23 rewritten, 11 added, 12 removed, 26 unchanged
[removed: 2015 and 2014 Market] [added: *2016* *and* *2015* *Market] Price and [removed: Dividends][added: Dividends*]
| | [removed: High] [added: High] | | | | [removed: Low] [added: Low] | | | | [removed: Dividend] [added: Dividend] | | |
| [removed: Fiscal] [added: Fiscal] Year ended December 31, [removed: 2015] [added: 2015] | | | | | | | | | | | |
| [removed: Fiscal] [added: Fiscal] Year ended December 31, [removed: 2014] [added: 2016] | | | | | | | | | | | |
The closing price of our common stock on the NYSE on January [removed: 29, 2016] [added: 31, 2017] was [removed: $35.95] [added: $49.31] per share.
As of January [removed: 29, 2016,] [added: 31, 2017,] there were [removed: 13,784] [added: 12,632] holders of record of our common stock.
In the first quarter of [removed: 2016,] [added: 2017,] we declared a dividend of [removed: $0.1549] [added: $0.18] per share to be paid on March [removed: 16, 2016] [added: 15, 2017] for shareholders of record on February [removed: 18, 2016.][added: 16, 2017.]
There [removed: have been] [added: were] no unregistered offerings of our common stock during [removed: 2015.][added: 2016.]
[removed: Fourth Quarter 2015 Share] [added: *Fourth Quarter* *2016* *Share] Repurchase [removed: Activity][added: Activity*]
The following table summarizes our purchases of our common stock for the quarter ended December 31, [removed: 2015:][added: 2016:]
| [removed: Period] [added: Period] | | [removed: Total] [added: Total] Number of Shares [removed: Purchased] [added: Purchased] | | [removed: Average] [added: Average] Price Paid per Share [removed: (a)] [added: (a)] | | [removed: Total] [added: Total] Number of Shares Purchased as Part of Publicly Announced Plans or Programs [removed: (b)] [added: (b)] | | [removed: Approximate] [added: Approximate] Dollar Value of Shares That May Yet Be Purchased Under the Plans or Programs [removed: (b)] [added: (b)] |
| (b) | On August 24, 2015, our Board of Directors authorized the repurchase of up to $500 million in shares with no expiration date. The program's objective is to deploy our capital in a manner that benefits our shareholders and maintains our focus on growth. [removed: During] [added: There were no shares repurchased under this program during] the three months ended December 31, [removed: 2015, we repurchased 1.4 million shares for $50 million.] [added: 2016.] There are up to $420 million in shares that may still be purchased under this plan as of December 31, [removed: 2015.] [added: 2016.] |
There were no shares purchased under this program during the three months ended December 31, [removed: 2015] [added: 2016] and there are 0.3 million shares (approximately [removed: $9] [added: $12] million based on the closing share price on December 31, [removed: 2015)] [added: 2016)] that may still be purchased under this plan.
[removed: PERFORMANCE GRAPH][added: PERFORMANCE GRAPH]
[removed: CUMULATIVE] [added: CUMULATIVE] TOTAL [removed: RETURN][added: RETURN]
This graph covers the period from [removed: October 13,] [added: December 31,] 2011 [removed: (the first day our common stock began “when-issued” trading on the NYSE)] through December 31, [removed: 2015.][added: 2016.]
[removed: ][added: 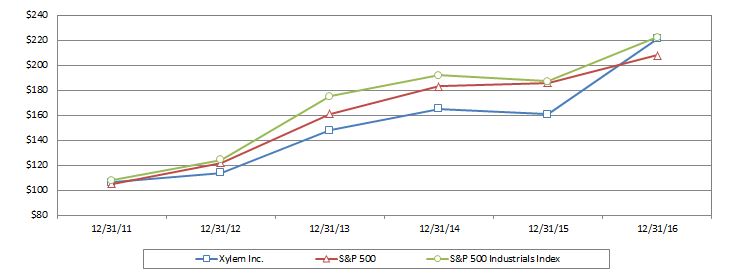]
| | [removed: XYL | | |] [added: XYL] | [removed: S&P 500] | | [added: S&P 500] | | [removed: S&P 500 Industrials Index] | [added: S&P 500 Industrials Index] | |
| December 31, 2011 | 106 | | | [removed: |] 105 | | | [removed: |] 108 | | [removed: |]
| December 31, 2012 | 114 | | | [removed: |] 121 | | | [removed: |] 124 | | [removed: |]
| December 31, 2013 | 148 | | | [removed: |] 161 | | | [removed: |] 175 | | [removed: |]
| December 31, 2014 | 165 | | | [removed: |] 183 | | | [removed: |] 192 | | [removed: |]
| December 31, 2015 | 161 | | | [removed: |] 186 | | | [removed: |] 187 | | [removed: |]
| First Quarter | $ | 41.33 | | | $ | 31.67 | | | $ | 0.1549 | |
| Second Quarter | 46.67 | | | | 40.54 | | | | 0.1549 | | |
| Third Quarter | 52.71 | | | | 44.44 | | | | 0.1549 | | |
| Fourth Quarter | 54.99 | | | | 45.60 | | | | 0.1549 | | |
| 10/1/16 - 10/31/16 | | — | | — | | — | | $432 |
| 11/1/16 - 11/30/16 | | — | | — | | — | | $433 |
| 12/1/16 - 12/31/16 | | — | | — | | — | | $432 |
| | | | | | | | | |
| --- | --- | --- | --- | --- | --- | --- | --- | --- |
| | | | | | | | | |
| December 31, 2016 | 221 | | | 208 | | | 222 | |
| | | | | | | | | | | | |
| --- | --- | --- | --- | --- | --- | --- | --- | --- | --- | --- | --- |
| First Quarter | $ | 39.79 | | | $ | 32.62 | | | $ | 0.1280 | |
| Second Quarter | 40.00 | | | | 34.50 | | | | 0.1280 | | |
| Third Quarter | 39.43 | | | | 34.77 | | | | 0.1280 | | |
| Fourth Quarter | 39.23 | | | | 31.80 | | | | 0.1280 | | |
| 10/1/15 - 10/31/15 | | — | | — | | — | | $479 |
| 11/1/15 - 11/30/15 | | 0.7 | | 36.80 | | 0.7 | | $454 |
| 12/1/15 - 12/31/15 | | 0.7 | | 36.71 | | 0.7 | | $429 |
Our common stock began “regular-way” trading following the Spin-off on November 1, 2011.
| October 13, 2011 | $ | 100 | | | $ | 100 | | | $ | 100 | |
| October 31, 2011 | 110 | | | | 104 | | | | 106 | | |
Item 6. SELECTED FINANCIAL DATA
21 rewritten, 1 added, 9 removed, 10 unchanged
The following table sets forth selected consolidated financial data for the five years ended December 31, [removed: 2015.][added: 2016.]
| | [removed: Year Ended December 31,] [added: Year Ended December 31,] | | | | | | | | | | | | | | | | | | |
| (in millions, except per share data) | [removed: 2015] [added: 2016 (a)] | | | | [removed: 2014] [added: 2015] | | | | [removed: 2013] [added: 2014] | | | | [removed: 2012] [added: 2013] | | | | [removed: 2011 (a)] [added: 2012] | | |
| [removed: Results] [added: Results] of Operations [removed: Data:] [added: Data:] | | | | | | | | | | | | | | | | | | | |
| Revenue | [removed: $] [added: $] | [removed: 3,653] [added: 3,771] | | | $ | [removed: 3,916] [added: 3,653] | | | $ | [removed: 3,837] [added: 3,916] | | | $ | [removed: 3,791] [added: 3,837] | | | $ | [removed: 3,803] [added: 3,791] | |
| Gross profit | [removed: 1,404] [added: 1,461] | | | | [removed: 1,513] [added: 1,404] | | | | [removed: 1,499] [added: 1,513] | | | | [removed: 1,502] [added: 1,499] | | | | [removed: 1,461] [added: 1,502] | | |
| [removed: Gross margin] [added: *Gross margin*] | [removed: 38.4] [added: 38.7] | | [removed: %] [added: %] | | [removed: 38.6] [added: *38.4*] | | [removed: %] [added: *%*] | | [removed: 39.1] [added: *38.6*] | | [removed: %] [added: *%*] | | [removed: 39.6] [added: *39.1*] | | [removed: %] [added: *%*] | | [removed: 38.4] [added: *39.6*] | | [removed: %] [added: *%*] |
| Operating income | [removed: 449] [added: 406] | | | | [removed: 463] [added: 449] | | | | [removed: 363] [added: 463] | | | | [removed: 443] [added: 363] | | | | [removed: 395] [added: 443] | | |
| [removed: Operating margin] [added: *Operating margin*] | [removed: 12.3] [added: 10.8] | | [removed: %] [added: %] | | [removed: 11.8] [added: *12.3*] | | [removed: %] [added: *%*] | | [removed: 9.5] [added: *11.8*] | | [removed: %] [added: *%*] | | [removed: 11.7] [added: *9.5*] | | [removed: %] [added: *%*] | | [removed: 10.4] [added: *11.7*] | | [removed: %] [added: *%*] |
| Net income | [removed: 340] [added: 260] | | | | [removed: 337] [added: 340] | | | | [removed: 228] [added: 337] | | | | [removed: 297] [added: 228] | | | | [removed: 279] [added: 297] | | |
| [removed: Per] [added: Per] Share [removed: Data:] [added: Data:] | | | | | | | | | | | | | | | | | | | |
| Basic | [removed: $] [added: $] | [removed: 1.88] [added: 1.45] | | | $ | [removed: 1.84] [added: 1.88] | | | $ | [removed: 1.23] [added: 1.84] | | | $ | [removed: 1.60] [added: 1.23] | | | $ | [removed: 1.51] [added: 1.60] | |
| Diluted | [removed: 1.87] [added: 1.45] | | | | [removed: 1.83] [added: 1.87] | | | | [removed: 1.22] [added: 1.83] | | | | [removed: 1.59] [added: 1.22] | | | | [removed: 1.50] [added: 1.59] | | |
| Basic shares outstanding | [removed: 180.9] [added: 179.1] | | | | [removed: 183.1] [added: 180.9] | | | | [removed: 185.2] [added: 183.1] | | | | [removed: 185.8] [added: 185.2] | | | | [removed: 185.1] [added: 185.8] | | |
| Diluted shares outstanding | [removed: 181.7] [added: 180.0] | | | | [removed: 184.2] [added: 181.7] | | | | [removed: 186.0] [added: 184.2] | | | | [removed: 186.2] [added: 186.0] | | | | [removed: 185.3] [added: 186.2] | | |
| Cash dividends per share | [removed: $] [added: $] | [removed: 0.5632] [added: 0.6196] | | | $ | [removed: 0.5120] [added: 0.5632] | | | $ | [removed: 0.4656] [added: 0.5120] | | | $ | [removed: 0.4048] [added: 0.4656] | | | $ | [removed: 0.1012] [added: 0.4048] | |
| [removed: Balance] [added: Balance] Sheet Data (at period [removed: end):] [added: end):] | | | | | | | | | | | | | | | | | | | |
| Cash and cash equivalents | [removed: $] [added: $] | [removed: 680] [added: 308] | | | $ | [removed: 663] [added: 680] | | | $ | [removed: 533] [added: 663] | | | $ | [removed: 504] [added: 533] | | | $ | [removed: 318] [added: 504] | |
| Working capital* | [removed: 810] [added: 878] | | | | [removed: 882] [added: 810] | | | | [removed: 930] [added: 882] | | | | [removed: 859] [added: 930] | | | | [removed: 834] [added: 859] | | |
| Total assets [removed: (b)(c)] | [removed: 4,657] [added: 6,474] | | | | [removed: 4,833] [added: 4,657] | | | | [removed: 4,857] [added: 4,833] | | | | [removed: 4,639] [added: 4,857] | | | | [removed: 4,350] [added: 4,639] | | |
| Total debt [removed: (b)] | [removed: 1,274] [added: 2,368] | | | | [removed: 1,284] [added: 1,274] | | | | [removed: 1,235] [added: 1,284] | | | | [removed: 1,197] [added: 1,235] | | | | 1,197 | | |
| (a) | The amounts for the year ended December 31, 2016 reflect the acquisition of Sensus. Refer to Notes 3 and 20 to Consolidated Financial Statements for further information regarding Sensus. |
On and prior to the Distribution Date, our financial position and results of operations consisted of WaterCo, the water equipment and services businesses of ITT Corporation.
The Spin-off was completed pursuant to the Distribution Agreement among ITT, Exelis Inc., acquired by Harris Inc. on May 29, 2015, and Xylem.
Xylem's financial position and results of operations have been derived from ITT’s historical accounting records and are presented on a carve-out basis through the Distribution Date, while our financial results for Xylem post Spin-off are prepared on a stand-alone basis.
Further, financial information for the twelve months ended December 31, 2011 consists of the consolidated results of Xylem on a stand-alone basis for the two months of November and December and the combined results of operations of WaterCo for the first ten months on a carve-out basis.
| | |
| --- | --- |
| (a) | In 2011, we acquired YSI Incorporated, which contributed revenue of $35 million in 2011 and $371 million of total assets on date of acquisition. |
| (b) | Debt issuance costs of $6 million, $8 million and $9 million in 2013, 2012 and 2011, respectively, were reclassified to long-term debt from other non-current assets within the Consolidated Balance Sheet. See Note 2, “Recently Issued Accounting Pronouncements,” of the consolidated financial statements. |
| (c) | Deferred tax assets of $33 million, $32 million and $41 million in 2013, 2012 and 2011, respectively, were reclassified to deferred tax liabilities within the Consolidated Balance Sheet. See Note 2, “Recently Issued Accounting Pronouncements,” of the consolidated financial statements. |
Item 8. FINANCIAL STATEMENTS AND SUPPLEMENTARY DATA
779 rewritten, 396 added, 190 removed, 682 unchanged
[removed: INDEX] [added: INDEX] TO CONSOLIDATED FINANCIAL [removed: STATEMENTS][added: STATEMENTS]
[removed: | [Report of Independent Registered Public Accounting Firm](#s91D5602986475BD4B324D1059D085E9B) | [50](#s91D5602986475BD4B324D1059D085E9B) |][added: REPORT OF INDEPENDENT REGISTERED PUBLIC ACCOUNTING FIRM]
| [Consolidated Income Statements for the Years Ended December 31, [removed: 2015, 2014] [added: 2016, 2015] and [removed: 2013](#sA89D080F9B255BBFA2BC0FACD55ACB99)] [added: 2014](#s34FCFFFD30685C969E807A1823193568)] | [removed: [51](#sA89D080F9B255BBFA2BC0FACD55ACB99)] [added: [50](#s34FCFFFD30685C969E807A1823193568)] |
| [Consolidated Statements of Comprehensive Income for the Years Ended December 31, [removed: 2015, 2014] [added: 2016, 2015] and [removed: 2013](#sC10A79A379975BE7A51A9AF5E5E09A63)] [added: 2014](#s34F91FC2A7EB573C808CFF6AD74C96E9)] | [removed: [52](#sC10A79A379975BE7A51A9AF5E5E09A63)] [added: [51](#s34F91FC2A7EB573C808CFF6AD74C96E9)] |
| [Consolidated Balance Sheets as of December 31, [removed: 2015] [added: 2016] and [removed: 2014](#s0F3CC981EAF55B90B52EDB27B0021B23)] [added: 2015](#s640AB909468F5ED0A105C0C290DB22FF)] | [removed: [53](#s0F3CC981EAF55B90B52EDB27B0021B23)] [added: [52](#s640AB909468F5ED0A105C0C290DB22FF)] |
| [Consolidated Statements of Cash Flows for the Years Ended December 31, [removed: 2015, 2014] [added: 2016, 2015] and [removed: 2013](#s3471C72E66DD5B54B98929BD95F46FAE)] [added: 2014](#s416B9B906AC15CF69383DCFF5EB078C8)] | [removed: [54](#s3471C72E66DD5B54B98929BD95F46FAE)] [added: [53](#s416B9B906AC15CF69383DCFF5EB078C8)] |
| [Consolidated Statements of Changes in Stockholders’ Equity for the Years Ended December 31, [removed: 2015, 2014] [added: 2016, 2015] and [removed: 2013](#s954F32C46B315AAE8CB509E8CB1CA83A)] [added: 2014](#s8EA38DEABF435B93B0AFC9696D9768AE)] | [removed: [55](#s954F32C46B315AAE8CB509E8CB1CA83A)] [added: [54](#s8EA38DEABF435B93B0AFC9696D9768AE)] |
| [Note 1 Summary of Significant Accounting [removed: Policies](#s877E537381675195A91234F6743F1D7A)] [added: Policies](#sDFACBC5A67C55F16BAA23F9623CF559E)] | [removed: [56](#s877E537381675195A91234F6743F1D7A)] [added: [55](#sDFACBC5A67C55F16BAA23F9623CF559E)] |
| [Note 2 Recently Issued Accounting [removed: Pronouncements](#s1EE23E12067D5205B1E8483FBDB34A17)] [added: Pronouncements](#s481CE855D6785211A9B5959639530DB4)] | [removed: [62](#s1EE23E12067D5205B1E8483FBDB34A17)] [added: [61](#s481CE855D6785211A9B5959639530DB4)] |
| [Note 3 Acquisitions and [removed: Divestitures](#s874209948E105D89BDE793534446F71C)] [added: Divestitures](#sBA81A5D9113A556F9D4085598F94E13D)] | [removed: [64](#s874209948E105D89BDE793534446F71C)] [added: [63](#sBA81A5D9113A556F9D4085598F94E13D)] |
| [Note 4 Restructuring and Asset Impairment [removed: Charges](#sF2AB7A4F7D2559B2B0B5FF7C51131614)] [added: Charges](#sC28810EE892E5DFF9DB6B4AF90B1A538)] | [removed: [65](#sF2AB7A4F7D2559B2B0B5FF7C51131614)] [added: [66](#sC28810EE892E5DFF9DB6B4AF90B1A538)] |
| [Note 5 Other Non-Operating Income, [removed: Net](#s78987BBFC95C5600A1B259E92B4600A6)] [added: Net](#sE4BDF3D43D145509A95CCD79E9144A60)] | [removed: [67](#s78987BBFC95C5600A1B259E92B4600A6)] [added: [68](#sE4BDF3D43D145509A95CCD79E9144A60)] |
| [Note 6 Income [removed: Taxes](#sC6D9AB2D60FF553D83F06588A6CD6270)] [added: Taxes](#s86B88437A22E5BD6BFE4D6EEFC8CEC9E)] | [removed: [67](#sC6D9AB2D60FF553D83F06588A6CD6270)] [added: [68](#s86B88437A22E5BD6BFE4D6EEFC8CEC9E)] |
| [Note 7 Earnings Per [removed: Share](#s21FDEC03E19452EC9E22D5620498C0DB)] [added: Share](#sCF67D5CA246851E7A49A4B0072831536)] | [removed: [70](#s21FDEC03E19452EC9E22D5620498C0DB)] [added: [70](#sCF67D5CA246851E7A49A4B0072831536)] |
| [Note 8 [removed: Inventories](#s4856DDA5BC9755678F080D44D1D2259D)] [added: Inventories](#s88C111118B4B5E0CA668C13A09504E1F)] | [removed: [70](#s4856DDA5BC9755678F080D44D1D2259D)] [added: [71](#s88C111118B4B5E0CA668C13A09504E1F)] |
| [Note 9 Property, Plant and [removed: Equipment](#s66ECE03B2A3254E1A4EF32857FDAE09B)] [added: Equipment](#sEB2D0A0E8590531FBA216BD96AE69068)] | [removed: [71](#s66ECE03B2A3254E1A4EF32857FDAE09B)] [added: [72](#sEB2D0A0E8590531FBA216BD96AE69068)] |
| [Note 10 Goodwill and Other Intangible [removed: Assets](#s10644A61E5D353AEB348494A941A5C94)] [added: Assets](#sF00053D58E66548494BC5BBDB36866C2)] | [removed: [71](#s10644A61E5D353AEB348494A941A5C94)] [added: [72](#sF00053D58E66548494BC5BBDB36866C2)] |
| [Note 11 Derivative Financial [removed: Instruments](#sB2205E395E3D577BAD209EC69E311F74)] [added: Instruments](#sB9E9D01CC7C55EB8AC0B7742EA892414)] | [removed: [72](#sB2205E395E3D577BAD209EC69E311F74)] [added: [73](#sB9E9D01CC7C55EB8AC0B7742EA892414)] |
| [Note 12 Accrued and Other Current [removed: Liabilities](#sCF973DDB675150208071CB30D22A78EB)] [added: Liabilities](#s334BC5995A155127915C4C1B8CB51A04)] | [removed: [74](#sCF973DDB675150208071CB30D22A78EB)] [added: [75](#s334BC5995A155127915C4C1B8CB51A04)] |
| [Note 13 Credit Facilities and Long-Term [removed: Debt](#s2E880B37F21D5AAD944EBBC9A35EA16E)] [added: Debt](#s0E9FC05475A85FC98B5573D3CE5A7E40)] | [removed: [74](#s2E880B37F21D5AAD944EBBC9A35EA16E)] [added: [76](#s0E9FC05475A85FC98B5573D3CE5A7E40)] |
| [Note 14 Postretirement Benefit [removed: Plans](#s7138E7B5D67D5B8CB1E882B57EE9FB5A)] [added: Plans](#s1EF719D127505340B78C2C68231CF44D)] | [removed: [76](#s7138E7B5D67D5B8CB1E882B57EE9FB5A)] [added: [78](#s1EF719D127505340B78C2C68231CF44D)] |
| [Note 15 Stock-Based Compensation [removed: Plans](#s26F4AA5D46FD5EBDAE92B3161667A3E9)] [added: Plans](#sED5C7A544BCE575AA8FF7D65442254B4)] | [removed: [83](#s26F4AA5D46FD5EBDAE92B3161667A3E9)] [added: [85](#sED5C7A544BCE575AA8FF7D65442254B4)] |
| [Note 16 Capital [removed: Stock](#s786CEAACBE415B0D8FF3C7D3532CE0BA)] [added: Stock](#sA3D7EE389E3C58FD8193EFF8BC339C1B)] | [removed: [85](#s786CEAACBE415B0D8FF3C7D3532CE0BA)] [added: [88](#sA3D7EE389E3C58FD8193EFF8BC339C1B)] |
| [Note 17 Accumulated Other Comprehensive Income [removed: (Loss)](#sA541F5E474E15746AD807105669A53FB)] [added: (Loss)](#sBAFA57DABD0C54AAAF473FA21C7CE797)] | [removed: [87](#sA541F5E474E15746AD807105669A53FB)] [added: [89](#sBAFA57DABD0C54AAAF473FA21C7CE797)] |
| [Note 18 Commitment and [removed: Contingencies](#s1D70899DF780502F8CA4FE37E03C4852)] [added: Contingencies](#s855B580C830D5514976D5D38DD1F50D0)] | [removed: [88](#s1D70899DF780502F8CA4FE37E03C4852)] [added: [90](#s855B580C830D5514976D5D38DD1F50D0)] |
| [Note 19 Related Party [removed: Transactions](#sDCF3DDF5C1295002A25556EB881AC764)] [added: Transactions](#sCE3A115F0F58586B9BA040BE86754255)] | [removed: [91](#sDCF3DDF5C1295002A25556EB881AC764)] [added: [92](#sCE3A115F0F58586B9BA040BE86754255)] |
| [Note 20 Segment and Geographic [removed: Data](#s962F7622F3165B9A8C83B9D3447FC9B7)] [added: Data](#s7F03AE93508259D883094FB7294E7692)] | [removed: [92](#s962F7622F3165B9A8C83B9D3447FC9B7)] [added: [93](#s7F03AE93508259D883094FB7294E7692)] |
| [Note 21 Valuation and Qualifying [removed: Accounts](#s96099B1EFC0855FCBED7EDCEE0F65BE4)] [added: Accounts](#s799D7ECDE4145E25A47DC4BAF3FE47A6)] | [removed: [94](#s96099B1EFC0855FCBED7EDCEE0F65BE4)] [added: [95](#s799D7ECDE4145E25A47DC4BAF3FE47A6)] |
| [Note 22 Quarterly Financial [removed: Data](#sCDAB1A5FC94D536A98CFDAFE7633C6A1)] [added: Data](#s78008460685457E4A2D2222B034EF1CF)] | [removed: [94](#sCDAB1A5FC94D536A98CFDAFE7633C6A1)] [added: [95](#s78008460685457E4A2D2222B034EF1CF)] |
[removed: REPORT OF INDEPENDENT REGISTERED PUBLIC ACCOUNTING FIRM][added: | [Report of Independent Registered Public Accounting Firm](#sA5D3EE3A91F95A828A88C3050438A871) | [49](#sA5D3EE3A91F95A828A88C3050438A871) |]
We have audited the accompanying consolidated balance sheets of Xylem Inc. and subsidiaries (the "Company") as of December 31, [removed: 2015] [added: 2016] and [removed: 2014,] [added: 2015,] and the related consolidated statements of income, comprehensive income, stockholders' equity, and cash flows for each of the three years in the period ended December 31, [removed: 2015.][added: 2016.]
In our opinion, such consolidated financial statements present fairly, in all material respects, the financial position of Xylem Inc. and subsidiaries as of December 31, [removed: 2015] [added: 2016] and [removed: 2014,] [added: 2015,] and the results of their operations and their cash flows for each of the three years in the period ended December 31, [removed: 2015,] [added: 2016,] in conformity with accounting principles generally accepted in the United States of America.
We have also audited, in accordance with the standards of the Public Company Accounting Oversight Board (United States), the Company's internal control over financial reporting as of December 31, [removed: 2015,] [added: 2016,] based on the criteria established in [removed: Internal] [added: *Internal] Control - Integrated Framework [removed: (2013)] [added: (2013)*] issued by the Committee of Sponsoring Organizations of the Treadway Commission and our report dated February [removed: 26, 2016] [added: 23, 2017] expressed an unqualified opinion on the Company's internal control over financial reporting.
[removed: XYLEM] [added: XYLEM] INC. AND [removed: SUBSIDIARIES][added: SUBSIDIARIES]
| Year Ended December 31, | [removed: 2015] [added: 2016] | | | | [removed: 2014] [added: 2015] | | | | [removed: 2013] [added: 2014] | | |
| Revenue | [removed: $] [added: $] | [removed: 3,653] [added: 3,771] | | | $ | [removed: 3,916] [added: 3,653] | | | $ | [removed: 3,837] [added: 3,916] | |
| Cost of revenue | [removed: 2,249] [added: 2,310] | | | | [removed: 2,403] [added: 2,249] | | | | [removed: 2,338] [added: 2,403] | | |
| Gross profit | [removed: 1,404] [added: 1,461] | | | | [removed: 1,513] [added: 1,404] | | | | [removed: 1,499] [added: 1,513] | | |
| Selling, general and administrative expenses | [removed: 854] [added: 915] | | | | [removed: 920] [added: 854] | | | | [removed: 990] [added: 920] | | |
| Research and development expenses | [removed: 95] [added: 110] | | | | [removed: 104] [added: 95] | | | | 104 | | |
XYLEM INC. AND SUBSIDIARIES
XYLEM INC. AND SUBSIDIARIES
| December 31, | 2016 | | | | 2015 | | |
| Non-controlling interest | 17 | | | | — | | |
| Total equity | 2,207 | | | | 2,084 | | |
XYLEM INC. AND SUBSIDIARIES
| Year Ended December 31, | 2016 | | | | 2015 | | | | 2014 | | |
| Net income | $ | 260 | | | $ | 340 | | | $ | 337 | |
| Short-term debt issued | 274 | | | | — | | | | 52 | | |
| Long-term debt issued, net | 1,540 | | | | — | | | | — | | |
| Long-term debt repaid | (608 | | ) | | — | | | | — | | |
XYLEM INC. AND SUBSIDIARIES
| | | | | | | | | | | | | | | | | | | | | | | | | | | | |
| --- | --- | --- | --- | --- | --- | --- | --- | --- | --- | --- | --- | --- | --- | --- | --- | --- | --- | --- | --- | --- | --- | --- | --- | --- | --- | --- | --- |
| | | | | | | | | | | | | | | | | | | | | | | | | | | | |
| Acquisition activity | | | | | | | | | | | | | | | | | | | | | 17 | | | | 17 | | |
| Balance at December 31, 2016 | $ | 2 | | | $ | 1,876 | | | $ | 1,033 | | | $ | (318 | ) | | $ | (403 | ) | | $ | 17 | | | $ | 2,207 | |
XYLEM INC. AND SUBSIDIARIES
The Sensus segment develops advanced technology solutions that enable intelligent use and conservation of critical water and energy resources.
The Sensus segment's major products include smart metering, networked communications, measurement and control technologies, software and services including cloud-based analytics, remote monitoring and data management.
Generally, these elements are satisfied within the same reporting period although certain contracts may be completed over 6 months.
The fair value of Return on Invested Capital ("ROIC") performance share units at 100% target is determined using the closing price of our common stock on date of grant.
The fair value of Total Shareholder Return ("TSR") performance share units is calculated on the date of grant using a Monte Carlo simulation model utilizing several key assumptions, including expected Company and peer company share pr
ice volatility, correlation coefficients between peers, the risk-free rate of return, the expected dividend yield and other award design features.
In January 2017, the Financial Accounting Standards Board (“FASB”) issued guidance amending the impairment testing of goodwill.
Under current guidance, the testing of goodwill for impairment is performed at least annually using a two-step test.
Step one involves comparing the fair value of a “reporting unit” to its carrying amount.
If the applicable book value exceeds the reporting unit’s fair value then step two must be performed.
Step two involves comparing the fair value of the reporting unit’s goodwill to the applicable carrying amount of the asset and recognizing an impairment charge equal to the amount by which the implied fair value of the goodwill exceeds its carrying amount.
The amended guidance eliminates step two of the impairment test and allows an entity to record an impairment charge equal to the amount that the fair value of the applicable reporting unit exceeds its carrying amount, up to the value of the recorded goodwill.
This guidance is effective prospectively for interim and annual goodwill impairment tests beginning after December 15, 2019 with early adoption permitted for interim or annual tests after January 1, 2017.
The impact of this guidance on our financial condition and results of operations will only apply if the Company’s goodwill is determined to be impaired in future annual tests.
In October 2016, the FASB issued guidance amending the accounting for income taxes.
Under current guidance the recognition of current and deferred income taxes for an intra-entity asset transfer is prohibited until the asset has been sold to an outside party.
The amended guidance eliminates the prohibition against immediate recognition of current and deferred income tax amounts associated with intra-entity transfers of assets other than inventory.
not been issued or made available for issuance.
The requirements of the amended guidance should be applied on a modified retrospective basis through a cumulative-effect adjustment directly to retained earnings as of the beginning of the period of adoption.
In June 2016, the FASB issued guidance amending the accounting for the impairment of financial instruments, including trade receivables.
Under current guidance, credit losses are recognized when the applicable losses are probable of occurring and this assessment is based on past events and current conditions.
The amended guidance eliminates the “probable” threshold and requires an entity to use a broader range of information, including forecast information when estimating expected credit losses.
| [Note 23 Subsequent Events](#s769dd01c58f0466f937c0d8c84248883) | [94](#s769dd01c58f0466f937c0d8c84248883) |
February 26, 2016
| | | | | | | | | | | | |
| --- | --- | --- | --- | --- | --- | --- | --- | --- | --- | --- | --- |
| Principal payments of debt and capital lease obligations | — | | | | — | | | | (2 | | ) |
| | | | | | | | | | | | | | | | | | | | | | | | |
| --- | --- | --- | --- | --- | --- | --- | --- | --- | --- | --- | --- | --- | --- | --- | --- | --- | --- | --- | --- | --- | --- | --- | --- |
| Balance at December 31, 2012 | 2 | | | | 1,706 | | | | 264 | | | | 115 | | | | (13 | | ) | | 2,074 | | |
Certain prior year amounts have been reclassified to conform to the current year presentation.
Changes to the acquisition date fair values after expiration of the measurement period are recorded in earnings.
Hedge accounting generally provides for the
Early adoption is permitted.
In January 2016, the FASB issued guidance amending the classification and measurement of financial instruments.
Specifically, the amended guidance (1) requires equity securities with readily determinable fair values to be measured at fair value with changes in fair value recognized through net income (2) simplifies the impairment assessment of equity investments without readily determinable fair values by requiring a qualitative impairment assessment at each reporting period and requiring any impaired investment be measured at fair value (3) requires separate presentation of financial assets and financial liabilities by measurement category and form of financial asset on the balance sheet or accompanying notes to the financial statements and (4) eliminates the requirement to disclose the methods and significant assumptions used to estimate the fair value that is required to be disclosed for financial instruments measured at cost on the balance sheet.
Early adoption is permitted for fiscal years or interim periods for which the applicable financial statements have not been issued.
application.
In November 2015, the FASB issued guidance that changes the presentation of deferred income taxes.
Under prior accounting guidance deferred income tax liabilities and assets are separated into current and noncurrent amounts in an entity’s balance sheet.
The guidance requires that deferred income tax liabilities and assets be classified as noncurrent in an entity’s balance sheet.
This guidance may be applied prospectively or retrospectively to all deferred income tax balances.
Accordingly, $71 million and $118 million are reflected in noncurrent deferred tax assets and noncurrent deferred tax liabilities, respectively as of December 31, 2015.
Additionally, $38 million of current deferred tax assets and $5 million of current deferred tax liabilities were reclassified to noncurrent deferred tax assets and liabilities as of December 31, 2014 resulting in total noncurrent deferred tax assets and noncurrent deferred tax liabilities of $90 million and $136 million, respectively.
In September 2015, the FASB issued guidance regarding simplifying the accounting for measurement-period adjustments attributable to an acquisition.
Under prior guidance, adjustments to provisional amounts during the measurement period that arise due to new information regarding acquisition date circumstances must be made retrospectively with a corresponding adjustment to goodwill.
The amended guidance requires an acquirer to record adjustments to provisional amounts made during the measurement period in the period that the adjustment is determined.
The adjustments should reflect the impact on earnings of changes in depreciation, amortization, or other income effects, if any, as if the accounting had been completed as of the acquisition date.
Additionally, amounts recorded in the current period that would have been reflected in prior reporting periods if the adjustments had been recognized as of the acquisition date must be disclosed either on the face of the income statement or in the notes to financial statements.
In May 2015, the FASB issued guidance regarding the disclosure of investments which are valued at fair value using the net asset value ("NAV") per share practical expedient.
Investments measured at NAV per share using the practical expedient will be presented as a reconciling item between the fair value hierarchy disclosure and the balance sheet.
The amended guidance removes the requirement to categorize such investments within the fair value hierarchy.
The amendment also removes the requirement to make certain disclosures for all investments that are eligible to be measured at fair value using the NAV per share practical expedient, instead limiting such disclosures to those investments measured at fair value using the NAV practical expedient.
The guidance must be applied retrospectively and early adoption is permitted.
In April 2015, the FASB issued guidance which changes the presentation of debt issuance costs in the balance sheet.
Under prior guidance, debt issuance costs are reflected on the balance sheet as an asset.
This amendment requires such costs to be reflected as a direct deduction to the related debt liability, with retrospective application upon adoption.
Subsequently, in August 2015, the FASB issued additional guidance indicating that debt issuance costs associated with line-of-credit arrangements may be presented as an asset and amortized over the term of the line-of-credit arrangement.
We elected to early adopt these standards effective the first and third quarter of 2015, respectively.
Accordingly, $4 million of debt issuance costs were reflected within long-term debt as of December 31, 2015 and December 31, 2014.
These costs were previously recorded within other non-current assets.
In April 2015, the FASB issued guidance regarding whether a cloud computing arrangement includes a software license.
An excerpt. Shown here: 40 of 779 rewritten, 40 of 396 added and 40 of 190 removed. The counts are complete. For every sentence, read Item 8. FINANCIAL STATEMENTS AND SUPPLEMENTARY DATA in the FY2016 filing and the FY2015 filing.
Item 9A. CONTROLS AND PROCEDURES
9 rewritten, 3 added, 0 removed, 3 unchanged
[removed: Evaluation] [added: Evaluation] of Disclosure Controls and [removed: Procedures][added: Procedures]
Our management, with the Chief Executive Officer ("CEO") and [removed: Interim] Chief Financial Officer ("CFO") of the Company, has evaluated the effectiveness of the design and operation of our disclosure controls and procedures as of the end of the year ended December 31, [removed: 2015] [added: 2016] pursuant to Rule 13a-15(b) and 15d-15(e) of the Securities Exchange Act of 1934 (“the Exchange Act”).
Based upon that evaluation, our CEO and our CFO concluded that our disclosure controls and procedures as of the year ended December 31, [removed: 2015] [added: 2016] were effective, in all material respects, and designed to provide reasonable assurance that the information required to be disclosed by us in the reports we file or submit under the Exchange Act is (1) recorded, processed, summarized and reported, within the time periods specified in the SEC's rules and forms and (2) accumulated and communicated to our management, including our CEO and CFO, as appropriate to allow timely decisions regarding required disclosures.
[removed: Management's] [added: Management's] Annual Report on Internal Control Over Financial [removed: Reporting][added: Reporting]
The Company's management, including the CEO and CFO, conducted an assessment of the effectiveness of our internal control over financial reporting as of December 31, [removed: 2015] [added: 2016] based on the framework established in Internal Control - Integrated Framework issued by the Committee of Sponsoring Organization of the Treadway Commission (2013).
Based on our assessment, the Company's management has concluded that our internal control over financial reporting was effective as of December 31, [removed: 2015.][added: 2016.]
The effectiveness of the Company's internal control over financial reporting as of December 31, [removed: 2015] [added: 2016] has been audited by Deloitte & Touche LLP, an independent registered public accounting firm, as stated in their report which appears following Item 9B of this Annual Report on Form 10-K.
[removed: Changes] [added: Changes] in Internal Control Over Financial [removed: Reporting][added: Reporting]
There were no changes in the Company's internal control over financial reporting that occurred during the quarter ended December 31, [removed: 2015] [added: 2016] that have materially affected, or are reasonably likely to materially affect, our internal control over financial reporting.
Management's assessment of the effectiveness of the Company's internal control over financial reporting as of December 31, 2016 excluded Sensus Worldwide ("Sensus"), which was acquired by the Company on October 31, 2016.
Sensus is a wholly-owned subsidiary of the Company whose total assets and total net sales represented less than 36% of consolidated total assets and less than 4% of consolidated net sales, respectively, of the Company as of and for the year ended December 31, 2016.
As permitted by guidelines established by the Securities and Exchange Commission, companies are allowed to exclude certain acquisitions from their assessments of internal control over financial reporting during the first year of an acquisition while integrating the acquired companies.
Item 9B. OTHER INFORMATION
6 rewritten, 4 added, 1 removed, 15 unchanged
[removed: REPORT] [added: REPORT] OF INDEPENDENT REGISTERED PUBLIC ACCOUNTING [removed: FIRM][added: FIRM]
We have audited the internal control over financial reporting of Xylem Inc. and subsidiaries (the "Company") as of December 31, [removed: 2015,] [added: 2016,] based on criteria established in [removed: Internal] [added: *Internal] Control - Integrated Framework [removed: (2013)] [added: (2013)*] issued by the Committee of Sponsoring Organizations of the Treadway Commission.
The Company's management is responsible for maintaining effective internal control over financial reporting and for its assessment of the effectiveness of internal control over financial reporting, included in the accompanying [removed: Management's] [added: *Management's] Annual Report on Internal Control Over Financial [removed: Reporting.][added: Reporting*.]
In our opinion, the Company maintained, in all material respects, effective internal control over financial reporting as of December 31, [removed: 2015,] [added: 2016,] based on the criteria established in [removed: Internal] [added: *Internal] Control - Integrated Framework [removed: (2013)] [added: (2013)*] issued by the Committee of Sponsoring Organizations of the Treadway Commission.
We have also audited, in accordance with the standards of the Public Company Accounting Oversight Board (United States), the consolidated financial statements as of and for the year ended December 31, [removed: 2015] [added: 2016] of the Company and our report dated February [removed: 26, 2016] [added: 23, 2017] expressed an unqualified opinion on those financial statements.
[removed: PART III][added: PART III]
As described in Management’s Annual Report on Internal Control over Financial Reporting, management excluded from its assessment the internal control over financial reporting at Sensus Worldwide (“Sensus”), which was acquired by the Company on October 31, 2016.
Sensus is a wholly-owned subsidiary of the Company whose total assets and total net sales represented less than 36% of consolidated total assets and less than 4% of consolidated net sales, respectively, of the Company as of and for the year ended December 31, 2016.
Accordingly, our audit did not include the internal control over financial reporting at Sensus.
February 23, 2017
February 26, 2016
Item 10. DIRECTORS, EXECUTIVE OFFICERS AND CORPORATE GOVERNANCE
4 rewritten, 0 added, 0 removed, 5 unchanged
The information required by this Item is incorporated herein by reference to the information in our Definitive Proxy Statement to be filed with the SEC in connection with our [removed: 2016] [added: 2017] Annual Meeting of Shareholders (the [removed: “2016] [added: “2017] Proxy Statement”) under the captions “Proposal 1 - Election of Directors,” "Identifying and Evaluating Director Nominees," "Board Committees - Audit Committee" and “Section 16(a) Beneficial Ownership Reporting Compliance.”
The corporate governance principles and board committee charters are available on the Company’s website at [removed: www.investors.xyleminc.com.][added: *www.investors.xyleminc.com*.]
We have also adopted a written code of conduct which is applicable to all our directors, officers and employees, including the Company’s Chief Executive Officer and [removed: Interim] Chief Financial Officer and other executive officers identified pursuant to this Item 10.
We intend to disclose any changes in our Code of Conduct and waivers of the Code of Conduct on our website at [removed: www.xyleminc.com] [added: *www.xyleminc.com*] within four business days following the date of the amendment or waiver.
Item 11. EXECUTIVE COMPENSATION
1 rewritten, 0 added, 0 removed, 0 unchanged
The information required by this Item is incorporated herein by reference to the information in our [removed: 2016] [added: 2017] Proxy Statement set forth under captions “Executive Compensation," "Director Compensation", "Board Committees - Leadership Development and Compensation Committee" and “Leadership Development and Compensation Committee Report.”
Item 12. SECURITY OWNERSHIP OF CERTAIN BENEFICIAL OWNERS AND MANAGEMENT AND RELATED STOCKHOLDER MATTERS
1 rewritten, 0 added, 0 removed, 0 unchanged
The information required by this Item is incorporated herein by reference to the information in our [removed: 2016] [added: 2017] Proxy Statement set forth under the captions “Stock Ownership of Directors, Executive Officers and Certain Beneficial Owners” and "Equity Compensation Plan Information."
Item 13. CERTAIN RELATIONSHIPS AND RELATED TRANSACTIONS, AND DIRECTOR INDEPENDENCE
1 rewritten, 0 added, 0 removed, 0 unchanged
The information required by this Item is incorporated herein by reference to the information in our [removed: 2016] [added: 2017] Proxy Statement set forth under the captions "Governance - Director Independence" and “Governance - Related Party Transactions.”
Item 14. PRINCIPAL ACCOUNTING FEES AND SERVICES
1 rewritten, 0 added, 1 removed, 0 unchanged
The information required by this Item is incorporated herein by reference to the information in our [removed: 2016] [added: 2017] Proxy Statement set forth under the captions “Fees of Audit and Other Services Fees” and "Pre-Approval of Audit and Non-Audit Services."
PART IV
Item 16. FORM 10-K SUMMARY
0 rewritten, 2 added, 0 removed, 0 unchanged
New section this year
None.
PART IV
Item 15. EXHIBITS, FINANCIAL STATEMENT SCHEDULES
46 rewritten, 32 added, 11 removed, 98 unchanged
[removed: SIGNATURES][added: SIGNATURES]
| | [removed: XYLEM INC.] [added: XYLEM INC.] |
| | [removed: (Registrant)] [added: (Registrant)] |
| | [added: Senior] Vice [removed: President, Controller] [added: President] and Chief [removed: Accounting] [added: Financial] Officer |
| February [removed: 26, 2016] [added: 23, 2017] | | /s/ Patrick K. Decker |
| February [removed: 26, 2016] [added: 23, 2017] | | /s/ Markos I. Tambakeras |
| February [removed: 26, 2016] [added: 23, 2017] | | /s/ Curtis J. Crawford |
| February [removed: 26, 2016] [added: 23, 2017] | | /s/ Robert F. Friel |
| February [removed: 26, 2016] [added: 23, 2017] | | /s/ Victoria D. Harker |
| February [removed: 26, 2016] [added: 23, 2017] | | /s/ Sten E. Jakobsson |
| February [removed: 26, 2016] [added: 23, 2017] | | /s/ Steven R. Loranger |
| February [removed: 26, 2016] [added: 23, 2017] | | /s/ Edward J. Ludwig |
| February [removed: 26, 2016] [added: 23, 2017] | | /s/ Surya N. Mohapatra |
| February [removed: 26, 2016] [added: 23, 2017] | | /s/ Jerome A. Peribere |
[removed: EXHIBIT INDEX][added: EXHIBIT INDEX]
| [removed: Exhibit Number] [added: Exhibit Number] | [removed: Description] [added: Description] | [removed: Location] [added: Location] |
| (4.1) | Indenture, dated as of September 20, 2011, between Xylem Inc., ITT Corporation, as initial guarantor, and Union Bank, N.A., as [removed: trustee] [added: trustee.] | Incorporated by reference to Exhibit 4.2 of ITT Corporation’s Form 8-K Current Report filed on September 21, 2011 (CIK No. 216228, File No. 1-5672). |
| [removed: (4.2)] [added: (4.6)] | Form of Xylem Inc. [removed: 3.550%] [added: 4.875%] Senior Notes due [removed: 2016] [added: 2021.] | Incorporated by reference to Exhibit [removed: 4.5] [added: 4.6] of Xylem Inc.'s Form S-4 Registration Statement filed on May 24, 2012 (CIK No. 1524472, File No. 333-181643). |
| [removed: (4.3)] [added: (4.8)] | Form of Xylem Inc. [removed: 4.875%] [added: 3.250%] Senior Notes due [removed: 2021] [added: 2026.] | Incorporated by reference to Exhibit [removed: 4.6] [added: 4.1] of Xylem [removed: Inc.'s] [added: Inc.’s] Form [removed: S-4 Registration Statement] [added: 8-K] filed on [removed: May 24, 2012] [added: October 11, 2016] (CIK No. 1524472, File No. [removed: 333-181643).] [added: 1-35229).] |
| (10.1) | Form of Xylem 2011 Omnibus Incentive Plan Non-Qualified Stock Option Award Agreement [removed: (2015)] [added: (2015).] | Incorporated by reference to Exhibit 10.1 of Xylem Inc.’s Form 10-K Annual Report filed on February 26, 2015 (CIK No. 1524472, File No. 1-35229). |
| (10.6) | Xylem 2011 Omnibus Incentive Plan (Amended as of February 24, [removed: 2016)] [added: 2016).] | [removed: Filed herewith.] [added: Incorporated by reference to Exhibit 10.6 of Xylem Inc.'s Form 10-K filed on February 26, 2016 (CIK No. 1524472, File No. 1-35229).] |
| (10.7) | Form of Xylem Non-Qualified Stock Option Award Agreement (Amended as of February 24, [removed: 2016)] [added: 2016).] | [removed: Filed herewith.] [added: Incorporated by reference to Exhibit 10.7 of Xylem Inc.'s Form 10-K filed on February 26, 2016 (CIK No. 1524472, File No. 1-35229).] |
| (10.8) | Form of Xylem Restricted Stock Unit Agreement (Amended as of February 24, [removed: 2016)] [added: 2016).] | [removed: Filed herewith.] [added: Incorporated by reference to Exhibit 10.8 of Xylem Inc.'s Form 10-K filed on February 26, 2016 (CIK No. 1524472, File No. 1-35229).] |
| (10.9) | Form of Xylem Performance Share Unit Agreement (Amended as of February 24, [removed: 2016)] [added: 2016).] | [removed: Filed herewith.] [added: Incorporated by reference to Exhibit 10.9 of Xylem Inc.'s Form 10-K filed on February 26, 2016 (CIK No. 1524472, File No. 1-35229).] |
| (10.10) | Xylem Retirement Savings [removed: Plan] [added: Plan.] | Incorporated by reference to Exhibit 10.1 of Xylem Inc.’s Form 10-Q filed on July 30, 2013 (CIK No. 1524472, File No. 1-35229). |
| (10.11) | Xylem Supplemental Retirement Savings [removed: Plan] [added: Plan.] | Incorporated by reference to Exhibit 10.11 of Xylem Inc.’s Form 10-Q Quarterly Report filed on November 21, 2011 (CIK No. 1524472, File No. 1-35229). |
| [removed: (10.12)] [added: (10.13)] | Xylem Deferred Compensation Plan [added: for Non-Employee Directors.] | Incorporated by reference to Exhibit [removed: 4.5] [added: 10.13] of Xylem Inc.’s [removed: Registration Statement on] Form [removed: S-8] [added: 10-Q Quarterly Report] filed on [removed: October 28,] [added: November 21,] 2011 (CIK No. 1524472, File No. [removed: 333-177607).] [added: 1-35229).] |
| [removed: (10.13)] [added: (10.17)] | [added: Form of] Xylem [removed: Deferred Compensation] [added: 2011 Omnibus Incentive] Plan [removed: for Non-Employee Directors] [added: 2011 Non-Qualified Stock Option Award Agreement — Founders Grant.] | Incorporated by reference to Exhibit [removed: 10.13] [added: 10.17] of Xylem Inc.’s Form 10-Q Quarterly Report filed on November 21, 2011 (CIK No. 1524472, File No. 1-35229). |
| (10.14) | Form of Non-Employee Director Restricted Stock Unit Award [removed: Agreement] [added: Agreement.] | Incorporated by reference to Exhibit 10.1 of Xylem Inc.’s Form 10-Q Quarterly Report filed on July 30, 2015 (CIK No. 1524472, File No. 1-35229). |
| (10.15) | Xylem Special Senior Executive Severance Pay Plan (Amended as of February 24, [removed: 2016)] [added: 2016).] | [removed: Filed herewith.] [added: Incorporated by reference to Exhibit 10.15 of Xylem Inc.'s Form 10-K filed on February 26, 2016 (CIK No. 1524472, File No. 1-35229).] |
| (10.16) | Xylem Senior Executive Severance Pay Plan (Amended as of February 24, [removed: 2016)] [added: 2016).] | [removed: Filed herewith.] [added: Incorporated by reference to Exhibit 10.16 of Xylem Inc.'s Form 10-K filed on February 26, 2016 (CIK No. 1524472, File No. 1-35229).] |
| [removed: (10.17)] [added: (10.18)] | Form of Xylem 2011 Omnibus Incentive Plan [removed: 2011] Non-Qualified Stock Option Award Agreement — [removed: Founders Grant] [added: General Grant.] | Incorporated by reference to Exhibit [removed: 10.17] [added: 10.18] of Xylem Inc.’s Form 10-Q Quarterly Report filed on November 21, 2011 (CIK No. 1524472, File No. 1-35229). |
| [removed: (10.18)] [added: (10.21)] | Form of Xylem 2011 Omnibus Incentive Plan Non-Qualified Stock Option Award Agreement [removed: — General Grant] [added: (2013).] | Incorporated by reference to Exhibit [removed: 10.18] [added: 10.1] of Xylem [removed: Inc.’s] [added: Inc.'s] Form 10-Q Quarterly Report filed on [removed: November 21, 2011] [added: April 30, 2013] (CIK No. 1524472, File No. 1-35229). |
| (10.19) | Xylem Annual Incentive Plan for Executive Officers (Amended as of February 24, [removed: 2016)] [added: 2016).] | [removed: Filed herewith.] [added: Incorporated by reference to Exhibit 10.16 of Xylem Inc.'s Form 10-K filed on February 26, 2016 (CIK No. 1524472, File No. 1-35229).] |
| [removed: (10.21)] [added: (10.22)] | [removed: Form of Xylem 2011 Omnibus Incentive Plan Non-Qualified Stock Option Award] [added: Letter] Agreement [removed: (2013)] [added: between Xylem Inc. and Patrick K. Decker.] | Incorporated by reference to Exhibit 10.1 of Xylem Inc.'s Form 10-Q Quarterly Report filed on April [removed: 30, 2013] [added: 29, 2014] (CIK No. 1524472, File No. 1-35229). |
| [removed: (10.22)] [added: (10.23)] | [removed: Letter] [added: Restricted Stock Unit Grant] Agreement between Xylem Inc. and Patrick K. [removed: Decker] [added: Decker.] | Incorporated by reference to Exhibit 10.1 of Xylem Inc.'s Form [removed: 10-Q Quarterly] [added: 8-K Current] Report filed on [removed: April 29,] [added: March 20,] 2014 (CIK No. 1524472, File No. 1-35229). |
| (10.26) | Agreement dated December 3, 2015, Amending the Research and Development Facility Agreement - Xylem Water Technologies Risk-Sharing Financing Facility First Amended and Restated Finance Contract, dated June 28, 2014, among the European Investment Bank, Xylem Holdings S.á r.l. and Xylem International S.á r.l., as borrowers, and Xylem Inc., as guarantor. | [removed: Filed herewith.] [added: Incorporated by reference to Exhibit 10.16 of Xylem Inc.'s Form 10-K filed on February 26, 2016 (CIK No. 1524472, File No. 1-35229).] |
| (11.0) | Statement re computation of per share [removed: earnings] [added: earnings.] | Information required to be presented in Exhibit 11 is provided under "Earnings Per Share" in Note 7 of the consolidated financial statements in Part II, Item 8. “Financial Statements and Supplementary Data” of this Annual Report on Form 10-K in accordance with the provisions of Financial Accounting Standards Board Accounting Standards Codification 260, [removed: Earnings] [added: *Earnings] Per [removed: Share.] [added: Share*.] |
| (12.0) | Statements re computation of [removed: ratios] [added: ratios.] | Filed herewith. |
| (21.0) | Subsidiaries of the [removed: Registrant] [added: Registrant.] | Filed herewith. |
| | /s/ E. Mark Rajkowski |
| | E. Mark Rajkowski |
February 23, 2017
| (2.2) | Share Purchase Agreement, dated as of August 15, 2016, by and among Xylem Inc., Xylem Luxembourg S.à r.l., Sensus Worldwide Limited, Sensus Industries Limited, and Sensus USA Inc. | Incorporated by reference to Exhibit 2.1 to Xylem Inc.’s Current Report on Form 8-K filed on August 15, 2016 (CIK No. 1524472, File No. 1-35229). |
| (2.3) | First Amendment to Share Purchase Agreement, dated as of October 31, 2016, by and among Xylem Inc., Xylem Luxembourg S.à r.l., Sensus Worldwide Limited, Sensus Industries Limited, and Sensus USA Inc. | Incorporated by reference to Exhibit 2.2 to Xylem Inc.’s Current Report on Form 8-K filed on October 31, 2016 (CIK No. 1524472, File No. 1-35229). |
| (4.2) | Senior Indenture, dated March 11, 2016, by and between the Company and Deutsche Bank Trust Company Americas, as trustee. | Incorporated by reference to Exhibit 4.1 of Xylem Inc.’s Form 8-K filed on March 11, 2016 (CIK No. 1524472, File No. 1-35229). |
| (4.3) | First Supplemental Indenture, dated March 11, 2016, by and between the Company and Deutsche Bank Trust Company Americas, as trustee. | Incorporated by reference to Exhibit 4.1 of Xylem Inc.’s Form 8-K filed on March 11, 2016 (CIK No. 1524472, File No. 1-35229) |
| (4.4) | Second Supplemental Indenture, dated March 11, 2016, by and between the Company and Deutsche Bank Trust Company Americas, as trustee. | Incorporated by reference to Exhibit 4.1 of Xylem Inc.’s Form 8-K filed on March 11, 2016 (CIK No. 1524472, File No. 1-35229). |
| (4.5) | Third Supplemental Indenture, dated October 11, 2016, by and between the Company and Deutsche Bank Trust Company Americas, as trustee. | Incorporated by reference to Exhibit 4.1 of Xylem Inc.’s Form 8-K filed on October 11, 2016 (CIK No. 1524472, File No. 1-35229). |
| (4.7) | Form of Xylem Inc. 2.250% Senior Notes due 2023. | Incorporated by reference to Exhibit 4.3 of Xylem Inc.’s Current Report on Form 8-K dated March 11, 2016 (CIK No. 1524472, File No. 1-35229). |
| Exhibit Number | Description | Location |
| (4.9) | Form of Xylem Inc. 4.375% Senior Notes due 2046. | Incorporated by reference to Exhibit 4.1 of Xylem Inc.’s Form 8-K filed on October 11, 2016 (CIK No. 1524472, File No. 1-35229). |
| (10.12) | Xylem Deferred Compensation Plan. | Filed herewith. |
| Exhibit Number | Description | Location |
| (10.20) | Form of Director’s Indemnification Agreement. | Incorporated by reference to Exhibit 10.16 of Xylem Inc.'s Form 10-K filed on February 26, 2016 (CIK No. 1524472, File No. 1-35229). |
| Exhibit Number | Description | Location |
| (10.27) | Amendment No.1, dated as of August 30, 2016, to the Five-Year Revolving Credit Facility, dated as of March 27, 2015, among Xylem Inc., the lenders named therein and Citibank N.A. as Administrative Agent. | Incorporated by reference to Exhibit 10.1 of Xylem Inc.’s Form 10-Q filed on November 1, 2016 (CIK No. 1524472, File No. 1-35229). |
| (10.28) | Finance Contract, dated October 28, 2016, between Xylem Holdings S.a.r.l. and Xylem International S.a.r.l., as borrowers, Xylem Inc., as guarantor and the European Investment Bank. | Incorporated by reference to Exhibit 10.2 of Xylem Inc.’s Form 10-Q filed on November 1, 2016 (CIK No. 1524472, File No. 1-35229). |
| (10.29) | Term Loan Agreement, dated as of October 24, 2016 among Xylem Europe GmbH, as borrower, Xylem Inc., as parent guarantor and ING Bank, as lender (including Form of Parent Guarantee). | Incorporated by reference to Exhibit 10.1 of Xylem Inc.’s Form 8-K filed on October 28, 2016 (CIK No. 1524472, File No. 1-35229). |
| | | |
| | | |
| | | |
| | | |
| | | |
| | | |
| | | |
| | | |
| | | |
| | | |
| --- | --- | --- |
| | | |
| Exhibit Number | Description | Location |
| | /s/ John P. Connolly |
| | John P. Connolly |
| | (Principal Accounting Officer and Duly Authorized Officer) |
February 26, 2016
| February 26, 2016 | | /s/ Shashank Patel |
| | | Shashank Patel |
| | | Interim Chief Financial Officer |
| | | (Principal Financial Officer) |
| (10.4) | Master Transition Services Agreement, dated as of October 25, 2011, among ITT Corporation, Exelis Inc. and Xylem Inc. | Incorporated by reference to Exhibit 10.4 of ITT Corporation’s Form 10-Q Quarterly Report filed on October 28, 2011 (CIK No. 216228, File No. 1-5672). |
| (10.20) | Form of Director’s Indemnification Agreement | Filed herewith. |
| (10.23) | Restricted Stock Unit Grant Agreement between Xylem Inc. and Patrick K. Decker | Incorporated by reference to Exhibit 10.1 of Xylem Inc.'s Form 8-K Current Report filed on March 20, 2014 (CIK No. 1524472, File No. 1-35229). |
An excerpt. Shown here: 40 of 46 rewritten, all 32 added and all 11 removed. The counts are complete. For every sentence, read Item 15. EXHIBITS, FINANCIAL STATEMENT SCHEDULES in the FY2016 filing and the FY2015 filing.