 filings.tools
Waste Management (WM) 10-K risk factor changes: FY2023 vs FY2022
The 2023-12-31 10-K against the 2022-12-31 one, compared heading by heading and sentence by sentence.
Item 1A87 rewritten63 added51 removed278 unchanged
All filing items1,092 rewritten749 added568 removed2,042 unchanged
Summary
counted, not written
- Item 1A headings could not be compared: only 0 carried over between the two years, which usually means one filing was read wrongly, so none is reported as new or removed.
- Sentence by sentence, 749 added, 568 removed, 1,092 rewritten and 2,042 unchanged across 19 items that differ.
- New this year: Item 1C. Cybersecurity.; Item 9C. Disclosure Regarding Foreign Jurisdictions that Prevent Inspections..
Sentences by item
24 items, with every count and a link to each item that changed
Underlined words on a shaded ground are new in FY2023; struck-through words were in FY2022. Sentences that are wholly new or wholly gone are labelled rather than marked.
Item 1A. Risk Factors.
87 rewritten, 63 added, 51 removed, 278 unchanged
| | ● | A key element of our strategy is yield management through focus on price leadership, which has presented challenges to keep existing business and win new business at reasonable returns. We [removed: have] also [removed: continued our environmental fee, fuel] [added: utilize an energy] surcharge and [removed: regulatory recovery fee to offset costs.] [added: other mandated fees.] The loss of volumes as a result of price increases and our unwillingness to pursue lower margin volumes may negatively affect our cash flows or results of operations. Additionally, we have in the past and may in the future face purported class action lawsuits related to our customer service agreements, prices and fees. |
| | ● | We may not be able to maintain cost savings [removed: achieved] [added: achieved, including] through our automation and optimization efforts, due to inflationary cost pressure or otherwise. |
| | ● | Strategic decisions with respect to our asset portfolio may result in impairments to our assets. [removed: See Item 1A. _Risk Factors_ — _We may record material charges against our earnings due to impairments to our assets_.] |
| | ● | Acquisitions, investments and/or new service offerings or lines of business may not increase our earnings in the timeframe anticipated, or at all, due to difficulties operating in new markets or providing new service offerings or lines of business, failure of technologies to perform as expected, failure to operate within budget, integration [added: issues, or regulatory issues and compliance costs, among others, and we may experience issues successfully integrating acquisitions into our internal controls, operations, and/or accounting systems.] |
| | ● | Integration of acquisitions and/or new services offerings or lines of business could increase our exposure to the risk of inadvertent noncompliance with applicable laws and regulations, and [removed: any] [added: additional] expansion into markets outside of North America would result in our business being subject to new laws and regulatory regimes, resulting in greater exposure to risk of inadvertent noncompliance and additional compliance costs. |
| | ● | Execution of our strategy, including growth through acquisitions and our planned expansion of our [removed: recycling] [added: Recycling Processing] and [removed: renewable energy businesses,] [added: Sales and WM Renewable Energy segments,] may cause us to incur substantial additional indebtedness, which may divert capital away from our traditional business operations and other financial [removed: plans.] [added: plans, and may introduce additional risks and volatility to our financial performance.] |
| | ● | Supply [removed: chain] [added: chain, regulatory or permitting] disruptions or delays could detrimentally impact the execution timeline for our planned expansion of our [removed: recycling] [added: Recycling Processing] and [removed: renewable energy] [added: Sales and WM Renewable Energy] businesses. |
Our operations must comply with extensive existing regulations, and changes in [removed: regulations and/or enforcement of regulations] [added: regulations, including with respect to emerging contaminants and extended producer responsibility,] can restrict or alter our operations, increase our operating costs, increase our tax rate, or require us to make additional capital expenditures.
Expenditures could be accelerated or materially exceed our accruals due to earlier than expected closure of landfills; the types of waste collected and manner in which it is transported and disposed of, including actions taken in the past by companies we have acquired or third-party landfill operators; environmental regulatory changes; new information about waste types previously collected, such as [removed: PFAS] [added: per- and polyfluoroalkyl substances (“PFAS”)] or other emerging contaminates and other reasons.
EPR regulations are designed to place either partial or total responsibility on producers [added: of consumer-packaged goods and other products] to fund the post-use life cycle of the products they create.
Along with the funding responsibility, producers may be required to undertake additional responsibilities, such as taking over management of local recycling programs by taking back their products from end users or managing the collection operations and recycling processing [added: and marketing] infrastructure.
[removed: There is no federal law establishing EPR in the U.S. or Canada; however, federal, state,] provincial and local governments could, and in several cases have, taken steps to implement EPR regulations for packaging, including traditional recyclables such as cardboard, bottles and cans.
A significant reduction in the waste, recycling and other streams we [removed: manage] [added: manage, including with respect to quality and volume,] could have a material adverse effect on our financial condition, results of operations and cash flows.
Providing environmental and waste management services, including constructing and operating landfills, transfer stations, [removed: material recovery] [added: recycling] facilities [removed: (“MRFs”)] and other disposal facilities, and landfill gas-to-energy facilities, involves risks such as truck accidents, equipment defects, malfunctions and failures, and improper use of dangerous equipment.
Operation of fueling stations and landfill gas collection and control systems, as well as operation of heavy machinery and management of flammable materials at our [removed: MRFs] [added: recycling facilities] and transfer stations, involves additional risks of fire and explosion.
[removed: This includes key individuals in leadership and specialty roles, as well as a very large number of drivers,] technicians and other front-line and back-office team members necessary to provide our environmental services.
We make significant investments, and engage in [removed: extensive] internal succession planning, to provide us with a robust pipeline of future leaders.
[added: _Risk Factors — Focus on, and regulation of, environmental, social and governance (“ESG”) performance and disclosure can result in increased costs, risk of noncompliance, damage to our reputation and related adverse effects._)] Damage to our reputation could reduce demand for our services and potentially have an adverse effect on our financial condition, liquidity and results of operations, as well as require additional resources to rebuild our reputation and restore the value of our brand.
It will remain necessary for us to invest capital in fueling infrastructure [removed: in order] to power our natural gas fleet.
There is increasing pressure to reduce the use of fossil fuel in the heavy-duty truck industry, and some [removed: cities and states] [added: regulatory bodies] are pursuing requirements for using alternative engine technology, such as electric powered vehicles, rather than natural gas or diesel vehicles.
This is resulting in regulatory actions to advance the adoption of zero-emission vehicles and a [removed: gradual] shift away from tax incentives and grants for natural gas [removed: trucks.][added: trucks and RNG infrastructure.]
[removed: On the other hand,] [added: Conversely,] certain destructive weather and climate conditions, such as wildfires in the Western U.S. and hurricanes that most often impact our operations in the Southern and Eastern U.S. during the second half of the year, can increase our revenues in the geographic areas affected as a result of the waste volumes generated by these events.
[removed: We] [added: We] may not be able to achieve our sustainability [removed: and other environmental, social and governance ("ESG")-related] [added: related] goals, including reduction of our greenhouse gas ("GHG") emissions, or execute on our sustainability-related growth strategy and initiatives, within planned [removed: timelines, and expectations and regulations relating to ESG performance and disclosure can result in increased costs, risk of noncompliance,] [added: timelines or anticipated budget, which could damage our reputation] and [removed: related adverse effects.][added: negatively impact the benefits anticipated from our investments.]
Consistent with our Company’s long-standing commitment to sustainability and environmental stewardship, we have set goals to reduce our GHG emissions and announced other [removed: ESG-related] [added: sustainability-related] goals and initiatives.
[removed: We have also announced a] [added: In addition, our] sustainability growth strategy [removed: that] includes significant planned investments in our [removed: recycling] [added: Recycling Processing] and [removed: renewable energy businesses.][added: Sales and WM Renewable Energy segments.]
Our ability to [removed: achieve these goals and] successfully execute our sustainability growth strategy may be impacted by the numerous risks and uncertainties associated with our business and the environmental services industry, including financial and operating performance, availability of technology and financing, changes in regulation, commodity price fluctuation and general economic conditions.
_Risk Factors_ — _Our revenues, earnings and cash flows will fluctuate based on changes in commodity prices, and commodity prices for recyclable materials are particularly susceptible to volatility based on macroeconomic conditions and regulations that affect our ability to export products_ and _— [removed: We have announced a] [added: Our] sustainability growth strategy [removed: that] includes significant planned [added: and ongoing] investments in our [removed: renewable energy businesses;] [added: WM Renewable Energy segment;] changes to federal and state renewable fuel policies could affect our financial performance, and such investments may not yield the results anticipated._)
Some or all of the expected benefits of our sustainability-related investments and initiatives may not occur within the anticipated time [removed: periods,] [added: periods] or may cost more to achieve than anticipated.
An inability to develop, obtain, or scale necessary technology and innovations, and challenges arising from the availability or cost of materials and infrastructure [removed: associated][added: or]
[added: regulatory approvals or permitting requirements associated] with our sustainability investments and initiatives, could impede our ability to execute on our plans and achieve our [removed: goals.][added: goals or realize our expected financial performance from these investments.]
[removed: The] [added: In addition, the] nature, [removed: scope] [added: scope,] and complexity of [added: the] matters that our Company must [removed: assess] [added: assess, quantify] and [removed: report] [added: disclose] are expanding due to [removed: growing mandatory] [added: current, proposed,] and [removed: voluntary] [added: recently enacted federal and state] reporting [removed: on] [added: requirements related to] climate-related risks and other topics, such as water usage, waste production, labor, human capital, environmental justice, cybersecurity and privacy, and risk oversight.
Our industry faces challenges [removed: from] [added: to implement] these [removed: and other] rapidly [removed: changing laws, regulations, policies and related interpretations,] [added: developing disclosure requirements,] as well as the risk of enforcement actions by governmental and regulatory agencies for noncompliance.
Significant expenditures and commitment of time by management, employees and consultants is involved in developing, implementing and overseeing policies, practices, additional disclosures and internal controls related to [removed: ESG] [added: environmental and sustainability] risk and performance.
[removed: The COVID-19 global pandemic disrupted] [added: Large-scale disruption of] social and commercial activity and financial [removed: markets throughout North America; a significant resurgence or new variant of] [added: markets, such as has occurred in] the [removed: COVID-19 virus, or other similar] [added: past due to] pandemic conditions, may have a material adverse impact on our business, financial condition, results of operations and cash flows.
If such conditions were to [removed: deepen,] [added: be severe,] resulting in a broad-based economic slow-down, it may have a material adverse impact on our financial condition, results of operations and cash flows and hinder our ability to grow our business and execute our business strategy.
[removed: Market] [added: Market] disruption, including labor shortages and supply chain constraints, and macroeconomic pressures, including inflation, have adversely impacted our business and results of [removed: operations.][added: operations.]
Macroeconomic pressures, including inflation and rising interest rates, and market disruption resulting in labor market, supply chain and transportation constraints [added: have impacted our results and] are continuing.
Significant global supply chain disruption [removed: and the heightened pace of inflation have] [added: has] reduced availability [added: of certain assets used in our business,] and [added: inflation has] increased costs for the goods and services we purchase, [removed: with a particular impact on our] [added: particularly for labor,] repair and [removed: maintenance] [added: maintenance, and subcontractor] costs.
Supply chain constraints have [removed: also] caused delayed delivery of fleet, steel containers and other purchases.
[removed: Additionally, we expect continued significant headwinds from commodity prices for recycled material into 2023, resulting from] [added: to be driven by] the slowdown in the global economy, which reduced retail demand and the corresponding need for cardboard packaging to ship retail goods.
Our business, financial condition and results of operations are subject to numerous risks and uncertainties.
You should carefully consider the following risk factors in conjunction with “Management’s Discussion and Analysis of Financial Condition and Results of Operations” in Item 7 and our “Financial Statements and Supplementary Data” in Item 8.
Federal and state governments have increased their focus on efforts to safeguard communities from the potentially harmful effects associated with PFAS.
See Item 1.
_Business – Regulation – Recent Developments and Focus Areas in Policy and Regulation – PFAS_ for additional background information.
The EPA proposed the designation of two PFAS compounds as hazardous substances under CERCLA.
We are closely monitoring this proposed rulemaking and are actively working with both Congress and the EPA to provide landfills and other essential public services with relief from CERCLA liability and instead hold accountable manufacturers and heavy users of these compounds.
Without such relief, we may face increased exposure to remediation and litigation costs associated with properties that the EPA may designate as CERCLA sites due to the presence of PFAS.
During periods of economic difficulty, governmental entities have increased their interest in implementing EPR regulations to reduce municipal spending on recycling programs.
There is no federal law establishing EPR in the U.S. or Canada; however, federal, state,
This includes key individuals in leadership and specialty roles, as well as a very large number of drivers,
For example, California is at various stages of regulation that would require heavy-duty vehicle fleets to phase-in zero-emissions vehicles.
The extent to which other states adopt California’s standards or something similar into their own regulatory frameworks could accelerate the industry-wide adoption of electric vehicles.
In addition, tax incentives and grants that advance the adoption of zero-emissions vehicles and lead to a shift away from natural gas trucks and RNG infrastructure would likely also negatively impact our investments in landfill gas-to-energy facilities.
Our financial and operating results may fluctuate for many reasons.
Our operating revenues and volumes typically experience seasonal increases in the summer months, that are reflected in second and third quarter revenues and results of operations.
We may not be able to meet such goals or implement such initiatives in the manner or on timelines contemplated due to challenges including, but not limited to, unforeseen costs or delays, supply chain disruptions, regulatory impacts, technology limitations or technical difficulties associated with achieving such goals.
Also, despite voluntarily announcing such sustainability goals, we may receive pressure from investors or other groups to adopt more aggressive sustainability-related goals that may not be technically, operationally, or financially feasible.
(Also see Item 1A.
Additionally, favorable expectations regarding potential investment tax credits or other benefits stemming from the Inflation Reduction Act of 2022 (“IRA”) may not materialize or could fail to meet expectations.
Recently, the IRS issued proposed regulations applicable to the investment tax credits, as expanded by the IRA, that could call into question our ability to realize some, or all, of this tax benefit, which would negatively impact financial expectations in connection with our sustainability growth projects in our WM Renewable Energy segment.
See Item 1.
_Business – Regulation – Recent Developments and Focus Areas in Policy and Regulation – Tax Legislation_.
We have also forecasted or projected certain operational and financial information with respect to our sustainability investments and initiatives, and many of these statements are based on expectations and assumptions that are necessarily uncertain and are subject to risks and uncertainties that could cause actual results to be materially different from our forecasts and projections.
Focus on, and regulation of, environmental, social and governance (“ESG”) performance and disclosure can result in increased costs, risk of noncompliance, damage to our reputation and related adverse effects.
There is increasing governmental and stakeholder interest in ESG matters.
For example, see Item 1.
_Business – Regulation – Recent Developments and Focus Areas in Policy and Regulation – Climate and Sustainability_ for information about California’s recently-adopted Climate Corporate Data Accountability Act and Climate-Related Financial Risk Act and the SEC’s proposed climate-related disclosure rule.
Methodology and timelines for mandatory emissions reporting requirements, such as the recently passed California Corporate Data Accountability Act, may be inconsistent with requirements enacted by other governmental entities, including disclosure requirements that are ultimately adopted by the SEC, which could further increase costs and divert management time and attention.
Disclosures related to GHG emissions data or potential climate-related impacts could also negatively affect our reputation to the extent we are perceived as not meeting individual stakeholder climate-related expectations.
Public statements with respect to ESG matters are becoming increasingly subject to heightened scrutiny from public and governmental authorities related to the risk of potential “greenwashing,” i.e., misleading information or false claims overstating potential ESG benefits.
We are aware that non-governmental organizations and other private actors have filed lawsuits against certain companies under various securities and consumer protection laws alleging that certain ESG-related statements, goals or standards were misleading, false or otherwise deceptive.
Additionally, the downturn in market prices for recycling commodities that started in the second half of 2022 persisted throughout 2023.
The decrease continued
We may also experience margin pressures from commodity-driven business impacts.
Prices and demand for recyclables fluctuate and are particularly susceptible to volatility based on macroeconomic conditions and regulations.
The downturn in market prices for recycling commodities that started in the second half of 2022 continued in 2023.
Average market prices for single-stream recycled commodities were down 40% in 2023 when compared to the comparable prior year period.
Decreases in the market prices for recycling commodities resulted in a decrease in recycling revenues attributable to yield of $308 million in 2023 as compared to the prior year period.
We are making significant planned and ongoing investments in our recycling business to increase automation and reduce labor dependency and address increases in regulatory- and customer-driven quality requirements for commodities.
In an effort to keep our stockholders and the public informed about our business, we may make “forward-looking statements.” Forward-looking statements are often identified by the words, “will,” “may,” “should,” “continue,” “anticipate,” “believe,” “expect,” “plan,” “forecast,” “project,” “estimate,” “intend” and words of a similar nature and generally include statements regarding:
| | ● | future results of operations, including revenues, earnings or cash flows; |
| --- | --- | --- |
| | ● | plans and objectives for the future; |
| | ● | projections, estimates or assumptions relating to our operational or financial performance, including anticipated impacts of the Inflation Reduction Act of 2022; |
| | ● | projections, estimates or assumptions relating to our capital expenditures; or |
| | ● | our opinions, views or beliefs about the effects of current or future events, circumstances or performance. |
You should view these statements with caution.
These statements are not guarantees of future performance, circumstances or events.
They are based on facts and circumstances known to us as of the date the statements are made.
The following discussion should be read together with the Consolidated Financial Statements and the notes thereto.
Outlined below are some of the risks that we believe could affect our business and financial statements for 2023 and beyond and could cause actual results to be materially different from those set forth in forward-looking statements made by the Company.
We assume no obligation to update any forward-looking statement, whether as a result of future events, circumstances or developments or otherwise.
| | | issues, or regulatory issues and compliance costs, among others, and we may experience issues successfully integrating acquisitions into our internal controls, operations, and/or accounting systems. |
Concerns have been raised about the potential for emissions from fueling infrastructure that serve natural gas-fueled vehicles.
New regulation of, or restrictions on, natural gas fueling infrastructure or reductions in associated tax incentives could increase our operating costs.
Further, our fuel surcharge program is currently indexed to diesel fuel prices, and price fluctuations for natural gas may not effectively be recovered by this program.
Our operating revenues tend to be somewhat higher in summer months, primarily due to the higher construction and demolition waste volumes.
The volumes of industrial and residential waste in certain regions where we operate also tend to increase during the summer months.
Our second and third quarter revenues and results of operations typically reflect these seasonal trends.
There is increasing governmental and social pressure on companies to develop and implement robust ESG policies, practices, and disclosures.
The COVID-19 pandemic and related protective measures had a significant adverse impact on many sectors of the economy, including environmental services.
The initial business closures and negative impact on general economic conditions resulted in volume declines and reductions in customers’ waste service needs, which negatively impacted our results of operations and cash flows.
In particular, COVID-19 caused decreases in volumes in higher margin businesses, impacting key financial metrics.
A significant future resurgence in transmission of COVID-19, a significant new virus variant, or other pandemic conditions that result in business closures and social restrictions could adversely impact our volumes and costs.
Additionally, if a large portion of our employee base were to become ill, it could impact our ability to provide timely and reliable service.
Governmental regulation in response to pandemic conditions, including any vaccination requirements, could result in our inability to perform or compete for certain contracts, as well as significant cost, operational disruption, attrition and difficulty securing future labor needs.
We are also currently experiencing margin pressures from commodity-driven business impacts, particularly from higher fuel prices.
Our revenues, earnings and cash flows will fluctuate based on changes in commodity prices, and commodity prices for recyclable materials are particularly susceptible to volatility based on macroeconomic conditions and regulations that affect our ability to export products.
Enforcement or implementation of foreign and domestic regulations can affect our ability to export products.
COVID-19 placed additional financial stress on recyclers and municipalities, resulting in some recycling programs being paused or eliminated.
These changes have led to a number of states and provinces considering and several implementing EPR regulations.
Prices and demand for recyclables fluctuate.
While demand for recyclables generally continues to trend upwards, during the second half of 2022, we saw significant declines in commodity prices for recycled material, and we expect significant commodity price headwinds to continue into 2023, resulting from the slowdown in the global economy, which reduced retail demand and the corresponding need for cardboard packaging to ship retail goods.
We have announced a sustainability growth strategy that includes significant planned investments in our recycling business to increase automation and reduce labor dependency.
Such investments are also targeted at addressing increases in quality requirements for commodities.
We are currently experiencing commodity-price driven impacts from higher fuel costs.
We have increased our investment in landfill gas-to-energy facilities and the size of our landfill gas recovery operations.
Additionally, we provide specialized disposal services for oil and gas exploration and production operations through our energy services business.
Demand for these services decreases when drilling activity slows due to depressed oil and gas prices, and our Company and the companies for which we provide these services could face increased regulation and corresponding costs as a result of regulations related to climate change or other environmental concerns.
An excerpt. Shown here: 40 of 87 rewritten, 40 of 63 added and 40 of 51 removed. The counts are complete. For every sentence, read Item 1A. Risk Factors. in the FY2023 filing and the FY2022 filing.
Item 7. Management’s Discussion and Analysis of Financial Condition and Results of Operations.
264 rewritten, 209 added, 184 removed, 383 unchanged
This section includes a discussion of our results of operations for the three years ended December 31, [removed: 2022.][added: 2023.]
We partner with our [removed: residential, commercial, industrial and municipal] customers and the communities we serve to manage and reduce waste at each stage from collection to disposal, while recovering valuable resources and creating clean, renewable energy.
Through our subsidiaries, including our Waste Management Renewable Energy (“WM Renewable Energy”) business, we are also a leading developer, operator and owner of landfill gas-to-energy facilities in the U.S. and Canada that produce renewable electricity and renewable natural gas, which is a significant source [removed: of fuel for our natural gas fleet.]
Our [removed: “Solid Waste”] [added: solid waste] business is operated and managed locally by our subsidiaries that focus on distinct geographic areas and provide collection, transfer, disposal, [removed: and] recycling and resource recovery services.
Our [removed: Solid Waste] [added: Collection and Disposal businesses’] operating revenues are primarily generated from fees charged for our collection, transfer, [removed: disposal, and recycling] [added: disposal] and resource recovery [removed: services, and from sales of commodities by our recycling and landfill gas-to-energy operations.][added: services.]
Revenues from our collection operations are influenced by factors such as collection frequency, type of collection equipment furnished, type and volume or weight of the waste collected, distance to the disposal facility or [removed: material recovery] [added: recycling] facility and our disposal costs.
Recycling [added: Processing and Sales] revenues generally consist of tipping fees and the sale of recycling commodities to [added: and/or on behalf of] third parties.
[removed: The] [added: Included in the] fees we charge for our services [removed: generally include] [added: is] our [removed: environmental, fuel] [added: energy] surcharge and [removed: regulatory recovery fees which] [added: other charges that] are intended to pass through [removed: to customers direct and indirect] costs [removed: incurred.][added: to customers.]
In addition, many state and local governments mandate diversion, recycling and waste reduction at the source and prohibit the disposal of certain types [removed: of waste at landfills.]
Consistent with our Company’s long-standing commitment to sustainability and environmental stewardship, we [added: have] published our [removed: 2022] [added: 2023] Sustainability [removed: Report] [added: Report,] providing details on our [removed: Environmental, Social and Governance (“ESG”)] [added: sustainability-related] performance and outlining [removed: new] [added: progress towards our] 2030 [added: sustainability] goals.
The Sustainability Report conveys the strong linkage between the Company’s [removed: ESG] [added: sustainability] goals and our growth strategy, inclusive of the planned [added: and ongoing] expansion of the Company’s [removed: recycling] [added: Recycling Processing] and [removed: renewable energy businesses.][added: Sales and WM Renewable Energy segments.]
The information in this report can be found at https://sustainability.wm.com but it does not constitute a part of, and is not incorporated by reference into, this Annual Report on Form [removed: 10 K.][added: 10-K.]
Significant components of our operating expenses vary directly as we experience changes in revenue due to volume and [removed: a heightened pace of][added: inflation.]
Volume changes can fluctuate significantly by line of business and volume changes in higher margin [removed: businesses, such as what we saw with COVID-19,] [added: businesses] can impact key financial metrics.
[removed: Enhancements] [added: Advancements] made through these initiatives are intended to seamlessly and digitally connect all [removed: the Company’s] [added: enterprise] functions required to service [removed: our] customers [removed: in order to] [added: and] provide the best [removed: experience and service.][added: experience.]
In late 2021, we began to execute [removed: on the next phase of] this technology enablement strategy to automate and optimize certain elements of our service delivery model.
Additionally, in 2022, we implemented a new general ledger accounting system, complementary finance enterprise resource planning system and a human capital management system, which will [added: continue to] drive operational and service excellence by empowering our people through a modern, simplified and connected employee experience.
Macroeconomic pressures, including inflation and rising interest rates, and market [removed: disruption,] [added: disruption] resulting in [removed: labor market,] [added: labor,] supply chain and transportation constraints [removed: are continuing.][added: have impacted our results.]
Significant global supply chain disruption [removed: and the heightened pace of inflation have] [added: has] reduced availability [added: of certain assets used in our business,] and [added: inflation has] increased costs for the goods and services we purchase, [removed: with a particular impact on our] [added: particularly for labor,] repair and [removed: maintenance] [added: maintenance, and subcontractor] costs.
Supply chain constraints have [removed: also] caused delayed delivery of fleet, steel containers and other purchases.
The extent and duration of the impact of [removed: these labor market,] [added: labor,] supply chain, transportation and [removed: recycling] [added: commodity price] challenges are subject to numerous external factors beyond our control, including broader macroeconomic conditions; recessionary fears and/or an economic recession; size, location, and qualifications of the labor pool; wage and price structures; adoption of new or revised regulations; [removed: future resurgence of COVID-19 or other pandemic conditions and restrictions;] geopolitical conflicts and responses and supply and demand for [removed: recycled materials.][added: commodities.]
As we experience inflationary cost pressures, we focus on our [removed: strategic] pricing efforts, as well as operating efficiencies and cost controls, to maintain [removed: and grow] our earnings and cash [removed: flow.][added: flow and facilitate growth.]
With these macroeconomic pressures, we remain [removed: focused on] [added: committed to] putting our people first to ensure that they are well positioned to execute our daily operations diligently and safely.
We [removed: are encouraged by our results in 2022 and] remain focused on delivering outstanding customer service, managing our variable costs with changing volumes and investing in technology that will enhance our customers’ experience and [added: provide operating efficiencies intended to] reduce our cost to serve.
[removed: For more information related to our acquisitions, see Notes 11 and] [added: See Note] 17 to the Consolidated Financial Statements [removed: and the _Summary of Cash Flow Activity_ section below.][added: for additional information related to our acquisitions.]
During [removed: 2022,] [added: 2023,] we continued to [added: focus on our priorities to] advance our [removed: strategic priorities—enhancing] [added: strategy—enhancing] employee engagement, [removed: improving] [added: permanently reducing] our [removed: operations] [added: cost to serve] through the use of technology and automation, and investing in growth through our [removed: recycling] [added: Recycling Processing] and [removed: renewable energy businesses.][added: Sales and WM Renewable Energy segments.]
This strategic focus, combined with strong operational [removed: execution] [added: execution,] resulted in increased revenue, income from operations and income from operations [removed: margin driven primarily by both yield and volume growth in our collection and disposal business.][added: margin.]
We remain diligent in offering a [removed: competitively profitable] [added: competitive and differentiated] service that meets the needs of our [removed: customers] [added: customers,] and [added: we] are focused on driving operating efficiencies and reducing discretionary spend.
We continue to invest in our people through [added: paying a competitive] market [removed: wage adjustments,] [added: wage,] investments in our digital platform and training for our team members.
During [removed: 2022,] [added: 2023,] the Company allocated [removed: $2,587] [added: $2,895] million of available cash to capital expenditures.
We also allocated [removed: $2,577] [added: $2,438] million of available cash to our shareholders during [removed: 2022] [added: 2023] through dividends and common stock repurchases.
Key elements of our [removed: 2022] [added: 2023] financial results include:
[removed: | | ● | Operating] [added: Our operating] expenses [removed: of $12,294 million] [added: increased] in 2022, [removed: or 62.4% of revenues,] [added: as] compared with [removed: $11,111 million, or 62.0% of revenues, in 2021. The $1,183 million increase is] [added: 2021,] primarily [removed: attributable] [added: due] to (i) inflationary cost pressures, particularly for maintenance and repairs and subcontractor costs; (ii) commodity-driven business impacts from higher fuel [removed: prices] and recycling [added: prices] and (iii) labor cost [removed: increases] [added: pressure] from frontline employee wage [removed: adjustments; |][added: adjustments.]
[removed: | | | business travel and entertainment expense] [added: _Labor] and [removed: (iv) an] [added: Related Benefits_ — The] increase in [removed: provision for bad debts; partially offset by] [added: labor and related benefits costs in 2023, as compared with 2022, was primarily related to] (i) [removed: lower long-term incentive compensation costs;] [added: annual wage increases for our employees;] (ii) market adjustments for deferred compensation plans related to investment performance and (iii) [added: higher long-term incentive compensation costs, partially offset by] lower [removed: litigation costs; |][added: annual incentive compensation costs and lower contract labor expenses.]
| | ● | Income from operations [removed: of $3,365 million, or 17.1% of revenues,] in [removed: 2022] [added: our Collection and Disposal businesses increased in 2022, as] compared with [removed: $2,965 million, or 16.5% of revenues, in 2021. The increase in the current year was] [added: 2021,] primarily [removed: driven by] [added: due to] revenue growth in our collection and disposal [removed: lines of business] [added: operations] driven by both yield and [removed: volume,] [added: volume. This increase was] partially offset by (i) inflationary cost pressures; (ii) labor cost increases from frontline employee wage [removed: adjustments;] [added: adjustments and] (iii) [removed: non-cash] [added: divestitures,] asset [removed: impairments;] [added: impairments] and [removed: (iv) reduced profitability] [added: unusual items discussed below] in [added: _(Gain) Loss from Divestitures, Asset Impairments and Unusual Items, Net_, that impacted] our [removed: recycling business;] [added: East Tier results.] |
| | ● | Net income attributable to Waste Management, Inc. was [removed: $2,238] [added: $2,304] million, or [removed: $5.39] [added: $5.66] per diluted share, compared with [removed: $1,816] [added: $2,238] million, or [removed: $4.29] [added: $5.39] per diluted share, in [removed: 2021.] [added: 2022.] The increase in income from [removed: operations, as] [added: operations] discussed [removed: above, in addition to a net loss on early extinguishment of debt of $220 million in 2021 that did not repeat in 2022, drove an increase in net income;] [added: above was partially offset by higher interest and income tax expense;] |
[removed: | | ● | Net cash provided] [added: _Net Cash Provided] by [added: Operating Activities —_ Our] operating [removed: activities was $4,536 million] [added: cash flows increased] in [removed: 2022,] [added: 2023, as] compared with [removed: $4,338 million in 2021. The increase in net cash provided] [added: 2022,] by [removed: operating activities was] [added: $183 million primarily] driven by [removed: (i) an increase in] [added: higher] earnings [added: attributable to our Collection] and [removed: (ii)] [added: Disposal businesses and] lower [removed: interest payments during 2022. These results were partially offset by higher] income tax payments [removed: in 2022 primarily] as a result of [removed: higher pre-tax earnings and] a deposit of approximately $103 million that was made to the [removed: Internal Revenue Service (“IRS”)] [added: IRS in 2022] related to a disputed tax [removed: matter. The Company expects to seek a refund of the entire amount deposited with the IRS and litigate any denial of the claim for refund. See] [added: matter discussed within] Note 8 to the Consolidated Financial [removed: Statements for further discussion; and |][added: Statements.]
| | ● | Free cash flow was [removed: $1,976] [added: $1,902] million in [removed: 2022,] [added: 2023,] compared with [removed: $2,530] [added: $1,976] million in [removed: 2021.] [added: 2022.] The decrease in free cash flow is primarily attributable to [removed: (i) an] [added: the] increase in capital spending, primarily driven by our [removed: intentional investment in sustainability growth projects as well as timing differences] [added: planned and ongoing investments] in our [removed: fixed] [added: Recycling Processing and Sales and WM Renewable Energy segments and higher capital] asset purchases [added: in the current year] to support our [removed: ongoing operations] [added: Collection] and [removed: (ii) higher income tax payments in 2022. This] [added: Disposal businesses. The] decrease was partially offset by [removed: increased earnings] [added: the increase] in [removed: 2022.] [added: net cash provided by operating activities discussed above and higher proceeds from divestitures of businesses and other assets.] Free cash flow is a non-GAAP measure of liquidity. Refer to _Free Cash Flow_ below for our definition of free cash flow, additional information about our use of this measure, and a reconciliation to net cash provided by operating activities, which is the most comparable GAAP measure. |
The mix of operating revenues [removed: from our major lines of business] for the year ended December 31 are as follows (in millions):
| | | [added: 2023] | [added: | | | | |] 2022 | | | [added: | | |] 2021 | | | [removed: 2020] | [added: ] |
This discussion may contain forward-looking statements.
See “Cautionary Statement about Forward-Looking Statements” in Part I of this Annual Report on Form 10-K for more information.
Forward-looking statements are subject to certain risks and uncertainties that could cause actual results to differ materially from our historical experience and our present expectations or anticipated results.
These risks and uncertainties include, but are not limited to, those described in Part I, “Item 1A.
_Risk Factors_” and elsewhere in this report and may also be described from time to time in our future reports filed with the U.S. Securities and Exchange Commission (“SEC”).
of fuel that we allocate to our natural gas fleet.
To enhance transparency regarding our financial performance, highlight the strength and consistency of our core solid waste businesses, and underscore our commitment to sustainability through planned and ongoing investments in our Recycling Processing and Sales and WM Renewable Energy businesses, beginning in the fourth quarter of 2023, our senior management revised its segment reporting to (i) reflect the financial results of our collection, transfer, disposal and resource recovery service businesses independently; (ii) combine the results of all recycling facilities from our East and West Tier segments with our recycling brokerage and sales activities to form a newly created Recycling Processing and Sales reportable segment and (iii) include our WM Renewable Energy business as a reportable segment.
Accordingly, our senior management now evaluates, oversees and manages the financial performance of our business through four reportable segments, referred to as (i) Collection and Disposal East Tier (“East Tier”); (ii) Collection and Disposal - West Tier (“West Tier”); (iii) Recycling Processing and Sales and (iv) WM Renewable Energy.
Our East and West Tiers along with certain ancillary services not managed through our Tier segments, but that support our collection and disposal operations, form our “Collection and Disposal” businesses.
Collection and Disposal
Our Collection and Disposal businesses provide integrated environmental services, including collection, transfer, disposal and resource recovery services.
We evaluate our Collection and Disposal businesses primarily through two geographic segments, East Tier and West Tier.
Additionally, we provide certain ancillary services (“Other Ancillary”) that are not managed through the Tier segments but that support our collection and disposal operations.
Other Ancillary includes specialized services performed for customers that have differentiated needs.
These specialized services are targeted at large industrial customers managed through our Sustainability and Environmental Solutions (“SES”) business or geographically dispersed customers managed through our Strategic Business Solutions (“WMSBS”) business.
Included within our Collection and Disposal businesses are landfills having (i) 21 third-party power generating facilities converting our landfill gas to fuel electricity generators; (ii) 14 third-party renewable natural gas (“RNG”) facilities processing landfill gas to be sold to natural gas suppliers and (iii) two third-party projects delivering our landfill gas by pipeline to industrial customers as a direct substitute for fossil fuels in industrial processes.
In return for providing our landfill gas, we receive royalties from each facility, including the benefit of a 15% royalty from our WM Renewable Energy segment based on net operating revenue generated through the sale of RNG, renewable identification numbers (“RINs”), electricity and capacity, Renewable Energy Credits (“RECs”) and related environmental attributes from the 83 landfill beneficial use renewable energy projects owned by WM Renewable Energy on our active landfills, which is eliminated in consolidation.
Recycling Processing and Sales
Our Recycling Processing and Sales segment includes the processing and sales of materials collected from residential, commercial and industrial customers.
The materials are delivered to and processed at one of our many recycling facilities.
Through our brokerage business, we also manage the marketing of recycling commodities that are processed in our facilities and by third parties by maintaining comprehensive service centers that continuously analyze market prices, logistics, market demands and product quality.
Our Recycling Processing and Sales segment excludes the collection of recycled materials from our residential, commercial, and industrial customers which is included within our Collection and Disposal businesses.
WM Renewable Energy
Our WM Renewable Energy segment develops, operates and promotes projects for the beneficial use of landfill gas.
Landfill gas is produced naturally as waste decomposes in a landfill.
The methane component of the landfill gas is a readily available, renewable energy source that can be gathered and used beneficially as an alternative to fossil fuel.
WM Renewable Energy converts landfill gas into several sources of renewable energy to be sold which include RNG, electricity and capacity, heat and/or steam.
WM Renewable Energy also generates and sells (i) RINs under the Renewable Fuel Standard (“RFS”) program; (ii) other credits under a variety of state programs associated with the use of RNG in our compressed natural gas fleet and (iii) RECs associated with the production of electricity.
The RINs, RECs, and other credits are sold to counterparties who are obligated under the regulatory programs and have a responsibility to procure RINs, RECs, and other credits proportionate to their fossil fuel production and imports.
RINs and RECs prices generally fluctuate in response to regulations enacted by the Environmental Protection Agency (“EPA”) or other regulatory bodies, as well as changes in supply and demand.
As of December 31, 2023, we had 92 landfill gas beneficial use projects producing commercial quantities of methane gas at owned or operated landfills.
For 66 of these projects, the processed gas is used to fuel electricity generators.
The electricity is then sold to public utilities, municipal utilities or power cooperatives.
For 20 of these projects, the gas is used at the landfill or delivered by pipeline to industrial customers as a direct substitute for fossil fuels in industrial processes.
For six of these projects, the landfill gas is processed to pipeline quality RNG and then sold to natural gas suppliers.
The revenues from these facilities are primarily generated through the sale of RNG, RINs, electricity and capacity, RECs and related environmental attributes.
WM Renewable Energy is charged a 15% royalty on net operating revenue from these facilities residing on our active and closed landfills from our Collection and Disposal, and Corporate and Other businesses, which is eliminated in consolidation.
Additionally, WM Renewable Energy operates and maintains 12 third-party landfill beneficial gas use projects in return for service revenue.
Our Collection and Disposal and Corporate and Other businesses benefit from these projects as well as 32 additional third-party landfill beneficial gas use projects in the form of royalties.
Corporate and Other
This discussion may contain forward-looking statements that anticipate results based on management’s plans that are subject to uncertainty.
We discuss in more detail various factors that could cause actual results to differ materially from expectations in Item 1A.
_Risk_ _Factors_.
Our senior management evaluates, oversees and manages the financial performance of our Solid Waste operations through two operating segments.
Each of our Solid Waste operating segments provides integrated environmental services, including collection, transfer, recycling, and disposal.
We also provide additional services that are not managed through our Solid Waste business, described under _Results of Operations_ below.
inflation.
This next phase will prioritize reduced labor dependency on certain high-turnover jobs, particularly in customer experience, recycling and residential collection.
We continue to make these investments to further digitalize our customer self-service and implement technologies to further enhance the safety, reliability and efficiency of our collection operations.
While demand for recyclables generally continues to trend upwards, during the second half of 2022, we saw significant declines in commodity prices for recycled materials, and we expect continued significant headwinds from commodity prices for recycled material into 2023, resulting from the slowdown in the global economy, which reduced retail demand and the corresponding need for cardboard packaging to ship retail goods.
We are also currently experiencing margin pressures from other commodity-driven business impacts, particularly from higher fuel prices.
The constrained labor market has resulted in increased costs for wage adjustments, overtime hours and training new hires.
Geopolitical conflict and the resulting international response, including Russia’s invasion of Ukraine, have also exacerbated market disruption, leading to volatility in commodity prices, impacts on the availability and cost of energy, and vendor and supplier disruptions across the global supply chain.
Acquisition of Advanced Disposal Services, Inc. (“Advanced Disposal”)
On October 30, 2020, we completed our acquisition of all outstanding shares of Advanced Disposal for $30.30 per share in cash, pursuant to an Agreement and Plan of Merger dated April 14, 2019, as amended on June 24, 2020.
Total enterprise value of the acquisition was $4.6 billion when including approximately $1.8 billion of Advanced Disposal’s net debt.
This acquisition grew our footprint and allows us to provide differentiated, sustainable waste management and recycling services to approximately three million new commercial, industrial and residential customers primarily located in the Eastern half of the U.S. In connection with our acquisition of Advanced Disposal, we and Advanced Disposal entered into an agreement that provided for GFL Environmental to acquire a combination of assets from us and Advanced Disposal
to address divestitures required by the U.S. Department of Justice.
Immediately following the acquisition, the divestiture transactions were consummated and the Company subsequently received cash proceeds from the sale of $856 million.
For the year ended December 31, 2022 and 2021, we incurred integration related costs of $10 million and $51 million, respectively, and for the year ended December 31, 2020, we incurred acquisition and integration related costs of $156 million, which were primarily classified as “Selling, general and administrative expenses”.
The post-closing operating results of Advanced Disposal have been included in our consolidated financial statements, within our existing reportable segments.
Post-closing through December 31, 2020, Advanced Disposal recognized $205 million, $142 million and $60 million of revenue, operating expenses and selling, general and administrative expenses, respectively, which are included in our Consolidated Statement of Operations.
COVID-19 Impact
The impacts of COVID-19 on the global economy increased rapidly during the second quarter of 2020, affecting our business in most geographies and across a variety of our customer types.
Over the past two years, our volumes have recovered, largely exceeding volumes from the pre-pandemic levels in 2019.
While we continue to be optimistic about North America’s overall economic recovery from the impacts of the COVID-19 pandemic.
A significant future resurgence in transmission of COVID-19, a significant new virus variant, or other pandemic conditions that result in business closures and social restrictions could adversely impact our volumes and costs in the future.
We were able to achieve these results despite high inflationary cost pressures.
Despite the significant downturn in commodity prices for recyclable materials in the second half of the year, we remain committed to our investment in recycling automation, which reduces costs and increases throughput, positioning us to overcome commodity price headwinds and deliver a differentiated service.
| | ● | Revenues of $19,698 million for 2022 compared with $17,931 million in 2021, an increase of $1,767 million, or 9.9%. The increase is primarily attributable to (i) higher yield in our collection and disposal lines of business; (ii) increases from our fuel surcharge program and (iii) higher volume in our collection and disposal lines of business; |
| --- | --- | --- |
| | ● | Selling, general and administrative expenses of $1,938 million in 2022, or 9.8% of revenues, compared with $1,864 million, or 10.4% of revenues, in 2021. The $74 million increase is primarily attributable to (i) higher costs associated with our strategic investments in our digital platform and sustainability initiatives; (ii) increased labor costs primarily from higher annual incentive compensation costs and merit increases; (iii) increased |
We also provide additional services that are not managed through our Solid Waste business, including both our Strategic Business Solutions (“WMSBS”) and Sustainability and Environmental Services (“SES”) businesses, which include landfill gas-to-energy services, environmental solutions services and recycling brokerage services.
We also offer
certain other expanded service offerings and solutions.
| | | | | | | | | | | |
| --- | --- | --- | --- | --- | --- | --- | --- | --- | --- | --- |
| Commercial | | | $ | 5,450 | | $ | 4,760 | | $ | 4,102 |
| Industrial | | | | 3,681 | | | 3,210 | | | 2,770 |
| Other collection | | | | 699 | | | 533 | | | 465 |
An excerpt. Shown here: 40 of 264 rewritten, 40 of 209 added and 40 of 184 removed. The counts are complete. For every sentence, read Item 7. Management’s Discussion and Analysis of Financial Condition and Results of Operations. in the FY2023 filing and the FY2022 filing.
Item 7A. Quantitative and Qualitative Disclosures about Market Risk.
14 rewritten, 16 added, 8 removed, 18 unchanged
The Company had no derivatives outstanding as of December 31, [removed: 2022.][added: 2023.]
As of December 31, [removed: 2022,] [added: 2023,] we had [removed: $15.1] [added: $16.4] billion of long-term debt, excluding the impacts of accounting for debt issuance costs, discounts and fair value adjustments attributable to terminated interest rate derivatives.
We have [removed: $3.5] [added: $2.5] billion of debt that is exposed to changes in market interest rates within the next 12 months comprised primarily of (i) [removed: $1.7 billion] [added: $860 million] of short-term borrowings under our commercial paper [removed: program;] [added: program and] (ii) [removed: $1.0] [added: $1.6] billion of [removed: long-term borrowings under our $1.0 billion, two-year, U.S. term credit agreement and (iii) $725 million of] tax-exempt bonds with term interest rate periods that expire within the next 12 months.
We currently estimate that a 100-basis point increase in the interest rates of our outstanding variable-rate debt obligations would increase our [removed: 2023] [added: 2024] interest expense by [removed: $28] [added: $18] million.
An instantaneous, 100-basis point increase in interest rates across all maturities attributable to these instruments would have decreased the fair value of our debt by approximately [removed: $700] [added: $900] million as of December 31, [removed: 2022.][added: 2023.]
We also invest a portion of our restricted trust fund account balances in available-for-sale securities, including U.S. Treasury securities, U.S. agency securities, municipal securities, mortgage- and asset-backed securities, which generally mature over the next [removed: nine] [added: ten] years, as well as equity securities.
Recycling revenues attributable to yield [removed: increased $19] [added: decreased $308] million and [removed: $537] [added: increased $19] million in [removed: 2022] [added: 2023] and [removed: 2021,] [added: 2022,] respectively, as compared with the prior year [removed: periods, primarily from higher market prices for recycling commodities in 2021 and the first half of 2022, before the significant downturn in the second half of 2022.][added: periods.]
Average market prices for [removed: recycling] [added: single-stream recycled] commodities [removed: at the Company’s facilities] were [removed: approximately 10% lower] [added: down 40%] and [removed: 115% higher] [added: 10%] in [removed: 2022] [added: 2023] and [removed: 2021,] [added: 2022,] respectively, [removed: when] [added: as] compared [removed: with] [added: to] the prior year periods.
[removed: At the federal level, oil] [added: Oil] refiners and importers are required through the RFS program to blend specified volumes of [added: various categories of] renewable transportation fuels with gasoline or buy credits, referred to as renewable identification numbers (“RINs”), from renewable fuel producers.
[removed: RINs] [added: RIN] prices generally respond to regulations enacted by the EPA, as well as fluctuations in supply and demand.
The value of the RINs associated with RNG is set through a market established by the [added: RFS] program.
Prior to 2022, the EPA [removed: has] [added: had] promulgated rules on an annual basis establishing refiners’ obligations to purchase RNG and other cellulosic biofuels under the RFS [removed: program; however, the EPA issued a highly anticipated proposed rule in late 2022 setting forth the direction of] [added: program, which introduced uncertainty and volatility into] the [removed: RFS program for compliance years 2023 through 2025.][added: renewable fuels and RINs market.]
We continue to advocate for the current [added: federal] administration to implement policies that [added: could reduce the potential for volatility in the RINs market and] ensure [removed: long term] [added: long-term] stability for renewable transportation [removed: fuels] [added: fuels, as changes in the RFS market or the structure of the RFS program can] and [removed: expand opportunities for] [added: has impacted] the [removed: biogas sector] [added: financial performance of the facilities constructed] to [removed: participate in] [added: capture and treat] the [removed: RFS program.][added: gas.]
[removed: _Currency Rate Exposure —_ We] [added: Additionally, we] have [removed: operations in Canada as well as] certain support functions in India.
With the significant decline in commodity prices that started in the second half of 2022 from their all-time highs and has continued into 2023, we are currently experiencing margin pressures from our commodity-driven businesses.
We have invested, and continue to invest, in facilities to capture methane produced from the Company’s landfills and convert it into renewable natural gas (“RNG”) and electricity.
RNG produced from our landfills, as well as dairy biogas, constitute a significant source of fuel allocated to our natural gas collection vehicles.
The Company’s investment in renewable energy production is guided partly by the EPA’s implementation of the Renewable Fuel Standard (“RFS”) program, which promotes the production and use of renewable transportation fuels.
Many of our facilities are EPA-registered producers of transportation fuel making compressed and RNG from landfill biogas, which qualifies as a cellulosic biofuel under the RFS program.
However, in 2023, the EPA issued a highly anticipated rule establishing biofuel blending volumes under the RFS program for compliance years 2023 through 2025.
The rule reflected the outsized role of biogas under the program, delivered on many reforms that benefit the solid waste sector, and recognized the continued growth of the market for RNG in vehicle applications.
However, we cannot be certain that these changes, or the outcome of litigation challenging various aspects of the rule, will ultimately reduce volatility in the RINs market or that future rulemakings will be similarly favorable to our business.
Revenue in our WM Renewable Energy segment declined $73 million and increased $48 million in 2023 and 2022, respectively, as compared to the prior year periods, primarily driven by the fluctuations in energy and RIN market prices.
The Company’s sustainability growth strategy also is informed by the increased adoption of state and Canadian clean fuel standard programs, utility policies, and voluntary market demand for RNG in transportation and industrial applications.
Clean fuel standard programs, originally developed in California and subsequently adopted in Oregon and Washington, establish annual carbon intensity benchmarks for transportation fuels that decrease over time.
These programs operate similar to the RFS program in that certain regulated parties purchase credits from fuel producers, including RNG producers, to meet their carbon intensity obligations.
Like RINs, clean fuel standard program credit values can fluctuate with policy and market dynamics.
As such, we are advocating for existing programs to adopt measures to promote stability in credit pricing and for other states to adopt similar programs that incentivize the growth in RNG.
We also are working closely with stakeholders to encourage the voluntary market for RNG demand, including utility RNG procurement programs, and sustainability protocols, as companies and other customers increasingly look to reduce their greenhouse gas emissions profiles.
_Currency Rate Exposure —_ Our operations are primarily in the U.S. but we also have significant operations in Canada.
Demand for recycled materials strengthened through 2021 and into early 2022, primarily driven by the growth in e-commerce, businesses re-opening, and manufacturers committing to use more recycled content in their packaging.
In 2022, we experienced all-time high recycling commodity pricing in the first half of the year to be followed by historically low pricing through the second half of the year, resulting from the slowdown in the global economy, which reduced retail demand and the corresponding need for cardboard packaging to ship retail goods.
We expect significant commodity price headwinds to continue into 2023.
Revenue decline from lower commodity pricing was offset by higher pricing in our recycling brokerage business as well as our continued focus on a fee-based pricing model that ensures fees paid by customers cover the cost of processing materials and the impact on our cost structure of managing contamination in the recycling stream.
The primary drivers of renewable fuel development at our landfills are tax policies, such as the recently expanded federal tax credits for renewable natural gas (“RNG”) production and renewable electricity generation, and federal and state incentive programs, such as the federal Renewable Fuel Standard (“RFS”) program and the California Low Carbon Fuel Standard.
The Company has invested, and continues to invest, in facilities that capture and convert landfill gas into RNG, and also works with facilities that capture and convert dairy digester gas into RNG, so that we can participate in the program, and the Company has stated its intention to grow its asset base to notably increase its RNG production by 2026.
Although this proposal delivers on many reforms that benefit the solid waste sector, the EPA’s programmatic shift towards multi-year standards could lead to market uncertainty and volatility in the price of RINs.
Changes in the RFS market, the structure of the RFS program or RINs prices and demand can and has impacted the financial performance of the facilities constructed to capture and treat the gas.
Item 1. Business.
114 rewritten, 102 added, 57 removed, 203 unchanged
We partner with our [removed: residential, commercial, industrial and municipal] customers and the communities we serve to manage and reduce waste at each stage from collection to disposal, while recovering valuable resources and creating clean, renewable energy.
Our [removed: “Solid Waste”] [added: solid waste] business is operated and managed locally by our subsidiaries that focus on distinct geographic areas and provide collection, transfer, disposal, [removed: and] recycling and resource recovery services.
Through our subsidiaries, including our Waste Management Renewable Energy (“WM Renewable Energy”) business, we are also a leading developer, operator and owner of landfill gas-to-energy facilities in the U.S. and Canada that produce renewable electricity and renewable natural gas, which is a significant source of fuel [removed: for] [added: that we allocate to] our natural gas fleet.
During [removed: 2022,] [added: 2023,] our largest customer represented less than 5% of annual revenues.
We own or operate [removed: 259] [added: 263] landfill sites, which is the largest network of landfills throughout the U.S. and Canada.
In order to make disposal more practical for larger urban markets, where the distance to landfills is typically farther, we manage [removed: 337] [added: 332] transfer stations that consolidate, compact and transport waste efficiently and economically.
We have enabled a people-first, technology-led focus to drive our mission to maximize resource value, while minimizing environmental impact, [removed: so that both our economy] and [removed: our environment are positively impacted.][added: sustainability and environmental stewardship is embedded in all that we do.]
Simultaneously, we believe [removed: the combination of cost control and] [added: that] investing in automation to improve processes and drive operational efficiency [added: combined with a focus on the cost to serve our customer] will yield an attractive [removed: total cost structure] [added: profit margin] and enhanced service quality.
[removed: improve existing diversion technologies, such as through investments in our recycling operations, we] [added: We] are also evaluating and pursuing emerging diversion technologies that may generate additional value.
We believe that execution of our strategy will deliver shareholder value and leadership in a dynamic industry and [removed: challenging] [added: in any] economic environment.
In December [removed: 2022,] [added: 2023,] we announced that our Board of Directors expects to increase the quarterly dividend from [removed: $0.65 to] $0.70 [added: to $0.75] per share for dividends declared in [removed: 2023,] [added: 2024,] which is a [removed: 7.7%] [added: 7.1%] increase from the quarterly dividends we declared in [removed: 2022.][added: 2023.]
This is an indication of our ability to generate strong and consistent cash flows and marks the [removed: 20th] [added: 21st] consecutive year of dividend increases.
Collection involves picking up and transporting waste and recyclable materials from where it was generated to a transfer station, [removed: material recovery] [added: recycling] facility [removed: (“MRF”)] or disposal site.
| | [added: ●] | [added: For most residential collection services, we have a contract with, or a franchise granted by, a municipality, homeowners’ association or some other regional authority that gives us the exclusive right to service all or a] portion of the homes in an area. These contracts or franchises are typically for periods of three to ten [removed: years.] [added: years and typically mirror maximum terms as allowed by statutes by state.] We also provide services under individual monthly subscriptions directly to households. The fees for residential collection are either paid by the municipality or authority from their tax revenues or service charges, or are paid directly by the residents receiving the service. The Company is generally phasing out traditional manual systems and moving to further automate residential collection services. Benefits of automation include enhanced worker safety, improved service delivery to the customer and an overall reduction in the cost to provide services. |
As of December 31, [removed: 2022,] [added: 2023,] we owned or operated [removed: 254] [added: 258] solid waste landfills and five secure hazardous waste landfills, which represents the largest network of landfills throughout the U.S. and Canada.
As of December 31, [removed: 2022,] [added: 2023,] we owned or controlled the management of [removed: 231] [added: 237] sites with remedial activities, that are in closure or that have received a certification of closure from the applicable regulatory agency.
The significant capital requirements of developing and operating a landfill serve as a barrier to landfill ownership and, thus, [removed: third-party haulers often dispose of waste at our landfills.]
_Transfer._ As of December 31, [removed: 2022,] [added: 2023,] we owned or operated [removed: 337] [added: 332] transfer stations in the U.S. and Canada.
There are some instances where transfer stations are operated under contract, generally [added: for municipalities.]
[removed: _Recycling._] Recycling involves the separation of reusable materials from the waste stream for processing and resale or other disposition.
We not only collect materials from households and businesses across the U.S. and Canada, we also sell them to manufacturers to be recycled and sold [removed: in] [added: generally within] the North American market.
In addition to advancing our single stream recycling programs for commercial applications, we continue to invest in recycling technologies and [removed: businesses,] [added: businesses] designed to offer services and solutions to support and grow our current [removed: operations, including our recent purchase of a controlling interest in a business intended to accelerate our film and plastic wrap recycling capabilities.][added: operations.]
We are investing in enhanced [removed: MRF] [added: recycling facility] technology at new and existing facilities to benefit labor productivity, support increased recycling capacity and allow for dynamic adjustments to respond to evolving end-market demands.
In [removed: 2022,] [added: 2023,] we opened [removed: five] [added: eight] new [removed: MRFs] [added: recycling facilities] within the U.S. [added: and Canada] equipped with advanced recycling technology.
We continue to invest in [removed: MRF] [added: recycling facility] automation [removed: in several] [added: and new] markets across the U.S. [removed: Our recycling operations include the following:][added: and Canada.]
_Materials processing —_ Through our collection operations and third-party customer base, we collect recyclable materials from residential, commercial and industrial customers and direct these materials to one of our [removed: MRFs] [added: recycling facilities] for processing.
As of December 31, [removed: 2022,] [added: 2023,] we operated [removed: 97 MRFs,] [added: 102 recycling facilities,] of which [removed: 46] [added: 44] are single stream, where cardboard, paper, glass, metals, plastics, construction and demolition materials and other recycling commodities are recovered for resale or redirected for other purposes.
We manage the marketing of recycling commodities that are processed in our facilities by [removed: maintaining comprehensive service centers that] continuously [removed: analyze] [added: analyzing] market prices, logistics, market demands and product [removed: quality.][added: quality through our dedicated recycling service centers and account managers.]
Utilizing the resources and [removed: knowledge] [added: capabilities] of our recycling [removed: operations’] service [removed: centers,] [added: centers and account managers,] we can assist customers in marketing and selling their recycling commodities with minimal capital requirements.
The recyclable materials processed in our [removed: MRFs] [added: recycling facilities] are received from various sources, including third parties and our own operations.
[removed: _Other._] Other [added: businesses providing collection and disposal] services [removed: we provide] include the following:
WM Renewable Energy [removed: produces renewable natural gas (“RNG”) from landfill gas and] [added: also] generates [removed: renewable identification numbers (“RINs”)] [added: RINs] under the Renewable Fuel Standard (“RFS”) [removed: program and] [added: program,] other credits under a variety of state programs associated with the use of RNG in our compressed natural gas [removed: fleet.][added: fleet, and RECs associated with the production of electricity.]
The [removed: RINs] [added: RINs, RECs] and [added: other] credits are sold to counterparties who are obligated under the regulatory programs and have a responsibility to procure [removed: RINs] [added: RINs, RECs] and [added: other] credits proportionate to their fossil fuel production and imports.
RINs [added: and RECs] prices generally respond to regulations enacted by the EPA or other regulatory bodies, as well as fluctuations in supply and demand.
[removed: WM Renewable Energy currently has five owned facilities producing 3.5 million MMBtu of RNG annually and the revenue] [added: The revenues] from these facilities [removed: is] [added: are] primarily generated through the sale of [removed: natural gas, RINs] [added: RNG, RINs, electricity] and [added: capacity, RECs and] related environmental attributes.
[removed: | | ● |] _Strategic Business Solutions (“WMSBS”)_ — Although many waste management services such as collection and disposal are local services, our WMSBS business works with customers whose locations span the U.S. and Canada. [removed: Our strategic accounts program provides these customers with streamlined service, enhanced reporting, measurement tools aimed at meeting sustainability objectives and centralized billing and management of accounts. |]
The solutions and services include (i) waste collection, processing, and recycling; (ii) the development, operation and marketing [added: of waste processing facilities and technologies; (iii) operation of RNG plants and (iv) the development and operation of organic recycling technologies.]
[removed: On the other hand,] [added: Conversely,] certain destructive weather and climate conditions, such as wildfires in the Western U.S. and hurricanes that most often impact our operations in the Southern and Eastern U.S. during the second half of the year, can increase our revenues in the geographic areas affected as a result of the waste volumes generated by these events.
As of December 31, [removed: 2022,] [added: 2023,] we had approximately [removed: 49,500] [added: 48,000] full-time employees across the U.S., Canada and India.
Approximately [removed: 46,300 employees were located within the U.S. and 3,200 employees were located outside of the U.S. Approximately 8,500] [added: 8,400] employees were employed in administrative and sales positions with the remainder in operations.
We are furthering our strategy of focused differentiation and continuous improvement beyond our traditional waste operations through our sustainability growth strategy that includes significant planned investments in our WM Renewable Energy and Recycling Processing and Sales businesses, while increasing automation and reducing labor dependency.
To enhance transparency regarding our financial performance, highlight the strength and consistency of our core solid waste businesses, and underscore our commitment to sustainability through planned and ongoing investments in our Recycling Processing and Sales, and WM Renewable Energy businesses, beginning in the fourth quarter of 2023, our senior management revised its segment reporting to (i) reflect the financial results of our collection, transfer, disposal and resource recovery services businesses independently; (ii) combine the results of all recycling facilities from our East and West Tier segments with our recycling brokerage and sales activities to form a newly created Recycling Processing and
Sales reportable segment and (iii) include our WM Renewable Energy business as a reportable segment.
Accordingly, our senior management now evaluates, oversees and manages the financial performance of our business through four reportable segments, referred to as (i) Collection and Disposal - East Tier (“East Tier”); (ii) Collection and Disposal - West Tier (“West Tier”); (iii) Recycling Processing and Sales and (iv) WM Renewable Energy.
Our East and West Tiers, along with certain ancillary services (“Other Ancillary”) not managed through our Tier segments, but that support our collection and disposal operations, form our “Collection and Disposal” businesses.
We also provide additional services not managed through our four reportable segments, which are presented as Corporate and Other.
For further discussion refer to Note 19 of our Consolidated Financial Statements.
Reclassifications have been made to our prior period consolidated financial information to conform to the current year presentation.
Collection and Disposal
Services provided through our Collection and Disposal businesses are described below:
third-party haulers often dispose of waste at our landfills.
Included within our Collection and Disposal businesses are landfills having (i) 21 third-party power generating facilities converting our landfill gas to fuel electricity generators; (ii) 14 third-party renewable natural gas (“RNG”) facilities processing landfill gas to be sold to natural gas suppliers and (iii) two third-party projects delivering our landfill gas by pipeline to industrial customers as a direct substitute for fossil fuels in industrial processes.
In return for providing our landfill gas, we receive royalties from each facility, including the benefit of a 15% royalty from our WM Renewable Energy segment based on net operating revenue generated through the sale of RNG, renewable identification numbers (“RINs”), electricity and capacity, Renewable Energy Credits (“RECs”) and related environmental attributes from the 83 landfill beneficial use renewable energy projects owned by WM Renewable Energy on our active landfills, which is eliminated in consolidation.
_Other_.
Our strategic accounts program provides these customers with streamlined service, enhanced reporting, measurement tools aimed at meeting sustainability objectives and centralized billing and management of accounts.
_Sustainability and Environmental Solutions (“SES”)_ — Our SES business collaborates with our geographic areas and WMSBS team to offer our customers end-to-end solutions that help businesses achieve their sustainability, recycling and waste diversion goals while meeting industry-specific compliance requirements and rising environmental demands.
These solutions include (i) Sustainability Services, where our employees provide full-service waste management solutions and consulting services, working full-time onsite at our customers’ facilities or through remote-managed programs (this service is managed through our SES business but reflected principally in our collection line of business); (ii) remediation and construction services; (iii) management and marketing of fly ash, which is residue generated from the combustion of coal to generate electricity; and (iv) industrial waste services, which uses thermal and mechanical separation technologies to minimize waste volumes and recover commodities at the point of generation.
The breadth of these service offerings, combined with our large and expanding network of technology-enabled infrastructure in recycling, organics, and renewable energy give us the ability to help customers reduce the amount of waste they generate, identify recycling opportunities, and determine efficient and environmentally friendly means for waste collection and disposal.
Through these services, we aim to help customers increase circularity and accelerate their decarbonization goals.
Recycling Processing and Sales
Our Recycling Processing and Sales segment includes the following:
We develop, operate and promote projects for the beneficial use of landfill gas through our WM Renewable Energy businesses.
Landfill gas is produced naturally as waste decomposes in a landfill.
The methane component of the landfill gas is a readily available, renewable energy source that can be gathered and used beneficially as an alternative to fossil fuel.
The U.S. Environmental Protection Agency (“EPA”) endorses landfill gas as a renewable energy resource, in the same category as wind, solar and geothermal resources.
As of December 31, 2023, we had 92 landfill gas beneficial use projects producing commercial quantities of methane gas at owned or operated landfills.
For 66 of these projects, the processed gas is used to fuel electricity generators.
The electricity is then sold to public utilities, municipal utilities or power cooperatives.
For 20 of these projects, the gas is used at the landfill or delivered by pipeline to industrial customers as a direct substitute for fossil fuels in industrial processes.
For six of these projects, the landfill gas is processed to pipeline-quality RNG and then sold to natural gas suppliers.
WM Renewable Energy is charged a 15% royalty on net operating revenue from these facilities residing on our active and closed landfills from our Collection and Disposal, and Corporate and Other businesses, which is eliminated in consolidation.
Additionally, WM Renewable Energy operates and maintains 12 third-party landfill beneficial gas use projects in return for service revenue.
Our Collection and Disposal and Corporate and Other businesses benefit from these projects as well as 32 additional third-party landfill beneficial gas use projects in the form of royalties.
WM Renewable Energy converts landfill gas into several sources of renewable energy, which include RNG, electricity and capacity, heat and/or steam.
Corporate and Other
We also provide additional services that are not managed through our operating segments, which are presented in this report as Corporate and Other as they do not meet the criteria to be aggregated with other operating segments and do not meet the quantitative criteria to be separately reported.
This includes the activities of our corporate office, including costs associated with our long-term incentive program, expanded service offerings and solutions (such as our investments in businesses and technologies that are designed to offer services and solutions ancillary or supplementary to our current operations) as well as our closed sites.
Included within our Corporate and Other businesses are closed sites that include (i) five third-party power generating facilities converting our landfill gas to fuel electricity generators; (ii) one third-party project delivering our landfill gas by pipeline to industrial customers as a direct substitute for fossil fuels in industrial processes and (iii) one third-party RNG processing landfill gas to be sold to natural gas suppliers in return for a royalty.
Additionally, Corporate and Other benefits
from a 15% royalty from our WM Renewable Energy segment based on net operating revenue generated through the sale of RNG, RINs, electricity and capacity, RECs and related environmental attributes from the nine landfill beneficial use renewable energy projects owned by WM Renewable Energy on our closed sites, which is eliminated in consolidation.
We employed approximately 49,500 people as of December 31, 2022.
As North America’s leading provider of comprehensive environmental solutions, sustainability and environmental stewardship is embedded in all that we do.
While we continue to
Our senior management evaluates, oversees and manages the financial performance of our Solid Waste operations through two operating segments.
Each of our Solid Waste operating segments provides integrated environmental services, including collection, transfer, recycling, and disposal.
The East and West Tiers are presented in this report and constitute our existing Solid Waste business.
On October 30, 2020, we acquired Advanced Disposal Services, Inc. (“Advanced Disposal”), the operations of which are presented in this report within our existing Solid Waste tiers.
Additional information related to our acquisition of Advanced Disposal and segments is included in Notes 17 and 19 to the Consolidated Financial Statements, respectively.
We also provide additional services that are not managed through our Solid Waste business, as described below.
These operations are presented in this report as “Other.” The services we provide are described below.
| --- | --- | --- |
| | ● | For most residential collection services, we have a contract with, or a franchise granted by, a municipality, homeowners’ association or some other regional authority that gives us the exclusive right to service all or a |
for municipalities.
| | ● | _WM Renewable Energy_ — We develop, operate and promote projects for the beneficial use of landfill gas through our WM Renewable Energy business. Landfill gas is produced naturally as waste decomposes in a landfill. The methane component of the landfill gas is a readily available, renewable energy source that can be gathered and used beneficially as an alternative to fossil fuel. The U.S. Environmental Protection Agency (“EPA”) endorses landfill gas as a renewable energy resource, in the same category as wind, solar and geothermal resources. As of December 31, 2022, we had 135 landfill gas beneficial use projects producing commercial quantities of methane gas at owned or operated landfills. For 95 of these projects, the processed gas is used to fuel electricity generators. The electricity is then sold to public utilities, municipal utilities or power cooperatives. For 23 of these projects, the gas is used at the landfill or delivered by pipeline to industrial customers as a direct substitute for fossil fuels in industrial processes. For 17 of these projects, the landfill gas is processed to pipeline-quality natural gas and then sold to natural gas suppliers. |
We are also modernizing our landfills and expanding our network of renewable natural gas facilities.
Together, these robust solutions will make us a better advisor to our customers while supporting our own sustainability goals.
| | ● | _Sustainability and Environmental Solutions (“SES”)_ — Our SES business offers our customers a variety of services in collaboration with our Areas and strategic accounts programs, including (i) construction and remediation services; (ii) services associated with the disposal of fly ash, which is residue generated from the combustion of coal, and other forms of fuel and (iii) in-plant services, where our employees work full-time inside our customers’ facilities to provide full-service waste management solutions and consulting services (this service is managed through our SES business but reflected principally in our collection line of business). Our vertically integrated waste management operations enable us to provide customers with full management of their waste. The breadth of our service offerings, the familiarity we have with waste management practices and our use of technology give us the ability help customers reduce the amount of waste they generate, identify recycling opportunities and determine efficient and environmentally friendly means for waste collection and disposal. Through these services, we aim to help customers increase circularity and accelerate their decarbonization goals. |
| | ● | _Expanded Service Offerings and Solutions_ — We provide expanded service offerings and solutions that are not managed through our Solid Waste business including the collection of project waste, including construction debris and household or yard waste, through our Bagster® business. |
of waste processing facilities and technologies; (iii) operation of renewable natural gas plants and (iv) the development and operation of organic recycling technologies.
Our operating revenues tend to be somewhat higher in summer months, primarily due to higher construction and demolition waste volumes.
The volumes of industrial and residential waste in certain regions where we operate also tend to increase during the summer months.
Our second and third quarter revenues and results of operations typically reflect these seasonal trends.
The “Zero” in M2Z represents zero tolerance for unsafe behaviors.
The Company also remains focused on the prevention of serious injuries.
| | | include obligations to a potentially responsible party (“PRP”) that voluntarily expends site clean-up costs. Further, liability for damage to publicly-owned natural resources may also be imposed. We are subject to potential liability under CERCLA as an owner or operator of facilities at which hazardous substances have been disposed and as a generator or transporter of hazardous substances disposed of at other locations. |
Our facilities and operations are likely to be subject to these types of requirements.
From time to time, the
We understand the importance of broad stakeholder engagement in
We continue to assess the physical risks to our Company’s operations from the effects of severe weather events and use risk mitigation planning to increase our resiliency in the face of such events.
We are investing in infrastructure to withstand more severe storm events, which may afford us a competitive advantage and reinforce our reputation as a reliable service provider through continued service in the aftermath of such events.
The Company actively participates in a number of sustainability reporting programs and frameworks.
We are closely monitoring this proposed rulemaking.
Enforcement or implementation of foreign and domestic regulations can affect our ability to export recyclables.
Attention on waste in the environment has led to new international laws restricting the flow of certain recyclables.
COVID-19 placed additional financial stress on recyclers and municipalities, resulting in some recycling programs being paused or eliminated.
These changes have led to a number of states and provinces considering and several implementing EPR regulations.
While demand for recyclables generally continues to trend upwards, during the second half of 2022, we saw significant declines in commodity prices for recycled material, and we expect significant commodity price headwinds to continue into 2023, resulting from the slowdown in the global economy, which
reduced retail demand and the corresponding need for cardboard packaging to ship retail goods.
Recycling revenues attributable to yield increased $19 million and $537 million in 2022 and 2021, respectively, as compared with the prior year periods primarily from higher market prices for recycling commodities in 2021 and the first half of 2022, before the significant downturn in the second half of 2022.
For the past several years, we have been working with stakeholders to educate the public on the need to recycle properly.
An excerpt. Shown here: 40 of 114 rewritten, 40 of 102 added and 40 of 57 removed. The counts are complete. For every sentence, read Item 1. Business. in the FY2023 filing and the FY2022 filing.
Cover and table of contents
24 rewritten, 12 added, 0 removed, 67 unchanged
For the fiscal year ended December 31, [removed: 2022][added: 2023]
The aggregate market value of the voting stock held by non-affiliates of the registrant as of June 30, [removed: 2022] [added: 2023] was approximately [removed: $63.1] [added: $70.1] billion.
The number of shares of Common Stock, $0.01 par value, of the registrant outstanding as of [removed: January 31, 2023] [added: February 8, 2024] was [removed: 408,152,162] [added: 401,598,077] (excluding treasury shares of [removed: 222,130,299).][added: 228,684,384).]
| Proxy Statement for the [removed: 2023] [added: 2024] Annual Meeting of Stockholders | | Part III |
| [Item 1A.](#Item1ARiskFactors_689078) | [Risk Factors](#Item1ARiskFactors_689078) | [removed: 18] [added: 20] |
| [Item 1B.](#Item1BUnresolvedStaffComments_347325) | [Unresolved Staff Comments](#Item1BUnresolvedStaffComments_347325) | [removed: 33] [added: 35] |
| [Item 2.](#Item2Properties_696453) | [Properties](#Item2Properties_696453) | [removed: 33] [added: 36] |
| [Item 3.](#Item3LegalProceedings_313163) | [Legal Proceedings](#Item3LegalProceedings_313163) | [removed: 33] [added: 36] |
| [Item 4.](#Item4MineSafetyDisclosures_74576) | [Mine Safety Disclosures](#Item4MineSafetyDisclosures_74576) | [removed: 33] [added: 36] |
| [Item 5.](#Item5MarketforRegistrantsCommon_605372) | [Market for Registrant’s Common Equity, Related Stockholder Matters and Issuer Purchases of Equity Securities](#Item5MarketforRegistrantsCommon_605372) | [removed: 33] [added: 36] |
| [Item 6.](#Item6Reserved_994472) | [\[Reserved\]](#Item6Reserved_994472) | [removed: 35] [added: 38] |
| [Item 7.](#Item7ManagementsDiscussion_595297) | [Management’s Discussion and Analysis of Financial Condition and Results of Operations](#Item7ManagementsDiscussion_595297) | [removed: 35] [added: 38] |
| [Item 7A.](#Item7AQuantitative_14076) | [Quantitative and Qualitative Disclosures About Market Risk](#Item7AQuantitative_14076) | [removed: 65] [added: 68] |
| [Item 8.](#Item8FinancialStatements_338840) | [Financial Statements and Supplementary Data](#Item8FinancialStatements_338840) | [removed: 67] [added: 70] |
| [Item 9.](#Item9ChangesinandDisagreements_74478) | [Changes in and Disagreements with Accountants on Accounting and Financial Disclosure](#Item9ChangesinandDisagreements_74478) | [removed: 125] [added: 129] |
| [Item 9A.](#Item9AControlsandProcedures_86084) | [Controls and Procedures](#Item9AControlsandProcedures_86084) | [removed: 125] [added: 129] |
| [Item 9B.](#Item9BOtherInformation_948347) | [Other Information](#Item9BOtherInformation_948347) | [removed: 126] [added: 130] |
| [Item 10.](#Item10DirectorsExecutive_334717) | [Directors, Executive Officers and Corporate Governance](#Item10DirectorsExecutive_334717) | [removed: 126] [added: 131] |
| [Item 11.](#Item11ExecutiveCompensation_362877) | [Executive Compensation](#Item11ExecutiveCompensation_362877) | [removed: 126] [added: 131] |
| [Item 12.](#Item12SecurityOwnership_987251) | [Security Ownership of Certain Beneficial Owners and Management and Related Stockholder Matters](#Item12SecurityOwnership_987251) | [removed: 126] [added: 131] |
| [Item 13.](#Item13CertainRelationships_733675) | [Certain Relationships and Related Transactions, and Director Independence](#Item13CertainRelationships_733675) | [removed: 126] [added: 131] |
| [Item 14.](#Item14PrincipalAccounting_341161) | [Principal Accounting Fees and Services](#Item14PrincipalAccounting_341161) | [removed: 126] [added: 131] |
| [Item 15.](#Item15ExhibitsFinancial_136084) | [Exhibits](#Item15ExhibitsFinancial_136084) | [removed: 127] [added: 131] |
| [Item 16.](#Item_16_Form_10K_Summary) | [Form 10-K Summary](#Item_16_Form_10K_Summary) | [removed: 129] [added: 134] |
| [Item 1C.](#Item1Cybersecurity) | [Cybersecurity](#Item1Cybersecurity) | 35 |
| [Item 9C.](#Item9CDisclosureRegardingForeignJuris) | [Disclosure Regarding Foreign Jurisdictions that Prevent Inspections](#Item9CDisclosureRegardingForeignJuris) | 131 |
Cautionary Statement About Forward-Looking Statements
This Annual Report on Form 10-K contains certain forward-looking statements that are made subject to the safe harbor protections provided by the Private Securities Litigation Reform Act of 1995.
Forward-looking statements are often identified by the words, “will,” “may,” “should,” “continue,” “anticipate,” “believe,” “expect,” “target,” “plan,” “forecast,” “project,” “estimate,” “intend,” “commit,” “potential” and words of a similar nature and generally include statements regarding future results of operations, including revenues, earnings or cash flows; plans and objectives for the future; projections, estimates or assumptions relating to our operational or financial performance, including anticipated impacts of the Inflation Reduction Act of 2022; projections, estimates or assumptions relating to our capital expenditures; or our opinions, views or beliefs about the effects of current or future events, circumstances or performance.
You should view these statements with caution.
These statements are not guarantees of future performance, circumstances or events.
They are based on facts and circumstances known to us as of the date the statements are made, and you should not place undue reliance on any such forward-looking statements.
Forward-looking statements are subject to certain risks and uncertainties that could cause actual results to differ materially from our historical experience and our present expectations or anticipated results.
These risks and uncertainties include, but are not limited to, those described in Part I, “Item 1A.
_Risk Factors_” and elsewhere in this report and may also be described from time to time in our future reports filed with the U.S. Securities and Exchange Commission (“SEC”).
We do not undertake any obligation to update forward-looking statements to reflect events, circumstances, changes in expectations or other developments after the date of those statements.
Item 1C. Cybersecurity.
0 rewritten, 24 added, 0 removed, 0 unchanged
New section this year
Strategy, Governance and Risk Management
Our Technology Risk Program is designed to proactively identify, monitor, and mitigate technology-related risks across our digital operations and assess cybersecurity risks related to third-party vendors and suppliers.
Our Cybersecurity Program and our Technology Risk Program are led by our Chief Information Security Officer (“CISO”) a Certified Information Systems Security Professional with two decades of cybersecurity leadership.
The CISO and his team are responsible for leading enterprise-wide cybersecurity strategy, policy, standards, architecture, and processes.
The Technology Risk Oversight Committee chaired by our CISO, with members representing leadership throughout our Company, provides oversight and guidance to technology risks, including cybersecurity.
Our Company’s Cybersecurity Program is designed to align with the National Institute of Standards and Technology (“NIST”) Cybersecurity Framework and leading industry practices, and our Cybersecurity Program is integrated into our Company’s Enterprise Risk Management framework.
Internal and external experts regularly evaluate our Cybersecurity Program, and the results of those reviews are reported to senior management and our Company’s Board of Directors.
Our Incident Response Committee, which is comprised of leaders in the areas of information security, digital, legal, finance, privacy, compliance and ethics, corporate security and communications, is responsible for leading our Company’s response to cyber incidents.
Our Cybersecurity Incident Response Plan outlines the processes by which management is informed about and monitors detection and mediation of cyber incidents.
We actively engage with key vendors, industry participants, and intelligence and law enforcement communities as part of our continuing efforts to evaluate and enhance the effectiveness of our information security policies and procedures.
Risks from cybersecurity threats, including as a result of previous cybersecurity incidents encountered by the Company and known incidents encountered by third parties with a connection to the Company, have not materially affected, and are not currently viewed as reasonably likely to materially affect our Company, including our business strategy, results of operations or financial condition.
However, we are regularly the target of attempted cyber intrusions, and we anticipate continuing to be subject to such attempts.
Our security programs and measures do not prevent all intrusions.
Cyber intrusions require a significant amount of time and effort to assess and remedy, and our incident response efforts may not be effective in all cases.
Although we believe that the probability of occurrence of a significant cybersecurity incident is less than likely, if such an incident were to occur, the impact on the Company could be substantial.
See Item 1A.
_Risk Factors_ — _Significant cybersecurity incidents negatively impact our business and our relationships with customers, vendors and employees and expose us to increased liability_ for additional discussion.
Board Oversight
Management has primary responsibility for risk management within our Company.
The Company’s Board of Directors, with the support of its committees, oversees risk management to ensure that the processes designed, implemented and maintained by our executives are functioning as intended and adapted when necessary to respond to changes in our Company’s strategy as well as emerging risks.
The Audit Committee of the Company’s Board of Directors has responsibility for oversight of information and cybersecurity risks and assessment of cyber threats and defenses.
The Audit Committee receives reports on these matters from our most senior executives in the digital organization, including our Chief Information Officer and CISO, and the Company’s executive officers, at least twice a year.
Topics historically covered in such reports include third-party evaluation of our technology infrastructure and information security against the NIST cybersecurity framework; risk mitigation through the Company’s enterprise-wide cybersecurity training, including our Board of Directors, conducted at least annually; regular simulated phishing tests and third-party penetration testing; review of the Company’s cyber incident insurance coverage and external cyber incident resources; review of the Company’s Cybersecurity Incident Response Plan and consideration of applicable laws and regulations, including those related to privacy.
The Company’s Cybersecurity Incident Response Plan includes a section on Board escalation that specifies the process for notification of the Chair of the Audit Committee and the Chair of the Board of the Directors upon certain triggering events, and that group then determines the appropriate form and frequency of communication with the full Audit Committee or Board of Directors, depending on the unique characteristics of the incident.
Item 2. Properties.
3 rewritten, 7 added, 3 removed, 12 unchanged
In addition, we continue to make progress on our planned investments to expand our [removed: renewable energy] [added: Recycling Processing] and [removed: recycling businesses.][added: Sales and WM Renewable Energy segments.]
| Landfills owned or operated | | [removed: 259] [added: 263] | | [removed: 260] [added: 263] |
| Transfer stations | | [removed: 337] [added: 332] | | [removed: 340] [added: 337] |
As of December 31, 2023, we had 92 landfill gas beneficial use projects producing commercial quantities of methane gas at owned or operated landfills.
For 66 of these projects, the processed gas is used to fuel electricity generators.
The electricity is then sold to public utilities, municipal utilities or power cooperatives.
For 20 of these projects, the gas is used at the landfill or delivered by pipeline to industrial customers as a direct substitute for fossil fuels in industrial processes.
For six of these projects, the landfill gas is processed to pipeline quality RNG and then sold to natural gas suppliers.
| | | 2023 | | 2022 |
| Recycling facilities | | 102 | | 97 |
As of December 31, 2022 and 2021, we owned and operated five and four renewable natural gas facilities, respectively.
| | | 2022 | | 2021 |
| Material recovery facilities | | 97 | | 96 |
Item 5. Market for Registrant’s Common Equity, Related Stockholder Matters and Issuer Purchases of Equity Securities.
12 rewritten, 10 added, 8 removed, 14 unchanged
Our common stock is traded on the New York Stock Exchange (“NYSE”) under the symbol “WM.” The number of holders of record of our common stock on [removed: January 31, 2023] [added: February 8, 2024] was [removed: 7,847.][added: 7,489.]
[removed: ][added: 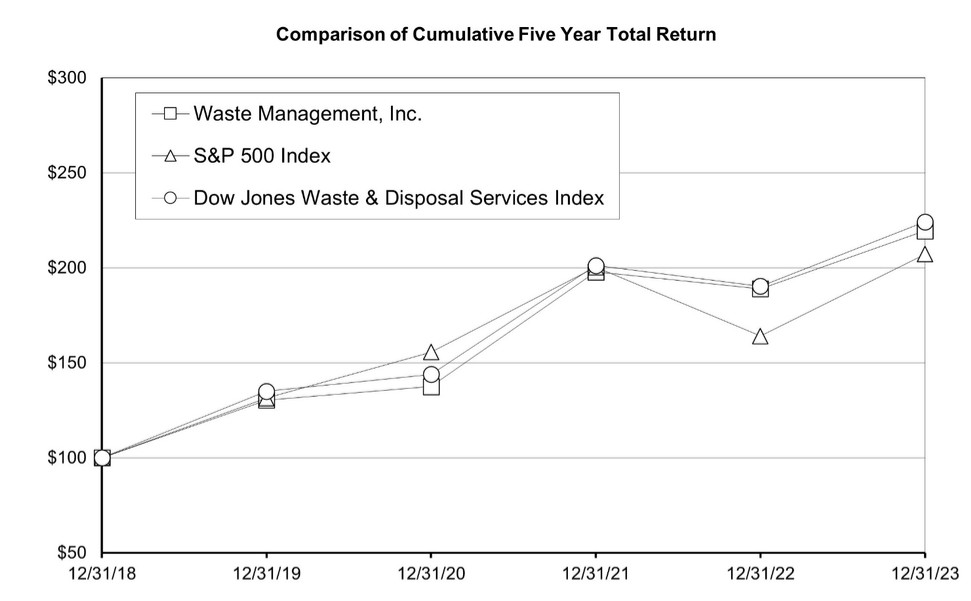]
| Dow Jones Waste & Disposal Services Index | | $ | 100 | | $ | [removed: 100] [added: 135] | | $ | [removed: 135] [added: 144] | | $ | [removed: 144] [added: 201] | | $ | [removed: 201] [added: 190] | | $ | [removed: 191] [added: 224] |
During [removed: 2022,] [added: 2023,] we [removed: repurchased] [added: allocated] an aggregate of [removed: $1.5] [added: $1.3] billion [removed: of] [added: to repurchase] our common stock under accelerated share repurchase (“ASR”) agreements and open market [removed: transactions, which equated to 9.4 million shares with a weighted average price per share of $160.32, inclusive of per-share commissions.][added: transactions.]
In [removed: addition, in December 2021,] [added: February 2024,] we [removed: executed an] [added: completed our] ASR agreement [removed: that completed] [added: executed] in [removed: January 2022,] [added: October 2023,] at which time we received [removed: 0.4] [added: 0.2] million shares.
We announced in December [removed: 2022] [added: 2023] that the Board of Directors has authorized up to $1.5 billion in future share [removed: repurchases.][added: repurchases, excluding the 1% excise tax discussed further below.]
The following table summarizes common stock repurchases made during the fourth quarter of [removed: 2022] [added: 2023] (shares in millions):
| Period | | Purchased | | per [removed: Share] [added: Share(a)] | | | Programs | | the Plans or [removed: Programs] [added: Programs(a)] | | |
| November 1 — 30 | | [removed: 2.1] [added: —] | | $ | [removed: 161.19] [added: —] | [removed: (b)] [added: ] | [removed: 2.1] [added: —] | | $ | [removed: 84] [added: 257.5] million | |
| December 1 — 31 | | [removed: 0.5] [added: —] | | $ | [removed: 161.19] [added: —] | [removed: (b)] [added: ] | [removed: 0.5] [added: —] | | $ | 1.5 billion | |
| [removed: (a)] [added: (b)] | In October [removed: 2022,] [added: 2023,] we repurchased [removed: 125,167] [added: 70,350] shares of our common stock in open market transactions in compliance with Rule 10b5-1 and Rule 10b-18 of the Exchange Act for [removed: $20] [added: $11] million, inclusive of [removed: per-share] [added: per share] commissions, at a weighted average price of [removed: $159.79.] [added: $156.35. Additionally, we repurchased $300 million of our common stock pursuant to an ASR agreement. At the beginning of the repurchase period, we delivered $300 million cash and received 1.5 million shares based on a stock price of $161.38. The ASR agreement completed in February 2024, at which time we received 0.2 million additional shares based on a final weighted average price of $175.29.] |
[removed: Any] [added: The amount of] future share repurchases [removed: will be made at the discretion] [added: executed under our Board] of [removed: management and will depend] [added: Directors’ authorization is determined in management’s discretion, based] on various [removed: factors] [added: factors,] including our net earnings, financial condition and cash required for future business plans, growth and acquisitions.
| | | 12/31/18 | | | 12/31/19 | | | 12/31/20 | | | 12/31/21 | | | 12/31/22 | | | 12/31/23 | |
| Waste Management, Inc. | | $ | 100 | | $ | 130 | | $ | 138 | | $ | 198 | | $ | 189 | | $ | 220 |
| S&P 500 Index | | $ | 100 | | $ | 131 | | $ | 156 | | $ | 200 | | $ | 164 | | $ | 207 |
Share repurchases are a part of our long-term strategy and incorporated into our overall capital allocation plan to enhance our Company’s performance, in conjunction with our other uses of capital, and to return value to stockholders in a tax-efficient manner.
As of December 31, 2023, we had received 7.8 million shares with a weighted average price per share of $158.47, exclusive of per-share commissions.
This new authorization supersedes and replaces remaining authority under the prior Board of Directors’ authorization for share repurchases announced in December 2022.
| October 1 — 31 (b) | | 1.6 | | $ | 161.15 | | 1.6 | | $ | 257.5 million | |
| Total | | 1.6 | | $ | 161.15 | | 1.6 | | | | |
| (a) | The Inflation Reduction Act of 2022, which was enacted into law on August 16, 2022, imposed a nondeductible 1% excise tax on the net value of certain stock repurchases made after December 31, 2022. We reflected the applicable excise tax in treasury stock as part of the cost basis of the stock repurchased. In the table above and footnotes below, the average price paid per share, total repurchase costs and approximate maximum dollar value of shares that may yet be purchased under the plans or programs exclude the 1% excise tax. |
| | | 12/31/17 | | | 12/31/18 | | | 12/31/19 | | | 12/31/20 | | | 12/31/21 | | | 12/31/22 | |
| Waste Management, Inc. | | $ | 100 | | $ | 105 | | $ | 137 | | $ | 145 | | $ | 208 | | $ | 199 |
| S&P 500 Index | | $ | 100 | | $ | 96 | | $ | 126 | | $ | 149 | | $ | 192 | | $ | 157 |
This new authorization replaces our prior $1.5 billion authorization that was fully utilized in 2022.
Issuer Purchases of Equity Securities
| October 1 — 31 | | 0.1 | | $ | 159.79 | (a) | 0.1 | | $ | 417 million | |
| Total | | 2.7 | | $ | 161.13 | | 2.7 | | | | |
| (b) | In November 2022, we delivered $417 million cash and received 2.1 million shares pursuant to an Accelerated Share Repurchase (“ASR”) agreement executed in late October 2022. In December 2022, we completed the ASR agreement and received 0.5 million additional shares based on a final weighted average price of $161.19. The “Average Price Paid per Share” in the table represents the final weighted average price per share paid for the ASR agreement. |
Item 8. Financial Statements and Supplementary Data.
520 rewritten, 270 added, 242 removed, 979 unchanged
| [Reports of Independent Registered Public Accounting Firm](#Report) (PCAOB ID 42) | | [removed: 68] [added: 71] |
| [Consolidated Balance Sheets as of December 31, [removed: 2022] [added: 2023] and [removed: 2021](#BALANCESHEETS_191365)] [added: 2022](#BALANCESHEETS_191365)] | | [removed: 72] [added: 75] |
| [Consolidated Statements of Operations for the Years Ended December 31, [removed: 2022, 2021] [added: 2023, 2022] and [removed: 2020](#STATEMENTSOFOPERATIONS_745891)] [added: 2021](#STATEMENTSOFOPERATIONS_745891)] | | [removed: 73] [added: 76] |
| [Consolidated Statements of Comprehensive Income for the Years Ended December 31, [removed: 2022, 2021] [added: 2023, 2022] and [removed: 2020](#COMPREHENSIVEINCOME_932746)] [added: 2021](#COMPREHENSIVEINCOME_932746)] | | [removed: 73] [added: 76] |
| [Consolidated Statements of Cash Flows for the Years Ended December 31, [removed: 2022, 2021] [added: 2023, 2022] and [removed: 2020](#CASHFLOWS_594152)] [added: 2021](#CASHFLOWS_594152)] | | [removed: 74] [added: 77] |
| [Consolidated Statements of Changes in Equity for the Years Ended December 31, [removed: 2022, 2021] [added: 2023, 2022] and [removed: 2020](#CHANGESINEQUITY_625544)] [added: 2021](#CHANGESINEQUITY_625544)] | | [removed: 75] [added: 78] |
| [Notes to Consolidated Financial Statements](#NOTESTOCONSOLIDATEDFINANCIALSTATEMENTS_4) | | [removed: 76] [added: 79] |
To the [added: Stockholders and the] Board of Directors [removed: and Stockholders] of Waste Management, Inc.
We have audited Waste Management, Inc.’s internal control over financial reporting as of December 31, [removed: 2022,] [added: 2023,] based on criteria established in Internal Control-Integrated Framework issued by the Committee of Sponsoring Organizations of the Treadway Commission (2013 framework) (the COSO criteria).
In our opinion, Waste Management, Inc. (the Company) maintained, in all material respects, effective internal control over financial reporting as of December 31, [removed: 2022,] [added: 2023,] based on the COSO criteria.
We also have audited, in accordance with the standards of the Public Company Accounting Oversight Board (United States) (PCAOB), the [removed: 2022] [added: 2023] consolidated financial statements of the Company, and our report dated February [removed: 7, 2023] [added: 13, 2024] expressed an unqualified opinion thereon.
| Houston, Texas February [removed: 7, 2023] [added: 13, 2024] | |
We have audited the accompanying consolidated balance sheets of Waste Management, Inc. (the Company) as of December 31, [removed: 2022] [added: 2023] and [removed: 2021,] [added: 2022,] the related consolidated statements of operations, comprehensive income, cash flows, and changes in equity for each of the three years in the period ended December 31, [removed: 2022,] [added: 2023,] and the related notes (collectively referred to as the “consolidated financial statements”).
In our opinion, the consolidated financial statements present fairly, in all material respects, the financial position of the Company at December 31, [removed: 2022] [added: 2023] and [removed: 2021,] [added: 2022,] and the results of its operations and its cash flows for each of the three years in the period ended December 31, [removed: 2022,] [added: 2023,] in conformity with U.S. generally accepted accounting principles.
We also have audited, in accordance with the standards of the Public Company Accounting Oversight Board (United States) (PCAOB), the Company’s internal control over financial reporting as of December 31, [removed: 2022,] [added: 2023,] based on criteria established in Internal Control-Integrated Framework issued by the Committee of Sponsoring Organizations of the Treadway Commission (2013 framework), and our report dated February [removed: 7, 2023] [added: 13, 2024] expressed an unqualified opinion thereon.
| _Description of the Matter_ | At December 31, [removed: 2022,] [added: 2023,] the Company’s landfill assets, net of accumulated depletion, totaled [removed: $7.6] [added: $7.8] billion and the associated depletion expense for [removed: 2022] [added: 2023] was [removed: $754] [added: $745] million. As discussed in Note 2 of the financial statements, the Company updates the estimates used to calculate individual landfill depletion rates at least annually, or more often if significant facts change. Landfill depletion rates are used in the computation of landfill depletion expense. Auditing landfill depletion rates and related depletion expense is complex due to the highly judgmental nature of assumptions used in estimating the rates. Significant assumptions used in the calculation of the rates include: estimated future development costs associated with the construction and retirement of the landfill, estimated remaining permitted and expansion airspace, [added: and] airspace utilization [removed: factors, and projected timing of retirement activities.] [added: factors.] |
| _How We Addressed the Matter in Our Audit_ | We obtained an understanding, evaluated the design, and tested the operating effectiveness of the Company’s controls over determining landfill depletion rates and calculating depletion expense. Our audit procedures included, among others, testing controls over: the Company’s process for evaluating and updating the significant assumptions used in the development of the landfill depletion rates, management’s review of those significant assumptions, and the mathematical accuracy of the calculation and recording of depletion expense. To test the landfill asset depletion rates, our audit procedures included, among others, assessing methodologies used by the Company and testing the significant assumptions discussed above, inclusive of the underlying data used by the Company in its development of these assumptions. We compared the significant assumptions used by management to historical trends and, when available, to comparable size landfills accepting a similar type of waste. Regarding expansion airspace, we evaluated the Company’s criteria for inclusion in remaining airspace. In addition, we considered the professional qualifications and objectivity of management’s internal engineers responsible for developing the assumptions. We involved [removed: EY’s] [added: EY] engineering specialists to assist with the evaluation of the Company’s landfill future development cost and airspace assumptions. We also tested the completeness and accuracy of the historical data utilized in the development of the landfill depletion rates. |
| _Description of the Matter_ | At December 31, [removed: 2022,] [added: 2023,] the carrying value of the Company’s landfill asset retirement obligations related to final capping, closure and post-closure costs totaled [removed: $2.7] [added: $2.9] billion. As discussed in Note 2 of the financial statements, the Company updates the estimates used to measure the asset retirement obligations annually, or more often if significant facts change. Auditing the landfill asset retirement obligation is complex due to the highly judgmental nature of the assumptions used in the measurement process. [removed: These] [added: Significant] assumptions include: estimated future costs associated with the capping, closure and post closure activities at each specific [removed: landfill;] [added: landfill,] airspace consumed to date in relation to total estimated permitted and expansion [removed: airspace;] [added: airspace] and the projected [removed: timing of retirement activities.] [added: remaining landfill life.] |
| | | [added: 2023 | | |] 2022 | | | 2021 | |
| Cash and cash equivalents | | $ | [added: 458 | | $ |] 351 | | $ | 118 |
| Accounts receivable, net of allowance for doubtful accounts of [removed: $26] [added: $30] and [removed: $25,] [added: $26,] respectively | | | [removed: 2,461] [added: 2,633] | | | [removed: 2,278] [added: 2,461] |
| Other receivables, net of allowance for doubtful accounts of [removed: $7] [added: $4] and [removed: $8,] [added: $7,] respectively | | | [removed: 291] [added: 237] | | | [removed: 268] [added: 291] |
| Parts and supplies | | | [removed: 164] [added: 173] | | | [removed: 135] [added: 164] |
| Other assets | | | [removed: 284] [added: 303] | | | [removed: 270] [added: 284] |
| Total current assets | | | [removed: 3,551] [added: 3,804] | | | [removed: 3,069] [added: 3,551] |
| Property and equipment, net of accumulated depreciation and depletion of [removed: $21,627] [added: $22,826] and [removed: $20,537,] [added: $21,627,] respectively | | | [removed: 15,719] [added: 16,968] | | | [removed: 14,419] [added: 15,719] |
| Goodwill | | | [removed: 9,323] [added: 9,254] | | | [removed: 9,028] [added: 9,323] |
| Other intangible assets, net | | | [removed: 827] [added: 759] | | | [removed: 898] [added: 827] |
| Restricted funds | | | [removed: 348] [added: 422] | | | 348 |
| Investments in unconsolidated entities | | | [removed: 578] [added: 606] | | | [removed: 432] [added: 578] |
| Other assets | | | [removed: 1,021] [added: 1,010] | | | [removed: 903] [added: 1,021] |
| Total assets | | $ | [removed: 31,367] [added: 32,823] | | $ | [removed: 29,097] [added: 31,367] |
| Accounts payable | | $ | [removed: 1,766] [added: 1,709] | | $ | [removed: 1,375] [added: 1,766] |
| Accrued liabilities | | | [removed: 1,625] [added: 1,605] | | | [removed: 1,428] [added: 1,625] |
| Deferred revenues | | | [removed: 589] [added: 578] | | | [removed: 571] [added: 589] |
| Current portion of long-term debt | | | [removed: 414] [added: 334] | | | [removed: 708] [added: 414] |
| Total current liabilities | | | [removed: 4,394] [added: 4,226] | | | [removed: 4,082] [added: 4,394] |
| Long-term debt, less current portion | | | [removed: 14,570] [added: 15,895] | | | [removed: 12,697] [added: 14,570] |
| Deferred income taxes | | | [removed: 1,733] [added: 1,826] | | | [removed: 1,694] [added: 1,733] |
| Landfill and environmental remediation liabilities | | | [removed: 2,700] [added: 2,888] | | | [removed: 2,373] [added: 2,700] |
To the Stockholders and the Board of Directors of Waste Management, Inc.
| Houston, Texas February 13, 2024 | |
| Consolidated net income | | $ | 2,276 | | $ | 2,240 | | $ | 1,817 |
| Depreciation, depletion and amortization | | | 2,071 | | | 2,038 | | | 1,999 |
| Goodwill impairment | | | 168 | | | — | | | — |
| Cash, cash equivalents and restricted cash and cash equivalents at end of period | | $ | 552 | | $ | 445 | | $ | 194 |
| Balance, December 31, 2023 | | $ | 6,896 | | 630,282 | | $ | 6 | | $ | 5,351 | | $ | 14,334 | | $ | (37) | | (228,827) | | $ | (12,751) | | $ | (7) |
To enhance transparency regarding our financial performance, highlight the strength and consistency of our core solid waste businesses, and underscore our commitment to sustainability through planned and ongoing investments in our Recycling Processing and Sales and WM Renewable Energy businesses, beginning in the fourth quarter of 2023, our senior management revised its segment reporting to (i) reflect the financial results of our collection, transfer, disposal and resource recovery services businesses independently; (ii) combine the results of all recycling facilities from our East and West Tier segments with our recycling brokerage and sales activities to form a newly created Recycling Processing and Sales reportable segment and (iii) include our WM Renewable Energy business as a reportable segment.
Accordingly, our senior management now evaluates, oversees and manages the financial performance of our business through four reportable segments, referred to as (i) Collection and Disposal - East Tier (“East Tier”); (ii) Collection and Disposal - West Tier (“West Tier”); (iii) Recycling Processing and Sales and (iv) WM Renewable Energy.
Our East and West Tier, along with certain ancillary services not managed through our tier segments, but that support our collection and disposal operations, form our “Collection and Disposal” businesses.
Refer to Note 19 for further discussion.
| | | 2023 | | | 2022 | |
Changes in such estimates associated with a fully
| (a) | Includes recycling and renewable natural gas (“RNG”) facilities as well as containers. |
Some may include renewal or purchase
Refer to Note 11 for adjustments recognized during the reported periods.
Balances maintained in these restricted funds accounts will fluctuate based on (i) changes in statutory requirements; (ii) future
| | | 2023 | | | 2022 | |
Our operations are primarily in the U.S. but we also have significant operations in Canada.
Our WM Renewable Energy revenue is primarily generated from (i) the sale of captured and converted landfill methane gas; (ii) the sale of Renewable Identification Numbers (“RINs”) under the Renewable Fuel Standard (“RFS”) program implemented by the U.S. Environmental Protection Agency (“EPA”); (iii) sale of Low Carbon Fuel credits designed to stimulate the use of low-carbon fuels and (iv) the sale of energy (electricity and capacity) and associated Renewable Energy Credits (“RECs”).
During 2023, we had $276 million of non-cash financing activities primarily from our low-income housing investment and new financing leases, which are discussed further in Notes 6 and 8.
| | | 2023 | | | | | | | | | 2022 | | | | | | | |
| | | $ | 2,853 | | $ | 209 | | $ | 3,062 | | $ | 2,664 | | $ | 204 | | $ | 2,868 |
| December 31, 2023 | | $ | 2,853 | | $ | 209 |
| | | 2023 | | | 2022 | |
| | | | 39,794 | | | 37,346 |
| (a) | As of December 31, 2023 and 2022, includes $1.5 billion and $1.1 billion, respectively, related to recycling facilities. As of December 31, 2023 and 2022, includes $720 million and $570 million, respectively, related to RNG facilities. |
As a result of a longer-than-anticipated ramp toward full scale and profitability of a business engaged in accelerating film and plastic wrap recycling capabilities, we recorded a goodwill impairment charge of $168 million, with $22 million attributable to noncontrolling interests.
This charge was partially offset by the recognition of $46 million of income related to the reversal of a liability for contingent consideration associated with our investment in such business.
We have a controlling interest in the business, and it is, therefore, consolidated in our financial statements as part of our Recycling Processing and Sales segment.
Fair value of the business was estimated using an income approach based on long-term projected discounted future cash flows of the reporting unit.
Partially offsetting the decrease in our goodwill balance was a $90 million increase in goodwill associated with acquisitions primarily within our Collection and Disposal businesses.
Prior to 2023, our recycling facilities were reflected as a component of the respective Tier segments and our recycling brokerage services were included as a component of our “Other” operations.
Reclassifications have been made to our prior period consolidated financial
information to conform to the current year presentation.
| | | | | | | | | | | | | | | | | | | |
| --- | --- | --- | --- | --- | --- | --- | --- | --- | --- | --- | --- | --- | --- | --- | --- | --- | --- | --- |
| | | | | | | | | | | | Recycling | | | | | | | |
| | | Collection and Disposal | | | | | | | | | Processing | | | | | | | |
| --- | --- | --- |
| --- | --- |
| --- | --- | --- | --- | --- | --- | --- | --- | --- | --- |
| Balance, December 31, 2019 | | $ | 7,070 | | 630,282 | | $ | 6 | | $ | 5,049 | | $ | 10,592 | | $ | (8) | | (205,956) | | $ | (8,571) | | $ | 2 |
| Adoption of new accounting standards | | | (2) | | — | | | — | | | — | | | (2) | | | — | | — | | | — | | | — |
Our senior management evaluates, oversees and manages the financial performance of our Solid Waste operations through two operating segments.
Our East Tier primarily consists of geographic areas located in the Eastern U.S., the Great Lakes region and substantially all of Canada.
Our West Tier primarily includes geographic areas located in the Western U.S., including the upper Midwest region, and British Columbia, Canada.
Each of our Solid Waste operating segments provides integrated environmental services, including collection, transfer, recycling, and disposal.
The East and West Tiers are presented in this report and constitute our existing Solid Waste business.
On October 30, 2020, we acquired Advanced Disposal Services, Inc. (“Advanced Disposal”), the operations of which are presented in this report within our existing Solid Waste tiers.
Changes in
We determine the risk-free discount rate and the inflation rate on an annual basis unless interim changes would materially impact our results of operations.
For remedial liabilities that have been discounted, we include interest accretion, based on the effective interest method, in operating expenses in our Consolidated Statements of Operations.
As of December 31, 2022, 2021 and 2020, we inflated the costs by 2.50%, 2.25% and 2.25%, respectively, and discounted the costs by 3.75%, 1.50% and 1.00%, respectively.
Our discount rate has increased since 2020 as a result of the overall increase in the 10-year Treasury rates.
The following table summarizes the impacts of revisions in the risk-free discount rate applied to our environmental remediation liabilities and recovery assets for the year ended December 31 (in millions) and the risk-free discount rate applied as of December 31:
| | | | | | | | | | | |
| --- | --- | --- | --- | --- | --- | --- | --- | --- | --- | --- |
| Increase (decrease) in operating expenses | | $ | (14) | | $ | (4) | | $ | 8 | |
| Risk-free discount rate applied to environmental remediation liabilities and recovery assets | | | 3.75 | % | | 1.50 | % | | 1.00 | % |
The portion of our recorded environmental remediation liabilities that were not subject to inflation or discounting, as the amounts and timing of payments are not fixed or reliably determinable, was $31 million as of December 31, 2022 and 2021.
Had we not inflated and discounted any portion of our environmental remediation liability, the amount recorded would have increased by $10 million and decreased by $6 million as of December 31, 2022 and 2021, respectively.
may initially deny the expansion application although the expansion permit is ultimately granted.
the insurance captive, and are allocated between current and long-term assets depending on estimated timing of the use of funds.
We also provide additional services that are not managed through our Solid Waste business, including our Strategic Business Solutions (“WMSBS”) and sustainability businesses, which include landfill gas-to-energy services, Sustainability and Environmental Solutions (“SES”) business and recycling brokerage services.
We also offer certain other expanded service offerings and solutions.
the timing of when we expect to recognize amortization and are included in other assets in our Consolidated Balance Sheets.
of the potential loss or range of loss associated with such contingencies.
Internal-Use Software
We include capitalized costs associated with developing or obtaining internal-use software within long-term other assets, and these costs are amortized over the term of the relevant subscription period including any renewal options that are reasonably certain of being exercised.
These costs include direct external costs of materials and services used in developing or obtaining the software and internal costs for employees directly associated with the software development project.
As of December 31, 2022 and 2021, total costs capitalized for our internal-use software were $45 million and $48 million, respectively, net of accumulated amortization of $27 million and $11 million, respectively.
During each of the years ended December 31, 2022, 2021 and 2020, we amortized $16 million, $10 million and $1 million, respectively, to selling, general and administrative expense.
During 2020, we had $50 million of non-cash financing activities primarily related to new financing leases, a portion of which were attributed to our acquisition of Advanced Disposal.
| | | $ | 2,664 | | $ | 204 | | $ | 2,868 | | $ | 2,326 | | $ | 213 | | $ | 2,539 |
| December 31, 2021 | | $ | 2,326 | | $ | 213 |
| (a) | In 2021, the increase in our landfill liabilities for revisions in estimates and interest rate assumptions was $33 million. The increase in our landfill liabilities in 2022 is primarily due to inflationary cost pressures that are expected to impact costs over the remaining landfill lives. |
Anticipated payments of currently identified environmental remediation liabilities, as measured in current dollars, are $31 million in 2023, $43 million in 2024, $29 million in 2025, $19 million in 2026, $16 million in 2027 and $76 million thereafter.
| | | | 37,346 | | | 34,956 |
An excerpt. Shown here: 40 of 520 rewritten, 40 of 270 added and 40 of 242 removed. The counts are complete. For every sentence, read Item 8. Financial Statements and Supplementary Data. in the FY2023 filing and the FY2022 filing.
Item 9A. Controls and Procedures.
4 rewritten, 1 added, 3 removed, 16 unchanged
Based on such evaluation, our principal executive and financial officers have concluded that such disclosure controls and procedures were effective as of December 31, [removed: 2022] [added: 2023] (the end of the period covered by this Annual Report on Form 10-K) at a reasonable assurance level.
Management of the Company assessed the effectiveness of our internal control over financial reporting as of December 31, [removed: 2022] [added: 2023] based on the 2013 framework in Internal Control—Integrated Framework issued by the Committee of Sponsoring Organizations of the Treadway Commission (the COSO criteria).
Based on this assessment, management has concluded that our internal control over financial reporting was effective as of December 31, [removed: 2022.][added: 2023.]
[removed: While these systems implementations enhance our framework for internal control over financial reporting, management, together with our CEO and CFO, has] [added: We] determined that [removed: the] [added: there were no] changes in our internal [removed: controls] [added: control] over financial reporting during the quarter ended December 31, [removed: 2022] [added: 2023 that] have [removed: not been material and] [added: materially affected, or] are [removed: not] reasonably likely to materially [removed: affect] [added: affect,] our internal [removed: controls] [added: control] over financial reporting.
Management, together with our CEO and CFO, evaluated the changes in our internal control over financial reporting during the quarter ended December 31, 2023.
In 2022, we implemented a new general ledger accounting system, complementary finance enterprise resource planning system and a human capital management system.
These new system implementations were achieved after a multi-year review of existing accounting, reporting and human capital processes and the design and configuration of system-enabled enhancements to such processes.
The changes in our general ledger, finance enterprise resource planning and human capital management systems were subject to thorough testing and review by internal and external parties both before and after implementation.
Item 9B. Other Information.
0 rewritten, 19 added, 2 removed, 0 unchanged
Securities Trading Plans of Directors and Executive Officers
On October 30, 2023, James C.
Fish, Jr., President, Chief Executive Officer and member of our Board of Directors, adopted a stock trading plan (the “Fish Trading Plan”).
The Fish Trading Plan went into effect on the date of adoption and was not intended to satisfy the affirmative defense of Rule 10b5-1(c) under the Exchange Act.
The Fish Trading Plan provided for the potential exercise of 83,419 vested stock options and instructed that, upon our common stock reaching a specified market price on or before December 7, 2023, the options would automatically be exercised and the Company would withhold shares of common stock necessary to cover tax requirements and the exercise price of such options.
The Fish Trading Plan provided that Mr. Fish would continue to hold all remaining shares of common stock resulting from the option exercise after the net share settlement process.
On November 21, 2023, Mr. Rafael Carrasco, Senior Vice President, Enterprise Strategy, adopted a stock trading plan (the “Carrasco Trading Plan”) intended to satisfy the affirmative defense of Rule 10b5-1(c) under the Exchange Act.
The Carrasco Trading Plan will commence on February 20, 2024 and will automatically terminate on the earlier of February 20, 2025 and the completion of all of the contemplated transactions set forth therein.
The Carrasco Trading Plan provides for the potential cashless exercise of two stock option awards totaling 4,207 stock options, upon our common stock reaching a specified market price, pursuant to which shares of common stock will be sold to cover option costs, tax obligations, commissions and fees; Mr. Carrasco will then continue to hold all remaining shares of common stock resulting from the option exercise after the settlement.
On November 21, 2023, Ms. Devina Rankin, Executive Vice President and Chief Financial Officer, adopted a stock trading plan (the “Rankin Trading Plan”) intended to satisfy the affirmative defense of Rule 10b5-1(c) under the Exchange Act.
The Rankin Trading Plan will commence on February 20, 2024 and will automatically terminate on the earlier of February 20, 2025 and the completion of all of the contemplated transactions set forth therein.
The Rankin Trading Plan provides for the potential sale of 50% of net after-tax shares of our common stock received from the payout of performance share unit (“PSU”) equity compensation awards, for the performance period ended December 31, 2023, upon our common stock reaching a specified market price.
Ms. Rankin received a target grant of 14,736 PSU awards with a performance period ended December 31, 2023; the number of shares to be paid out to Ms. Rankin on account of these PSU awards can range from zero to 200% of the initial target grant.
As a result, the number of shares of common stock to potentially be sold pursuant to the Rankin Trading Plan will be determined in the first quarter of 2024 based on certification by the Management Development and Compensation Committee of the Board of Directors of the Company’s achievement relative to applicable performance measures for the underlying PSU awards.
On December 1, 2023, Mr. Fish adopted a stock trading plan (the “Second Fish Trading Plan”) intended to satisfy the affirmative defense of Rule 10b5-1(c) under the Exchange Act.
The Second Fish Trading Plan will commence on March 1, 2024 and will automatically terminate on the earlier of February 20, 2025 and the completion of all of the contemplated transactions set forth therein.
The Second Fish Trading Plan provides for (a) the potential sale of up to 19,100 shares of our common stock upon our common stock reaching specified market prices and (b) the potential sale of 50% of net after-tax shares of our common stock received from the payout of PSU equity compensation awards for the performance period ended December 31, 2023, upon our common stock reaching a specified market price.
Mr. Fish received a target grant of 59,650 PSU awards with a performance period ended December 31, 2023; the number of shares to be paid out to Mr. Fish on account of these PSU awards can range from zero to 200% of the initial target grant.
As a result, as described above in connection with the Rankin Trading Plan, the number of shares of common stock to potentially be sold pursuant to the Second Fish Trading Plan will be determined in the first quarter of 2024.
None.
PART III
Item 9C. Disclosure Regarding Foreign Jurisdictions that Prevent Inspections.
0 rewritten, 2 added, 0 removed, 0 unchanged
New section this year
Not applicable.
PART III
Item 10. Directors, Executive Officers and Corporate Governance.
0 rewritten, 3 added, 3 removed, 1 unchanged
The code of ethics, entitled “Code of Conduct,” is available on-line at investors.wm.com in the tab “ESG — Corporate Governance” (https://investors.wm.com/esg-practices/governance).
We intend to post any amendments to the Code of Conduct that apply to our officers and directors, and any required disclosure of waivers from the Code of Conduct, to the “ESG – Corporate Governance” tab at investors.wm.com.
All other information required by this Item will be included in the Company’s definitive proxy statement for its 2024 Annual Meeting of Stockholders (the “2024 Proxy Statement”) to be filed with SEC within 120 days of the end of our fiscal year and is incorporated herein by reference.
The information required by this Item is incorporated by reference to the sections entitled “Board of Directors,” “Election of Directors” and “Executive Officers” in the Company’s definitive Proxy Statement for its 2023 Annual Meeting of Stockholders (the “Proxy Statement”), to be held May 9, 2023.
The Proxy Statement will be filed with the SEC within 120 days of the end of our fiscal year.
The code of ethics, entitled “Code of Conduct,” is posted on our website at www.wm.com in the section “ESG — Corporate Governance” on the “Investors” page.
Item 11. Executive Compensation.
0 rewritten, 1 added, 1 removed, 0 unchanged
The information required by this Item will be included in the 2024 Proxy Statement and is incorporated herein by reference.
The information required by this Item is incorporated herein by reference to the sections entitled “Board of Directors — Compensation Committee Report,” “— Compensation Committee Interlocks and Insider Participation,” “— Non-Employee Director Compensation,” “Executive Compensation — Compensation Discussion and Analysis,” “— Executive Compensation Tables” and “— Pay Versus Performance” in the Proxy Statement.
Item 12. Security Ownership of Certain Beneficial Owners and Management and Related Stockholder Matters.
0 rewritten, 1 added, 1 removed, 0 unchanged
The information required by this Item will be included in the 2024 Proxy Statement and is incorporated herein by reference.
The information required by this Item is incorporated herein by reference to the sections entitled “Executive Compensation — Executive Compensation Tables — Equity Compensation Plan Table,” “Director and Officer Stock Ownership,” and “Security Ownership of Certain Beneficial Owners” in the Proxy Statement.
Item 13. Certain Relationships and Related Transactions, and Director Independence.
0 rewritten, 1 added, 1 removed, 0 unchanged
The information required by this Item will be included in the 2024 Proxy Statement and is incorporated herein by reference.
The information required by this Item is incorporated herein by reference to the sections entitled “Board of Directors — Related Party Transactions” and “— Independence of Board Members” in the Proxy Statement.
Item 14. Principal Accounting Fees and Services.
0 rewritten, 1 added, 1 removed, 1 unchanged
The information required by this Item will be included in the 2024 Proxy Statement and is incorporated herein by reference.
The information required by this Item is incorporated herein by reference to the section entitled “Ratification of Independent Registered Public Accounting Firm — Independent Registered Public Accounting Firm Fee Information” in the Proxy Statement.
Item 15. Exhibits, Financial Statement Schedules.
38 rewritten, 5 added, 1 removed, 27 unchanged
Consolidated Balance Sheets as of December 31, [removed: 2022] [added: 2023] and [removed: 2021][added: 2022]
Consolidated Statements of Operations for the years ended December 31, [removed: 2022, 2021] [added: 2023, 2022] and [removed: 2020][added: 2021]
Consolidated Statements of Comprehensive Income for the years ended December 31, [removed: 2022, 2021] [added: 2023, 2022] and [removed: 2020][added: 2021]
Consolidated Statements of Cash Flows for the years ended December 31, [removed: 2022, 2021] [added: 2023, 2022] and [removed: 2020][added: 2021]
Consolidated Statements of Changes in Equity for the years ended December 31, [removed: 2022, 2021] [added: 2023, 2022] and [removed: 2020][added: 2021]
| 3.2 | — | [Amended and Restated By-laws of Waste Management, Inc. \[incorporated by reference to Exhibit 3.2 to Form 8-K dated November [removed: 8, 2022\].](https://www.sec.gov/Archives/edgar/data/823768/000110465922117214/tm2230189d1_ex3-2.htm)] [added: 6, 2023\].](https://www.sec.gov/Archives/edgar/data/823768/000110465923115047/tm2329883d1_ex3-2.htm)] |
| 4.7* | — | [Schedule of Officers’ Certificates delivered pursuant to Section 301 of the Indenture dated September 10, 1997 establishing the terms and form of Waste Management, Inc.’s Senior Notes. Waste Management and its subsidiaries are parties to debt instruments that have not been filed with the SEC under which the total amount of securities authorized under any single instrument does not exceed 10% of the total assets of Waste Management and its subsidiaries on a consolidated basis. Pursuant to paragraph 4(iii)(A) of Item 601(b) of Regulation S-K, Waste Management agrees to furnish a copy of such instruments to the SEC upon [removed: request.](https://www.sec.gov/Archives/edgar/data/823768/000155837023000964/wm-20221231xex4d7.htm)] [added: request.](https://www.sec.gov/Archives/edgar/data/823768/000155837024001049/wm-20231231xex4d7.htm)] |
| 4.8 | — | [Officers’ Certificate delivered pursuant to Section 301 of the Indenture dated September 10, 1997 establishing the terms and form of the [removed: 4.15%] [added: 4.875%] Senior Notes due [removed: 2032] [added: 2029] \[incorporated by reference to Exhibit 4.1 to Form 10-Q for the quarter ended [removed: June] [added: September] 30, [removed: 2022\].](https://www.sec.gov/Archives/edgar/data/823768/000155837022011119/wm-20220630xex4d1.htm)] [added: 2023\].](https://www.sec.gov/Archives/edgar/data/823768/000155837023016700/wm-20230930xex4d1.htm)] |
| 4.9 | — | [Guarantee Agreement by Waste Management Holdings, Inc. in favor of The Bank of New York Mellon Trust Company, N.A., as Trustee for the holders of the [removed: 4.15%] [added: 4.875%] Senior Notes due [removed: 2032] [added: 2029] \[incorporated by reference to Exhibit [removed: 4.2] [added: 4.3] to Form 10-Q for the quarter ended [removed: June] [added: September] 30, [removed: 2022\].](https://www.sec.gov/Archives/edgar/data/823768/000155837022011119/wm-20220630xex4d2.htm)] [added: 2023\].](https://www.sec.gov/Archives/edgar/data/823768/000155837023016700/wm-20230930xex4d3.htm)] |
| [removed: 10.1†] [added: 10.2†] | — | [2014 Stock Incentive Plan \[incorporated by reference to Exhibit 10.1 to Form 8-K dated May 13, 2014\].](http://www.sec.gov/Archives/edgar/data/823768/000119312514200494/d726417dex101.htm) |
| [removed: 10.2†] [added: 10.3†] | — | [First Amendment to 2014 Stock Incentive Plan \[incorporated by reference to Exhibit 10.2 to Form 8-K dated May 12, 2020\].](https://www.sec.gov/Archives/edgar/data/823768/000110465920062449/tm2018602d2_ex10-2.htm) |
| [removed: 10.3†] [added: 10.4†] | — | [Second Amendment to 2014 Stock Incentive Plan \[incorporated by reference to Exhibit 10.3 to Form 10-Q for the quarter ended June 30, 2022\].](https://www.sec.gov/Archives/edgar/data/823768/000155837022011119/wm-20220630xex10d3.htm) |
| [removed: 10.4†] [added: 10.5†] | — | [2009 Stock Incentive Plan \[incorporated by reference to Appendix B to the Proxy Statement on Schedule 14A filed March 25, 2009\].](https://www.sec.gov/Archives/edgar/data/823768/000119312509062520/ddef14a.htm) |
| [removed: 10.5†] [added: 10.6†] | — | [2005 Annual Incentive Plan \[incorporated by reference to Appendix D to the Proxy Statement on Schedule 14A filed April 8, 2004\].](https://www.sec.gov/Archives/edgar/data/823768/000119312504059008/ddef14a.htm) |
| [removed: 10.6†] [added: 10.7†] | — | [Waste Management, Inc. Employee Stock Purchase Plan (As Amended and Restated effective May 12, 2020) \[incorporated by reference to Exhibit 10.1 to Form 8-K dated May 12, 2020\].](https://www.sec.gov/Archives/edgar/data/823768/000110465920062449/tm2018602d2_ex10-1.htm) |
| [removed: 10.7†] [added: 10.9†] | — | [Waste Management, Inc. 409A Deferral Savings Plan as Amended and Restated effective January 1, 2014 \[incorporated by reference to Exhibit 10.2 to Form 10-Q for the quarter ended March 31, 2014\].](http://www.sec.gov/Archives/edgar/data/823768/000119312514156430/d690567dex102.htm) |
| [removed: 10.8] [added: 10.10] | — | [$3.5 Billion Sixth Amended and Restated Revolving Credit Agreement dated as of May 27, 2022 by and among Waste Management, Inc., Waste Management of Canada Corporation, WM Quebec Inc. and Waste Management Holdings, Inc., certain banks party thereto, and Bank of America, N.A., as administrative agent \[incorporated by reference to Exhibit 10.1 to Form 8-K dated May 27, 2022\].](https://www.sec.gov/Archives/edgar/data/823768/000110465922067600/tm2217217d1_ex10-1.htm) |
| [removed: 10.10] [added: 10.11] | — | [Commercial Paper Dealer Agreement, substantially in the form as executed with each of Mizuho Securities USA LLC, BofA Securities, Inc., J.P. Morgan Securities LLC, MUFG Securities Americas Inc., Wells Fargo Securities, LLC, RBC Capital Markets, [removed: LLC and] [added: LLC,] Siebert Williams Shank & Co., [removed: LLC] [added: LLC, and Barclays Capital Inc.] as Dealer \[incorporated by reference to Exhibit 10.11 to Form 10-K for the year ended December 31, 2016\].](https://www.sec.gov/Archives/edgar/data/823768/000119312517046480/d252547dex1011.htm) |
| [removed: 10.11*] [added: 10.12] | — | [Commercial Paper Issuing and Paying Agent Agreement between Waste Management, Inc. and U.S. Bank Trust Company, National Association dated October 28, [removed: 2022.](https://www.sec.gov/Archives/edgar/data/823768/000155837023000964/wm-20221231xex10d11.htm)] [added: 2022. \[incorporated by reference to Exhibit 10.11 to Form 10-K for the year ended December 31, 2022\].](https://www.sec.gov/Archives/edgar/data/823768/000155837023000964/wm-20221231xex10d11.htm)] |
| [removed: 10.12†] [added: 10.13†] | — | [First Amended and Restated Employment Agreement between USA Waste-Management Resources, LLC and James C. Fish, Jr. dated December 22, 2017 \[incorporated by reference to Exhibit 10.2 to Form 8-K dated December 22, 2017\].](http://www.sec.gov/Archives/edgar/data/823768/000110465917075030/a17-28786_1ex10d2.htm) |
| [removed: 10.13†] [added: 10.16†] | — | [Employment Agreement between USA Waste-Management Resources, LLC and Devina A. Rankin dated December 22, 2017 \[incorporated by reference to Exhibit 10.3 to Form 8-K dated December 22, 2017\].](http://www.sec.gov/Archives/edgar/data/823768/000110465917075030/a17-28786_1ex10d3.htm) |
| [removed: 10.14†] [added: 10.17†] | — | [First Amended and Restated Employment Agreement between USA Waste-Management Resources, LLC and John J. Morris, Jr. \[incorporated by reference to Exhibit 10.4 to Form 8-K dated December 22, 2017\].](http://www.sec.gov/Archives/edgar/data/823768/000110465917075030/a17-28786_1ex10d4.htm) |
| [removed: 10.15†] [added: 10.18†] | — | [Employment Agreement between USA Waste-Management Resources, LLC and Charles C. Boettcher dated December 22, 2017 \[incorporated by reference to Exhibit 10.23 to Form 10-K for the year ended December 31, 2017\].](http://www.sec.gov/Archives/edgar/data/823768/000155837018000716/wm-20171231ex10236fa05.htm) |
| [removed: 10.16†] [added: 10.19†] | — | [Form of Director and Executive Officer Indemnity Agreement \[incorporated by reference to Exhibit 10.43 to Form 10-K for the year ended December 31, 2012\].](http://www.sec.gov/Archives/edgar/data/823768/000119312513058892/d413187dex1043.htm) |
| [removed: 10.17†] [added: 10.20†] | — | [Waste Management Holdings, Inc. Executive Severance Plan \[incorporated by reference to Exhibit 10.1 to Form 8-K dated December 22, 2017\].](http://www.sec.gov/Archives/edgar/data/823768/000110465917075030/a17-28786_1ex10d1.htm) |
| [removed: 10.18†] [added: 10.21†] | — | [Form of [removed: 2020] [added: 2021] Long Term Incentive Compensation Award Agreement for Senior Leadership Team \[incorporated by reference to Exhibit 10.1 to Form 8-K dated February [removed: 19, 2020\].](https://www.sec.gov/Archives/edgar/data/823768/000110465920024590/tm207498d2_ex10-1.htm)] [added: 23, 2021\].](https://www.sec.gov/Archives/edgar/data/0000823768/000110465921029723/tm216945d2_ex10-1.htm)] |
| [removed: 10.19†] [added: 10.23†] | — | [Form of [removed: 2021] [added: 2022] Long Term Incentive Compensation Award Agreement for Senior Leadership Team \[incorporated by reference to Exhibit 10.1 to Form 8-K dated [removed: February 23, 2021\].](https://www.sec.gov/Archives/edgar/data/0000823768/000110465921029723/tm216945d2_ex10-1.htm)] [added: March 1, 2022\].](https://www.sec.gov/Archives/edgar/data/823768/000110465922030973/tm228341d1_ex10-1.htm)] |
| [removed: 10.20†] [added: 10.22†] | — | [Form of 2021 Long Term Incentive Compensation RSU Award Agreement \[incorporated by reference to Exhibit 10.19 to Form 10-K for the year ended December 31, 2021\].](https://www.sec.gov/Archives/edgar/data/823768/000155837022001179/wm-20211231xex10d19.htm) |
| [removed: 10.21†] [added: 10.25†] | — | [Form of [removed: 2022] [added: 2023] Long Term Incentive Compensation Award Agreement for Senior Leadership Team \[incorporated by reference to Exhibit 10.1 to Form 8-K dated March [removed: 1, 2022\].](https://www.sec.gov/Archives/edgar/data/823768/000110465922030973/tm228341d1_ex10-1.htm)] [added: 7, 2023\].](https://www.sec.gov/Archives/edgar/data/823768/000110465923030666/tm238966d1_ex10-1.htm)] |
| [removed: 10.22†] [added: 10.24†] | — | [Form of 2022 Long Term Incentive Compensation RSU Award Agreement \[incorporated by reference to Exhibit 10.2 to Form 8-K dated March 1, 2022\].](https://www.sec.gov/Archives/edgar/data/823768/000110465922030973/tm228341d1_ex10-2.htm) |
| 21.1* | — | [Subsidiaries of the [removed: Registrant.](https://www.sec.gov/Archives/edgar/data/823768/000155837023000964/wm-20221231xex21d1.htm)] [added: Registrant.](https://www.sec.gov/Archives/edgar/data/823768/000155837024001049/wm-20231231xex21d1.htm)] |
| 22.1* | — | [Guarantor [removed: Subsidiary.](https://www.sec.gov/Archives/edgar/data/823768/000155837023000964/wm-20221231xex22d1.htm)] [added: Subsidiary.](https://www.sec.gov/Archives/edgar/data/823768/000155837024001049/wm-20231231xex22d1.htm)] |
| 23.1* | — | [Consent of Independent Registered Public Accounting [removed: Firm.](https://www.sec.gov/Archives/edgar/data/823768/000155837023000964/wm-20221231xex23d1.htm)] [added: Firm.](https://www.sec.gov/Archives/edgar/data/823768/000155837024001049/wm-20231231xex23d1.htm)] |
| 31.1* | — | [Certification Pursuant to Rules 13a-14(a) and 15d-14(a) under the Securities Exchange Act of 1934 of James C. Fish, Jr., President and Chief Executive [removed: Officer.](https://www.sec.gov/Archives/edgar/data/823768/000155837023000964/wm-20221231xex31d1.htm)] [added: Officer.](https://www.sec.gov/Archives/edgar/data/823768/000155837024001049/wm-20231231xex31d1.htm)] |
| 31.2* | — | [Certification Pursuant to Rules 13a-14(a) and 15d-14(a) under the Securities Exchange Act of 1934 of Devina A. Rankin, Executive Vice President and Chief Financial [removed: Officer.](https://www.sec.gov/Archives/edgar/data/823768/000155837023000964/wm-20221231xex31d2.htm)] [added: Officer.](https://www.sec.gov/Archives/edgar/data/823768/000155837024001049/wm-20231231xex31d2.htm)] |
| 32.1 | — | [Certification Pursuant to 18 U.S.C. §1350 of James C. Fish, Jr., President and Chief Executive [removed: Officer.](https://www.sec.gov/Archives/edgar/data/823768/000155837023000964/wm-20221231xex32d1.htm)] [added: Officer.](https://www.sec.gov/Archives/edgar/data/823768/000155837024001049/wm-20231231xex32d1.htm)] |
| 32.2 | — | [Certification Pursuant to 18 U.S.C. §1350 of Devina A. Rankin, Executive Vice President and Chief Financial [removed: Officer.](https://www.sec.gov/Archives/edgar/data/823768/000155837023000964/wm-20221231xex32d2.htm)] [added: Officer.](https://www.sec.gov/Archives/edgar/data/823768/000155837024001049/wm-20231231xex32d2.htm)] |
| 95* | — | [Mine Safety [removed: Disclosures.](https://www.sec.gov/Archives/edgar/data/823768/000155837023000964/wm-20221231xex95.htm)] [added: Disclosures.](https://www.sec.gov/Archives/edgar/data/823768/000155837024001049/wm-20231231xex95.htm)] |
| 10.1† | — | [2023 Stock Incentive Plan \[incorporated by reference to Exhibit 10.1 to Form 8-K dated May 9, 2023\].](https://www.sec.gov/Archives/edgar/data/823768/000110465923058503/tm2315236d1_ex10-1.htm) |
| 10.8†* | — | [First Amendment to the Waste Management, Inc. Employee Stock Purchase Plan.](https://www.sec.gov/Archives/edgar/data/823768/000155837024001049/wm-20231231xex10d8.htm) |
| 10.14†* | — | [Compensation Relinquishment Agreement between USA Waste-Management Resources, LLC and James C. Fish, Jr.](https://www.sec.gov/Archives/edgar/data/823768/000155837024001049/wm-20231231xex10d14.htm) |
| 10.15†* | — | [First Amendment to Compensation Relinquishment Agreement between USA Waste-Management Resources, LLC and James C. Fish, Jr.](https://www.sec.gov/Archives/edgar/data/823768/000155837024001049/wm-20231231xex10d15.htm) |
| 97* | — | [Waste Management, Inc. Clawback Policy](https://www.sec.gov/Archives/edgar/data/823768/000155837024001049/wm-20231231xex97.htm). |
| 10.9 | — | [$1.0 Billion Term Loan Credit Agreement dated as of May 27, 2022 by and among Waste Management, Inc., Waste Management Holdings, Inc., certain banks party thereto, and Bank of America, N.A., as administrative agent \[incorporated by reference to Exhibit 10.2 to Form 8-K dated May 27, 2022\].](https://www.sec.gov/Archives/edgar/data/823768/000110465922067600/tm2217217d1_ex10-2.htm) |
Item 16. Form 10-K Summary.
12 rewritten, 2 added, 2 removed, 37 unchanged
Date: February [removed: 7, 2023][added: 13, 2024]
| /s/ JAMES C. FISH, JR. | | President, Chief Executive Officer and Director | | February [removed: 7, 2023] [added: 13, 2024] |
| /s/ DEVINA A. RANKIN | | Executive Vice President and | | February [removed: 7, 2023] [added: 13, 2024] |
| /s/ [removed: LESLIE K. NAGY] [added: JOHN CARROLL] | | Vice President and Chief Accounting Officer | | February [removed: 7, 2023] [added: 13, 2024] |
| [removed: Leslie K. Nagy] [added: John Carroll] | | (Principal Accounting Officer) | | |
| /s/ ANDRÉS R. GLUSKI | | Director | | February [removed: 7, 2023] [added: 13, 2024] |
| /s/ VICTORIA M. HOLT | | Director | | February [removed: 7, 2023] [added: 13, 2024] |
| /s/ KATHLEEN M. MAZZARELLA | | [added: Chairman of the Board and] Director | | February [removed: 7, 2023] [added: 13, 2024] |
| /s/ SEAN E. MENKE | | Director | | February [removed: 7, 2023] [added: 13, 2024] |
| /s/ WILLIAM B. PLUMMER | | Director | | February [removed: 7, 2023] [added: 13, 2024] |
| /s/ JOHN C. POPE | | Director | | February [removed: 7, 2023] [added: 13, 2024] |
| /s/ MARYROSE T. SYLVESTER | | Director | | February [removed: 7, 2023] [added: 13, 2024] |
| /s/ BRUCE E. CHINN | | Director | | February 13, 2024 |
| Bruce E. Chinn | | | | |
| /s/ THOMAS H. WEIDEMEYER | | Chairman of the Board and Director | | February 7, 2023 |
| Thomas H. Weidemeyer | | | | |